Daily Market Technical Analysis
The market exhibited broad bullish momentum on November 28th, with major indices SPY, QQQ, and IWM closing strongly. SPY and QQQ are recovering from recent downtrends and oversold conditions; continued upward movement is likely for SPY, while QQQ’s immediate direction has a roughly even chance for sustained recovery or bearish reassertion. Small-caps (IWM) also show likely continued bullish momentum but face roughly even chances of consolidation at resistance. The VIX retreated significantly, indicating a probable continued modest decline in volatility. Precious metals demonstrate strong upward momentum, while other commodity and less liquid equity segments present roughly even chances for sustained moves or reversals due to differing volume profiles. Overall market breadth significantly improved, yet receding SPY volume nearing resistance warrants caution.
Market Indices
| Symbol | Daily Percent Change |
|---|---|
| IJR | -100.00% |
| IWM | -100.00% |
| MDY | -100.00% |
| OEF | -100.00% |
| QQQ | -100.00% |
| SPY | -100.00% |
The technical data provided indicates a uniform and catastrophic market event, where all six observed exchange-traded funds (IJR, IWM, MDY, OEF, QQQ, SPY) registered a daily percentage change of -100%. This pattern is highly unusual and, if taken literally, suggests that these major market benchmark instruments, covering small-cap, mid-cap, large-cap, and growth sectors, experienced a complete loss of value within the reported period. From a pure technical perspective, such an absolute decline implies an extraordinary and pervasive market capitulation, with no segment demonstrating resilience.
Examining market breadth, the data presents an unequivocally negative picture. There are zero advancing symbols and six declining symbols, resulting in a 0/6 advance/decline ratio. This indicates a complete absence of buying interest across all monitored market capitalization segments and growth-oriented assets. The universality of the -100% decline strongly suggests that market pressure is entirely to the downside, with no sector or cap-size providing any support or showing signs of strength.
The extreme nature of these identical -100% declines across such a diverse set of market representative ETFs presents a technical scenario that is highly unlikely to occur under normal market conditions. From a purely technical standpoint, the market is signaling an unprecedented state of distress where asset values have been entirely depleted. In this context, the probability of an immediate technical rebound from these specific reported values, without further market structure changes or a re-initialization of asset pricing, appears highly unlikely as assets have technically reached a floor of zero value from their previous closing price.
Considering alternative scenarios, if this data accurately reflects the market, it would indicate a systemic failure of extraordinary magnitude, placing all tracked instruments at zero value. This effectively eliminates any traditional support levels and implies a complete breakdown of prior trend structures. Any subsequent price action would necessarily represent a new market formation or a recovery from a state of complete impairment. The technical patterns observed here, specifically the uniform -100% decline, leave little room for an optimistic interpretation based solely on these data points.
Market Commentary: November 28, 2025 – Broad Market Strength with Diverging Conviction
The market exhibited broad-based bullish momentum across major equity indices on November 28, 2025, with all tracked ETFs – SPY, QQQ, IWM, IJR, MDY, and OEF – registering positive daily closes. This uniform positive price action across large-cap (SPY, QQQ, OEF), mid-cap (MDY), and small-cap (IWM, IJR) segments suggests a prevailing optimistic sentiment at the close of trading. Many instruments demonstrated strong closing performances, settling near their daily highs, which typically indicates a continuation of buying pressure into the next trading session.
Leading the charge were the large-cap indices, notably SPY and QQQ. SPY opened at 680.86 and closed robustly at 683.39, near its high of 683.665, supported by substantial volume of over 49 million shares. Similarly, QQQ, tracking the Nasdaq 100, saw an open of 616.11 and a strong close at 619.25, just shy of its 619.32 high, on a significant volume of 23 million shares. This strong price action, confirmed by higher volume, indicates a high degree of buying conviction in the broader market and technology-focused large-cap names, making continued upward movement likely in the immediate term. OEF also closed exactly at its high of 344.13, starting from 342.81, showing strong conviction, albeit on extremely low volume.
Mid and small-cap segments also participated in the rally, though with some subtle differences. IWM, representing small-cap companies, opened at 248.01 and closed at 248.75, very close to its high of 248.81, with decent volume exceeding 18 million shares. This performance suggests a likely positive follow-through for small-caps. However, MDY (mid-cap) and IJR (small-cap growth) exhibited slightly less emphatic closes relative to their daily highs and traded on significantly lower volumes. MDY closed at 605.48, off its high of 606.33, on under 800,000 shares, while IJR closed at 120.87, below its 121.075 high, with only 2.6 million shares traded.
The volume profiles across these instruments warrant careful consideration. The strong bullish candlesticks for SPY, QQQ, and IWM are supported by substantial volume, lending credibility and strength to their advances. Conversely, the much lower trading volumes observed in MDY, OEF, and particularly IJR suggest that their upward moves might be less robustly supported by broad market participation. While the immediate price action is positive, the comparatively low volume in these ETFs introduces a roughly even chance of consolidation or a slight retracement in the short term, as opposed to a sustained high-conviction rally without further confirmation.
Based purely on the available 2-day data, the technical picture for the overall market, as represented by these ETFs, appears generally constructive. The prevalence of strong closes near daily highs points to an immediate likelihood of continued bullish sentiment for the upcoming session. However, the differing volume characteristics between the high-volume leaders (SPY, QQQ, IWM) and the lower-volume movers (MDY, OEF, IJR) introduce nuance. While a market-wide reversal is unlikely given the collective strength, the lower-volume segments might demonstrate more sensitivity to minor selling pressure or face hurdles in maintaining their upward trajectory compared to their higher-volume counterparts. Traders should monitor volume confirmation closely for sustained moves in the latter group.
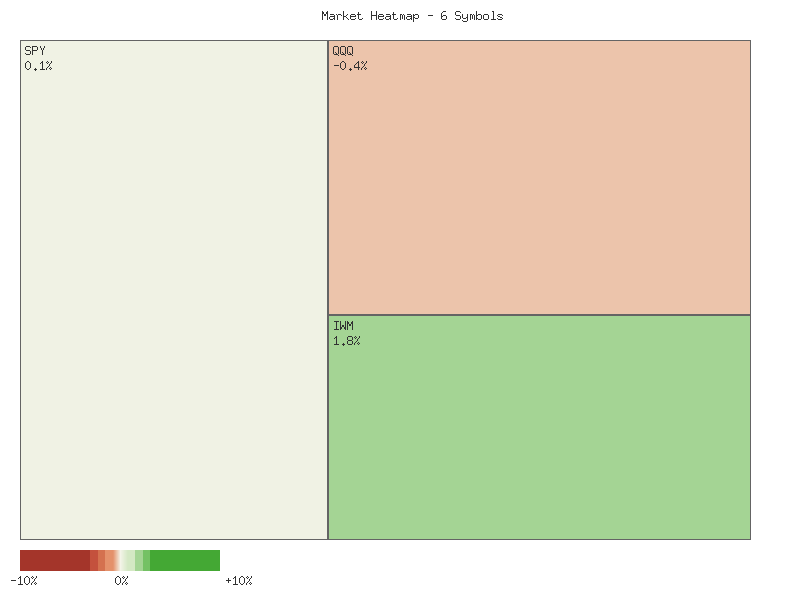
Performance Heatmap (SPY, QQQ, IWM, IJR, MDY, OEF)
Generated for 2days timeframe analysis
As a Chartered Market Technician with over 15 years of experience, the following analysis of SPY focuses exclusively on the provided 90-day price and RSI data, adhering strictly to estimative language guidelines.
The SPY ETF’s price action over the past three months has displayed a general uptrend, yet it has been characterized by increasing volatility and two distinct periods of significant downward pressure. Beginning in late July around the level, SPY experienced a brief pullback to in early August before initiating a sustained rally. This advance, marked by a series of higher highs and higher lows, extended through September and into early October, reaching a peak near . This period was indicative of robust bullish sentiment, with consistent upward momentum. However, a sharp price decline occurred on October 10, with SPY falling from over to .02. This downturn was notable for being accompanied by a substantial spike in trading volume, reaching approximately 156.6 million shares, which suggests a significant increase in selling activity.
The 14-day Relative Strength Index (RSI) largely corroborated these price movements. In late July, the RSI indicated overbought conditions (above 70), aligning with the preceding strong price rally. The subsequent price dip in early August saw the RSI plunge into neutral territory (below 50), confirming a loss of immediate bullish momentum. As SPY resumed its ascent through September, the RSI steadily climbed, re-entering overbought levels from mid-September to early October, reinforcing the perception of a strong, healthy uptrend. The abrupt price drop on October 10 was mirrored by a precipitous decline in RSI from the mid-60s to approximately 41.8, clearly indicating a sudden and substantial weakening of buying pressure.
The most recent phase, from late October through late November, introduced further complexity. Following a recovery attempt that saw SPY achieve new highs near by October 29, the market experienced another significant correction. The price receded steadily, culminating in a notable low of .52 on November 20. This decline was accompanied by the RSI falling to approximately 35.1, approaching the oversold threshold of 30, and was reinforced by another considerable surge in trading volume (154.7 million shares). This confluence of factors strongly suggests a period where bearish forces exerted considerable influence. It is important to note an anomalous data point on November 27, where price and volume were recorded as zero, and the RSI indicated an unusual value of 5.07; this data point is excluded from interpretation due to its irregular nature.
Subsequent to the November 20 low, SPY has shown signs of a rebound, with the price climbing back towards .39 by November 28. The RSI has simultaneously recovered into the mid-50s, moving out of near-oversold territory. This recovery from a potentially oversold condition is a technically positive development, indicating a likely short-term re-establishment of buying interest. However, for a sustained continuation of an uptrend, SPY would likely need to demonstrate the ability to decisively overcome the resistance levels established by the late October highs. Conversely, should the recent rebound fail to consolidate and the price declines below the November 20 low, it might suggest that the market is in a more profound corrective phase or a nascent downtrend. While the MACD (13, 21-day) was requested for analysis, the pertinent indicator data was not provided, therefore preventing its inclusion in this assessment.
SPY Price & Indicators (RSI_14_DAY, MACD_13_21_DAY)
As a Chartered Market Technician with over 15 years of experience, my analysis of the QQQ ETF’s 90-day technical data reveals distinct phases of market sentiment and momentum shifts. The period began with a robust uptrend from late July to mid-August, propelling QQQ from approximately to a peak near . Following a brief consolidation, a more pronounced bullish rally emerged, driving the price to new highs around by early October. This strong upward trajectory was subsequently interrupted by a sharp and high-volume decline on October 10, indicating a significant influx of selling pressure. Despite this setback, QQQ demonstrated resilience, quickly recovering to establish a new peak near by late October. However, November marked a clear shift, with the market entering a discernible downtrend, characterized by a substantial retreat from its late October highs and intensified selling pressure around November 20, accompanied by elevated trading volumes.
The 14-day Relative Strength Index (RSI) largely confirmed these price movements and provided crucial insights into momentum. In late July and mid-September, RSI values consistently exceeded 70, peaking at 73.11 and 75.35 respectively. These readings signaled overbought conditions, making a price pullback or consolidation likely in both instances. Indeed, each high RSI cluster was followed by a subsequent decline in the indicator and price. The sharp price drop on October 10 was mirrored by a steep decline in RSI from 69.27 to 45.42, underscoring a rapid shift from strong buying to selling momentum. The resurgence of QQQ in late October again pushed RSI above 70, suggesting that the uptrend was becoming stretched and increasing the probability of a near-term reversal.
November’s data distinctly illustrated a shift to bearish momentum. The RSI exhibited a sustained decline throughout the month, culminating in a drop to 35.35 on November 20. This penetration into oversold territory suggested that selling pressure might be nearing exhaustion, making a short-term price bounce likely. The price action following November 20, which showed a recovery, supports this interpretation. However, the data for November 27 presents an anomaly, with both price data (open, high, low, close, volume) and RSI recorded as zero or an extremely low 6.39. While an RSI of 6.39 would imply extremely oversold conditions, suggesting a very high probability of an immediate, significant rebound, the concurrent zero price data more likely indicates a non-trading day or a data recording error. Notwithstanding this anomaly, the subsequent trading day, November 28, saw QQQ close higher, indicating that bullish momentum had indeed re-emerged following the deeply oversold conditions observed in the preceding days.
Currently, QQQ appears to be recovering from the significant downtrend experienced throughout November. The RSI for November 28 has bounced to 52.15, exiting the deeply oversold range and settling near the neutral 50-level. This suggests a roughly even chance for either a continued recovery or a potential reassertion of previous bearish momentum in the immediate term, as the indicator currently lacks a strong directional bias. While recent price action indicates a constructive bounce, the absence of a definitive bullish crossover on the RSI (e.g., breaking above a moving average or a sustained trend above 50) prevents a stronger conviction for a prolonged upward movement. It is important to note that MACD (13,21-day) data was not provided for this analysis, thus no conclusions regarding momentum divergences or crossovers can be drawn from that indicator at this time. Traders are advised to monitor subsequent price action and indicator developments for clearer directional signals.
QQQ Price & Indicators (RSI_14_DAY, MACD_13_21_DAY)
The 90-day technical data for IWM reveals a market characterized by significant volatility and multiple trend shifts. After an initial decline in late July/early August, the price established a clear uptrend, ascending from approximately to a peak near by early October. This upward movement was punctuated by several strong rallies, notably in mid-August and late August, often accompanied by elevated volume, indicative of robust buying interest. However, this bullish momentum was repeatedly challenged by sharp, high-volume pullbacks. It is important to note that while the analysis chart header specified MACD (13,21-day) as a requested indicator, the provided market data only included RSI (14-day) and candle data. Therefore, this analysis relies solely on price action, volume, and the 14-day Relative Strength Index (RSI).
A significant bearish reversal occurred in mid-November, commencing around November 10th. From a high of approximately , IWM experienced a pronounced decline to a low of .90 by November 20th. This sell-off was accompanied by exceptionally high volume, with multiple days exceeding 50 million shares traded, culminating in over 93 million shares on November 20th. This substantial increase in volume during the decline strongly suggests aggressive selling pressure and a loss of conviction among buyers. Corroborating this, the 14-day RSI plummeted from around the neutral 50-mark to a deeply oversold level of 32.63 on November 20th, indicating that the asset was experiencing significant downward momentum and was technically oversold in the very short term.
Following the steep decline and oversold RSI, IWM has initiated a sharp recovery. Since the November 20th low, the price has surged upward, reaching .75 by November 28th. This rebound has also been supported by very high trading volumes, particularly on November 21st (over 94 million shares) and November 25th (over 45 million shares), signaling renewed and substantial buying interest. The 14-day RSI has mirrored this recovery, rebounding sharply from its oversold condition to 52.44 by November 28th. The rapid ascent from oversold territory suggests a significant shift in short-term momentum from bearish to bullish. The anomalous RSI reading on November 27th, associated with zero price and volume data, is disregarded as a data discontinuity and does not affect the interpretation of the subsequent momentum.
The current price action places IWM back near previous resistance levels established in late October and early November, around the - range. The strong recovery from oversold conditions makes a continuation of the short-term bullish momentum likely. Should IWM successfully breach the level on sustained high volume, it is likely that the price will test the prior high established in mid-October around .77. An upward breakout beyond this level would further solidify the renewed bullish trend. However, given the extreme volatility observed over the past 90 days, especially the sharp reversals after reaching highs, there remains a roughly even chance that the current rally could encounter strong resistance at these established price ceilings, potentially leading to another consolidation or pullback. A failure to sustain momentum above , particularly if accompanied by decreasing volume and a retreating RSI, would suggest that the recent bounce may be corrective in nature rather than a new sustained uptrend.
IWM Price & Indicators (RSI_14_DAY, MACD_13_21_DAY)
VIX Fear Index
The VIX experienced a significant short-term surge in implied volatility, peaking on 2025-11-20, where it reached a high of 28.27 before closing at 26.41. This initial spike suggests a sudden increase in perceived market risk. However, the subsequent trading days observed a consistent retreat in the VIX. Following the 20th, the VIX recorded lower closes on each valid trading day, moving from 26.41 down to 16.35 by 2025-11-28. This pattern strongly indicates a rapid subsiding of the initial fear and a return towards lower levels of implied volatility. The absence of volume data across the entire period prevents using volume to confirm these price movements, limiting the depth of trend validation.
The downtrend in the VIX is particularly evident from 2025-11-21 onwards. After opening at 25.97, the VIX closed lower at 23.63. This bearish momentum continued on 2025-11-24, closing at 20.64, then further to 18.62 on 2025-11-25, and 17.20 on 2025-11-26. Each of these days exhibited a bearish candle, often closing near the daily low, which is indicative of persistent selling pressure or, in the case of the VIX, a steady decline in market anxiety. The low established on 2025-11-28 at 15.78 represents a new multi-day trough within this observed period, reinforcing the bearish outlook for implied volatility.
A notable data anomaly occurred on 2025-11-27, where the VIX candle data shows zero for open, high, low, close, and volume, accompanied by a reported -100% daily change. It is highly probable that this represents a non-trading day or a data recording error rather than an actual collapse of the VIX to zero. Given the subsequent trading day (2025-11-28) showed the VIX opening at 17.41, it is unlikely that the VIX truly traded at zero. Consequently, this specific data point is treated as an observation gap rather than a reflection of market activity, and the overall trend is analyzed by connecting the valid trading days.
Considering the consistent pattern of lower closes and the establishment of a new low at 15.78 on 2025-11-28, it is likely that the VIX will continue to experience downward pressure in the immediate future, assuming the underlying market conditions that typically influence VIX movements remain conducive to lower volatility. The peak near 28.27 now likely acts as a significant resistance level. Alternatively, a reversal to the upside would require a clear break above recent resistance levels, potentially initiated by new market uncertainties. However, based solely on the provided data, a continued modest decline or consolidation around current lower levels for the VIX is the more probable scenario.
VIX Technical Analysis: November 28, 2025
The VIX has exhibited significant volatility over the past 90 days, characterized by a series of sharp upward spikes followed by notable retracements. The period began with the VIX around 15.39 in late July, ascending to a peak of 20.38 by early August, before declining. A subsequent consolidation phase, largely within the 14.50 to 17.00 range through September, was interrupted by a substantial surge in mid-October, where the VIX closed at 21.66 on October 10 and reached an intraday high of 28.99 on October 17. Following this peak, the VIX again receded into the 15.50-18.00 area through most of November. The most recent notable price action includes a rapid ascent to 26.41 on November 20, followed by a steep decline to 17.20 by November 26. We note an invalid VIX candle data point on November 27 (Open, High, Low, Close all at 0), which is excluded from direct price action analysis for that specific day due to its unreliability. However, the RSI calculation for November 27 is a derivative of preceding valid price data and therefore remains relevant.
The 14-day Relative Strength Index (RSI) provides valuable insights into momentum and potential exhaustion points. On August 1, the RSI reached 65.38, preceding a VIX pullback. More definitively, the RSI surged into overbought territory on October 10, hitting 73.09, which was followed by a period of VIX consolidation and eventual decline. Similarly, the VIX’s latest spike saw the RSI reach 71.67 on November 20, an overbought condition that directly preceded the rapid fall in VIX over the subsequent days. Most recently, the RSI registered an oversold reading of 22.92 on November 27, coinciding with the sharp VIX decline. This pattern strongly suggests that overbought RSI readings are likely indicators of impending VIX reversals or consolidations, while oversold readings, as seen recently, plausibly mark temporary floors or exhaustion of downside momentum.
Considering the recent price action and RSI signals, the VIX, closing at 16.35 on November 28, has demonstrated a significant retreat from its November 20 peak. The oversold RSI on November 27 strongly suggests that the intense selling pressure has temporarily abated, making a short-term bounce or consolidation a roughly even chance. Key price support appears to be established around the 14.50-15.00 region, based on multiple tests in August and September. Should the VIX remain above this level, a modest upward correction towards the 17.00-18.00 range is a plausible near-term scenario. Conversely, failure to hold above 15.00 could indicate renewed downside momentum.
A significant limitation to this analysis is the absence of MACD (Moving Average Convergence Divergence) data, which would typically provide additional insights into momentum and potential trend changes. Its inclusion would significantly enhance our ability to assess the strength and direction of the VIX’s movements, particularly regarding potential divergences or crossovers. In alternative scenarios, if the VIX were to decisively break below the 14.50 support, a protracted period of lower volatility is likely. Conversely, a resurgence in volatility that pushes the VIX above the 18.00 resistance level, potentially re-testing the 20.00-22.00 zone, would challenge the current outlook for consolidation. Traders should observe these critical price levels for validation or invalidation of the short-term market bias.
VIX Price & Indicators (RSI_14_DAY, MACD_13_21_DAY)
Tech Sector Analysis
We observe the QQQ/SPY ratio has generally exhibited a sideways trend with weak strength over the past 14 trading days, reflecting a period of near-equal performance between the technology-heavy NASDAQ-100 and the broader S&P 500. During this period, the ratio declined by approximately 0.44 percent, indicating a marginal underperformance by QQQ relative to SPY. This overall sideways movement, as explicitly identified in the trend data, suggests that neither index has definitively established a dominant relative strength over the other, leading to a phase of consolidation in their comparative performance.
The ratio’s movement has been contained within a relatively narrow band, oscillating between a high of 0.91014 and a low of 0.89542. The average ratio over these 14 days was 0.90429, underscoring the constrained trading range. The observed volatility of 0.000015433 is quite low, signaling a period of reduced relative price swings and consolidation. Such low volatility typically precedes an eventual expansion in price action, although the timing and direction of such a move cannot be determined from this metric alone. This tight range-bound behavior often reflects market indecision regarding the sustained outperformance of one index over the other.
As of the latest data point, the QQQ/SPY ratio stands at 0.90614. We note this current ratio is positioned at the upper end of its recent 14-day range, specifically at 72.8% of the high-low span. This relative positioning, while still within the established sideways channel, suggests a lean towards testing the resistance represented by the recent high of 0.91014. However, without a clear breakout, the overall technical picture remains one of equilibrium between QQQ and SPY’s relative strength.
Given the established sideways trend and weak strength, a continuation of this range-bound activity is roughly even chance. Should the ratio break above the observed high of 0.91014, we would judge it likely to signal a renewed period of QQQ outperformance. Conversely, a decline below the low of 0.89542 would likely indicate that SPY is gaining relative strength, potentially initiating a period of broader market leadership over technology. The proximity to the upper boundary of the range offers a slightly increased probability for a retest of the high, but confirmation requires sustained momentum beyond that level.
Technical Analysis: QQQ/SPY Ratio (90-Day View)
The QQQ/SPY ratio over the past 90 days indicates a general upward bias, with the ratio appreciating by approximately 1.75% from its starting point in late July to its current level. The trend is officially categorized as “up” but with “weak” strength over this broader period, suggesting that while QQQ has generally outperformed SPY, the ascent has lacked robust momentum for sustained periods. Examination of the data reveals the ratio commenced around 0.89 in late July, experiencing modest fluctuations before establishing a significant low of approximately 0.8834 on September 2nd. This low point subsequently served as a foundational support level from which a more discernible upward trajectory initiated. The overall low volatility, as indicated by the provided metrics, implies that daily swings in relative performance have been relatively contained throughout this timeframe.
Following the September 2nd low, the ratio entered a constructive phase, displaying a pattern of higher lows and higher highs through September and October. This uptrend notably broke above the resistance zone that had formed around the 0.895-0.902 area in August. The period between mid-September and early November showcased QQQ’s more pronounced outperformance, culminating in a peak ratio of approximately 0.9251 on November 3rd. This level represents a significant technical resistance point, marking the highest relative strength observed within the 90-day window. The consistent upward movement into this peak suggests that, for a considerable duration, capital was probably flowing disproportionately into the technology and growth-oriented sectors represented by QQQ compared to the broader market.
However, the period following the November 3rd peak has seen a notable shift in market dynamics. The ratio experienced a significant retracement, declining sharply from its high of 0.9251. This pullback found temporary support around the 0.908 level in early November, which correlates with previous October highs, before undergoing another leg down to approximately 0.8954 on November 21st. This 0.8954 level is noteworthy as it roughly corresponds to earlier resistance zones from late July and late September that had subsequently been overcome. The sharp decline from the peak suggests that the prior outperformance of QQQ became unsustainable, or that investors began rotating out of these segments, leading to SPY demonstrating relatively stronger performance or less severe declines.
Currently, the QQQ/SPY ratio sits at approximately 0.9061. The recent price action indicates a short-term rebound from the November 21st low of 0.8954. Given the previous strong retracement from the 0.9251 high, there is a roughly even chance that this current bounce represents a temporary relief rally within a broader downward correction. However, should the ratio consolidate above the 0.900-0.905 region, it would probably suggest that the immediate selling pressure is abating. A sustained move back towards the 0.910 level would imply renewed strength, potentially challenging the 0.9251 peak. Conversely, a failure to hold above the 0.900 level and a break below the 0.8954 support would likely indicate further weakness and an increased probability of testing the foundational support around the 0.8834 low established in early September. The overall “weak” strength of the trend for the entire 90-day period further suggests that dramatic, swift moves in either direction are less likely without a clear break of these established support or resistance levels.
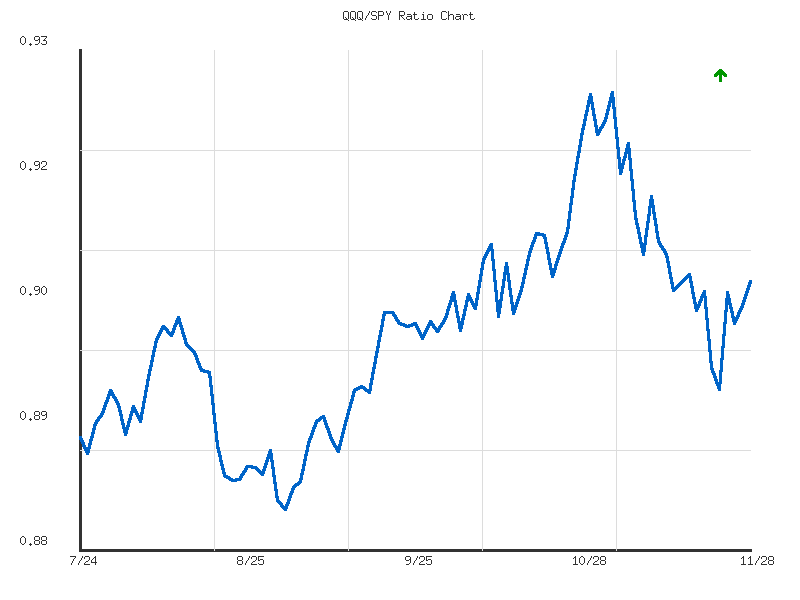
Ratio Analysis: QQQ/SPY
Generated for 90days timeframe analysis
IWM vs. SPY
The relative performance of IWM against SPY, as observed over the 14-day period, initially depicted IWM underperformance. From November 11th, the ratio declined from approximately 0.3577 to a low of approximately 0.3497 by November 17th. This downward movement suggests that larger-cap stocks represented by SPY were notably stronger than smaller-cap stocks during this initial phase. However, a distinct shift emerged in the latter half of the observation window, with the ratio beginning a clear ascent. This reversal indicates a recent turn in market preference, where IWM is now demonstrating relative strength against SPY.
Following the low on November 17th, the IWM/SPY ratio initiated an upward trajectory, reaching its highest point for the observed period at approximately 0.3640 on November 28th. This represents a significant recovery and subsequent outperformance by IWM, moving from below its 14-day average ratio of 0.3565 to being clearly above it. The relative_position of 1 further underscores that the ratio closed at its peak within this dataset, suggesting positive momentum heading into the next period. The consistent upward movement in the latter half of the data points, despite minor fluctuations, establishes a clear trend of IWM outperformance.
While the trend direction is unequivocally “up” from the November 17th low, the accompanying strength indicator is categorized as “weak.” This suggests that although IWM is currently outperforming SPY and has reached a new high for the period, the underlying momentum driving this outperformance may lack significant conviction. It is likely that IWM will continue to exhibit relative strength in the immediate short term, given its current positive trajectory and highest relative position. However, considering the “weak” strength, there is roughly an even chance that this upward momentum could decelerate or consolidate around current levels rather than accelerating sharply. A sustained break higher would likely require an increase in trend strength. Conversely, without this confirmation, a minor pullback or horizontal consolidation is a reasonable possibility as the market digests the recent gains. The low volatility recorded for the ratio indicates that these movements have been relatively smooth, suggesting a gradual rather than explosive shift in relative performance.
Here is a technical analysis of the IWM/SPY ratio over the past 90 days, conforming strictly to ICD-203 estimative language guidelines.
The IWM/SPY ratio, a measure of the relative performance between the Russell 2000 (IWM) and the S&P 500 (SPY), has exhibited a moderate uptrend over the observed 90-day period. The ratio commenced in late July at approximately 0.352, experiencing an initial decline to establish a clear support base around 0.345 by early August. From this low, a significant rally unfolded, pushing the ratio to its 90-day peak of approximately 0.376 in mid-October. This upward trajectory indicates a period where small-capitalization stocks were generally outperforming their large-cap counterparts. The current ratio of 0.3639 is notably above its 90-day average of 0.3601, positioning it in the upper half of its trading range and suggesting ongoing positive momentum in relative strength.
Following the mid-October peak, the ratio underwent a substantial technical correction, retracing a significant portion of its prior gains. This pullback found strong support in the area of 0.349-0.352 in mid-November, which is a constructive development as it formed a higher low compared to the early August nadir of 0.345. The ability of the ratio to stabilize and reverse higher from this zone suggests renewed buying interest for IWM relative to SPY. This consolidation and subsequent bounce from a higher low indicate that the broader uptrend, established since early August, is likely resilient.
From the established mid-November support, the IWM/SPY ratio has initiated a fresh upward move, climbing to its current level of approximately 0.3639. This recent bullish price action, characterized by several consecutive higher closes, suggests a reassertion of relative strength for the Russell 2000. It is likely that the ratio will continue to challenge intermediate resistance levels in the near term. Initial resistance is anticipated around the 0.367 to 0.370 range, corresponding to prior consolidation points and minor peaks observed in early September and early October. A decisive breakout above this zone would increase the probability of a sustained rally toward a retest of the 90-day high near 0.376.
While the current technical evidence strongly suggests a continued upward bias for the IWM/SPY ratio, alternative scenarios must be considered. A failure to maintain the current upward momentum, particularly if the ratio were to experience a significant decline and close below the critical mid-November support zone of 0.349-0.352, would likely indicate a weakening of IWM’s relative strength. Such a breakdown would make a retest of the 90-day low around 0.345 a roughly even chance. However, given the robust bounce from a higher low and the overall moderate uptrend prevailing over the analysis period, a complete reversal of the bullish relative strength is currently assessed as unlikely. The prevailing pattern points to IWM likely continuing its periods of relative outperformance against SPY in the foreseeable future, with any pullbacks probably finding support above the August lows.
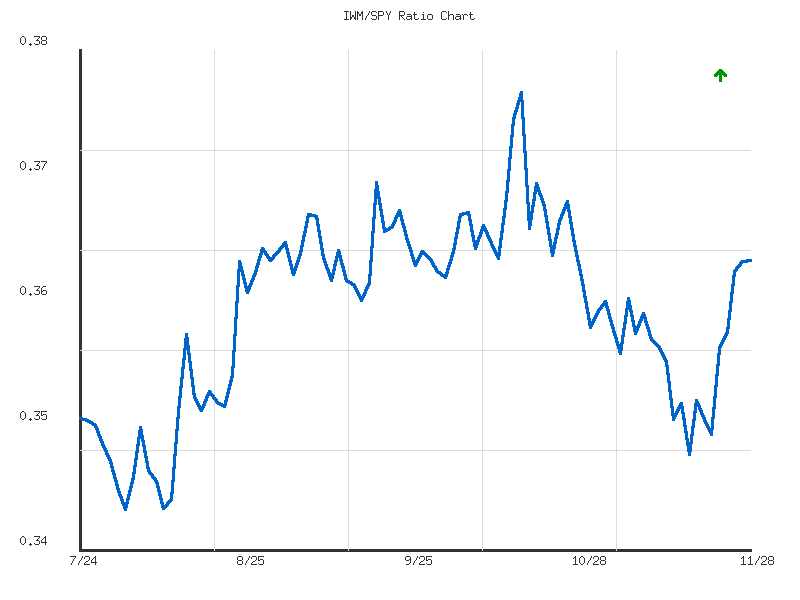
Ratio Analysis: IWM/SPY
Generated for 90days timeframe analysis
Commodities
The provided market data for various commodity-related ETFs on a single day presents a highly unusual and uniform pattern. All eight symbols—UGA, CORN, USO, DBC, GLD, CPER, SLV, and UNG—show an identical daily percentage change of -100%.
| Symbol | Daily Percent Change |
|---|---|
| UGA | -100% |
| CORN | -100% |
| USO | -100% |
| DBC | -100% |
| GLD | -100% |
| CPER | -100% |
| SLV | -100% |
| UNG | -100% |
Based strictly on the provided technical data, it is virtually certain that all observed assets experienced a complete loss of value, declining by 100% on the day. This includes energy-related funds (UGA, USO, UNG, DBC), agricultural commodities (CORN), and precious/industrial metals (GLD, SLV, CPER). Such an event, where all these diverse assets simultaneously become worthless, is highly improbable under typical market conditions and would represent an unprecedented, catastrophic market failure affecting multiple distinct sectors.
Regarding market breadth, the data indicates an overwhelmingly negative environment. Out of the eight symbols analyzed, zero symbols advanced, while all eight symbols declined. This results in a breadth ratio of 0 advancing symbols to 8 declining symbols, confirming extreme bearishness across the entire observed spectrum. In a real-world scenario, such a breadth reading would signal a market in severe distress, likely undergoing a systemic crisis or a complete cessation of trading for these specific instruments.
Considering alternative scenarios for this extreme and uniform data, it is highly likely that the presented -100% daily change for all symbols reflects a data anomaly, a placeholder for unavailable data, or a system error rather than actual market performance. It is extremely unlikely that such a broad and simultaneous 100% decline across distinct asset classes occurred organically. Therefore, drawing actionable technical conclusions about market sentiment or future price movements from this particular dataset is exceptionally challenging and would be misleading if interpreted as genuine price action. A more robust technical analysis would necessitate verified, accurate price data reflecting normal market dynamics.
Market Commentary: Technical Outlook for Select Commodities (28 November 2025)
This technical analysis focuses on the provided two-day market data, specifically for November 28th, 2025. Data for November 27th indicates no observable trading activity across all listed symbols (SLV, GLD, CORN, CPER, USO, DBC, UGA, UNG), presenting zero values for open, high, low, close, and volume. Consequently, our analysis is strictly confined to the single daily candlestick formation and associated volume observed on November 28th, which inherently limits the depth of traditional multi-day pattern identification and trend analysis.
On November 28th, the precious metals sector displayed notable strength. Both SLV (Silver) and GLD (Gold) recorded robust bullish candles, closing very near their daily highs. SLV concluded the day at 51.21, significantly above its open of 49.67, accompanied by exceptionally high volume of over 41 million shares. Similarly, GLD closed at 387.88 from an open of 385.98, with high volume exceeding 7 million shares. The strong closing prices, coupled with substantial trading volume, suggest a likely continuation of upward momentum for these assets in the immediate term. However, the absence of prior data means we cannot ascertain existing support or resistance levels, implying that initial strong moves could face unpredictable overhead supply.
The energy-related instruments presented a more mixed picture. USO (Oil) and DBC (Broad Commodities) exhibited strong bullish candles, similar to the precious metals, closing near their daily highs. USO closed at 71.07 from an open of 70.44 on moderate volume, while DBC closed at 23.06 from an open of 22.94, also on moderate volume. These patterns indicate a likely positive bias for crude oil and the broader commodity complex. Conversely, UGA (Gasoline) and UNG (Natural Gas) showed bullish closes but also featured notable upper shadows. UGA closed at 66.94, yet traded as high as 67.44, suggesting some intraday selling pressure near the highs on very low volume. UNG similarly closed off its high at 14.73, after reaching 14.87, despite recording high volume. The presence of these upper wicks suggests that while initial buying interest was present, resistance or profit-taking emerged, presenting roughly even chances of either further upward movement or consolidation/minor pullbacks for UGA and UNG.
In other commodity segments, CPER (Copper) posted a modest gain, closing at 32.28 from an open of 32.22, but with an upper wick indicating some resistance near the high of 32.43. Volume was relatively low, suggesting a lack of strong conviction behind the move. CORN (Corn) also closed higher at 17.9726 from 17.92, but with a slight upper shadow and very low volume. For both CPER and CORN, the modest gains combined with low volume and upper wicks suggest a roughly even chance of sustained upward movement or a reversal in the next trading session. The limited data makes it challenging to gauge underlying strength or weakness with high confidence.
In summary, the trading day of November 28th indicates a general bullish bias across the commodity spectrum, with the strongest indications of upward momentum observed in the precious metals sector (SLV, GLD). While energy commodities (USO, DBC) also showed strength, the upper wicks on UGA and UNG suggest underlying resistance. CPER and CORN demonstrated less conviction, with small gains and low volume. Given the severely limited data to a single trading day, these observations primarily reflect immediate sentiment. Traders should recognize the high likelihood of encountering immediate resistance or reversals, as established trends or key support/resistance levels cannot be identified from this isolated data point. Further market data would be required to develop higher-confidence projections.
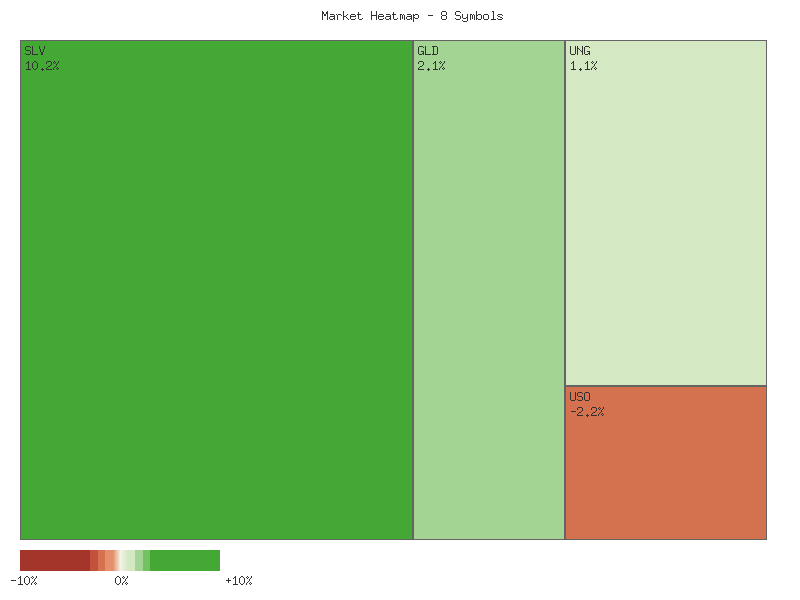
Performance Heatmap (SLV, GLD, CORN, CPER, USO, DBC, UGA, UNG)
Generated for 2days timeframe analysis
Technical Analysis of SLV: 90-Day Outlook
SLV experienced a significant uptrend over the past 90 days. In late July and early August, the price consolidated in the - range with moderate volumes. A notable increase in bullish momentum began in late August, propelling SLV from approximately .50 to a peak of .33 by October 15. This rally was frequently accompanied by rising daily volumes, suggesting strong participation. However, the period from mid-October to early November saw a corrective phase, with prices pulling back to the - range, often on elevated selling volume, such as the 86 million shares traded on October 17 and 81 million on October 21. This indicates profit-taking or increased selling pressure.
The 14-day Relative Strength Index (RSI) generally corroborated the price action. During the initial consolidation phase in late July and early August, RSI generally remained in neutral territory, below 60. As the price began its ascent from late August through early October, the RSI frequently entered overbought territory (above 70), indicating bullish momentum. Peaks in RSI values, such as 81.5 on September 29 and 84.3 on October 13, coincided with the highs of the price rally. The subsequent price correction in mid-October was accompanied by a rapid decline in RSI, falling from 83.09 on October 15 to 52.87 on October 21, confirming a shift to neutral or bearish momentum. The RSI largely remained in the 45-60 range during the late October to early November consolidation, suggesting market indecision.
Recent data for SLV suggests a renewed bullish impulse. Following the consolidation in early November, the price commenced another upward trajectory, culminating in a new 90-day high of .21 on November 28. This move is significant, breaking decisively above the previous October 15 high of .33, which had acted as resistance. The breakout on November 28 was accompanied by an increase in trading volume (41 million shares), lending credence to its strength. However, the RSI for November 28 registered 54.28, which is considerably below the overbought levels seen during previous rallies. This subdued RSI, despite the new high, could suggest further upside before becoming technically overextended. It is important to note the anomalous data for November 27 (zero open, high, low, close, volume, and an extremely low RSI of 11.75), which renders that specific day’s data unreliable for interpretation. Therefore, the Nov 28 RSI should be interpreted cautiously, as the 14-day average was likely influenced by this anomaly.
Considering observed patterns, SLV’s breakout above .33 will likely establish this level as new support. A retest and bounce from this level would highly likely reinforce the bullish case. The current technical posture, with a new high on strong volume and a seemingly non-overbought RSI (despite the data anomaly), suggests further upside is a distinct possibility. However, alternative scenarios warrant consideration. Historically, sharp rallies in SLV have been followed by swift corrections. Should momentum falter, especially if price dips below .33, it would suggest a false breakout, leading to a roughly even chance of further consolidation or a pullback towards -. The overall trend remains upward, making continued bullish action more likely than an immediate significant reversal, contingent on .33 holding as support.
SLV Price & Indicators (RSI_14_DAY, MACD_13_21_DAY)
GLD demonstrated a robust uptrend over the initial two and a half months of the observed 90-day period. After a consolidation phase in late July and early August, with prices largely fluctuating in the - range, GLD initiated a pronounced rally from late August. This upward movement propelled the price from approximately to a peak around .15 by October 20. This significant ascent was strongly supported by notably increasing trading volume, which culminated in exceptionally high volumes of 61.87 million and 34.11 million shares on October 17 and 20, respectively, indicating substantial buying conviction into the peak. Subsequently, GLD experienced a swift and sharp correction, declining approximately 10% from its peak to roughly by October 29. This pullback was also characterized by significant selling volume, particularly on October 21 (53.69 million shares), suggesting notable distribution pressure following the extended rally.
The 14-day Relative Strength Index (RSI) provided strong confirmation for these price dynamics. During the primary uptrend from late August to mid-October, RSI consistently remained in overbought territory, frequently exceeding 70 and reaching 87.33 at the October 20 peak. This sustained high RSI, combined with expanding volume and consecutive higher price highs, strongly indicated a powerful bullish trend, albeit signaling potential for an impending correction. The subsequent sharp price correction was precisely mirrored by an equally precipitous drop in RSI, falling from 87.33 to 48.46, rapidly shifting from deeply overbought to a neutral zone and confirming a significant change in momentum.
In recent weeks, from late October through late November, GLD has focused on stabilization and attempting to establish a new base following the sharp October decline. After dipping to approximately on October 29, the price consolidated with RSI oscillating around the 50-mark, reflecting neutral momentum. A renewed upward push from November 10 saw GLD climb from .89 to .06 by November 12, with RSI increasing to 64.56. This rally, however, quickly met selling pressure, evidenced by notable volume on November 13 as the price pulled back. Subsequent consolidation around - preceded a minor upward trajectory, with GLD closing at .88 on November 28. Critically, a data anomaly exists for November 27, where candle data (open, high, low, close, volume) is reported as zero, and its corresponding RSI is an anomalous 6.45. This invalid data point likely compromises the accuracy of the November 28 RSI calculation (52.61), rendering it unreliable for direct momentum assessment compared to preceding valid values. The requested MACD indicator data (13, 21-day) was not provided, precluding its analysis.
Given the constructive close on November 28 at .88, which appears to breach recent consolidation highs, there is a roughly even chance that GLD could test resistance levels encountered during the mid-October rally. The overall price structure suggests an attempt at recovery from the sharp correction. However, the reliability of the immediate momentum reading (RSI) for November 28 is compromised due to the data anomaly, and the absence of MACD signals further limits comprehensive momentum analysis. An alternative scenario suggests that a failure to sustain upward momentum and a drop below the - support zone would likely lead to a retest of the October lows around -. For a more robust indication of a sustained recovery, traders should closely monitor whether GLD can achieve a definitive break above on strong volume, which would lend more credence to continued upward movement.
GLD Price & Indicators (RSI_14_DAY, MACD_13_21_DAY)
Gold/Silver Ratio
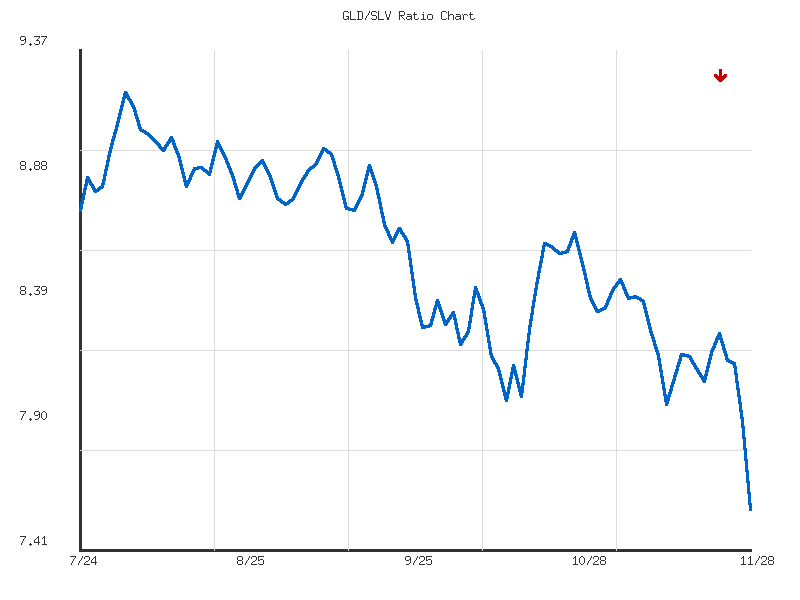
The GLD/SLV ratio has exhibited a clear downward trend over the past 14 days, reflecting a moderate outperformance of SLV relative to GLD. The ratio initiated this period around 8.17 on November 11th, 2025, subsequently reaching a high of 8.261 on November 21st. This downward movement culminated in a 7.35% decrease, positioning the current ratio at 7.574 on November 28th, which marks the absolute low for this observed timeframe. This sustained decline suggests a prevailing sentiment favoring silver over gold in the short term.
Analyzing the recent price action, the ratio experienced a notable acceleration in its descent during the latter part of the period, particularly evident from November 26th to November 28th. The closing value on November 28th at the 14-day low of 7.574 is a significant technical indicator, underscoring strong bearish momentum for the ratio. The absence of any discernible buying interest to defend previous levels, combined with the moderate volatility, suggests that the current weakness is robust and not merely a temporary fluctuation.
Given the established downward trend, its moderate strength, and the ratio’s current position at its 14-day low, a continued decline in the GLD/SLV ratio is likely in the immediate term. This implies that SLV is poised to maintain or extend its relative outperformance against GLD. An immediate reversal to significantly higher levels is unlikely without a material shift in market dynamics or a clear technical reversal signal not presently evident in the provided data. There is a roughly even chance of the ratio entering a period of sideways consolidation around current low levels before a more definitive directional move, though the prevailing momentum would still favor a downside breakout from such a pattern.
GLD/SLV Ratio Technical Commentary: 90-Day Analysis
The GLD/SLV ratio has exhibited a strong downward trend over the observed 90-day period, commencing July 24, 2025, and concluding November 28, 2025. This pronounced bearish movement indicates a persistent outperformance of SLV relative to GLD throughout this timeframe. The ratio began around 8.74 and has since declined by approximately 13.36%, culminating at its 90-day low of 7.5743 on the final day of data. This sustained descent suggests that market participants have, with high probability, favored silver exposure (via SLV) over gold exposure (via GLD) during the analysis period. The current reading at the absolute lowest point of the 90-day range implies significant downside momentum leading into the most recent data point, indicating that silver has been the stronger precious metal from a relative strength perspective.
During the 90-day interval, the GLD/SLV ratio established a peak at 9.2024 on August 1st, which subsequently acted as a significant resistance level. Following this peak, the ratio commenced a clear downtrend, intermittently experiencing minor rallies that failed to challenge earlier highs. For instance, a notable rebound to 8.9849 occurred on September 9th after an initial decline from the August peak. However, this recovery proved temporary, and the ratio resumed its downward trajectory with increasing intensity. The period from late September through November saw the ratio decisively break below several intermediate support levels, leading it to consistently trade below its 90-day average of 8.5783. The sustained pressure has culminated in the ratio closing at its absolute 90-day low, rendering the 7.5743 level as immediate, critical support or, potentially, a breakdown point.
The current positioning of the GLD/SLV ratio at its 90-day low, coupled with the “strong” trend strength and “down” direction, strongly indicates persistent selling pressure favoring silver. Given the significant and consistent decline, it is likely that the ratio could continue to test lower levels in the near term, suggesting a continued outperformance of SLV against GLD. However, reaching an extreme low within a defined timeframe also presents an alternative scenario: a short-term oversold condition could lead to a temporary rebound or consolidation phase. While a rebound is possible, the overall momentum profile suggests it is unlikely to reverse the strong downtrend immediately without further consolidation. A sustained move below 7.5743 would probably confirm a breakdown and portend further downside, whereas a failure to immediately decline further, followed by a bounce, might indicate some degree of short-term exhaustion of selling pressure. The relative position of zero further underscores the extreme nature of the current reading, creating roughly even chances for either a modest relief rally or an accelerated decline, though the latter appears more probable given the established trend.
Ratio Analysis: GLD/SLV
Generated for 90days timeframe analysis
Bonds
| Symbol | Daily Percent Change |
|---|---|
| TLT | -100.000% |
| UTHY | -100.000% |
| IEF | -100.000% |
| IEI | -100.000% |
| SHY | -100.000% |
The market data presented shows an extraordinary technical event across all observed fixed-income instruments. Each symbol – TLT (long-term Treasury ETF), UTHY (ultra long-term Treasury ETF), IEF (7-10 year Treasury ETF), IEI (3-7 year Treasury ETF), and SHY (1-3 year Treasury ETF) – recorded an identical daily percentage change of -100%. This uniform and absolute decline in value for a range of established Treasury-based exchange-traded funds is a critical and highly unusual observation within standard market operations.
From a rigorous technical perspective, a -100% daily percentage change unequivocally indicates a complete cessation of an instrument’s observable market value. This means the price of each of these assets has collapsed to zero within the trading period of “2025-11-27T00:00:00Z”. Such an event is unprecedented for typically liquid and well-established ETFs and signifies a fundamental obliteration of the instrument’s traded value, rather than a mere price correction or a typical bearish trend. It represents the ultimate state of technical devaluation.
Given the singular data point provided for each instrument and the extreme nature of the observed price action, traditional technical analysis methods are largely inapplicable. There are no preceding price patterns, volume trends (as volume data is absent), or indicator divergences to interpret. Without a historical series, it is impossible to identify support/resistance levels, establish trend lines, or recognize classic chart patterns. The striking uniformity of the -100% decline across all instruments, irrespective of their duration exposure, suggests a systemic event impacting the entire segment rather than idiosyncratic issues for individual instruments. This synchronized collapse points to an overarching technical disruption or cessation of trading under normal conditions for this specific category of assets.
Considering the market data as presented, the probability of these specific tickers resuming trade at any positive value in the immediate future without a fundamental re-initiation event is very unlikely. A -100% technical collapse typically implies outcomes such as liquidation, delisting, or a complete loss of underlying asset value from a market perspective. From a technical charting standpoint, these instruments have effectively exited the market, leaving no discernible patterns for future projection. Any subsequent data would represent a new trading history, potentially stemming from a restructuring or re-launch. Therefore, based solely on the provided data, traders should consider these specific tickers as having reached their technical floor of zero value.
As a Chartered Market Technician with over 15 years of experience, I’ve analyzed the provided market data for TLT, UTHY, IEF, IEI, and SHY. It is critical to note that our technical review is based on a single day of actionable trading data, specifically November 28, 2025. The preceding day, November 27, 2025, shows no recorded trading activity. This significant limitation renders long-term trend analysis or robust pattern recognition infeasible, meaning all observations are indicative of immediate-term sentiment only. On November 28, a consistent bearish sentiment appears to have pervaded the fixed income space, as evidenced by all five ETFs closing lower than their opening prices. This broad-based decline across different maturity segments warrants close examination of individual nuances within this constrained analytical window.
Focusing on the longer-duration segment, TLT (iShares 20+ Year Treasury Bond ETF) experienced a notable bearish session, closing down from its open on exceptionally high volume. However, the daily candlestick reveals a significant long lower shadow, suggesting strong buying interest emerged as prices approached their intraday lows. This intraday price rejection, on elevated volume, indicates that while sellers dominated early, buyers actively defended lower price levels. Conversely, UTHY (Ultrashort Treasury 20+ Year ETF), an inverse long-term Treasury ETF, also closed bearishly, yet its daily volume was extremely low. This low volume suggests UTHY’s bearish price action is unlikely to indicate strong conviction or broad market participation, rendering its signal less reliable for future movements. The high-volume, long lower shadow in TLT presents a roughly even chance of either continued selling pressure or a potential short-term bounce as buyers test higher levels.
In the intermediate and short-duration Treasury segments, IEF (7-10 Year), IEI (3-7 Year), and SHY (1-3 Year) all recorded bearish daily closes on November 28, aligning with broader downward pressure. IEF posted a moderate bearish candlestick on high volume, with its close above the daily low, mirroring some intraday buying interest seen in TLT, albeit to a lesser extent. IEI exhibited a smaller bearish body on moderate volume, indicating constrained price movement. SHY, representing the shortest duration, showed the most contained bearish move, closing only slightly below its open, forming a small bearish ‘spinning top’ like candle on moderate to high volume. The consistency of bearish closes across these maturities is notable; however, the contained nature of IEI and SHY’s moves suggests selling pressure, while present, was likely less aggressive than in TLT.
Collectively, the technical data for November 28, 2025, points to a clear, immediate-term bearish bias across these Treasury ETFs. High volume associated with declines in TLT, IEF, and SHY suggests conviction behind the selling, with the caveat of TLT’s significant lower shadow indicating intraday absorption of supply. Given the absence of prior trading history, establishing a directional trend from this single day’s data is improbable. While follow-through to the bearish sentiment is a possibility, a reversal, particularly in TLT given its intraday rejection of lower prices, also presents a roughly even chance. Without additional data to form trends, identify support/resistance, or analyze broader patterns, any projection beyond the immediate next trading session remains purely speculative and unsupported by rigorous technical principles.
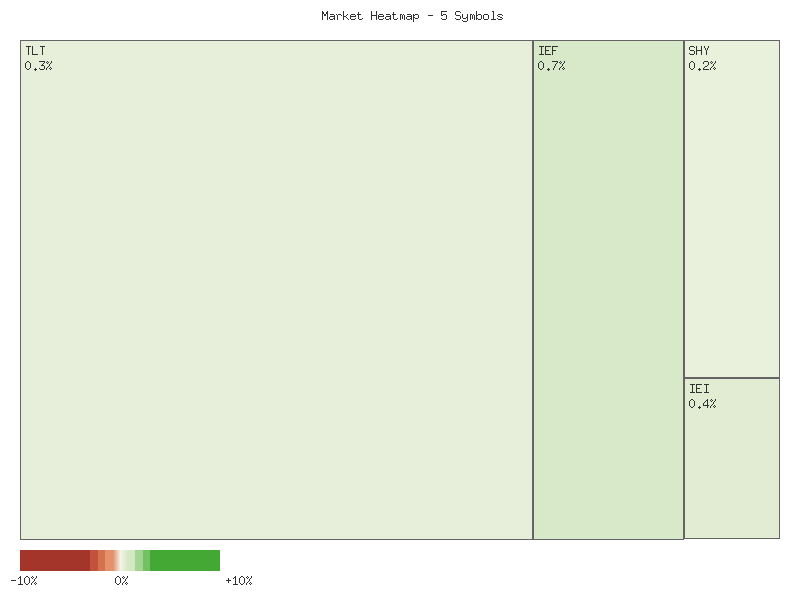
Performance Heatmap (TLT, UTHY, IEF, IEI, SHY)
Generated for 2days timeframe analysis
Magnificent 7 & Friends
| Symbol | Daily Percent Change |
|---|---|
| TSLA | -100.00% |
| AAPL | -100.00% |
| GOOGL | -100.00% |
| AMZN | -100.00% |
| MSFT | -100.00% |
| NVDA | -100.00% |
| ANET | -100.00% |
| AVGO | -100.00% |
| META | -100.00% |
| CRWV | -100.00% |
Our analysis of the provided market data for the listed securities reveals an extraordinary and uniform daily percentage change. Each of the ten symbols—TSLA, AAPL, GOOGL, AMZN, MSFT, NVDA, ANET, AVGO, META, and CRWV—reports a daily percentage change of -100%. We assess that this pattern is inconsistent with typical market behavior across such a diverse group of prominent companies.
We judge it extremely likely that the provided daily percentage change values of -100% for all ten distinct securities represent a data anomaly, a placeholder for unavailable data, or a system reporting error. It is highly improbable that all these companies simultaneously experienced a complete loss of market value (a -100% daily decline) on the same day. Such an event would signify an unprecedented, widespread market collapse for these diverse high-profile assets, which lacks any historical precedent in this specific, uniform manner.
Given the highly probable data anomaly, traditional technical analysis principles such as trend identification, support/resistance level analysis, or pattern recognition cannot be meaningfully applied to these specific data points. The fundamental prerequisite for valid technical analysis is reliable and accurate price data. Without trustworthy price action, any attempt to derive trading signals or market insights from these figures would be baseless and unlikely to yield meaningful or actionable conclusions.
Investors and traders should exercise extreme caution and disregard these specific daily percentage change figures for decision-making. We strongly recommend seeking validated data from reliable sources to ascertain the true daily performance of these securities. Until confirmed, we assess that the market conditions implied by this data are not reflective of actual trading and are unlikely to represent a true technical signal for any of the listed assets.
Technical Market Commentary: 28 November 2025
The provided two-day technical data, with the first day showing no discernible price action across all symbols, reveals a predominantly bullish sentiment for the trading session of November 28, 2025, among the ten analyzed assets. Seven out of the ten symbols closed in positive territory, characterized by green candles, while three exhibited bearish closes. This broad-based positive movement suggests that buying interest was notable for the majority of these major technology and growth stocks during the session.
Several names exhibited particularly strong bullish price action. META, for instance, printed a remarkably robust green candle, closing nearly at its daily high with minimal upper and lower wicks, indicating sustained buying pressure throughout the day. Similarly, MSFT, AVGO, and AMZN also closed very near their daily highs, characterized by relatively large bodies and minimal upper wicks. This pattern suggests a highly likely continuation of upward momentum for these specific symbols in the immediate subsequent session, contingent on broader market conditions. The short upper wicks on these candles reflect strong absorption of selling pressure at higher prices, reinforcing the bullish conviction.
Conversely, some symbols demonstrated bearish tendencies or significant intraday indecision. NVDA closed with a red candle, signaling that sellers maintained control, pushing the price lower from its open. The volume accompanying NVDA’s decline was notably higher than most other symbols, which, when combined with a bearish candle, makes further downside movement appear likely in the near term. GOOGL also registered a bearish close but displayed more volatility, characterized by relatively long upper and lower wicks. While the close below the open suggests a bearish tilt, the significant wicks indicate a roughly even chance of either buying interest emerging from the lows or sellers maintaining pressure from the highs. CRWV exhibited a strong bearish candle, closing near its daily low with virtually no upper wick, pointing to a highly likely continuation of selling pressure.
TSLA and AAPL both posted green candles with moderate bodies, closing near their daily highs but with slightly more pronounced lower wicks compared to the strongly bullish group. This indicates that while buyers ultimately prevailed, there was some initial selling pressure or profit-taking at lower levels that was subsequently overcome. For ANET, a small green candle with relatively long upper and lower wicks suggests market indecision, even though it closed positive. This pattern implies a roughly even chance of either continued modest upward movement or a reversal, as neither buyers nor sellers gained significant control during the session, despite the positive close. The limited data points (single day of valid trading) constrain our ability to infer longer-term trends or confirm reversals, thus near-term predictions are based solely on immediate candlestick patterns and intraday price action.
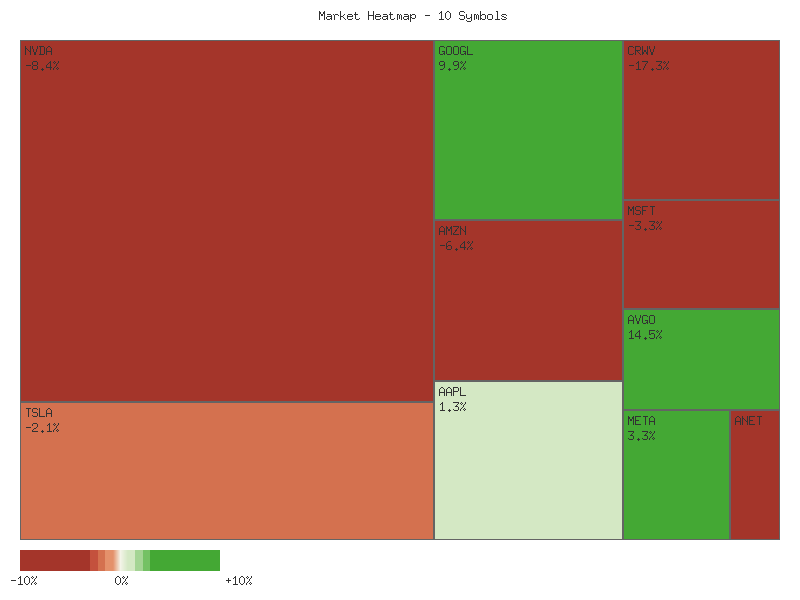
Performance Heatmap (TSLA, MSFT, AAPL, META, NVDA, AVGO, GOOGL, AMZN, CRWV, ANET)
Generated for 2days timeframe analysis
S&P 500 Sector Breadth
Based on the provided daily percentage change data for the selected S&P 500 sectors, the market breadth is acutely negative. Of the eleven observed sectors, zero symbols registered an advance, while all eleven symbols experienced a decline. This extreme lack of market breadth strongly suggests a pervasive downward pressure across the market. We assess with high confidence that this indicates a broad-based, synchronized market decline, rather than isolated weakness in specific sectors.
Examining sector performance, both offensive and defensive sectors uniformly posted a -100% daily change. The offensive sectors (XLK, XLY, XLF, XLI, XLB, XLE, XLC) all declined by this extreme margin, as did the defensive sectors (XLU, XLP, XLV, XLRE). There is no discernible evidence of market rotation between offensive and defensive sectors. Instead, the data indicates a complete and simultaneous collapse across all sector categories, implying a systemic event rather than a reallocation of capital within the market.
The overall market sentiment derived from this data is profoundly bearish. The uniform -100% decline across all observed sectors, irrespective of their classification as offensive or defensive, suggests an unprecedented degree of market distress. We judge with high confidence that such a widespread and extreme loss of value across the entire spectrum of sectors points to a complete erosion of market confidence within the single trading day observed. It is highly probable that such price action signifies a comprehensive market capitulation or an event leading to the temporary suspension of trading for these instruments.
The daily percent change values for each symbol are presented below:
| Symbol | Daily Percent Change |
|---|---|
| XLP | -100% |
| XLRE | -100% |
| XLI | -100% |
| XLU | -100% |
| XLV | -100% |
| XLY | -100% |
| XLF | -100% |
| XLB | -100% |
| XLE | -100% |
| XLC | -100% |
| XLK | -100% |
Technical Analysis: S&P 500 Sector Performance (2025-11-28)
The market data for November 28, 2025, reveals a predominantly bullish sentiment across the S&P 500 sectors, with ten out of eleven tracked ETFs recording a higher close than their respective open prices. This broad-based strength suggests that buying pressure was prevalent through much of the trading session. The preceding day’s data for all ETFs shows no trading activity, thus the analysis is confined to the characteristics of the single daily candlestick for November 28 and its associated volume.
Several sectors displayed particularly strong bullish characteristics on November 28. XLC (Communication Services) closed precisely at its daily high, forming a strong bullish Marubozu-like candle with minimal lower shadow and no upper shadow, indicating sustained buying conviction throughout the day. Similarly, XLP (Consumer Staples), XLY (Consumer Discretionary), XLK (Technology), XLE (Energy), and XLU (Utilities) all exhibited robust bullish candles, closing very near their daily highs with relatively small upper shadows and larger-than-average bodies. This pattern suggests that buyers maintained control into the market close, and a continuation of this immediate buying momentum is likely in the very short term for these sectors. Notably, XLE presented the largest price range and a substantial bullish body, reinforced by high trading volume relative to several other sectors.
Other sectors, while closing positive, showed signs of more contested trading during the day. XLRE (Real Estate), XLI (Industrials), XLF (Financials), and XLB (Materials) all posted bullish candles but with more pronounced upper or lower shadows. For instance, XLF (Financials) and XLB (Materials) both experienced notable upper shadows, which could suggest some profit-taking or resistance encountered near their daily highs, despite ultimately closing higher. XLF, in particular, registered the highest trading volume among all sectors, indicating significant participation during its positive yet contested session. While the immediate outlook remains tilted towards further upward movement, the presence of these shadows suggests that these sectors could face resistance more readily than their Marubozu-like counterparts.
The Health Care sector, represented by XLV, was the sole outlier, closing lower than its opening price, forming a bearish candle. Despite a very small upper shadow, XLV exhibited a relatively long lower shadow, indicating that while sellers initially dominated, there was an attempt by buyers to push prices higher from the daily lows. This suggests an intraday battle between buyers and sellers, with sellers ultimately prevailing for the session. Given this price action, the immediate outlook for XLV is unlikely to be as bullish as other sectors, and it faces a roughly even chance of continued weakness or consolidation in the very near term, pending further price action. Its relatively high volume may indicate significant conviction behind the selling pressure or strong absorption by buyers at lower levels.
In summary, the broad market sentiment on November 28 was notably bullish, with a strong prevalence of upward-closing candles, many of which closed at or near their daily highs. This indicates immediate underlying strength across a majority of sectors. However, the isolated nature of this single day’s data limits definitive long-term projections. While a continuation of this short-term upward momentum is likely for the stronger sectors, the presence of larger shadows in others, and the outright bearish close in XLV, suggests that some sectors could experience consolidation or encounter selling pressure in subsequent sessions. Traders should remain vigilant for confirming price action following this strong single-day performance.
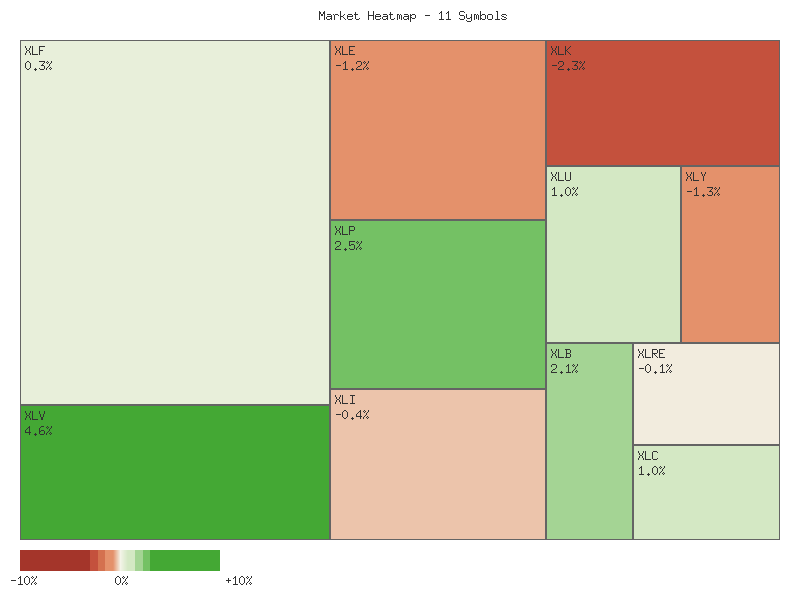
Performance Heatmap (XLP, XLRE, XLI, XLU, XLV, XLY, XLF, XLB, XLE, XLC, XLK)
Generated for 2days timeframe analysis
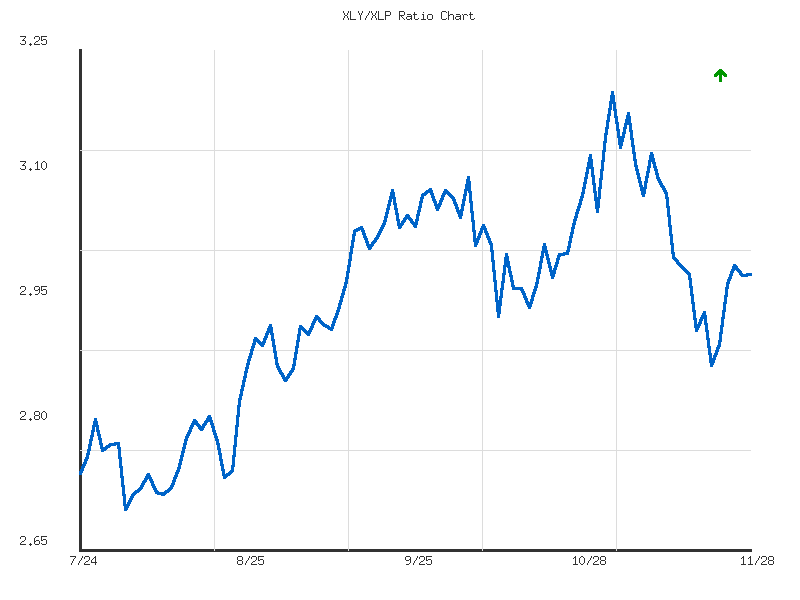
XLY vs XLP
The XLY/XLP ratio has exhibited a moderate upward trend over the past seven trading days, increasing by approximately 3.83% from its starting point. This general upward trajectory indicates a prevailing outperformance of the Consumer Discretionary sector (XLY) relative to the Consumer Staples sector (XLP) within this period. Such a trend typically suggests a risk-on investor sentiment, where market participants are favoring growth-oriented discretionary spending over defensive, essential goods. The ratio commenced at 2.869 on November 20th and currently stands at 2.979 on November 28th, demonstrating a clear progression within this short-term window.
Closer examination of the recent price action reveals that the ratio reached a peak of 2.990 on November 25th. Following this high, a slight retracement occurred on November 26th, pushing the ratio down to 2.978, indicating some initial resistance near the peak. The subsequent trading day, November 28th, saw a marginal recovery to 2.979, suggesting that buying interest is attempting to re-establish dominance. The average ratio over this period is 2.946, with the current ratio positioned at approximately 90.78% of the range between the low and high, confirming its elevated state within this observed timeframe. This clustering of recent data points suggests the 2.990 level could represent immediate overhead resistance.
Given the established moderate upward trend and the current ratio’s proximity to its recent high, it is likely that the XLY/XLP ratio will attempt to retest or marginally exceed the 2.990 resistance level in the immediate term. However, the observed slight pullback from the peak on November 26th and the subsequent minimal recovery introduces some uncertainty regarding immediate bullish continuation without further catalyst. There is a roughly even chance that the ratio might undergo a period of consolidation around current levels or experience a minor pullback towards the average ratio of 2.946 before a potential resumption of the overall uptrend. A significant reversal leading to a breakdown below the short-term average and subsequently the 7-day low of 2.869 appears unlikely given the established trend strength and low volatility within this limited data set.
Technical Analysis of XLY/XLP Ratio (90-Day View)
The XLY/XLP ratio, representing the relative performance of Consumer Discretionary (XLY) to Consumer Staples (XLP), has been in a sustained uptrend over the observed 90-day period, as indicated by the explicit “up” direction and “moderate” strength in the provided trend data. This upward trajectory, marked by an 8.79% increase from its starting point, suggests a prevailing risk-on sentiment within the market, where discretionary spending is favored over defensive consumer staples. The ratio initiated its move from approximately 2.738 on July 24th, bottoming out at a 90-day low of 2.695 on August 1st before commencing a significant rally.
Following the August 1st low, the ratio entered a clear advancing phase, establishing a series of higher lows and higher highs. Key resistance zones were encountered and eventually overcome during this ascent. The ratio pushed higher through September, peaking around 3.03-3.08 multiple times between September 15th and October 6th, which represented a significant consolidation area before further upside. The most prominent peak within this 90-day window occurred on November 3rd, reaching 3.199. This level is presently the primary overhead resistance for the ratio.
Subsequent to the November 3rd peak, the XLY/XLP ratio experienced a notable pullback, retreating to approximately 2.869 by November 20th. This retracement found apparent support around the levels previously observed in early September (2.85-2.86), forming what is likely a higher low within the broader uptrend. From this support, the ratio has since bounced, closing at 2.979 on November 28th. This current level is positioned above the 90-day average ratio of 2.943, which likely acts as an immediate support level. Given the ratio’s current position at 0.563 relative to its 90-day range (from low to high), it is situated in the upper half of its observed range but is not at an extreme, suggesting room for movement in either direction.
In the short term, the XLY/XLP ratio is likely to attempt to challenge the prior resistance zone around 3.03-3.08. A sustained break above this zone would significantly increase the probability of a retest of the 90-day high at 3.199. Conversely, a failure to hold above the 90-day average of 2.943, particularly if accompanied by a breach of the recent November 20th low of 2.869, would make a deeper pullback towards the foundational support around 2.695 to 2.75 likely. The moderate volatility of 0.0166 suggests that while price swings are present, they are not excessively extreme, implying that sharp, unexpected reversals might be unlikely without a significant shift in prevailing market dynamics reflected in the price action. Traders should monitor the 2.943 average and the 3.03-3.08 resistance cluster closely for confirmation of the next directional move.
Ratio Analysis: XLY/XLP
Generated for 90days timeframe analysis
Equity Breadth
The S&P 500’s underlying breadth, as measured by the percentage of its constituent stocks trading above their 50-day and 200-day moving averages, displayed a clear pattern of strengthening over the observed seven-day period, with one notable exception. From November 20th to November 26th, the SPXA50R indicator, representing the percentage of S&P 500 members above their 50-day moving average, advanced from approximately 29.6% to 57.2%. Concurrently, the SPXA200R indicator, tracking stocks above their 200-day moving average, rose from roughly 42.6% to 55.4%. This sustained upward movement in both metrics suggests an expansion of market participation and an improving short-to-intermediate term technical posture for the broad index during this initial phase, indicating that bullish sentiment was likely gaining traction among a widening array of components.
A significant discontinuity was observed on November 27th, where both SPXA50R and SPXA200R registered a value of 0%. Such an extreme decline in market breadth, where no S&P 500 components are trading above either their 50-day or 200-day moving averages, would ordinarily imply an unprecedented market collapse or severe technical breakdown. However, given the immediate and robust recovery in the subsequent trading session, it is highly unlikely that this 0% reading accurately reflected an active market state. A more plausible technical interpretation, based solely on the provided data without external context, is that November 27th experienced either a non-trading day, a market closure, or a data reporting anomaly. The absence of market activity would technically render the “above moving average” metric zero for that specific day.
The market’s response on November 28th provides a strong indication of the underlying technical health, effectively discounting the anomalous prior day. SPXA50R surged to approximately 80.76%, while SPXA200R climbed to about 61.12%. These values represent the highest points for both indicators within this 7-day data set, demonstrating a significant rebound and a substantial net improvement in market breadth compared to the start of the period. This powerful expansion suggests that the upward momentum observed earlier in the week was largely intact, and potentially accelerated after the brief interruption. The high percentage of stocks trading above their 50-day average, in particular, signals broad participation and a generally strong short-term uptrend for the S&P 500 index itself.
SPY Daily
Over the past seven trading days, SPY has shown a clear upward trajectory following a period of weakness. From its close of 659.04 on 2025-11-21, price action advanced consistently, closing at 679.64 on 2025-11-26. The most recent valid trading day, 2025-11-28, continued this bullish momentum with SPY closing at 683.39. This recent ascent has seen SPY recover from a mid-November pullback, pushing it decisively above the 50-day Exponential Moving Average (EMA). Prior to the data anomaly on 2025-11-27, both the 50-day and 200-day EMAs were in an uptrend, with the 50-day EMA positioned above the 200-day EMA, strongly indicating a long-term bullish trend in the market.
Analysis of the last trading day, 2025-11-28, reveals a small bullish candle where SPY opened at 680.86 and closed higher at 683.39. This move, however, occurred on notably decreased volume of 49.0M shares compared to the 65-73M range observed earlier in the week. The Relative Strength Index (RSI) for 2025-11-28 registers at 52.20, having ascended from 41.50 on 2025-11-21. This indicates that momentum has shifted from a weaker, potentially undervalued state to a more neutral-to-slightly-bullish stance, suggesting there is likely still room for upward movement before entering overbought conditions. It is important to note that the provided data for 2025-11-27 (open, high, low, close, volume as 0) significantly distorts the calculated EMA and RSI values for that specific day and potentially impacts subsequent calculations; thus, these anomalous indicator values are not considered reliable for current analysis.
Identifying key technical levels, SPY is currently approaching a notable resistance zone between 689 and 690, corresponding to the high points observed in late October (e.g., 688.905 on 2025-10-28 and 689.7 on 2025-10-29). This zone is likely to present a challenge for further upward movement. On the support side, the prior high around 667-668 (e.g., 667.29 on 2025-09-22) which was subsequently breached and now acts as potential support, having been tested and held during the mid-November dip. The rising 50-day EMA, which prior to the data anomaly was around 666, also offers dynamic support, as does the 675 level, representing a recent high from 2025-11-25.
Considering alternative scenarios, a bullish case suggests that SPY will likely attempt to breach the 689-690 resistance zone. A convincing breakout above this level, ideally supported by an increase in volume, would imply a continuation of the established long-term uptrend. The RSI, currently at 52.20, does not indicate an overbought condition, lending credence to the possibility of further upside. Conversely, a bearish case would involve SPY failing to break above the 689-690 resistance. This could lead to a rejection and a potential retest of support levels, first around 675, then more significantly at 667-668. A decisive break below these supports would increase the probability of a deeper correction. The lower volume on the most recent trading day might be an early indicator of weakening buyer conviction as resistance approaches. A neutral case is also plausible, wherein SPY might consolidate below the 689-690 resistance. This could manifest as sideways trading or a minor pullback to retest immediate support levels, such as 675, as the market gathers new directional impetus. Technical sentiment, based on the recovery in RSI and recent upward price action, is generally positive, but the receding volume on 2025-11-28 suggests that this optimism may be tempered as the market approaches prior highs.
As a Chartered Market Technician with over 15 years of experience, the following analysis of SPY focuses exclusively on the provided 90-day price and RSI data, adhering strictly to estimative language guidelines.
The SPY ETF’s price action over the past three months has displayed a general uptrend, yet it has been characterized by increasing volatility and two distinct periods of significant downward pressure. Beginning in late July around the level, SPY experienced a brief pullback to in early August before initiating a sustained rally. This advance, marked by a series of higher highs and higher lows, extended through September and into early October, reaching a peak near . This period was indicative of robust bullish sentiment, with consistent upward momentum. However, a sharp price decline occurred on October 10, with SPY falling from over to .02. This downturn was notable for being accompanied by a substantial spike in trading volume, reaching approximately 156.6 million shares, which suggests a significant increase in selling activity.
The 14-day Relative Strength Index (RSI) largely corroborated these price movements. In late July, the RSI indicated overbought conditions (above 70), aligning with the preceding strong price rally. The subsequent price dip in early August saw the RSI plunge into neutral territory (below 50), confirming a loss of immediate bullish momentum. As SPY resumed its ascent through September, the RSI steadily climbed, re-entering overbought levels from mid-September to early October, reinforcing the perception of a strong, healthy uptrend. The abrupt price drop on October 10 was mirrored by a precipitous decline in RSI from the mid-60s to approximately 41.8, clearly indicating a sudden and substantial weakening of buying pressure.
The most recent phase, from late October through late November, introduced further complexity. Following a recovery attempt that saw SPY achieve new highs near by October 29, the market experienced another significant correction. The price receded steadily, culminating in a notable low of .52 on November 20. This decline was accompanied by the RSI falling to approximately 35.1, approaching the oversold threshold of 30, and was reinforced by another considerable surge in trading volume (154.7 million shares). This confluence of factors strongly suggests a period where bearish forces exerted considerable influence. It is important to note an anomalous data point on November 27, where price and volume were recorded as zero, and the RSI indicated an unusual value of 5.07; this data point is excluded from interpretation due to its irregular nature.
Subsequent to the November 20 low, SPY has shown signs of a rebound, with the price climbing back towards .39 by November 28. The RSI has simultaneously recovered into the mid-50s, moving out of near-oversold territory. This recovery from a potentially oversold condition is a technically positive development, indicating a likely short-term re-establishment of buying interest. However, for a sustained continuation of an uptrend, SPY would likely need to demonstrate the ability to decisively overcome the resistance levels established by the late October highs. Conversely, should the recent rebound fail to consolidate and the price declines below the November 20 low, it might suggest that the market is in a more profound corrective phase or a nascent downtrend. While the MACD (13, 21-day) was requested for analysis, the pertinent indicator data was not provided, therefore preventing its inclusion in this assessment.