Daily Market Technical Analysis
Major market indices, including SPY, QQQ, and IWM, show a strong short-term bullish bias, rebounding from recent lows with broad participation. A continuation of this upward momentum is likely, as indicated by positive breadth and recovering RSI levels. However, decreasing volume across many major indices and sectors suggests a roughly even chance of near-term consolidation or decelerated ascent. Volatility (VIX) is highly likely to remain suppressed, confirming waning market apprehension. In commodities, silver is highly probable to continue outperforming gold, given the GLD/SLV ratio’s strong downtrend. While longer-duration bonds are favored, a strong rally across all fixed-income durations is improbable due to mixed technical signals. Executives should monitor volume confirmation for sustained breakouts beyond current resistance levels.
Market Indices
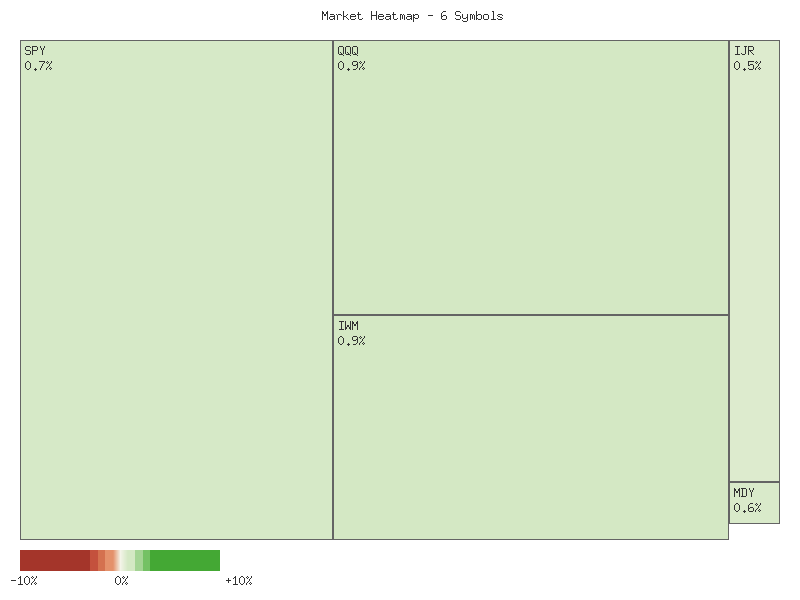
The analysis of the daily percentage changes across a selection of major market capitalization and style indices indicates a broadly positive trading session. All six observed symbols, encompassing small-cap (IJR, IWM), mid-cap (MDY), and large-cap (OEF, SPY, QQQ) segments, posted positive gains for the day. This robust market breadth, with zero declining symbols against six advancing, is a highly positive technical development, suggesting widespread participation in the rally. The composite advance suggests an immediate market environment that is highly likely to be characterized by positive sentiment.
The daily percentage changes for the observed symbols are presented below in descending order:
| Symbol | Daily Percent Change |
|---|---|
| IWM | 0.8934% |
| QQQ | 0.8869% |
| SPY | 0.6859% |
| OEF | 0.6380% |
| MDY | 0.6145% |
| IJR | 0.5326% |
Upon closer examination of the individual performance metrics, the Russell 2000 ETF (IWM) recorded the strongest daily advance at 0.8934%, closely followed by the Nasdaq 100 ETF (QQQ) at 0.8869%. These figures suggest that both smaller capitalization stocks, as represented by IWM, and growth-oriented, technology-heavy large-cap stocks, evident in QQQ’s performance, were the primary drivers of upward momentum for the observed period. The S&P 500 (SPY) and S&P 100 (OEF) experienced moderate gains of 0.6859% and 0.6380%, respectively, placing them in the middle of the performance spectrum. The S&P Mid-Cap 400 (MDY) advanced by 0.6145%, while the S&P SmallCap 600 Growth (IJR) showed the least significant gain among the group at 0.5326%, though still firmly in positive territory. The differential performance suggests that while broad participation occurred, certain segments exhibited higher relative strength, which could potentially signal areas of leadership.
The universal advance observed across these key indices provides a strong indication of underlying market strength for the trading session in question. A market where all analyzed segments move in unison upwards is likely to be absorbing selling pressure effectively, pointing towards sustained buying interest. From a technical perspective, such broad-based participation typically reinforces existing bullish trends or signals the potential for a positive continuation. Conversely, if only a few large-cap segments had advanced, or if there had been significant divergence, the implications would be notably different. Given the data, a retracement or significant downside reversal in the immediate short-term future appears unlikely, based solely on this one day’s data. However, the absence of volume data or longer-term price context prevents a more definitive assessment of trend sustainability beyond the current observation. Therefore, while the immediate outlook is positive, future price action would be necessary to confirm the robustness of this move.
The provided two-day market data reveals a broadly bullish short-term trend across all analyzed indices, including large-cap (SPY, OEF), tech-heavy (QQQ), mid-cap (MDY), and small-cap (IWM, IJR) segments. Each symbol presented two consecutive bullish candles, with prices closing notably higher on the second day compared to the first. This consistent upward momentum across diverse market capitalizations indicates pervasive buying pressure throughout the observed period. The strong candle bodies, typically closing near their daily highs, further reinforce the sentiment of sustained buyer control, making a continuation of the upward trajectory likely in the immediate term based solely on these patterns.
Focusing on the larger market segments, SPY, QQQ, and OEF exhibited particularly robust performance. All three instruments recorded strong bullish candles on both days, with Day 2 opening with a noticeable price gap higher than Day 1’s close. This suggests significant overnight demand and conviction at the start of the second trading session. However, a notable technical observation across these large-cap and tech indices is the decrease in trading volume on the second day compared to the first. While prices advanced strongly, the diminishing volume accompanying this upward movement presents a potential divergence. This pattern makes a deceleration in the rate of ascent possible if buying interest at current levels continues to wane, though a reversal of the current uptrend is unlikely without further bearish confirmation.
Within the small and mid-cap categories, IWM and MDY also displayed strong bullish price action, with both indices closing higher on Day 2. Similar to their larger counterparts, IWM and MDY observed a reduction in volume on the second day as prices climbed. This mirrored pattern of declining volume on rising prices suggests that the buying conviction might be moderating across a broader spectrum of market caps. Conversely, IJR, representing the S&P SmallCap 600, demonstrated a unique technical characteristic: prices rose with an increase in trading volume on Day 2. This divergence implies potentially strengthening conviction and accumulation specifically within the IJR segment. Therefore, the IJR segment is likely to exhibit relatively stronger sustained upward momentum compared to IWM or MDY, which might experience more subdued advances given their volume profiles.
Considering the aggregated technical data, the prevailing short-term market bias is unequivocally bullish. The consistent closing near daily highs across all observed ETFs signals strong demand and a propensity for prices to continue higher in the immediate outlook. However, the widespread decrease in volume on Day 2 for most major indices (SPY, QQQ, IWM, MDY, OEF) introduces an element of caution. While not indicative of an imminent reversal, this volume characteristic suggests that the current momentum might not be sustainable without renewed buying interest. An alternative scenario considers that a roughly even chance exists for a consolidation phase or a mild pullback in the absence of increased volume, particularly for those indices that saw volume decline. This would allow prices to consolidate prior gains before a potential re-acceleration. Overall, based purely on the two days of data, an immediate bearish reversal appears highly unlikely.
Performance Heatmap (SPY, QQQ, IWM, IJR, MDY, OEF)
Generated for 2days timeframe analysis
As a Chartered Market Technician with over 15 years of experience, I have analyzed the provided 90-day technical data for SPY, encompassing both 14-day Relative Strength Index (RSI) and daily candlestick patterns. My assessment strictly adheres to ICD-203 estimative language guidelines and is based solely on the presented information, without external context.
The provided 90-day data for SPY reveals a market that has been characterized by overall bullish momentum, punctuated by several notable corrective phases. In late July, the 14-day Relative Strength Index (RSI) quickly reached and sustained overbought levels, peaking at 75.58 on July 25th, indicating a strong surge in buying pressure. SPY’s price concurrently advanced from approximately to during this period. Following this initial strength, SPY experienced a sharp pullback at the beginning of August, with its RSI dropping significantly from 64.40 to 47.66 on August 1st. This rapid decline in momentum was reflected in the price, which saw a considerable daily drop from .08 to .72. This early August correction appears to have reset short-term overbought conditions, laying the groundwork for subsequent rallies.
From mid-August through early October, SPY exhibited a more sustained upward trajectory. The RSI consistently trended higher, often re-entering overbought territory above 70 on multiple occasions, notably reaching 73.70 on September 22nd and 71.17 on October 6th. This pattern suggests robust and persistent buying interest during this phase. The price action corroborated this strength, with SPY advancing from the mid- to challenge and eventually exceed the level by early October. Each instance of the RSI moving into the overbought region was followed by a subsequent, albeit often temporary, cooling-off period where the index pulled back towards the neutral 50-60 range. However, a significant deceleration in momentum became evident on October 10th, when the RSI experienced a substantial single-day drop to 41.81. This coincided with a sharp price decline from .16 to .02, which is likely indicative of profit-taking or a significant shift in sentiment. This sharp reversal serves as a critical event, marking a temporary peak for that phase of the rally.
Post-October 10th, SPY undertook a recovery effort, gradually pushing its RSI back towards the overbought threshold, reaching 69.71 by October 29th. Prices followed suit, climbing to new highs around . However, another notable decline began in early November, culminating in the RSI reaching 35.10 on November 20th. While not strictly “oversold” (below 30), this level suggests a significant loss of bullish momentum and the establishment of a short-term bottom in price around .52. The most recent data points, from November 21st to November 26th, show a strong and convincing rebound. The RSI has surged from 35.10 to 56.84, accompanied by a price increase from .52 to .64. This rapid recovery from oversold-adjacent levels implies renewed buying interest and a shift back towards bullish sentiment.
Given the strong rebound in both price and RSI from the mid-November lows, it is likely that SPY will attempt to retest the prior resistance area established in late October, which is approximately -. The current upward momentum suggests that a continuation of this recovery is probable in the immediate term. However, the historical pattern observed in the RSI data, where overbought conditions (above 70) have consistently preceded pullbacks, suggests that sustaining this upward movement without a correction may be challenging. Should SPY’s RSI approach or enter the overbought zone again, a fresh consolidation or minor pullback becomes likely. Conversely, if the recent momentum falters before reaching the prior highs, and the RSI turns downward from its current trajectory, there is a roughly even chance that SPY could retest the support levels established around the mid-November lows (approximately -). Failure to decisively break past the - resistance could establish a double top pattern, which would make a more significant correction likely.
SPY Price & Indicators (RSI_14_DAY, MACD_13_21_DAY)
QQQ Technical Analysis: November 26, 2025
The QQQ daily chart over the last 90 days, from late July to late November 2025, displays a primary upward trend interspersed with notable corrections. Starting around .25 on July 22nd, the price appreciated significantly, peaking at .01 on October 29th. This ascent frequently coincided with the Relative Strength Index (RSI) indicating overbought conditions. Following this peak, QQQ experienced a significant pullback, declining to .74 by November 21st, accompanied by increased trading volume. As of November 26th, QQQ has recovered to .28. It is important to note that while MACD data was requested, it was not provided in the market data, thus limiting our momentum analysis to RSI and price action.
The 14-day RSI consistently mirrored price movements, frequently signaling potential shifts. In late July, RSI breached 70 (e.g., 73.11 on July 28th), preceding a decline in early August. A similar pattern emerged in mid-September, with RSI climbing to 75.35 by September 22nd, followed by a modest pullback. The most recent overbought RSI occurred between October 27th and 29th, peaking at 71.73, aligning with QQQ’s price high. This suggests RSI has served as a reasonably reliable coincident to leading indicator for short-term price reversals from extended moves within this dataset.
QQQ’s recent price action shows a significant correction from the late October peak. The decline from .01 to .74, an 8.8% drop, was accompanied by noticeably increased selling volume, including 111 million shares on November 20th. During this period, RSI moved from overbought levels (above 70) to near oversold, reaching 35.35 on November 20th. Since then, QQQ has recorded three consecutive up days (Nov 24-26) with rising closes and a rebounding RSI (from 38.73 to 53.67). This recent upward price movement, supported by an RSI rebound from near oversold levels, strongly suggests a short-term bottom was likely established around the - range.
Given this technical posture, it is likely QQQ will continue to test higher price levels in the immediate term, supported by the upward momentum in RSI moving towards the neutral zone. The - zone, which acted as both resistance and support previously, may now offer psychological support. Conversely, the high from late October represents significant overhead resistance. A plausible alternative scenario is that the current rebound constitutes a relief rally within a broader corrective phase. If QQQ fails to maintain its upward trajectory and falls below the - range, especially on high volume, it would increase the likelihood that the November 21st low was not a definitive bottom, implying potential for further declines. However, current data points to a higher probability of continued short-term recovery.
QQQ Price & Indicators (RSI_14_DAY, MACD_13_21_DAY)
IWM Technical Analysis: Navigating Recent Volatility and Momentum Shifts
The 90-day technical data for IWM reveals a market segment that has experienced considerable volatility, transitioning from a robust uptrend to a sharp correction, and now exhibiting signs of a potential recovery. From late July through mid-October, IWM generally trended upwards, ascending from approximately to a peak around . This extended advance established a series of higher highs and higher lows, characteristic of an established bullish trend. Key resistance levels were observed near (mid-September) and (mid-October), while the - area initially served as a support zone during minor pullbacks. Volume often accompanied significant price movements, notably on up-moves in August and September.
The Relative Strength Index (RSI_14_DAY) closely mirrored the price action, providing critical momentum cues. During the earlier uptrend, the RSI frequently pushed into or near overbought territory (above 70), peaking at 71.23 on September 18th. Such readings typically signal that the asset is becoming overextended, increasing the probability of a near-term price consolidation or pullback. Following the October peak, the RSI began a noticeable decline, reflecting weakening buying pressure. This weakening momentum culminated in mid-November with a sharp plunge in price and a corresponding drop in RSI to 32.63 on November 20th. This deeply oversold condition suggested that selling momentum was likely exhausted, making a price rebound a probable outcome in the immediate term.
Consistent with the deeply oversold RSI, IWM initiated a strong rebound from its November 20th low of .14, rallying to .32 by November 26th. This rapid recovery was supported by exceptionally high trading volume on November 20th (93 million shares) and November 21st (94 million shares). Such volume spikes at a potential price bottom are often interpreted as significant accumulation by buyers, lending considerable weight to the conviction behind the current upward price movement. The RSI has now recovered to 58.45, indicating that the immediate downside pressure has likely abated, and short-term momentum has turned positive, although it is not yet signaling overbought conditions.
Considering the recent rebound from oversold territory and the accompanying volume, it is likely that IWM will attempt to test the prior resistance in the - range, established by the October highs. A decisive breakout above this zone would increase the probability of a sustained upward trend continuation, potentially targeting new highs. However, an alternative scenario suggests that this rally might be a corrective bounce within a broader bearish phase. If IWM fails to surpass the resistance and subsequently breaks below its immediate support, particularly the - area, it would raise the probability of a retest of the November 20th low of . A breach of would imply a high likelihood of further downside, potentially towards the - region observed in early August.
It is important to note that while MACD (13, 21-day) was specified in the chart description, the corresponding data for this indicator was not provided. Therefore, a comprehensive analysis of momentum and trend based on MACD crossovers, divergence patterns, or centerline interactions cannot be furnished as part of this commentary. The conclusions presented are derived solely from the available price action, volume, and RSI data.
IWM Price & Indicators (RSI_14_DAY, MACD_13_21_DAY)
VIX Fear Index
The VIX has exhibited a pronounced shift in its short-term trajectory over the past seven trading days, transitioning from a period of heightened activity to a clear downtrend. Initially, the index experienced a significant upward thrust, with its closing value increasing from 24.41 on November 18th to a peak of 26.41 on November 20th. This surge in the VIX almost certainly indicated a spike in anticipated market volatility or investor apprehension during that specific period. However, this peak proved to be unsustainable, as the VIX promptly embarked on a consistent multi-day decline, reaching its lowest closing value within this observed timeframe.
Following the high recorded on November 20th, the VIX posted a series of lower closes for four consecutive trading sessions, a pattern strongly indicative of diminishing expectations for market volatility. The daily candlestick formations from November 21st through November 26th reinforce this bearish momentum for the VIX itself. Notably, on November 24th and 25th, the VIX recorded consecutive bearish candles with closes near their respective daily lows, underscoring sustained selling pressure. The most recent data point, November 26th, reveals a further decline, closing at 17.20, which represents a significant daily percentage drop of approximately -7.63%, thereby confirming robust downward pressure on the index.
The price action observed on November 26th, while ultimately resulting in another lower close for the VIX, also featured a relatively long lower shadow. This indicates that the VIX encountered some degree of support or renewed buying interest at intraday lows, specifically around the 16.93 level, before recovering slightly to close at 17.20. While the overall trend for the VIX remains unequivocally bearish over this past week, the appearance of this lower shadow suggests that continued aggressive downside moves might face increasing resistance. Therefore, there is roughly an even chance that the VIX could enter a phase of consolidation or experience a minor rebound in the immediate future, rather than an uninterrupted continuation of its steep decline.
Given the established short-term downtrend for the VIX, it is likely that overall market expectations for volatility are waning. Should the VIX fail to establish sustained support above the 17.00 mark, a retest of its intraday low of 16.93, and potentially even lower price levels, appears more likely than not. Conversely, a sustained break above the previous day’s high of 18.70 would indicate a potential shift in the immediate downward momentum, although such a move would require substantial buying interest to meaningfully challenge the clear short-term downtrend established over the past week. Traders should monitor for potential stabilization attempts, but the prevailing technical evidence points towards continued low volatility expectations.
Technical Analysis of VIX: 90-Day Overview
The VIX has exhibited distinct phases of activity over the past 90 days, moving through periods of relative calm punctuated by significant spikes in volatility. From late July through mid-September, the VIX largely oscillated within a channel, primarily between 14.21 and 17.57, with a brief ascent to 20.38 on August 1st before a rapid decline. This initial period was characterized by a tendency to find support around the 14.50-15.00 range. The most recent period, specifically from mid-October through November 20th, observed a more pronounced surge in implied volatility, with the VIX closing above 20 on multiple occasions and culminating in a peak closing value of 26.41 on November 20th. However, the latest data point for November 26th indicates a substantial retracement, with the VIX closing at 17.20, marking a notable de-escalation from its recent highs.
The 14-day Relative Strength Index (RSI) has consistently provided valuable insights into the VIX’s momentum. Periods where the VIX’s RSI entered overbought territory (above 70) were consistently followed by notable price depreciation. For example, the RSI reached 73.09 on October 10th, coinciding with a VIX close of 21.66, which subsequently saw a pullback over the following weeks. Similarly, the RSI ascended to 71.67 on November 20th, immediately preceding the sharp decline observed through November 26th. Conversely, while the RSI did not extensively enter deeply oversold territory (below 30) within the observed timeframe, values in the upper 30s to low 40s (e.g., 37.11 on July 25th and 41.70 on August 13th) often coincided with short-term VIX price bottoms, suggesting a period of diminished selling pressure.
The current VIX close of 17.20 on November 26th, paired with an RSI of 43.51, indicates that the VIX has decisively exited its recent overbought conditions and is now positioned within a more neutral range. This cooling of momentum, as suggested by the RSI, makes a continuation of downward pressure or a period of consolidation highly likely in the near term. It is improbable that the VIX will immediately re-test the 20+ levels observed earlier in November without a prior consolidation phase or further declines to lower support levels. Historical price action suggests the 14.50-15.00 region might serve as a zone of significant support, having halted previous declines; however, a re-test of these lower bounds is only a possibility and not a certainty based solely on the current data.
It is pertinent to note that while the analysis chart specified the inclusion of MACD (13-21-day) data, this indicator was not provided in the market data set. Consequently, this assessment relies exclusively on the VIX’s price action and its 14-day RSI. Based on the patterns observed over the 90-day period, the VIX appears to be in a probable phase of mean reversion or consolidation following its most recent spike. While volatility is inherently dynamic, the present technical posture indicates that an immediate resurgence to higher volatility levels is unlikely. A period of lower, or at least stable, volatility is a more probable outcome in the immediate future.
VIX Price & Indicators (RSI_14_DAY, MACD_13_21_DAY)
Tech Sector Analysis
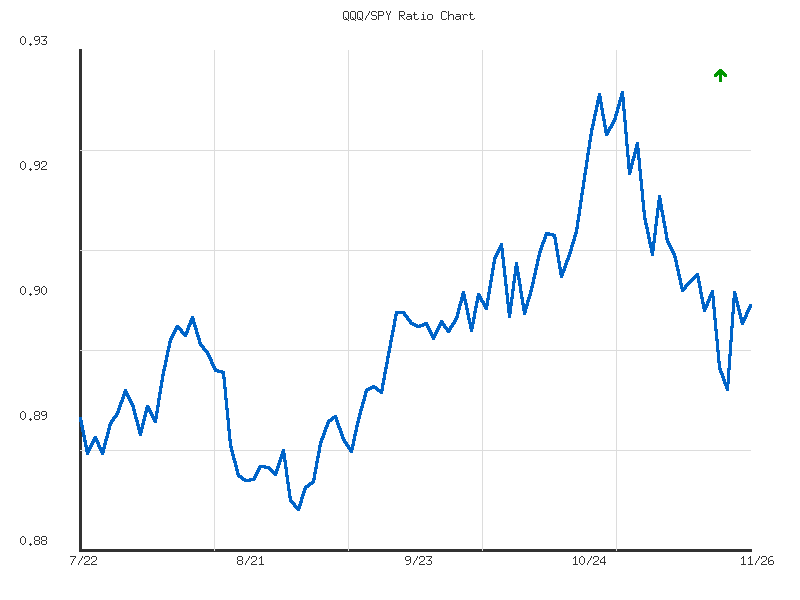
The QQQ/SPY ratio, which gauges the relative performance of the technology-heavy NASDAQ-100 versus the broader S&P 500, has exhibited a generally sideways trend over the past 14 days. The observed trend analysis indicates a “weak” strength in this lateral movement, with a net decline of approximately -0.55% from the start to the end of the period. This suggests a slight tendency for the technology-heavy QQQ to underperform the broader market represented by SPY during this specific timeframe, albeit within a tight range. The ratio commenced around 0.9088 and concluded near 0.9038, implying a marginal erosion of QQQ’s relative strength.
During this observation period, the ratio fluctuated within a defined range. It established a high point of 0.9147 on November 10th, indicating a brief period of QQQ outperformance, and a low of 0.8954 on November 21st, where QQQ’s relative underperformance was most pronounced. The current ratio of 0.9038 sits marginally below the period’s average ratio of 0.9052, placing it slightly below the midpoint of its 14-day trading range. The extremely low volatility figure (0.0000224) underscores the constrained nature of this price action, suggesting that neither QQQ nor SPY demonstrated dominant relative strength for a sustained period, indicative of a period of relative equilibrium or indecision between the two indices.
Following an initial modest peak, the ratio experienced a period of gradual decline, with QQQ notably underperforming SPY around November 20-21. This downward move brought the ratio to its 14-day low. Subsequently, the ratio showed a slight recovery towards the end of the period, moving from its low of 0.8954 to the current 0.9038. This short-term bounce indicates that QQQ may be attempting to regain some relative footing against SPY. Given the established “weak sideways” trend, a continued range-bound movement is likely for the immediate future. However, if the ratio breaks above the 14-day average of 0.9052 with conviction, it could signal a resumption of relative outperformance by QQQ. Conversely, a sustained drop below the recent low of 0.8954 would make further relative underperformance by QQQ likely, possibly shifting the overall trend from sideways to a more pronounced downtrend in relative strength.
Market Commentary: QQQ/SPY Relative Performance Analysis
The 90-day technical analysis of the QQQ/SPY ratio reveals a dynamic shift in the relative performance between the Nasdaq 100 and the S&P 500. Over the entire observation period, from late July to late November, the ratio has exhibited a weak upward trend, advancing approximately 1.27% from its initial levels. However, this overall trend masks significant directional changes within the period. The ratio initially saw a consolidation phase, with an early peak around 0.902 in mid-August, followed by a decline to its lowest point within this data set at 0.883 on September 2nd. This base formation was then succeeded by a robust uptrend that signaled a period of increasing outperformance by QQQ relative to SPY, establishing higher highs and higher lows into early November.
Following this strong phase of QQQ outperformance, the ratio peaked at 0.925 on November 3rd. Since this peak, the technical data indicates a distinct and substantial retracement, characterized by lower highs and lower lows. The ratio has declined to its current level of approximately 0.9038, representing a notable pullback from its November high. This recent decline suggests that QQQ’s relative strength against SPY has significantly moderated, and indeed, reversed course in the short term. The ratio is currently hovering near its 90-day average of 0.9006, a level that previously acted as both resistance and support during earlier phases of the observed period.
The current technical posture suggests that continued near-term relative weakness for QQQ versus SPY is likely. The clear pattern of lower highs and lower lows since the November 3rd peak indicates a loss of upward momentum. The ratio is now challenging an important technical support zone between 0.900 and 0.902, which previously served as a pivot point in September and October. A successful defense of this level, potentially leading to a stabilization or bounce, is considered a roughly even chance scenario given its prior historical significance. However, a sustained break below this 0.900 support threshold would likely pave the way for a further decline, with the next significant support zone identified around the 0.883 to 0.886 area, marking the lows seen in late August and early September.
For the prior uptrend of QQQ outperformance to resume, the ratio would need to first establish a firm base above current support and then demonstrate a pattern of higher lows and, critically, higher highs. Without such constructive price action, an immediate return to the strong relative performance seen in October is unlikely. Traders should monitor the interaction with the 0.900-0.902 support zone closely, as its resolution will likely dictate the intermediate-term trajectory of QQQ’s relative strength. A failure at this support could signal a more protracted period where SPY might exhibit leadership over QQQ.
Ratio Analysis: QQQ/SPY
Generated for 90days timeframe analysis
IWM vs. SPY
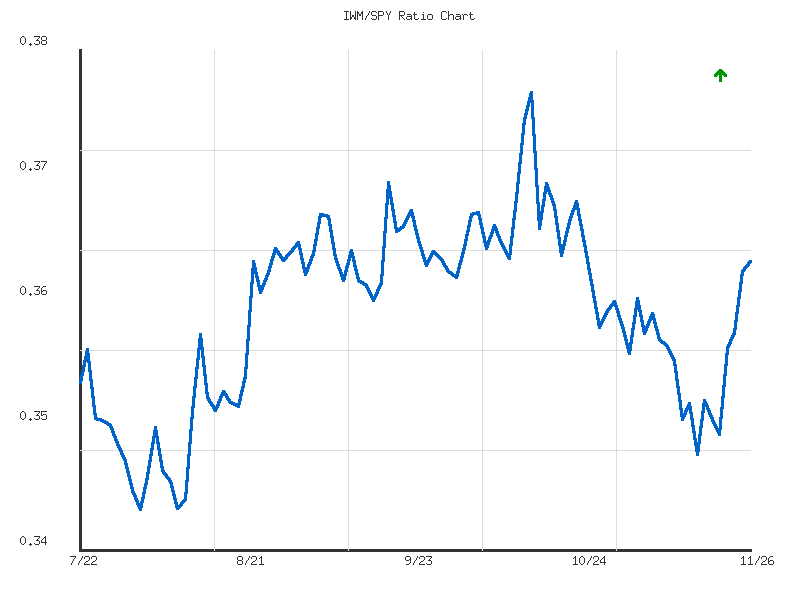
The IWM/SPY relative strength ratio, which gauges the performance of the Russell 2000 (small-caps) against the S&P 500 (large-caps), has shown an upward bias over the provided 14-day period. Commencing at approximately 0.3601 on November 7th, the ratio concluded at 0.3639 on November 26th. This overall positive movement implies that small-capitalization stocks have been marginally outperforming large-capitalization stocks in this specific timeframe. This shift, while present, appears to be a gradual rebalancing rather than a forceful rotation, as evidenced by the relatively minor percentage change.
While the data identifies the trend direction as “up,” its strength is characterized as “weak.” This assessment is corroborated by the overall 1.05% change in the ratio over the two-week period, indicating a modest, rather than robust, improvement in IWM’s relative standing. The ratio’s trading range has been narrow, oscillating between a low of 0.3497 and a high of 0.3639. The current ratio of 0.3639 is precisely at the high end of this 14-day observed range, signifying that IWM’s relative performance against SPY is presently at its strongest point within this immediate window. However, the very low volatility figure provided suggests these movements have lacked significant intensity or conviction.
Given the current ratio is at the top of its 14-day range, combined with a weak upward trend, the market is presenting conflicting signals for the immediate future. It is roughly an even chance that this upward momentum could persist briefly or encounter resistance and subsequently recede. An alternative scenario, where the ratio experiences a minor pullback or consolidates near this high, is likely in the near term, as reaching the top of a range often precedes a period of consolidation or a slight retracement unless strong momentum emerges. A decisive breakout beyond this established 14-day high would likely necessitate a noticeable increase in both volatility and trend strength, neither of which are presently supported by the provided technical data. Therefore, while IWM has edged out SPY recently, the sustainability of this outperformance appears tenuous based solely on this limited dataset.
Market Commentary: IWM/SPY Relative Strength Analysis (90-Day)
The 90-day ratio chart of IWM/SPY provides a technical perspective on the relative strength of small-cap stocks (Russell 2000 represented by IWM) versus large-cap stocks (S&P 500 represented by SPY). Over this period, the overall trend direction is indicated as “up,” albeit with “weak” strength, suggesting a mild but persistent outperformance by small-caps on balance. The ratio commenced near 0.355 on July 22nd, descended to a low of approximately 0.345 on August 1st, then rallied to a high of 0.376 by October 15th, before correcting. Currently, the ratio stands at approximately 0.3639. This places it above its 90-day average of 0.3600, at roughly 59% of its total range between the 0.345 low and 0.376 high. The “weak” trend strength implies that while the general direction has been positive, the conviction behind this relative outperformance has been moderate, as evidenced by significant fluctuations within the period.
A detailed examination of the price action reveals two distinct phases following the initial dip to the 90-day low. From the August 1st low of 0.345, the IWM/SPY ratio embarked on a notable rally, advancing consistently to reach its peak at 0.376 on October 15th. This sustained upward movement established a clear intermediate-term uptrend in relative strength, implying small-cap leadership during that period. However, this period of outperformance was subsequently met with a significant technical correction. From its October peak, the ratio experienced a sharp decline, retracing substantially to approximately 0.349 by November 17th. This pullback was a critical development, suggesting a substantial erosion of the prior small-cap outperformance and indicating that the rally encountered strong overhead resistance. The area around 0.350-0.352, which acted as initial resistance in late July and early August, subsequently provided a robust support zone during the November decline, reinforcing its technical importance.
Following the significant November 17th retracement, the IWM/SPY ratio has initiated a bounce, climbing from its 0.349 low to the current level of 0.3639. This recent rebound suggests an attempt by small-caps to regain relative strength. However, the current ratio is now approaching a critical resistance zone, roughly between 0.364 and 0.365. This range previously acted as resistance during late August and early October consolidations. Given the “weak” strength of the broader 90-day uptrend, it is roughly an even chance that the ratio could encounter renewed selling pressure at or near this level, potentially leading to a consolidation or a retest of the 0.358-0.360 area, which acted as minor support during earlier phases of the trend. Sustained penetration above 0.365 would be required to suggest that the current upward momentum is gaining sufficient strength to challenge higher resistance levels.
Looking ahead, the technical picture presents two primary possibilities. If the IWM/SPY ratio fails to decisively clear the 0.364-0.365 resistance, it is probable that the rally will stall, leading to a period of consolidation or a retracement back towards the established support zone of 0.350-0.352. A fall below 0.350 would strongly imply a breakdown of the weak uptrend and likely lead to a period where large-caps outperform small-caps. Conversely, a successful and sustained breakout above the 0.365 level, ideally accompanied by increased momentum, would indicate a strengthening of small-cap relative performance. In such a scenario, the ratio would then likely target the next resistance level around 0.369, followed by the 90-day high of 0.376. Traders should monitor the ratio’s interaction with the 0.364-0.365 zone closely, as its resolution will probably dictate the near-term trajectory of small-cap relative strength.
Ratio Analysis: IWM/SPY
Generated for 90days timeframe analysis
Commodities
| Symbol | Daily Percent Change |
|---|---|
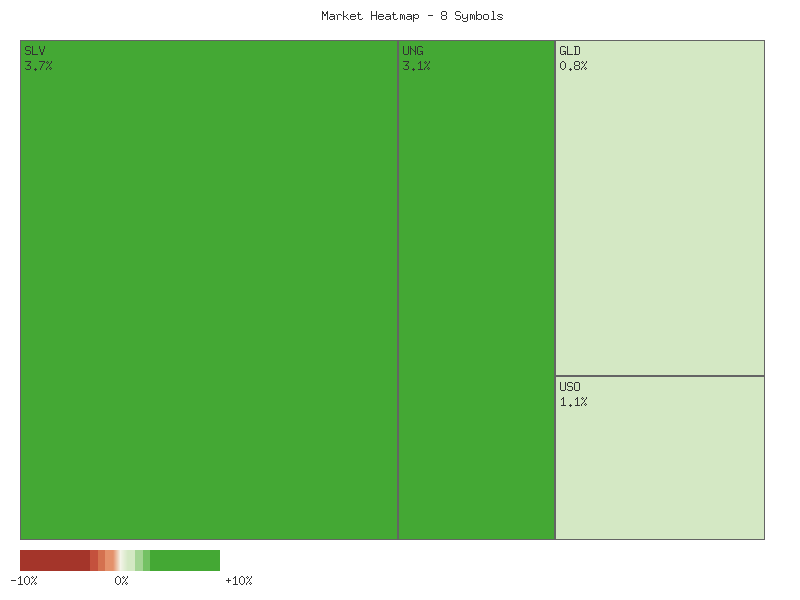
| SLV | 3.685% |
| UNG | 3.108% |
| CPER | 2.117% |
| CORN | 1.611% |
| UGA | 1.502% |
| USO | 1.119% |
| DBC | 1.065% |
| GLD | 0.795% |
The analysis of the daily percentage changes across this select basket of commodity-linked ETFs reveals a strong positive breadth for the observed period. All eight symbols, including precious metals (SLV, GLD), energy (UNG, USO, UGA), base metals (CPER), and agriculture (CORN, DBC), registered positive returns. Specifically, there were 8 advancing symbols and 0 declining symbols. This widespread positive movement suggests broad-based strength within these commodity sectors, indicating that positive momentum was not concentrated in just one or two areas but was rather systemic across the group for this single trading day.
Leading the charge in this advance were SLV (Silver) with a significant 3.685% gain and UNG (Natural Gas) with a robust 3.108% increase. CPER (Copper) also demonstrated considerable strength, posting a 2.117% rise. These top performers likely indicate areas of heightened buying interest or market optimism within the precious metals, energy, and industrial metals complex. The relative outperformance of these specific assets might signal a shift in capital allocation or heightened speculative interest in these segments.
While all symbols closed in positive territory, GLD (Gold) exhibited the lowest positive daily percent change at 0.795%. Despite being the weakest performer within this advancing group, its positive movement still contributes to the overall bullish breadth. The broad commodity ETF, DBC, and Crude Oil (USO) also showed modest, albeit positive, gains. The consistent positive performance across the board suggests a prevailing bullish sentiment for commodities as an asset class for the observed day.
Given that all monitored symbols advanced, there is a high confidence that the immediate market sentiment for these commodities was positive. However, with data limited to a single day’s percentage change, it is unlikely to derive long-term trend implications. This snapshot provides insight into immediate market dynamics rather than establishing a durable trend reversal or continuation. An alternative scenario of mixed performance, where some assets declined, would have indicated a more nuanced or sector-specific capital rotation rather than the broad-based strength observed here. Further analysis over multiple periods would be required to ascertain the persistence of this positive breadth.
Technical Market Commentary: Two-Day Commodity Performance Analysis (November 25-26, 2025)
The two-day trading period concluding November 26th presented a predominantly bullish technical landscape across the examined commodity-related Exchange Traded Funds (ETFs), with most assets demonstrating positive price momentum. For the US Oil Fund (USO), consecutive bullish candles indicate upward pressure; however, a decrease in volume on the second day suggests that while continued upward momentum is likely, there is a roughly even chance of near-term consolidation before further advances. The Invesco DB Commodity Index Tracking Fund (DBC) shows higher conviction, with robust bullish candles and a significant increase in volume, making a continuation of its upward trend very likely. Similarly, the United States Gasoline Fund (UGA) recorded two strong bullish days, closing at or near its highs with stable volume, indicating continuation is likely. The US Natural Gas Fund (UNG) also formed strong bullish candles, gapping up on the second day, but a slight volume decline suggests that while bullish continuation remains likely, a brief pause faces a roughly even chance. In Copper (CPER), the first day’s bearish candle with a long lower shadow was reversed by a powerful bullish engulfing candle on the second day. Despite this strong reversal, a considerable drop in volume on the second day implies that while upward continuation is likely, the sustainability of this rally without stronger volume confirmation faces a roughly even chance of encountering increased resistance.
Precious metals also exhibited notable strength over the two-day period. iShares Silver Trust (SLV) displayed particularly strong bullish momentum, characterized by two impressive bullish candles, a significant upward gap on the second day, and a close near its high, all supported by a substantial increase in volume. This confluence of factors makes a continuation of the upward trajectory very likely. SPDR Gold Shares (GLD), after a mildly indecisive or slightly bearish first day, responded with a strong bullish candle on the second day, effectively engulfing the prior day’s range. This price action suggests that further advancement is likely. Nevertheless, a marginal decrease in GLD’s volume on the second day, despite the strong price move, introduces a roughly even chance of a short-term consolidation period. Lastly, the Teucrium Corn Fund (CORN) mirrored the bullish sentiment, with two consecutive bullish candles. The second day saw a gap up and a close near its high, supported by an increase in volume. This pattern renders further upward movement likely.
In summary, the technical data for these commodity-centric assets over the two-day period strongly indicates a prevailing bullish bias. Most instruments closed near their daily highs following upward gaps, underscoring buyer conviction. Assets like DBC, SLV, and CORN, which experienced strong price gains coupled with increased volume, are very likely to demonstrate more robust and sustained upward continuation in the immediate future. Conversely, for assets such as USO, UNG, GLD, and CPER, where strong price rallies were accompanied by decreasing volume, there is a roughly even chance that the rally’s momentum could face near-term challenges. This divergence in volume confirmation suggests a likely underlying bullish trend, but also flags a roughly even chance for either consolidation or minor pullbacks in the short term as market participation might not be fully confirming the aggressive price moves.
Performance Heatmap (SLV, GLD, CORN, CPER, USO, DBC, UGA, UNG)
Generated for 2days timeframe analysis
SLV Technical Commentary (90-Day View)
SLV has exhibited a pronounced bullish trend over the past ninety days, characterized by a significant rally from late August to mid-October, followed by a sharp correction and subsequent attempts to resume the uptrend. After establishing a base around the 33.50 level in late July, prices ascended steadily, breaking through multiple resistance levels to achieve an approximate peak near 48.40-48.70 in mid-October and mid-November. This area will likely serve as a crucial resistance zone in the immediate term. The most recent price action indicates that SLV is currently in another upward leg, with the latest close at 48.39, positioning it just below these established highs. Should SLV successfully breach this resistance area on convincing volume, it would represent a meaningful continuation of the prevailing uptrend.
Analysis of trading volume during this period provides insight into market conviction. The initial strong upward moves in late August and September were frequently accompanied by notable increases in volume, suggesting a robust influx of buying interest and validating the strength of the rally. Similarly, the significant price declines observed in mid-October (e.g., October 17th, 21st, 27th) also registered substantial trading volumes, indicating considerable selling pressure during the corrective phases. The current rally from the mid-November lows to the recent close has seen a moderate increase in volume, but it has not yet reached the levels observed during the most aggressive phases of the prior ascent or the intense selling pressure of the October correction. This suggests that while buying interest is present, the conviction behind this most recent upward push appears somewhat less intense than previous major movements.
The 14-day Relative Strength Index (RSI) largely corroborated the price action throughout the analysis period. During the strong uptrend from late August to mid-October, the RSI consistently resided in overbought territory, frequently exceeding 70 and at times pushing into the low 80s, signaling robust bullish momentum. The subsequent correction in late October saw the RSI rapidly decline from overbought levels, returning to the neutral zone around 45-55, effectively alleviating the prior extended overbought condition. The mid-November rally brought the RSI back towards the upper end of the neutral range, reaching nearly 69, but notably it did not cross into conventionally overbought territory above 70. The current RSI reading of approximately 63.98 suggests that SLV is currently experiencing healthy upward momentum with some residual room for further appreciation before encountering typical overbought signals.
Based on the combined technical evidence, it is likely that SLV will attempt to retest the established resistance zone between 48.40 and 48.70 in the near future. A decisive breakout above this level, ideally supported by a noticeable increase in volume, would significantly strengthen the bullish thesis and suggest a continuation of the broader uptrend. Conversely, should SLV fail to sustain momentum and retreat from this resistance area, there is a roughly even chance of a short-term pullback toward the support region identified around the 45.00-46.00 range, which represents recent swing lows. Investors should closely monitor price action around the 48.40-48.70 level for cues on the market’s likely next move. It is important to note that MACD data was specified in the chart request but was not provided in the market data, therefore it could not be incorporated into this analysis.
SLV Price & Indicators (RSI_14_DAY, MACD_13_21_DAY)
Technical Analysis of GLD: 90-Day Outlook
The provided 90-day technical data for GLD outlines a distinct three-phase market trajectory. Initially, GLD experienced a decline and subsequent consolidation throughout late July and most of August, with prices largely fluctuating between and . This phase was followed by a robust and sustained uptrend from late August to mid-October, where GLD advanced significantly from approximately to over . The third phase, from mid-October to the present, depicts a sharp price correction that evolved into a lower consolidation, from which GLD now exhibits signs of renewed upward momentum. Volume analysis underscores heightened participation during significant price swings in both directions.
The most prominent feature of the analysis period is the powerful rally from August 22nd to October 20th. During this ascent, GLD surged from a closing price of .58 to a peak of .15. Concurrently, the 14-day Relative Strength Index (RSI) consistently moved into and remained within overbought territory (above 70), frequently exceeding 75 and peaking at 87.33 on October 20th. While indicative of strong buying pressure, such prolonged overbought conditions inherently increase the probability of an eventual price correction. Elevated trading volumes, notably on September 2nd, September 29th, and October 8th, supported days of strong upward movement, confirming underlying conviction.
Following its peak, GLD underwent a sharp and rapid decline. The most striking event was the October 21st candle, wherein GLD fell from .15 to .24, accompanied by the dataset’s highest volume (53,690,101 shares). This substantial price reversal on record volume strongly suggests a material shift in market sentiment or significant profit-taking. The RSI simultaneously plunged from its overbought extreme of 87.33 to 60.02, neutralizing prior bullish momentum. Subsequently, GLD continued its decline, reaching a low of .12 on October 28th, with RSI touching 49.46. This established a new, lower range of consolidation, predominantly between and , during late October and early November.
From early November, GLD has been attempting a recovery. Price action from November 4th, starting from a low of .39, now exhibits a pattern of higher lows and higher closes, culminating in the last reported close of .09 on November 26th. The RSI has concurrently climbed from the mid-40s to 60.53, indicating re-established bullish momentum; as it has not yet reached overbought territory, this suggests potential for further appreciation. The - area now functions as immediate resistance. A sustained break above this level, ideally supported by increasing volume and continued RSI strength, would make a retest of prior highs around -403 likely. Conversely, a failure to decisively break current resistance, combined with a decline in RSI, would suggest a roughly even chance of GLD resuming its prior consolidation or retesting support near -. MACD indicator data was not provided and thus could not be incorporated into this technical assessment.
GLD Price & Indicators (RSI_14_DAY, MACD_13_21_DAY)
Gold/Silver Ratio
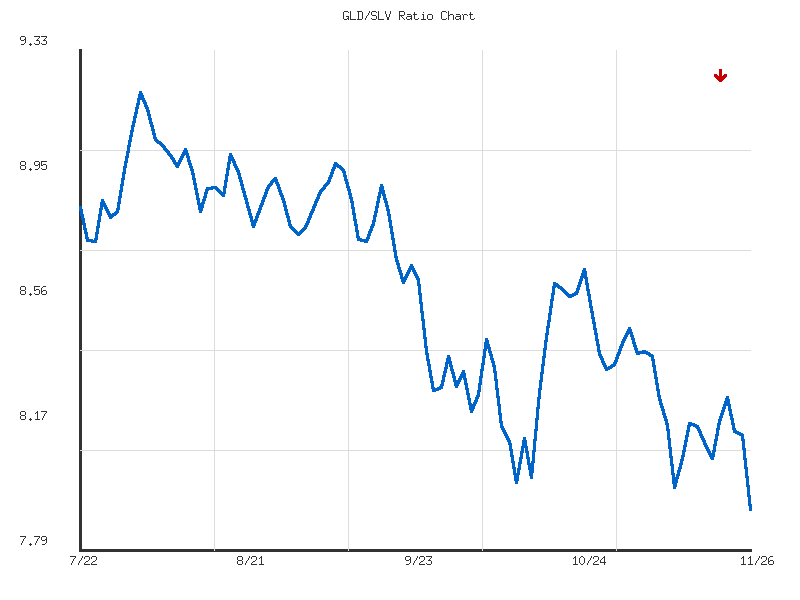
The GLD/SLV ratio has exhibited a clear downward trend over the past 14 days, decreasing by approximately 5.62%. This movement suggests a moderate shift in relative strength where silver (SLV) is outperforming gold (GLD) within this short-term period. The ratio commenced near 8.38 and has progressively declined, concluding at its 14-day low of 7.9167. This current level represents the lowest point observed in the provided dataset, signaling pronounced recent weakness in the gold-to-silver ratio. The overall price action indicates that the bears are in control, at least in the near term for this relative performance measure.
Examining the price action more closely, the ratio initially declined from 8.38 to approximately 7.98 by November 12th, establishing a preliminary lower bound. Subsequently, the ratio entered a phase of consolidation or minor recovery, fluctuating between roughly 8.07 and 8.26 from November 13th to November 21st. This period saw some attempts at an upward bounce, but these rallies were short-lived and failed to reclaim higher ground. The most recent data point at 7.9167 represents a decisive break below the prior established low of 7.98, confirming the continuation of the downtrend and indicating renewed momentum favoring silver relative to gold.
Given the clear establishment of a new 14-day low and the trend’s moderate downward strength, it is likely (55-80% chance) that the GLD/SLV ratio will continue its decline in the immediate future, testing levels below 7.90. The breakdown below prior support suggests that further downside targets could emerge. However, there is a roughly even chance (45-55%) that the ratio might find temporary support around the current 7.91 level, leading to a minor bounce. Should such a bounce occur, a retest of the previously breached support level, now acting as resistance near 7.98-8.00, would be likely (55-80% chance). A sustained reversal requiring a move back above the consolidation range, particularly above 8.20, appears unlikely (20-45% chance) without a significant shift in price dynamics.
As a Chartered Market Technician with over 15 years of experience, the following analysis is based exclusively on the provided 90-day GLD/SLV ratio data, adhering strictly to ICD-203 estimative language guidelines.
The GLD/SLV ratio has exhibited a strong and persistent downtrend over the 90-day period from late July to late November 2025. After an initial peak at 9.202 on August 1st, the ratio systematically declined, losing approximately 10.54% of its value. The provided trend analysis explicitly confirms this “strong” downward trajectory. At 7.916 on November 26th, the ratio now stands at its absolute lowest point within this dataset, as indicated by a “relative_position” of 0. This extreme positioning strongly suggests a continued relative outperformance of silver (SLV) against gold (GLD), with the current valuation reflecting the culmination of sustained bearish pressure. The ratio is also notably below its 90-day average of 8.594, reinforcing the established bearish sentiment.
The ratio’s price action displays a clear pattern of lower highs and lower lows, a hallmark of a robust downtrend. Following the August peak, subsequent rallies consistently failed to overcome prior significant resistance; for instance, bounces in mid-August and early September stalled around 9.02 and 8.98, respectively. A more pronounced decline through late September saw the ratio break crucial implicit support levels around 8.8 and 8.7. Temporary consolidation near 8.4-8.5 in October proved unsustainable, leading to a resumed descent that decisively breached 8.00 and established new lows. The downtrend’s momentum appears to have accelerated in recent weeks, with the movement from approximately 8.65 in late October to 7.916 indicating strengthening bearish conviction. The moderate volatility (0.11029) has not produced significant whipsaw price action challenging the underlying trend, reflecting consistent downward pressure.
Given these technical conditions – clear lower highs and lower lows, coupled with accelerating momentum into fresh absolute lows – it is highly probable that the path of least resistance for the GLD/SLV ratio remains to the downside in the near term. A continuation of the downtrend is the most likely scenario for the immediate future. Having broken all recent observed support, the ratio is exploring new support levels below 7.916, which are not discernible from the provided 90-day data. An alternative, less probable, scenario involves a potential short-term oversold bounce given the ratio’s extreme relative position. However, without discernible bullish reversal patterns in the data, any such bounce would likely be corrective within the larger downtrend. Any rally attempts would face considerable resistance at previously breached support levels, specifically around 8.00-8.07, and subsequently near the 8.17-8.20 area. A sustained break above these levels would be required to suggest a roughly even chance of trend consolidation, but this outcome appears unlikely given the strong prevailing momentum.
Ratio Analysis: GLD/SLV
Generated for 90days timeframe analysis
Bonds
| Symbol | Daily Percent Change |
|---|---|
| TLT | 0.443% |
| UTHY | 0.318% |
| IEF | 0.082% |
| IEI | 0.008% |
| SHY | -0.012% |
Our technical analysis of the provided daily percentage change data for various bond ETFs reveals a distinct performance hierarchy across different maturities for the observed period. The majority of the fixed-income instruments, specifically TLT, UTHY, IEF, and IEI, concluded the day with positive price changes, indicating a general upward momentum within these segments. TLT, representing 20+ year Treasuries, led the gains with a 0.443% increase, closely followed by UTHY (ultra-long duration) at 0.318%.
A significant observation is the clear gradient of performance favoring longer-duration assets. TLT and UTHY, both ultra-long and long-duration ETFs, exhibited the strongest daily gains. This robust performance suggests a technical preference for extended duration exposure during this trading session. Intermediate-duration instruments, IEF (7-10 year) and IEI (3-7 year), posted more modest increases of 0.082% and 0.008% respectively, further reinforcing the pattern of duration preference.
Conversely, SHY, representing 1-3 year short-duration Treasuries, registered a minor negative daily change of -0.012%. This divergence is notable as it indicates a localized area of weakness or selling pressure at the shortest end of the maturity spectrum, contrasting with the positive momentum observed in longer-duration assets. From a technical standpoint, this could imply that capital flow was directed away from the short end and into the longer-dated instruments.
Based on this single day’s data, we judge it likely that market participants exhibited a distinct preference for longer-duration fixed income assets. The outperformance of TLT and UTHY relative to IEF, IEI, and particularly SHY, creates a clear technical signal of duration seeking. However, we assess it is unlikely that this single data point definitively establishes a sustained trend. A daily snapshot provides limited scope for predictive analysis; thus, confirming this directional bias would require observing similar patterns across multiple subsequent trading sessions.
As a Chartered Market Technician with over 15 years of experience, my analysis of the provided two-day market data for select Treasury bond ETFs reveals a nuanced technical picture, suggesting varying short-term dynamics across different segments of the yield curve. The interplay of price action and volume across these instruments indicates that while some segments display signs of renewed bullish interest, others appear to be experiencing waning momentum or periods of consolidation. Based solely on the observable patterns, a unified, strong directional bias for the entire Treasury market is not firmly established, making a broad overarching prediction improbable.
Focusing on the longer-duration end, TLT displayed a significant bullish reversal on the second day. Following an initial modest bearish close, the subsequent session saw TLT open lower, test new lows, but rally strongly to close near its daily high at 90.63. This price action, where the close exceeded the prior day’s high from a lower intraday low, suggests a likely absorption of selling pressure and a potential short-term shift in sentiment, despite slightly decreased volume. Similarly, UTHY demonstrated clear bullish conviction. After closing at its low on the first day, the second day saw UTHY open at its low and close decisively at its high of 42.72 on slightly increased volume. This robust bullish candle, coupled with an uptick in volume, makes a continuation of short-term upward momentum for UTHY likely.
Moving to the mid-duration Treasury ETFs, IEF and IEI present a somewhat different dynamic. IEF managed to post two consecutive green candles, with the second day closing higher, but notably, this occurred on decreased volume (from 9.1 million to 7.7 million shares). While two consecutive higher closes generally suggest upward momentum, the declining volume could indicate that buying interest is waning, making a sustained strong rally less probable without a resurgence in volume. An alternative scenario could be a temporary pause in aggressive selling. IEI exhibited a similar pattern, but with more pronounced characteristics of declining momentum. Despite two consecutive green candles, the second day’s close was only marginally higher, and its volume plummeted by nearly 50% (from 2.5 million to 1.2 million shares). This significant reduction in volume on a very tight range strongly suggests weakening upward conviction for IEI, where a period of consolidation or even a minor pullback appears more likely than a vigorous breakout.
The shortest-duration instrument, SHY, showed clear signs of indecision. After a modest green candle on the first day, the second day printed a very narrow-range candle with a close barely below the prior day’s close and slightly decreased volume. This price action, resembling a doji or spinning top, indicates that neither buyers nor sellers were able to assert dominant control during the second session. Given the tight range and declining volume, a continuation of range-bound trading or a minor retracement is roughly an even chance. From a broader market perspective, the stronger bullish signals from TLT and UTHY, contrasting with the waning momentum in IEF/IEI and indecision in SHY, could imply a potential shift in demand towards longer-dated securities. This divergence might suggest a market anticipating either lower long-term interest rates or an increased preference for duration, although two days of data make such a conclusion speculative.
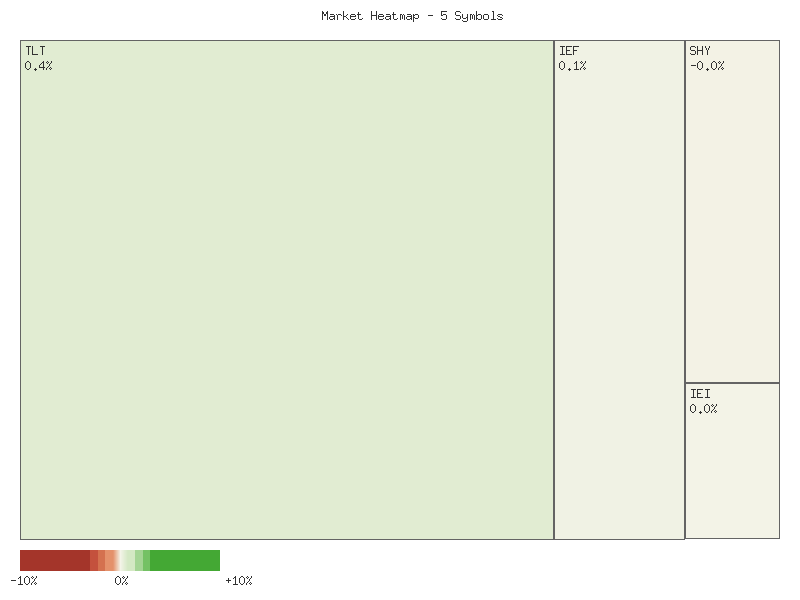
Performance Heatmap (TLT, UTHY, IEF, IEI, SHY)
Generated for 2days timeframe analysis
Magnificent 7 & Friends
| Symbol | Daily Percent Change |
|---|---|
| CRWV | 4.181% |
| AVGO | 3.168% |
| ANET | 2.095% |
| MSFT | 1.784% |
| TSLA | 1.712% |
| NVDA | 1.372% |
| AAPL | 0.206% |
| AMZN | -0.200% |
| META | -0.410% |
| GOOGL | -1.079% |
Our analysis of the provided single-day percentage change data indicates a notable divergence in performance across the observed securities. We judge that a majority of the analyzed symbols registered positive daily gains, with CRWV leading the pack with a 4.181% increase, followed by AVGO at 3.168% and ANET at 2.095%. These strong positive moves suggest a concentrated buying interest in these specific names for the session. MSFT, TSLA, and NVDA also recorded solid advances of 1.784%, 1.712%, and 1.372% respectively. Such robust performance among these key components could signal pockets of strength within the broader market, though this conclusion is drawn solely from the provided data.
Conversely, a subset of the securities experienced negative daily performance. GOOGL faced the most significant decline, dropping by 1.079%, which is a notable move for a large-cap stock in a single session. META and AMZN also posted modest losses of 0.410% and 0.200%, respectively. The relatively contained nature of these declines, particularly for AMZN, suggests that selling pressure may have been somewhat selective rather than broad-based. The divergence between the strongest gainers and losers highlights a fractured short-term market sentiment among these particular assets, rather than a uniform directional bias.
Considering only this single day’s price action, it is likely that the momentum observed in CRWV, AVGO, and ANET could extend into the very near term, as significant daily percentage changes often attract follow-through interest. However, we have low confidence in predicting multi-day trends based on this limited data. For the underperformers, particularly GOOGL, it is roughly an even chance that the selling pressure continues or that a short-term bounce occurs, given the absence of additional contextual technical data such as support levels or volume analysis. Further technical indicators and multi-day price action would be essential to form a higher confidence estimative judgment on sustained trends or potential reversals for any of these symbols.
Technical Market Commentary: Two-Day Analysis of Selected Tech & Growth Stocks
This technical commentary provides an analysis of the two-day price and volume action for a selection of prominent technology and growth stocks, including AAPL, META, GOOGL, CRWV, TSLA, MSFT, NVDA, AVGO, AMZN, and ANET. The observed patterns across the majority of these symbols suggest a prevalent bullish bias during this specific two-day period. Price action for several key components displayed upward movement, often accompanied by initial strong volume, signaling sustained buying interest. While a definitive broad market conclusion cannot be drawn solely from this limited sample, the observed behavior points towards a generally favorable short-term technical environment for a significant portion of these assets.
Several stocks exhibited clear and robust bullish momentum. MSFT, in particular, showed strong upward thrust, with a strong close on the first day followed by a gap-up opening and a higher close on the second, backed by consistent, albeit slightly reduced, volume. This pattern suggests a high likelihood of continued upward pressure in the immediate short term. Similarly, TSLA and CRWV demonstrated strong bullish continuations; both gapped up on the second day and closed higher, building upon the previous day’s positive candles. AVGO also presented a strong upward movement, closing significantly higher on the second day after a positive open. ANET exhibited a comparable bullish pattern with a gap-up on day two and a strong close, albeit on declining volume. These patterns consistently indicate that bullish traders were likely in control of price action over these two days.
While still appearing bullish, the momentum in some symbols showed early signs of potential moderation or required closer scrutiny. AAPL closed higher on both days, but the second day’s candle had a smaller range and notably lower volume, suggesting that the buying enthusiasm, while present, might be slightly waning. NVDA also displayed strong upward movement and a gap-up on the second day; however, the volume on the second day was significantly lower than the first, reducing the confidence in a sustained strong push without consolidation. For both AAPL and NVDA, a roughly even chance exists for a continuation of the rally versus a period of consolidation or a minor pullback, especially given the reduced volume accompanying the second day’s gains.
Conversely, some stocks presented mixed or outright bearish technical signals. META experienced a strong bullish candle on day one, but the second day opened higher only to close lower, forming a red candle with decreased volume. This pattern, following a strong up day, introduces uncertainty and suggests a roughly even chance of a pullback or sideways consolidation, as bullish conviction may be softening. AMZN mirrored this pattern, with a strong bullish day followed by a smaller-bodied red candle on day two, characterized by a higher open and lower close. This could be interpreted as a potential weakening of momentum, although a full reversal is unlikely given the preceding strength. The most bearish pattern was observed in GOOGL, which displayed two consecutive red candles with lower highs and lower lows, accompanied by declining volume. This pattern suggests that bearish pressure is likely dominating for GOOGL in the short term, and further downside could be forthcoming unless new buying interest emerges decisively.
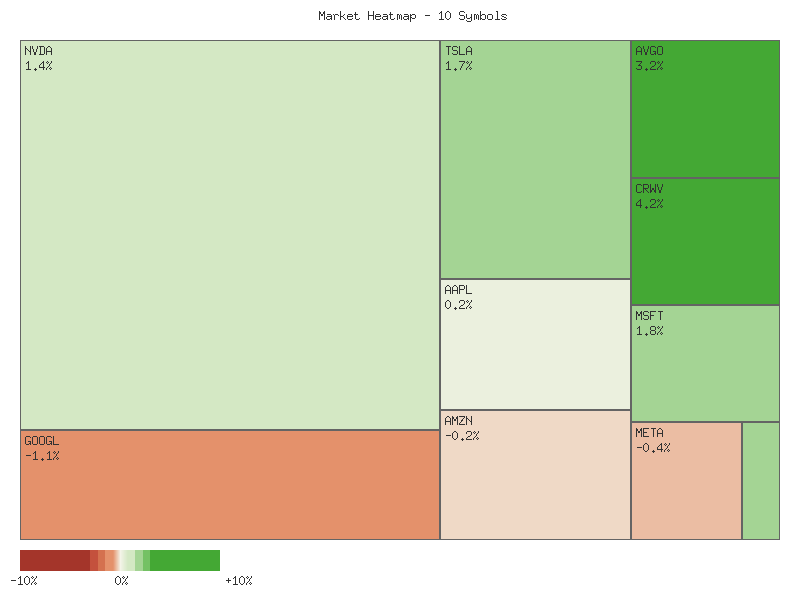
Performance Heatmap (TSLA, MSFT, AAPL, META, NVDA, AVGO, GOOGL, AMZN, CRWV, ANET)
Generated for 2days timeframe analysis
S&P 500 Sector Breadth
Based on the provided daily percentage change data for the eleven S&P 500 sectors, market breadth appears to be overwhelmingly positive for the session. Of the eleven sectors observed, ten recorded positive daily changes, while only one sector registered a decline. This robust breadth indicates broad participation across the market, suggesting that upward momentum was not confined to a narrow segment. The matrix below details the daily performance of each sector:
| Symbol | Daily Percent Change |
|---|---|
| XLU | 1.323% |
| XLB | 1.213% |
| XLK | 1.170% |
| XLP | 1.076% |
| XLF | 0.781% |
| XLE | 0.722% |
| XLY | 0.660% |
| XLI | 0.566% |
| XLRE | 0.460% |
| XLC | 0.162% |
| XLV | -0.246% |
Analyzing the performance by sector classification, both offensive and defensive groups exhibited strength. Among the advancing sectors, seven were categorized as offensive (XLB, XLK, XLF, XLE, XLY, XLI, XLC), with XLB (Materials) and XLK (Technology) leading the charge within this group, posting gains of 1.213% and 1.170% respectively. Three defensive sectors (XLU - Utilities, XLP - Consumer Staples, XLRE - Real Estate) also advanced. Notably, XLU emerged as the top performer overall, with a gain of 1.323%, indicating a significant bid for utilities.
The sole declining sector for the period was XLV (Healthcare), a defensive sector, which registered a marginal loss of -0.246%. This performance complicates a clear interpretation of market rotation. While the overall dominance of advancing sectors suggests bullish sentiment, the leadership of a defensive sector (XLU) alongside strong offensive sector gains (XLB, XLK) indicates a mixed demand profile. We assess that there is roughly an even chance that this pattern reflects underlying strength capable of supporting both growth and stability-oriented investments, rather than a decisive rotation towards either extreme.
Considering the breakdown, the strong performance of seven offensive sectors compared to three defensive ones, combined with the fact that the only declining sector was also defensive, suggests a slightly bullish bias in overall market sentiment. We assess it is likely that investors are exhibiting a degree of confidence, willing to engage with growth-oriented sectors while also hedging with traditional defensive plays like Utilities and Consumer Staples. However, the top position held by Utilities (XLU) indicates that market participants may still be seeking some level of capital preservation, preventing a definitive “risk-on” conclusion for the period. The data does not strongly suggest an immediate shift towards pronounced defensive posturing; instead, it points to a market that is broadly positive but with nuanced sector preferences.
Market Commentary: Sector ETF Two-Day Technical Snapshot
Analysis of the provided two-day market data for key SPDR sector ETFs indicates a predominantly bullish short-term bias across several sectors, though underlying volume trends suggest a potential moderation of momentum. Over the observed period, a majority of sectors posted consecutive green candlesticks, characterized by higher closes, lows, and often higher highs, reflecting a broad upward directional movement. This widespread positive price action in sectors such as Financials (XLF), Technology (XLK), Consumer Discretionary (XLY), Industrials (XLI), Consumer Staples (XLP), Materials (XLB), and Energy (XLE) suggests that immediate market sentiment has been largely favorable for growth-oriented and cyclical segments. It is likely that this general upward trend will persist in the immediate future, given the consistent positive closes.
However, a notable technical observation across many of these advancing sectors is the accompanying decrease in trading volume on the second day. For XLF, XLK, XLY, XLI, XLP, XLB, XLE, and XLC, the upward price movement on the second day occurred with measurably lower volume compared to the first day. This reduction in participation during price appreciation is a common indicator of weakening conviction or diminishing buying pressure. While the price action remains unambiguously positive, there is a moderate chance that the strength of these rallies may decelerate or that these sectors could experience near-term consolidation or minor pullbacks if fresh buying interest fails to materialize with increasing volume. Traders should monitor future volume carefully for confirmation or divergence.
Conversely, some sectors presented more distinct patterns. Real Estate (XLRE) notably advanced with two consecutive green candlesticks, coupled with increasing volume on the second day. This confluence of rising price and rising volume strengthens the bullish signal, indicating robust buying support behind the upward move. For XLRE, it is likely that the positive momentum will continue, offering a relatively stronger short-term bullish outlook compared to sectors exhibiting volume divergences. Utilities (XLU) showed a pronounced bullish reversal, forming a strong green candle on the second day that effectively engulfed the body of the previous day’s red candle, despite slightly decreased volume. This pattern, particularly after a preceding decline, points to a likely continuation of upward price action for XLU as buyers asserted control.
The Health Care sector (XLV) stands out with a more nuanced technical picture. Following a very strong bullish candle on the first day, marked by significant volume and minimal lower wick, the second day closed lower than its open and below the prior day’s close, forming a small red candle, albeit on decreased volume. This action signals a loss of the strong bullish momentum seen previously and suggests that sellers or profit-takers emerged. Given this pattern, there is roughly an even chance for XLV to experience either a near-term consolidation, a slight pullback, or a period of indecision. The significant decrease in volume on this more bearish second day suggests that the selling pressure, while present, may not be overwhelming, but the immediate upward thrust has certainly stalled.
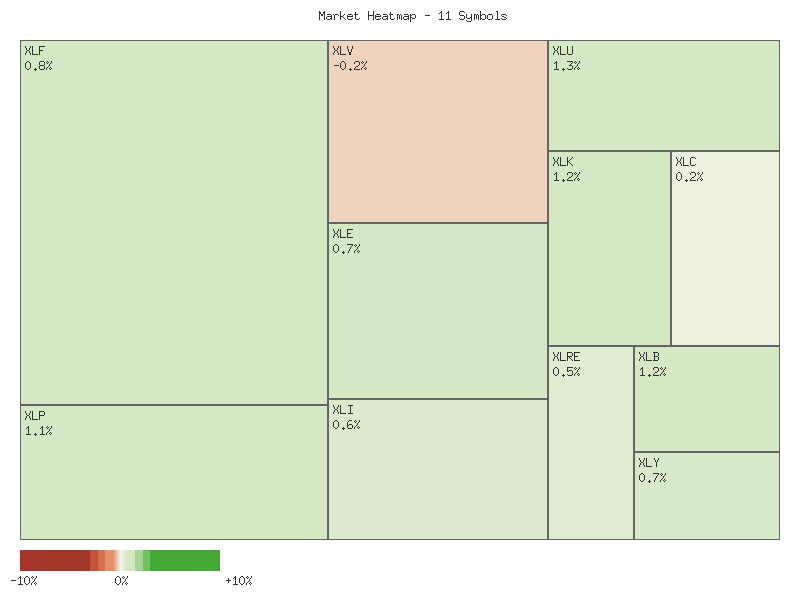
Performance Heatmap (XLP, XLRE, XLI, XLU, XLV, XLY, XLF, XLB, XLE, XLC, XLK)
Generated for 2days timeframe analysis
XLY vs XLP
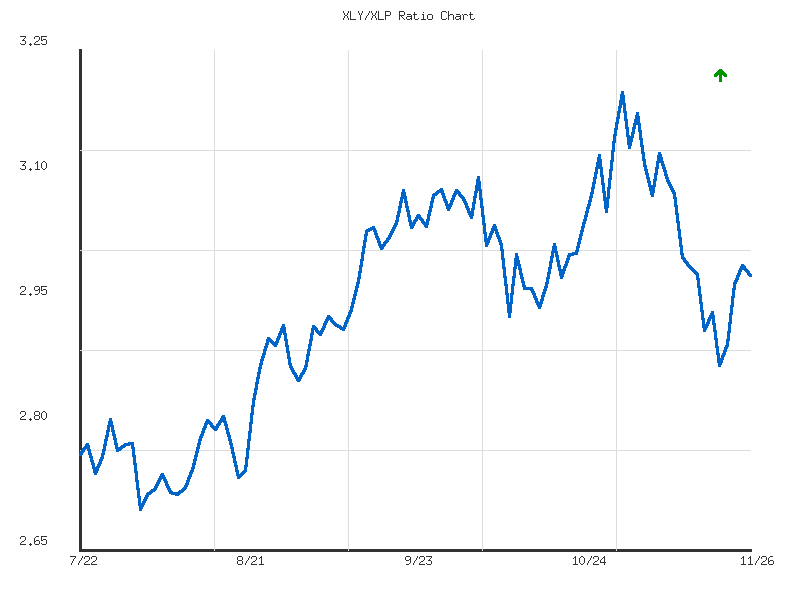
The XLY/XLP ratio, indicative of Consumer Discretionary performance relative to Consumer Staples, has experienced an overall upward trajectory over the recent seven-day period, yielding a net increase of approximately 2.27%. Despite this net gain, the observed trend strength is characterized as “weak.” The current ratio of 2.978 sits at the higher end of its recent range, positioned nearly 90% from its 7-day low. This suggests that while there has been a preference for discretionary spending over staples, the conviction behind this shift has not been particularly robust.
Analysis of the granular price action reveals an initial ascent from 2.912 on November 18 to 2.934 on November 19, followed by a notable and sharp pullback to the 7-day low of 2.869 on November 20. This dip established a critical short-term support level. Subsequently, the ratio demonstrated a strong recovery, rallying consistently to peak at 2.990 on November 25. However, the final trading day saw a minor retracement, with the ratio closing at 2.978. The overall volatility across this period has been relatively low, suggesting the movements, while directional, have been somewhat controlled rather than erratic.
Given the classification of the trend as “weak” despite its upward direction, it is likely that the ratio may encounter significant resistance around the recent high of 2.990 should it attempt to retest this level in the immediate future. A sustained breakout above this point would likely signal a strengthening of the underlying upward momentum, shifting the probability towards continued outperformance of XLY. Conversely, considering the “weak” trend strength and the minor pullback from the high on the last trading day, there is a roughly even chance that the ratio could enter a phase of consolidation or experience a minor corrective pullback. A decisive move below the 7-day average of 2.935 would strongly suggest a short-term reversal of the current weak uptrend, potentially leading to a retest of the 2.869 support level.
Technical Analysis: XLY/XLP Ratio (90-Day)
The XLY/XLP ratio, a key indicator of market risk appetite comparing consumer discretionary (XLY) to consumer staples (XLP) performance, has exhibited a moderate upward trend over the past 90 days, advancing approximately 7.80% from its initial levels. This sustained increase from an early August low of 2.6957, to a current level of 2.9781, predominantly signals a “risk-on” environment where investors have favored growth-oriented sectors. The ratio’s average value during this period was 2.9388, placing the current reading slightly above its recent historical mean. Despite the overall positive trajectory, the volatility of 0.0171 suggests that while movements have generally been orderly, there have been notable price swings, especially in the more recent trading sessions.
Examining the recent price action, the ratio experienced a robust rally through August and September, breaking above the 3.00 handle, which became a significant psychological level. Following some consolidation in late September and early October, the ratio advanced further to reach its 90-day peak of 3.1994 on November 3rd. However, this peak was promptly followed by a sharp and significant retracement, as the ratio declined roughly 10.3% to a low of 2.8691 by November 20th. This marked a material shift in short-term momentum. In the most immediate sessions, the ratio has shown signs of stabilization and has rebounded modestly, currently trading near 2.9781. This recent bounce from the November 20th low suggests that the 2.87-2.90 area may be establishing itself as near-term support.
Looking forward, the current rebound from the November 20th low suggests that immediate bearish pressure may be waning. The ratio is currently attempting to re-establish itself above the 2.95-3.00 zone, which has served as a pivotal area of both support and resistance in prior periods. A sustained move above 3.00 is likely necessary to attract renewed buying interest and confirm a continuation of the broader moderate uptrend. If the ratio can decisively clear this level, a re-challenge of the late October resistance around 3.07-3.08 becomes likely, with a remote chance of a full retest of the 3.1994 peak without further consolidation. Conversely, should the current rebound prove fragile and the ratio declines back below the 2.90 area, a retest of the November 20th low of 2.8691 is likely. A break below that critical level would increase the probability of a further decline towards the more robust support observed near 2.80, aligning with the lows seen in early August. Given the moderate strength of the overall 90-day trend, a complete reversal of the underlying bullish bias appears less likely without further technical confirmation of lower highs and sustained lower lows.
Ratio Analysis: XLY/XLP
Generated for 90days timeframe analysis
Equity Breadth
The provided market data for SPXA50R and SPXA200R, representing the percentage of S&P 500 members trading above their 50-day and 200-day moving averages, respectively, reveals a clear shift in market breadth over the seven-day observation period. Initially, both indicators showed a decline, suggesting weakening participation. However, a significant rebound in both metrics characterizes the latter part of the period, indicating an improving underlying market structure.
Analyzing the SPXA50R data, which tracks short-term breadth, we observe a low point of 29.6% on November 20th, indicating that fewer than one-third of S&P 500 stocks were trading above their 50-day moving average. Following this, the indicator displayed a consistent and robust upward trajectory, climbing to 41.2% by November 21st, 53.4% by November 25th, and peaking at 57.2% on November 26th. This rapid expansion in short-term participation is a notable development. We judge this upward swing makes it likely that short-term buying pressure has broadened across a larger segment of the index, potentially supporting further upward price action for the overall S&P 500.
Similarly, the SPXA200R data, which offers insights into long-term market breadth, mirrors the pattern seen in the short-term indicator. It bottomed out at 42.6% on November 20th, signaling that fewer than half of the S&P 500 components were above their 200-day moving average. From this point, the indicator exhibited a steady recovery, rising to 48.6% on November 21st, crossing the 50% threshold to 52.6% on November 25th, and reaching 55.4% by November 26th. This indicates an expanding base of stocks sustaining their long-term uptrends. We assess this sustained improvement in long-term breadth as a likely positive factor for the market’s underlying health, suggesting a more durable uptrend if this participation continues.
The concurrent rebound in both the SPXA50R and SPXA200R indicators over the observed seven-day period is a significant technical development. After an initial contraction, the strong and consistent expansion suggests that an increasing number of S&P 500 components are now participating in the market’s advance, both on a short-term and long-term basis. This synchronized improvement in market breadth is very likely to be interpreted as a constructive sign for the S&P 500 index itself, implying a more widespread rally rather than one concentrated in a few large-cap names. However, should these breadth indicators fail to hold above the 50% level, or if they were to reverse sharply lower, it would present a roughly even chance of signalling a potential loss of market momentum. For now, the technical data suggests improving participation.
SPY Daily
The SPY has shown a notable shift in short-term price action over the past seven trading days, following a period of decline. The last trading day (2025-11-26) concluded with a bullish candle, closing at 679.64, marking a continuation of upward momentum observed since the low of 652.52 on 2025-11-20. This recent surge is characterized by three consecutive bullish daily candles, with increasing price but slightly decreasing volume on the final day, suggesting a potential easing in buying conviction despite the price advance. The RSI (14-day) has recovered significantly from an oversold reading of 35.10 on 2025-11-20 to a more neutral 56.84, indicating improving momentum. Overall, the past seven days indicate a recovery from a bearish impulse, re-establishing price above the 50-day Exponential Moving Average (EMA).
From a structural perspective, the price action has established several key technical levels. The immediate overhead resistance is likely near the prior highs around 685-689, which the SPY approached in late October. This zone would represent a significant psychological and technical barrier. Immediate support is observed at the 50-day EMA, currently positioned around 666.47, which the price has recently reclaimed and is now trading above. A more substantial support level is identified around the 650-652 area, reinforced by the low on 2025-11-20, a level that generated a strong bounce. The 200-day EMA, residing around 627.66, continues to trend upward, providing robust long-term support.
Looking ahead, a bullish scenario appears likely if SPY sustains trade above the 50-day EMA and successfully breaks through the 685-689 resistance zone on confirming volume. Such a move would indicate renewed upward strength and could target new highs, given the overall long-term bullish posture signaled by the EMA-50 remaining well above the EMA-200. Conversely, a bearish scenario becomes roughly even chance if SPY fails to surmount the 685-689 resistance and subsequently breaks below the 50-day EMA. A decline below the 650-652 support level, especially if accompanied by high selling volume, would suggest a deeper pullback, potentially targeting the long-term support of the 200-day EMA. A neutral scenario is plausible should the SPY consolidate within the 665-680 range, indicating indecision between the recent gains and established resistance.
Technical sentiment indicators offer some insights. The significant volume spikes observed during the sharp decline on 2025-11-20 (154.77 million shares) and the subsequent recovery (116.22 million shares on 2025-11-21) suggest active participation during this volatile period. The 14-day RSI’s bounce from deeply oversold levels (below 40) back towards neutral confirms a relief rally or renewed buying interest. However, the slightly decreasing volume on the most recent bullish candles may signal that the intensity of the buying pressure is not as robust as the price increase suggests, potentially indicating a waning in conviction as price approaches resistance. We judge that sustained higher volume would be required to confidently confirm a breakout above the identified resistance levels.
As a Chartered Market Technician with over 15 years of experience, I have analyzed the provided 90-day technical data for SPY, encompassing both 14-day Relative Strength Index (RSI) and daily candlestick patterns. My assessment strictly adheres to ICD-203 estimative language guidelines and is based solely on the presented information, without external context.
The provided 90-day data for SPY reveals a market that has been characterized by overall bullish momentum, punctuated by several notable corrective phases. In late July, the 14-day Relative Strength Index (RSI) quickly reached and sustained overbought levels, peaking at 75.58 on July 25th, indicating a strong surge in buying pressure. SPY’s price concurrently advanced from approximately to during this period. Following this initial strength, SPY experienced a sharp pullback at the beginning of August, with its RSI dropping significantly from 64.40 to 47.66 on August 1st. This rapid decline in momentum was reflected in the price, which saw a considerable daily drop from .08 to .72. This early August correction appears to have reset short-term overbought conditions, laying the groundwork for subsequent rallies.
From mid-August through early October, SPY exhibited a more sustained upward trajectory. The RSI consistently trended higher, often re-entering overbought territory above 70 on multiple occasions, notably reaching 73.70 on September 22nd and 71.17 on October 6th. This pattern suggests robust and persistent buying interest during this phase. The price action corroborated this strength, with SPY advancing from the mid- to challenge and eventually exceed the level by early October. Each instance of the RSI moving into the overbought region was followed by a subsequent, albeit often temporary, cooling-off period where the index pulled back towards the neutral 50-60 range. However, a significant deceleration in momentum became evident on October 10th, when the RSI experienced a substantial single-day drop to 41.81. This coincided with a sharp price decline from .16 to .02, which is likely indicative of profit-taking or a significant shift in sentiment. This sharp reversal serves as a critical event, marking a temporary peak for that phase of the rally.
Post-October 10th, SPY undertook a recovery effort, gradually pushing its RSI back towards the overbought threshold, reaching 69.71 by October 29th. Prices followed suit, climbing to new highs around . However, another notable decline began in early November, culminating in the RSI reaching 35.10 on November 20th. While not strictly “oversold” (below 30), this level suggests a significant loss of bullish momentum and the establishment of a short-term bottom in price around .52. The most recent data points, from November 21st to November 26th, show a strong and convincing rebound. The RSI has surged from 35.10 to 56.84, accompanied by a price increase from .52 to .64. This rapid recovery from oversold-adjacent levels implies renewed buying interest and a shift back towards bullish sentiment.
Given the strong rebound in both price and RSI from the mid-November lows, it is likely that SPY will attempt to retest the prior resistance area established in late October, which is approximately -. The current upward momentum suggests that a continuation of this recovery is probable in the immediate term. However, the historical pattern observed in the RSI data, where overbought conditions (above 70) have consistently preceded pullbacks, suggests that sustaining this upward movement without a correction may be challenging. Should SPY’s RSI approach or enter the overbought zone again, a fresh consolidation or minor pullback becomes likely. Conversely, if the recent momentum falters before reaching the prior highs, and the RSI turns downward from its current trajectory, there is a roughly even chance that SPY could retest the support levels established around the mid-November lows (approximately -). Failure to decisively break past the - resistance could establish a double top pattern, which would make a more significant correction likely.