Daily Market Technical Analysis
Over the past two trading days (November 25-26, 2025), the market displayed predominantly bullish tendencies, with key indices and S&P 500 sectors registering widespread positive performance and strong market breadth. This broad participation, evidenced by improving SPXA50R and SPXA200R indicators, makes a continuation of the short-term upward momentum likely. Leading sectors like Real Estate (XLRE) and specific stocks such as MSFT and CRWV are highly likely to extend gains. Conversely, decreased volume accompanying advances in several sectors (e.g., XLK, XLV) and individual equities (e.g., NVDA, META, AMZN) suggests a roughly even chance of consolidation or reduced momentum. The VIX index is likely to continue its short-term downtrend, reflecting reduced market uncertainty. While commodities show broad strength, volume divergence implies some, like GLD, face a roughly even chance of consolidation. Overall, a bullish bias is likely to persist, but with nuanced conviction.
Market Indices
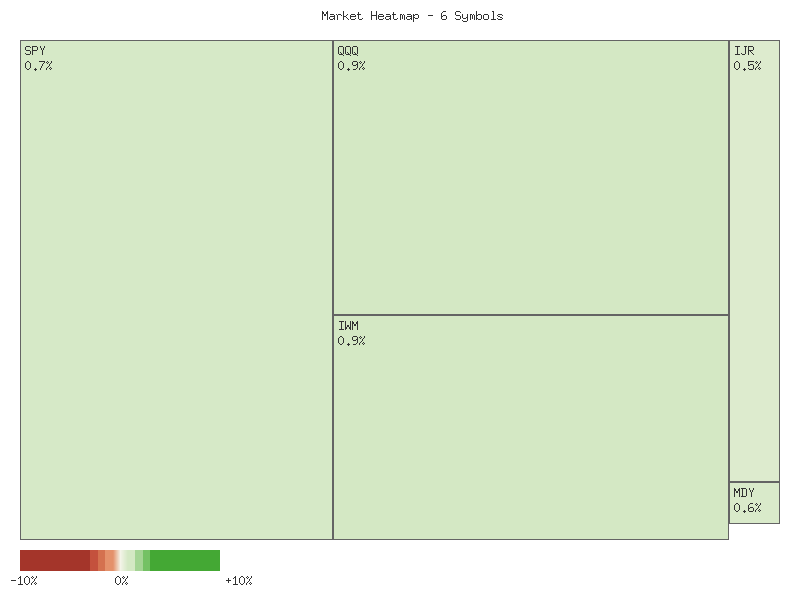
Based on the provided daily percentage change data for key market indices and ETFs, the market exhibited a universally positive performance for the observed day. The following matrix illustrates the performance, sorted by daily percentage change in descending order:
| Symbol | Daily Percent Change |
|---|---|
| IWM | 0.893% |
| QQQ | 0.887% |
| SPY | 0.686% |
| OEF | 0.638% |
| MDY | 0.615% |
| IJR | 0.533% |
The market breadth for this observation period appears unequivocally strong. All six analyzed symbols—IJR (iShares Core S&P Small-Cap), IWM (iShares Russell 2000), MDY (SPDR S&P Midcap 400), OEF (iShares S&P 100), SPY (SPDR S&P 500), and QQQ (Invesco QQQ Trust)—registered positive daily percentage changes. This translates to six advancing symbols and zero declining symbols among this specific group. Such broad participation across various market capitalization segments, from small-cap to large-cap, is typically viewed as a bullish technical signal. It is likely that this widespread advance reflects a broad-based positive sentiment across the equity market for the observed session.
Examining the relative performance, the Russell 2000 (IWM) and Nasdaq 100 (QQQ) led the gains, showing fractional but discernable outperformance over the broader S&P 500 (SPY, OEF) and mid/small-cap segments (MDY, IJR). The IWM’s leading position, coupled with IJR’s presence at the lower end of the gains, suggests that while small-cap stocks participated, there was a nuanced dispersion within that category. The stronger performance of QQQ indicates notable strength in technology and growth-oriented large-cap stocks. This implies that market participants were likely rotating into or adding to positions across a range of market segments, with a slight tilt towards areas often perceived as higher beta.
Given this single day’s technical data, the prevailing short-term market momentum for these specific instruments is likely positive. The absence of any declining symbols suggests a lack of immediate selling pressure within these benchmark ETFs. However, it is important to note that a robust technical assessment typically requires observation over multiple periods to confirm trends and validate signals. While the current data points to an advancing market, a reversal is always a possibility in subsequent sessions, especially without additional data to establish support levels or preceding price action. Therefore, it is roughly even chance that this singular day’s strong breadth could be a precursor to sustained momentum or simply a transient uptick within a broader context not observable here.
Market Commentary: Short-Term Equity ETF Analysis (November 25-26, 2025)
The broad market, as represented by SPY, QQQ, IWM, IJR, MDY, and OEF, exhibited clear bullish tendencies over the two-day period from November 25-26, 2025. All six exchange-traded funds (ETFs) concluded both trading days with higher closes, consistently establishing higher highs and higher lows. This pattern strongly suggests that upward momentum is likely to persist in the immediate short term, indicating robust buying interest across various market capitalizations, from large-cap S&P 100 and Nasdaq 100 components down to small-cap Russell 2000 and SmallCap 600 constituents.
A deeper look into the daily price action reveals consistent strength. On November 26, SPY, QQQ, and OEF all opened with a significant gap higher than their prior day’s close, immediately reinforcing the previous day’s bullish sentiment. These instruments continued to trade higher throughout the day, closing near their intraday highs. IWM, IJR, and MDY, while not gapping up from their prior close, still opened above their prior day’s open and demonstrated similar intraday strength, carving out higher highs and higher lows. This synchronized bullish price action across diverse market segments makes a continuation of this short-term upward trajectory likely, with the prior day’s high for each instrument now acting as immediate support.
However, a notable technical detail emerges concerning trading volume. For SPY, QQQ, IWM, MDY, and OEF, the volume on November 26 was lower than on November 25, despite the continued price ascent. This divergence, where price moves higher on diminishing volume, presents a roughly even chance of either a normal decrease in trading activity during a holiday-shortened period (though no external context is provided) or a subtle indication of potentially waning conviction among buyers. Should volume not re-accelerate, this could lead to consolidation or a minor pullback. Conversely, IJR, representing small-cap growth, saw an increase in volume on November 26 alongside its price gains, reinforcing its bullish price action and suggesting relatively stronger underlying demand within that segment.
Considering the collective evidence, the market is likely to attempt to extend its rally in the very short term. The consistent higher highs and higher lows across all tracked indices provide a bullish framework. Immediate resistance levels are established at the November 26 daily highs (e.g., SPY 681.70, QQQ 616.19), while immediate support is found at the November 26 daily lows (e.g., SPY 676.72, QQQ 610.40). A clear break below these immediate support levels would indicate that the upward momentum has at least paused, creating an environment for potential consolidation or a minor retracement. The diverging volume profiles suggest that while broad market strength is evident, traders should monitor volume closely for confirmation of continued upside conviction, particularly in those indices where volume declined.
Performance Heatmap (SPY, QQQ, IWM, IJR, MDY, OEF)
Generated for 2days timeframe analysis
As a Chartered Market Technician, my analysis of SPY over the past 90 days, based solely on the provided price and 14-day Relative Strength Index (RSI) data, suggests a nuanced technical picture.
The SPY has exhibited an overarching bullish trend over the 90-day period, characterized by a general ascent from the low in late July to near the by late November, establishing a pattern of higher highs and higher lows. This upward trajectory was interspersed with notable corrections. A significant pullback occurred in early August, with prices declining from approximately to , accompanied by exceptionally high volume. Another sharp correction in mid-October saw SPY fall from about to , again supported by substantial selling volume. The most recent price action, spanning from mid-November to the end of the data set, reveals a sharp decline from near to a low of on November 20. This was immediately followed by a robust recovery to close near .64 by November 26, forming a discernible V-shaped pattern on the chart. This recovery suggests strong demand emerged at the recent low. The prior peak around from late October likely represents a key near-term resistance level.
Volume data provides additional context to these price movements. The high-volume selling observed during the early August and mid-October corrections, along with the particularly high volume (over 150 million shares) on November 20 as SPY hit its low, suggests strong conviction behind these downside movements. Conversely, the subsequent rebound in the final trading days, while substantial in price, has generally occurred on moderating or lower volume compared to the significant selling spikes. This diminished volume accompanying the recent recovery introduces a degree of uncertainty regarding the underlying strength of the upward move, suggesting a roughly even chance that the rally might face headwinds without further confirmation from stronger buying interest.
The 14-day Relative Strength Index (RSI) further illuminates market sentiment. In late July, the RSI consistently registered above 70, indicating overbought conditions and preceding the early August pullback that brought the RSI down to 47. For much of August and September, the RSI mostly remained above the 50-level, consistent with an ongoing uptrend, occasionally touching overbought territory (e.g., above 70 in mid-September). During the mid-October correction, the RSI plunged from the low 70s to approximately 41.8. Most recently, the RSI saw a significant decline from near 70 (late October) to a clearly oversold level of 35.1 on November 20. The subsequent sharp price recovery has propelled the RSI back to 56.84 by November 26. This move from oversold territory and a cross above the 50-level indicates a likely shift towards positive short-term momentum.
Considering the combined technical signals from the price action and RSI, the SPY appears to be in an immediate recovery phase. The robust price rebound from the November 20 low, coupled with the RSI moving out of oversold conditions and above the 50-level, makes it likely that this short-term upward momentum could continue. However, the relatively lighter volume on the recent rally compared to the preceding high-volume selling introduces a cautionary note regarding its sustained strength. There is a plausible scenario for SPY to retest the prior resistance zone near . Conversely, it might encounter significant resistance in the - range, leading to consolidation or a renewed pullback. A decisive breach above on strong volume would significantly increase the likelihood of further upward progression, while a failure to advance beyond current levels, particularly if accompanied by weak volume or a bearish reversal pattern, would suggest a higher probability of retesting recent support, possibly towards or the range.
SPY Price & Indicators (RSI_14_DAY, MACD_13_21_DAY)
Technical Analysis of QQQ (July 22, 2025 - November 26, 2025)
The Invesco QQQ Trust (QQQ) exhibited a predominantly bullish trend for a substantial portion of the 90-day analysis period, characterized by a series of higher highs and higher lows from late July through late October. Initial strength was evident as QQQ advanced from approximately in late July, with the 14-day Relative Strength Index (RSI) consistently in overbought territory, reaching values as high as 73.11 by July 28. While minor pullbacks occurred, such as the early August dip that saw the RSI briefly touch 48.26, the underlying upward momentum, as indicated by the MACD line remaining largely positive and trending higher, consistently supported price recovery. This robust uptrend continued through September, with QQQ breaking above and the RSI reaching a peak of 75.35 on September 22, suggesting sustained buying pressure and strong bullish conviction among market participants during this phase.
A notable shift in market dynamics occurred around early October. Following a prolonged period of ascending prices and momentum indicators, QQQ experienced a sharp and significant price decline on October 10. The closing price plummeted from .70 to .50, accompanied by a substantial surge in volume, reaching 94.4 million shares—a clear indication of intensified selling pressure. This sharp reversal was corroborated by the momentum indicators; the RSI dropped dramatically from 69.27 to 45.42, while the MACD line, which had been strongly positive at 6.77, plunged into negative territory at -6.65. This rapid and severe deterioration in momentum signals suggested a significant increase in bearish sentiment and potentially marked the exhaustion of the prior uptrend’s immediate strength.
Despite the abrupt October 10 reversal, QQQ demonstrated resilience by initiating a recovery, eventually reaching new highs in late October, peaking at .77 on October 29. This recovery pushed the RSI back into overbought conditions at 71.73 and the MACD line to a new peak of 12.01, indicating a powerful re-assertion of bullish momentum. However, this peak proved to be a short-lived climax. The period from late October through November 20 was marked by a sharp, accelerated downturn. QQQ declined precipitously, culminating in a significant multi-day sell-off that saw the price reach .70 on November 20. This capitulation was accompanied by exceptionally high trading volume, with 111.7 million shares traded on November 20—the highest volume observed in the entire 90-day dataset. The RSI reflected this bearish intensity, falling to 35.35, nearing oversold conditions, while the MACD line plummeted to a deeply negative value of -17.96, signaling an exceptionally strong and sustained bearish momentum shift.
As the analysis concludes, QQQ has shown signs of attempting a recovery from the November 20 low. The price has rebounded to .28 by November 26, accompanied by an increase in the 14-day RSI from 35.35 to 53.67. Concurrently, the MACD line, while remaining in negative territory, has shown an upward inflection from its low of -17.96 to -8.54. This indicates a probable short-term relief rally or a consolidation phase, with bearish momentum appearing to subside. However, the deeply negative MACD line suggests that the longer-term bearish bias is likely still intact. A near-term scenario involves QQQ possibly continuing its bounce towards previous resistance levels. Alternatively, a roughly even chance exists that this rebound may be temporary, potentially followed by a resumption of the downtrend if the momentum indicators fail to cross into positive territory or if price fails to sustain above immediate resistance established during the recent decline.
QQQ Price & Indicators (RSI_14_DAY, MACD_13_21_DAY)
IWM Technical Analysis: November 2025 Outlook
The price action for IWM over the past 90 days, spanning from late July to late November 2025, exhibits distinct phases. Following an initial downtrend in late July and early August, where price moved from approximately to a low of .34 on August 1st, a notable upward reversal commenced. This rally propelled IWM higher, culminating in a peak near .94 by late August, and continued into September and early October, establishing a sustained uptrend with higher highs and higher lows. Significant highs were observed at .09 on October 3rd, and another at .77 on October 15th, followed by a local peak of .21 on October 27th. These price levels near - are likely to act as areas of strong overhead resistance for future price movements.
The period from late October through mid-November saw a pronounced downturn, with IWM experiencing a significant decline from its late October highs. This decline was characterized by several high-volume selling days, particularly around November 13th (), November 14th (), November 17th (), and November 18th (), pushing the price to a low of .90 on November 20th. This marked an important short-term support level. The most recent price action, starting from November 21st, indicates a swift rebound from this low, with IWM closing at .32 on November 26th, accompanied by moderately high volume ( on Nov 21st, on Nov 25th, on Nov 26th). This recent surge has retraced a significant portion of the prior decline, suggesting renewed buying interest.
The 14-day Relative Strength Index (RSI) provides insight into the momentum behind these price movements. During the initial July-August decline, RSI dipped into lower territory, reaching a low of 41.36 on August 1st, indicating that the selling pressure was significant, but did not reach critically oversold levels (below 30). The subsequent rally in August saw RSI move sharply higher, entering overbought territory (above 70) multiple times, specifically on August 22nd (67.43) and September 18th (71.23). Such readings suggested that the price increases were becoming extended and that a period of consolidation or pullback was likely. Indeed, following the September 18th overbought RSI reading, IWM consolidated for a period, with RSI fluctuating between 55 and 68 through late September and early October. The significant decline from late October to mid-November saw the RSI plunge from the high 50s to reach a notable low of 32.63 on November 20th. While not technically oversold (below 30), this level indicates a strong shift in selling momentum. The recent rebound has caused the RSI to recover swiftly, currently standing at 58.45 on November 26th. This rapid ascent in RSI from a near-oversold level indicates renewed buying interest and a potential shift in short-term momentum from bearish to bullish.
Considering both the price action and RSI, IWM appears to be in a crucial phase. The robust rebound from the November 20th low, accompanied by increased volume and a sharp increase in RSI from near-oversold levels, suggests that the immediate downside pressure has abated. However, the price is now approaching significant resistance levels established in October, specifically the - range. A sustained break above these levels would likely confirm a continuation of the rally. Conversely, a failure to breach this resistance, especially if accompanied by declining volume and a bearish divergence in RSI (which is not yet evident), would suggest the recent rally is corrective, with a roughly even chance of prices retesting the November 20th lows around -. It is important to note that the requested MACD data was not provided for this analysis, thus preventing a comprehensive evaluation of momentum and trend-following signals from that indicator. Based solely on the provided data, it is likely that IWM will encounter resistance in the - zone in the near term. A decisive move above this range is possible but requires substantial buying pressure, while a consolidation or minor pullback from these levels is also a reasonable alternative scenario given the rapid ascent and proximity to prior highs.
IWM Price & Indicators (RSI_14_DAY, MACD_13_21_DAY)
VIX Fear Index
The VIX market data over the past seven trading days reveals a distinct shift in volatility dynamics. Initially, the period from November 18th to November 21st displayed elevated volatility, with the VIX opening at 23.54 and experiencing a significant surge on November 20th, reaching a high of 28.27 before closing at 26.41. This sharp expansion was followed by a modest decline on November 21st. However, the prevailing trend in the latter half of the observed period, specifically from November 24th through November 26th, indicates a sustained contraction in volatility, culminating in a notable -7.63% daily percentage change on the final day.
A closer examination of the candlestick patterns from November 24th to November 26th confirms a developing short-term downtrend. Across these three sessions, the VIX consistently recorded lower highs (23.68, 21.77, 18.70) and lower lows (20.41, 18.39, 16.93), with each day closing progressively lower than the previous one. This persistent pattern of descending peaks and troughs underscores robust selling pressure. The closing price of 17.20 on November 26th represents the lowest point within this seven-day dataset, indicating that previous support levels have been breached. The absence of trading volume data prevents us from using it to corroborate the strength or weakness of these price movements.
Given the clear sequence of lower highs, lower lows, and lower closes over the past three sessions, it is likely that the VIX will continue to exhibit downward momentum in the immediate short term. The substantial -7.63% decline observed on November 26th further reinforces this technical outlook. The current price action suggests a breakdown below previous consolidations, potentially opening the path for further declines unless new demand emerges. Alternatively, there is a roughly even chance that the VIX could experience a temporary pause or a minor retracement upward, particularly after multiple consecutive days of decline. However, such a move would most likely be a short-term correction within the broader bearish structure. A sustained reversal to an upward trend appears unlikely without a clear candlestick reversal pattern or the establishment of a series of higher lows and higher closes.
Market Commentary: VIX Technical Analysis (90-Day View)
The VIX, as observed over the past 90 days, exhibits a pattern characterized by periods of relative calm punctuated by distinct, sharp upward movements. From late July to late August, the VIX primarily traded within a range, experiencing a notable spike on August 1st to a close of 20.38, before receding. Subsequently, much of September saw the index oscillate between roughly 14 and 17. The October and November period introduced increased volatility, with prominent surges observed around October 10th (closing at 21.66) and a more substantial rally culminating in a peak close of 26.41 on November 20th. Critically, the provided data indicates a consistent ‘volume: 0’, which is an unusual characteristic and removes a vital dimension for confirming price action and trend strength that would typically be employed in rigorous technical analysis.
Analysis of the 14-day Relative Strength Index (RSI) for the VIX reveals a consistent correlation with the underlying price movements. During the early August VIX spike, the RSI briefly touched above 65, indicating strengthening momentum. For much of August and September, the RSI largely remained in neutral territory, fluctuating around the 50-level, aligning with the VIX’s range-bound behavior. However, the more volatile periods in October and November saw the RSI repeatedly enter overbought conditions, exceeding the 70 threshold. This occurred notably on October 10th (73.09) and subsequently with three consecutive readings above 69, peaking at 71.67 on November 20th, coinciding precisely with the VIX’s recent highs. The RSI has since retreated sharply, registering 43.51 on November 26th, signaling a significant deceleration of upward momentum.
Based on the combined observations of VIX price action and the 14-day RSI, the immediate outlook points to a likely continuation of the current downtrend or consolidation. The VIX has experienced a pronounced retreat from its November 20th high of 26.41, closing at 17.20 on November 26th. Concurrently, the RSI’s sharp decline from severely overbought levels (71.67) to a more neutral position (43.51) strongly suggests that the intense buying pressure that propelled the VIX higher has largely dissipated. Given this exhaustion of upward momentum from overbought conditions, it is likely that the VIX will either stabilize around current levels or continue to drift lower in the near term, as market participants unwind positions established during the recent period of heightened volatility.
While the current technical posture favors further decline or consolidation, alternative scenarios must be considered due to the VIX’s historical tendency for sharp reversals. A sudden resurgence in market uncertainty could drive the VIX higher again. In such a scenario, a decisive close above the recent resistance levels around 18-19 would be a critical technical development. Should this occur, a corresponding move by the RSI back above 50 and towards the 60-70 region would lend considerable support to a renewed upward bias. It is crucial to note that the requested MACD (13, 21-day) indicator data was not provided within the market dataset, thereby precluding any analysis of momentum crossovers or divergences typically offered by this tool. The absence of volume data also limits the confidence in discerning the conviction behind price movements.
VIX Price & Indicators (RSI_14_DAY, MACD_13_21_DAY)
Tech Sector Analysis
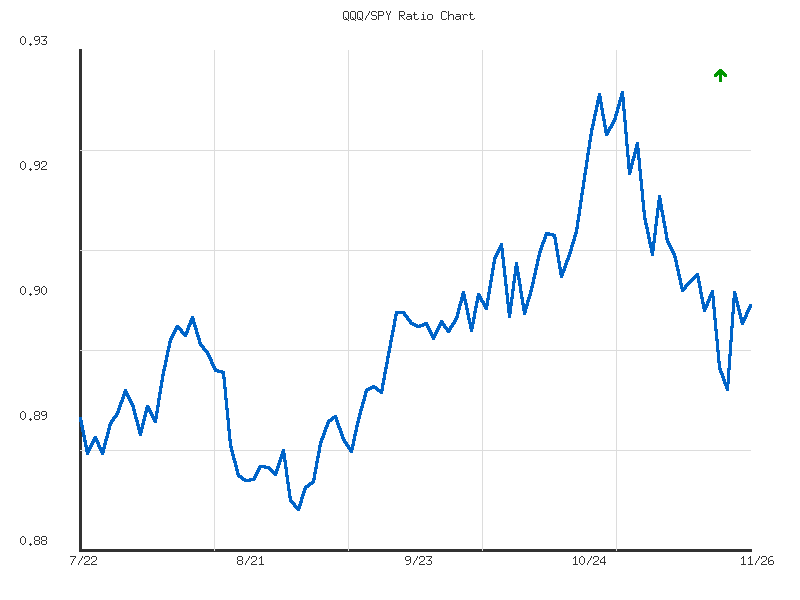
The 14-day analysis of the QQQ/SPY ratio reveals a predominantly sideways trend, as indicated by the provided summary data, though internal dynamics suggest an underlying bearish bias for relative performance. The ratio began the period at approximately 0.9088, quickly ascending to a peak of 0.9147 on 2025-11-10. This initial upward movement suggests QQQ experienced a brief period of outperformance against the broader S&P 500. However, following this peak, the ratio entered a distinct declining phase, consistently posting lower highs and lower lows over several days, ultimately reaching a low of 0.8954 on 2025-11-21. This decline over more than half of the observation period implies a shift where QQQ underperformed SPY.
The sustained downward drift from the peak at 0.9147 to the trough at 0.8954 indicates that the technology-heavy QQQ exhibited notable relative weakness against the broader market during this segment. This pattern suggests that capital was likely rotating out of higher-growth technology segments, or that the broader market components represented by SPY demonstrated greater resilience or attraction during this timeframe. Despite the overarching “sideways” trend classification with “weak” strength, the price action within this channel clearly points to a bearish bias in the relative strength of QQQ versus SPY. The ratio’s total change of -0.55% over the 14 days, from its starting point to its final print, further solidifies this observation of slight relative underperformance.
Towards the close of the 14-day period, the QQQ/SPY ratio demonstrated a modest rebound from its low, recovering from 0.8954 to settle at 0.9038 on 2025-11-26. This recovery places the current ratio just below the 14-day average of 0.9052, and its relative position of 0.4363 within the observed range confirms it remains closer to the period’s low than its high. A continued push above the average ratio of 0.9052 would present a roughly even chance for QQQ to regain some relative strength in the immediate short term, potentially signaling a stabilization or even slight improvement in its performance versus SPY. Conversely, a failure to sustain this recent rebound, particularly if it leads to a break below the 0.8954 low, would likely signal further relative underperformance for QQQ, suggesting the broader market may continue to be favored. Therefore, monitoring the 0.9052 level for resistance and the 0.8954 level for support remains crucial for anticipating the ratio’s near-term direction.
As a Chartered Market Technician with over 15 years of experience, my analysis of the QQQ/SPY ratio over the past 90 days, from July 22, 2025, to November 26, 2025, focuses strictly on the provided technical data. This ratio, an indicator of the Nasdaq 100’s relative strength against the S&P 500, has likely demonstrated an overall upward bias, with the ratio increasing from approximately 0.8925 to 0.9038 over the period. The data indicates an overarching “up” trend direction with a “weak” stated strength, and the current ratio sits near the midpoint of its 90-day range at a relative position of 0.4903.
From early September to early November, the ratio exhibited a sustained upward trajectory, making it highly likely that QQQ was experiencing a period of significant relative strength compared to SPY. During this phase, the ratio ascended from a low of approximately 0.8834 (September 2) to a peak of 0.9250 (November 3). This upward movement involved breaking through several intermediate resistance levels, suggesting consistent demand for the technology-heavy Nasdaq 100 relative to the broader market. The 0.8830-0.8840 zone, tested multiple times in late August and early September, formed a significant base of support for this bullish run.
Following the peak at 0.9250 on November 3, the ratio experienced a notable pullback, indicating a likely loss of immediate upward momentum. The subsequent price action in November shows the ratio consolidating, primarily fluctuating between approximately 0.9000 and 0.9150. Key support levels have emerged around 0.9000-0.9030, with the ratio finding buyers near these levels on multiple occasions, including the current day’s close at 0.9038. Conversely, resistance appears to be solidifying near the 0.9150 mark, preventing a strong retest of the multi-month high.
Considering the current positioning within this established consolidation, there is a roughly even chance for the ratio to either resume its prior upward trajectory or experience further relative underperformance. A decisive and sustained move above the 0.9150 level would make a retest of the 0.9250 peak likely, signaling renewed relative strength for QQQ. Conversely, a sustained break below the 0.9000 support level would make further decline towards the 0.8900 area likely, potentially targeting the long-term support established around 0.8830, though a rapid drop to that extreme without clearer bearish momentum signals is considered unlikely in the immediate term.
Ratio Analysis: QQQ/SPY
Generated for 90days timeframe analysis
IWM vs. SPY
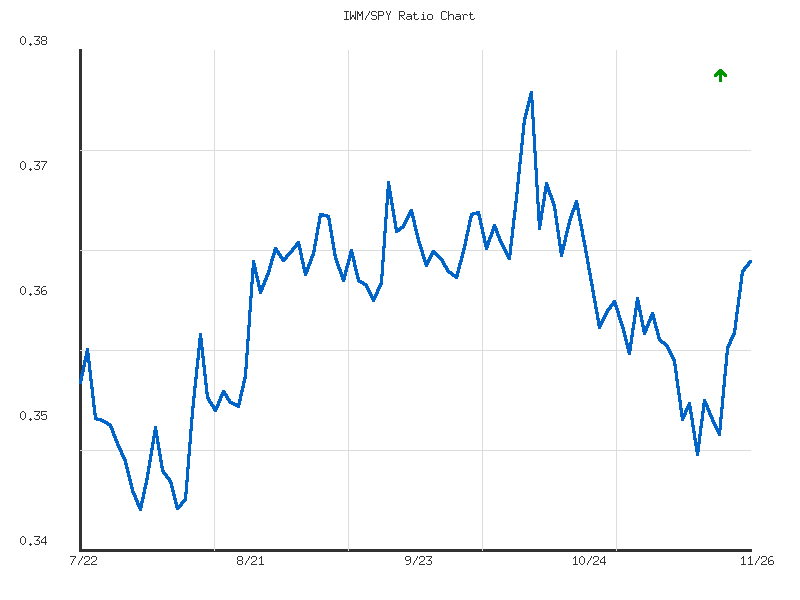
The relative performance of the Russell 2000 (IWM) against the S&P 500 (SPY) over the past 14 trading days presents a nuanced picture, characterized by an initial period of underperformance followed by a recent recovery. From November 07, 2025, the IWM/SPY ratio initiated at 0.3601, indicating the Russell 2000’s relative standing. Over the subsequent ten days, ending November 17, 2025, the ratio experienced a downward drift, reaching a low of 0.3496. This decline likely indicates a period where the technology-heavy S&P 500 outperformed the broader small-cap index, suggesting investor preference shifted towards larger, potentially more stable, equities during this stretch.
Following this period of relative weakness, the IWM/SPY ratio demonstrated a discernible upward trajectory. From its low on November 17, the ratio progressively climbed, reaching 0.3638 by November 26, 2025. This recovery and subsequent outperformance by IWM against SPY in the latter half of the 14-day period is likely indicative of renewed interest or strength in small-cap companies. The ratio’s current value of 0.3638 stands as the high for the analyzed timeframe, suggesting that IWM concluded the period with stronger relative momentum.
Despite the recent upward trend in the IWM/SPY ratio, the overall trend strength for the entire 14-day period is explicitly categorized as “weak,” with a net change of approximately 1.05%. This characterization suggests that while IWM has recently shown relative strength, the impetus behind this move has been modest. The volatility of the ratio across this period has been notably low (0.0000177), which likely implies a relatively stable, albeit shifting, dynamic rather than an abrupt or sharp change in investor sentiment towards small-caps.
Considering the weak strength of the recent upward trend, a continuation of IWM’s outperformance against SPY over the immediate short-term is roughly even chance. The mildness of the trend suggests it may lack the robust conviction typically associated with sustained moves. Conversely, a reversion to the prior pattern of SPY outperformance, or at least a consolidation of the ratio around its average of 0.3563, is also roughly even chance. A substantial acceleration of IWM’s relative outperformance, leading to a significant upward breakout from the current range, is unlikely without a marked increase in trend strength and volatility, neither of which are currently evident in the provided data.
As a Chartered Market Technician, my analysis of the 90-day IWM/SPY ratio, which measures the relative performance of small-cap stocks (IWM) against large-cap stocks (SPY), indicates a nuanced pattern of relative strength shifts. Over the entire 90-day period from late July to late November, the ratio has exhibited an overall weak upward trend, beginning near 0.355 and concluding around 0.3639. The total change was approximately 2.5%, moving within a broad range from a low of 0.3457 in early August to a high of 0.3763 in mid-October. The relatively low volatility (0.0000467) suggests that daily fluctuations have been modest, contributing to the “weak” trend strength despite the overall positive drift.
The initial phase of the period, from late July to early August, saw the IWM/SPY ratio decline from approximately 0.355 to its 90-day low of 0.3457. This suggested a period of significant underperformance by small-cap stocks. However, following this low, a robust upward trend commenced around August 12, characterized by a clear series of higher lows and higher highs. This sustained rally culminated in the peak of 0.3763 on October 15, marking a period of strong relative outperformance for IWM. During this phase, the ratio overcame several prior resistance levels, including the 0.358 area in mid-August and the 0.367-0.369 region in early September. This bullish momentum indicated that small caps were likely to continue their relative strength against large caps during this window.
Since the October 15 peak, the IWM/SPY ratio has experienced a significant retracement, falling to approximately 0.357-0.359 in early November. This decline suggests that the robust uptrend from August to mid-October has likely concluded. The ratio’s inability to sustain levels above 0.367-0.369 throughout late October, coupled with subsequent lower highs and lower lows, points to a shift in relative momentum. The recent price action, including a bounce from the early November lows, brings the ratio back to 0.3639, but it remains significantly below the October peak. This recovery effort has not yet re-established a convincing uptrend, and it is likely testing previous support-turned-resistance levels.
Looking ahead, the IWM/SPY ratio faces immediate resistance in the 0.365-0.367 region, which acted as a support zone in late September and early October. A sustained move above this resistance is probably necessary to suggest a more meaningful recovery in small-cap relative strength. However, given the current context of a retreat from the October high, continued significant outperformance of IWM relative to SPY, surpassing the 0.3763 level in the near term, is unlikely. Conversely, if the current bounce fails to overcome this immediate resistance, a retest of the 0.357-0.359 support zone is likely. There is roughly an even chance that the ratio will continue to consolidate within its recent range (roughly 0.357 to 0.367) or experience further downward pressure if the immediate resistance cannot be overcome.
Ratio Analysis: IWM/SPY
Generated for 90days timeframe analysis
Commodities
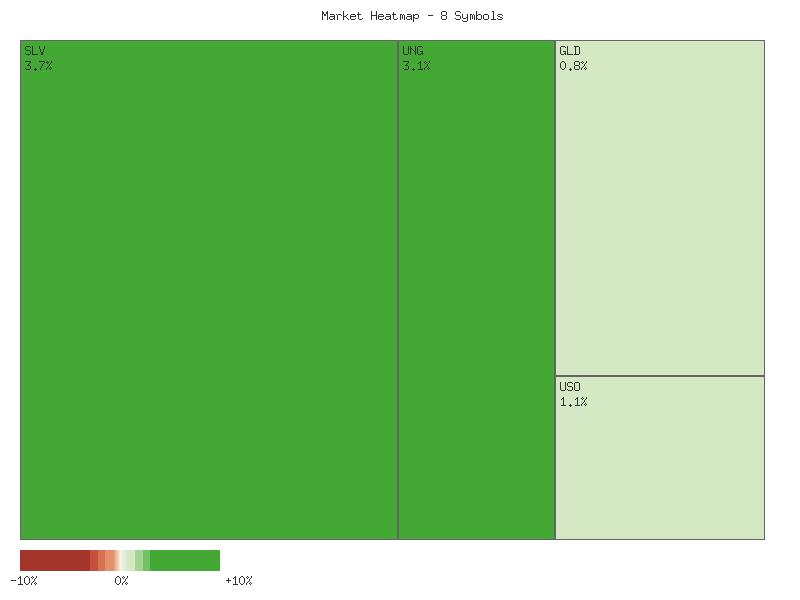
An analysis of the provided daily percentage change data for select commodity-related exchange-traded funds (ETFs) reveals a universally positive trading session across this specific basket. The market breadth for these eight symbols is exceptionally strong, with all symbols advancing and none declining. This indicates a broad-based positive sentiment for these underlying assets for the observed period.
The daily performance, sorted in descending order, is presented below:
| Symbol | Daily Percent Change |
|---|---|
| SLV | 3.685% |
| UNG | 3.108% |
| CPER | 2.117% |
| CORN | 1.611% |
| UGA | 1.502% |
| USO | 1.119% |
| DBC | 1.065% |
| GLD | 0.795% |
Leading the gains were SLV (silver) with a 3.685% increase and UNG (natural gas) with a 3.108% rise. This substantial outperformance suggests a particular buying interest in precious metals (specifically silver) and natural gas among market participants during this period. The magnitude of these gains makes it likely that these assets experienced strong bullish momentum, possibly driven by short-term technical catalysts or increased speculative interest. It is also possible that these gains are part of a broader trend, but this cannot be confirmed solely from the provided single-day data.
Other commodity-focused ETFs, including CPER (copper), CORN (corn), UGA (gasoline), USO (crude oil), and DBC (broad commodities), also registered solid advances, ranging from 1.065% to 2.117%. These moderate yet consistent gains across a diverse set of commodities further confirm the positive market breadth observed. It is probable that a general risk-on sentiment for commodities or specific supply/demand dynamics influenced these moves, contributing to a synchronized upward trajectory for this group. The widespread nature of these gains indicates that the positive price action was not isolated to just a few components.
GLD (gold) posted the smallest gain within the positive group, advancing by 0.795%. While still positive, its relative underperformance compared to its peer, SLV, is notable. This divergence could indicate a temporary rotation of capital within the precious metals sector, with market participants favoring silver’s higher volatility or perceived growth potential over gold’s traditionally more stable role. There is a roughly even chance that this pattern could persist, suggesting a continued preference for silver, or it could simply be a one-day anomaly. From a technical perspective, gold’s modest gain, despite the broad commodity strength, warrants continued observation for any emerging relative weakness.
Commodity Sector Displays Broad-Based Short-Term Strength; Volume Patterns Suggest Differentiated Conviction
The provided two-day technical data for a diverse basket of commodities—CORN, CPER, USO, DBC, UGA, UNG, SLV, and GLD—reveals a likely pervasive bullish sentiment across the sector. Over the observed period from November 25th to November 26th, 2025, every single asset experienced consecutive upward price movements, characterized by higher closes, higher highs, and higher lows on the second day compared to the first. This broad-based upward price action suggests a significant, albeit short-term, demand for commodities, encompassing agricultural products, industrial metals, energy, and precious metals. This uniform strength across various sub-sectors points towards a sector-wide positive impulse, leading to a high degree of certainty in identifying an immediate bullish bias.
A closer examination of individual asset performance and accompanying volume offers further nuance regarding the conviction behind these upward moves. CORN demonstrated robust upward momentum, with its second day’s rally occurring on increased volume (from 27,852 to 35,624), which likely confirms buyer participation and could signal a continuation of this short-term ascent. Similarly, the broad commodity index DBC saw a substantial increase in volume (from 224,295 to 983,403) on its second day of gains, reinforcing the bullish price action and making a continuation likely. Silver (SLV) also experienced a notable increase in volume (from 23,890,135 to 26,097,403) accompanying its strong second-day rally, closing near its high, which likely suggests continued buying interest. UGA (gasoline) posted a modest increase in volume (from 12,910 to 13,698) on its second upward day, offering a roughly even chance of continued upward movement or a period of consolidation in the immediate future, given the less dramatic volume confirmation.
Conversely, other assets displayed strong price action but with a divergence in volume patterns, introducing a high degree of uncertainty regarding sustained momentum. Copper (CPER) advanced significantly over the two days, with its second-day close at the high, yet this was accompanied by a decrease in volume (from 440,388 to 232,236) compared to the first day. While price action is bullish, the reduced volume unlikely provides strong confirmation of sustained momentum, suggesting a roughly even chance of either continuation or a period of consolidation. Similarly, Crude Oil (USO) and Natural Gas (UNG) both posted strong two-day rallies, closing near their highs on the second day, but on decreased volume (USO: 5,861,278 to 3,191,042; UNG: 10,526,833 to 10,055,820). Gold (GLD) also saw a modest decline in volume (from 9,533,228 to 9,093,807) during its second day of gains. For these assets, while the short-term trend is undeniably positive, the softening volume profile makes it less likely that the strong upward momentum will persist without a period of re-accumulation or a potential pullback.
In summary, the aggregated two-day data for these key commodities presents a generally bullish technical picture across the board. The uniform upward price movement, characterized by higher highs and higher lows for all tracked assets, is a significant technical signal. While the increasing volume in CORN, DBC, and SLV likely supports a continuation of their upward trajectories, the decreasing volume observed in CPER, USO, UNG, and GLD introduces a roughly even chance of either a continued rally on potentially lighter conviction or a phase of consolidation. Given the limited two-day dataset, any projections beyond the immediate term carry a high degree of uncertainty. Technical analysts unlikely would extrapolate long-term trends from such a short timeframe, and caution is advised for retail traders not to mistake short-term strength for enduring directional shifts without further corroborating evidence.
Performance Heatmap (SLV, GLD, CORN, CPER, USO, DBC, UGA, UNG)
Generated for 2days timeframe analysis
As a Chartered Market Technician with 15 years of experience, I offer the following analysis of SLV based exclusively on the provided 90-day candle data, 14-day Relative Strength Index (RSI), and trading volume.
Over the past 90 days, SLV has exhibited a discernible bullish trend, characterized by significant rallies punctuated by sharp, high-volume corrections. Following an initial dip in late July (from .72 to a low of .10 by July 31), the security initiated a strong upward movement. This uptrend propelled SLV from its August lows, ultimately reaching a peak near .40 on October 15. A subsequent, notable correction ensued, driving prices down by approximately 13.7% to a low of .70 by October 27. The most recent phase, from late October to late November, shows a powerful recovery, with SLV currently trading around .39, effectively retesting prior highs. The price action suggests a pattern of strong impulsive moves followed by sharp, relatively short-lived corrective phases within the broader uptrend.
The 14-day Relative Strength Index (RSI) has been a reliable indicator of momentum shifts throughout this period. During the strong rallies observed from late August through mid-October, RSI frequently entered overbought territory, surpassing the 70 threshold and peaking at 84.32 on October 13. These extended periods of overbought RSI were consistently followed by either consolidation or significant price corrections, as evidenced by the sharp decline after October 15’s peak where RSI was above 83. Similarly, significant price bottoms, such as the late October low near .70, coincided with RSI values dipping towards the 40s (e.g., 46.50 on October 27), indicating waning bearish momentum and a predisposition for a bounce. The pattern suggests that sustained overbought RSI levels are likely followed by a corrective phase, while a move from neutral levels upwards tends to support the rally.
Volume analysis provides further insight into conviction behind price movements. The initial stages of the significant uptrend, particularly in late August and early September, were accompanied by escalating volume, confirming the strength of the bullish breakout. Volume continued to expand notably during the rally into October, with several days exceeding 40-50 million shares, and a peak volume day of 110 million on October 9. Such extremely high volume near market peaks, particularly on days with large price swings or limited upward progress (e.g., October 9, October 17), likely represents a period of strong two-way action, possibly indicating distribution by larger participants. Conversely, the sharp downward corrections on October 17 and October 21 were also met with exceptionally high volume (86 million and 81 million respectively), suggesting strong bearish conviction rather than mere profit-taking. Recent upward moves in November have seen moderately high volume, but not at the extreme levels observed during the September-October highs.
SLV is currently testing a significant resistance zone established by the October 15 and November 12 highs, roughly between .30 and .70. The current price of .39 places it directly at this critical juncture. The RSI is currently at 63.98, indicating strong momentum but not yet in the extreme overbought conditions that often precede a pullback. This suggests that there is a roughly even chance to a slight likelihood of continued upward momentum challenging the immediate resistance zone. However, the repeated rejection or stalling at this price level, coupled with the prior high-volume distribution/climax patterns, suggests that a definitive breakout will require substantial buying pressure and volume. Should SLV fail to clear this resistance, a pullback to the recently established support around .00-.00 is likely. Conversely, a clear breach of .70, particularly on strong volume, would very likely open the path for further upside. The absence of MACD data limits a comprehensive assessment of trend strength and potential crossovers.
SLV Price & Indicators (RSI_14_DAY, MACD_13_21_DAY)
GLD Technical Analysis: Navigating Recent Price Swings and Momentum Shifts
GLD experienced a significant upward trend from late August through mid-October, climbing from approximately to over . The 14-day Relative Strength Index (RSI) unequivocally confirmed this robust upward movement, consistently residing in overbought territory (above 70) for much of September and peaking at extreme levels exceeding 87 in October. Elevated trading volumes during this period, particularly on days with significant price appreciation, are indicative of strong accumulation by market participants and lend substantial credence to the strength and conviction of this upward impulse.
Following this prolonged ascent, GLD underwent a sharp and notable correction beginning in mid-October. The price receded swiftly, accompanied by exceptionally high selling volumes on several specific days, particularly October 9th, 17th, and 21st. This pattern of high volume during a price decline is a strong signal of significant profit-taking or a material shift in short-term market sentiment. Concurrently, the 14-day RSI plummeted dramatically from its extended overbought conditions, eventually dipping into the mid-40s by early November. This steep decline in momentum suggests a significant loss of bullish conviction and a transition from a highly overbought state to more neutral, and briefly, mildly bearish territory.
In the most recent trading period, specifically from early November, GLD appears to be attempting to establish a recovery. Price has observed an upward trajectory from the lows around -, with the latest close recorded at .09. The 14-day RSI has largely mirrored this constructive price action, advancing from the mid-40s to its current value of 60.53 as of November 26th. While this recovery in the RSI signals a re-establishment of positive momentum, it has not yet re-entered the overbought region. This implies that there is still capacity for further upside movement on a momentum basis before the asset could be considered statistically extended.
The current price action suggests that GLD is now approaching a critical juncture, trading near resistance levels established during its prior upward move and subsequent correction. A significant area of resistance is likely to exist around the previous highs from mid-October, specifically between and . Should GLD sustain its current upward momentum and achieve a decisive breach of these overhead resistance levels, a continuation of the rally is probable. However, if the price encounters substantial selling pressure at or near these identified resistance zones, a retreat or a period of horizontal consolidation is roughly an even chance. A failure to maintain price action above the recently established support levels (approximately -, based on the mid-November lows) would likely lead to further downside, with the lows from late October/early November (around ) serving as the next important support area. The RSI’s current position, still below 70, implies that while further upside is possible, a sustained push through resistance would be a prerequisite to shift the short-term outlook to highly bullish.
Note on MACD Data: As the MACD (13, 21-day) data points were not provided in the market data for analysis, despite being requested in the chart description, a technical assessment based on this indicator cannot be rendered. This analysis is therefore confined strictly to the available candlestick price data and the 14-day Relative Strength Index.
GLD Price & Indicators (RSI_14_DAY, MACD_13_21_DAY)
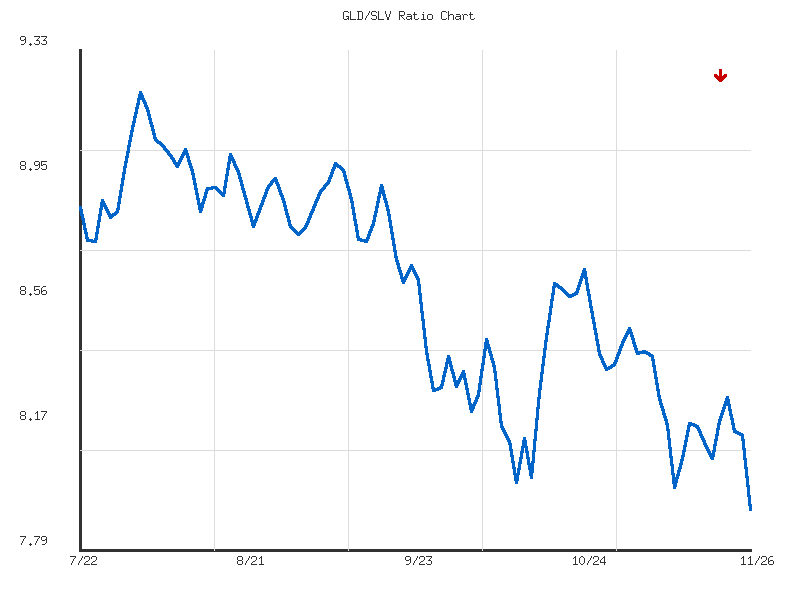
Gold/Silver Ratio
The GLD/SLV ratio has exhibited a clear downward trend over the observed 14-day period, declining by approximately 5.62%. This trend is described as moderate in strength, with the ratio closing at 7.9167 on the final day, marking its lowest point within this dataset. The prevailing market action strongly suggests that the relative strength of Gold (GLD) against Silver (SLV) has diminished, with Silver showing notable outperformance over this timeframe. Based on the persistent decline and the current ratio resting at its 14-day low, it is highly likely that the near-term momentum remains bearish for the GLD/SLV ratio.
Examining the price action in more detail reveals distinct phases. The ratio initially declined from 8.3878 to an interim low of 7.9855. Following this initial drop, the ratio entered a period of consolidation, oscillating roughly between 8.07 and 8.26, indicating a temporary stabilization where neither GLD nor SLV significantly outpaced the other for several days. This range persisted until the final trading day observed, when the ratio decisively broke below the previous interim low of 7.9855, plummeting to 7.9167. This breakdown below a previously established support level is a significant technical event and suggests a renewed commitment from market participants to drive the ratio lower.
Considering the recent decisive break to a new 14-day low, a continuation of the downward trajectory for the GLD/SLV ratio is likely in the immediate term. The prior support level around 7.9855 is now likely to act as resistance on any potential short-term rebound attempts. An alternative scenario involves a minor technical bounce from the current lows; however, such a bounce would unlikely signify a reversal of the established downtrend without more substantial evidence of accumulation or a clear bullish reversal pattern. The ratio’s relative position at 0 indicates it is at the extreme low of this specific data set, underscoring the bearish sentiment at the close of the period. While a minor bounce is a roughly even chance, a sustained reversal appears unlikely given the recent price action.
GLD/SLV Ratio Analysis: 90-Day Technical Outlook
The GLD/SLV ratio has exhibited a strong and consistent downward trend over the observed 90-day period, declining by approximately 10.54% from its peak. As of the most recent data point on 2025-11-26, the ratio stands at 7.9167, establishing a new 90-day low. This indicates a persistent outperformance of SLV relative to GLD throughout this timeframe. The current relative position of 0 further emphasizes that the ratio is presently at the lowest point within the provided dataset, signaling significant bearish momentum. This enduring decline suggests that, from a technical perspective, gold has been losing ground against silver for the majority of the past three months, a trend that is clearly defined and robust within the observed window.
The ratio initiated its decline from a high of 9.2024 on 2025-08-01, which established a clear initial resistance level. Following this peak, the ratio consistently formed a series of lower highs, notably around 9.09 (2025-07-31), 9.02 (2025-08-11), and 8.98 (2025-09-09), each failing to surpass preceding levels. Concurrently, a pattern of lower lows emerged, moving from initial troughs in the 8.7-8.8 range down to the current 7.9167. This descending channel formation reinforces the strength of the bearish trend. Intermediate resistance appears to have been established in the region of 8.40-8.60 during October, which subsequently gave way to the latest move lower. The average ratio for the period is 8.5944, placing the current ratio well below this historical average, further confirming the prevailing bearish bias.
In the latter part of the observed period, specifically from mid-October, the ratio made an attempt to rally, reaching 8.6147 on 2025-10-21, but this proved to be a lower high within the broader downtrend. Subsequently, the ratio resumed its decline, breaking below the prior intermediate low of 8.0002 (2025-10-13) to register the new 90-day low of 7.9167 on 2025-11-26. This recent breakdown suggests that selling pressure on GLD relative to SLV remains robust. Given that the ratio is currently at its lowest point in the 90-day history and the stated trend strength is “strong,” a continued decline to levels below 7.91 is likely in the immediate short term. Traders would likely seek further confirmation of a reversal before considering long positions in the ratio, as current momentum favors the downside.
While the prevailing technical evidence points to continued bearishness, alternative scenarios must be considered. A significant and sustained bounce that reclaims the 8.00 psychological level would provide the first indication of potential support, though this is currently unlikely given the recent decisive breakdown. For the downtrend to be considered potentially exhausted or reversed, the ratio would need to establish a clear series of higher lows and higher highs, ideally breaking above the last significant lower high, which was around 8.61 in October. Until such price action materializes, the path of least resistance for the GLD/SLV ratio remains to the downside, with a high degree of confidence. A move back towards the average ratio of 8.59 would require a material shift in the current strong bearish momentum.
Ratio Analysis: GLD/SLV
Generated for 90days timeframe analysis
Bonds
The following analysis is based exclusively on the provided daily percentage change data for the specified symbols.
| Symbol | Daily Percent Change |
|---|---|
| TLT | 0.443% |
| UTHY | 0.318% |
| IEF | 0.082% |
| IEI | 0.008% |
| SHY | -0.012% |
The technical data for November 26, 2025, indicates a general upward bias for the majority of the tracked instruments, with Symbol TLT registering the strongest positive daily percentage change at 0.443%. Symbol UTHY followed with a gain of 0.318%, while Symbol IEF and Symbol IEI showed marginal positive movements of 0.082% and 0.008% respectively. In contrast, Symbol SHY recorded a slight negative daily change of -0.012%, positioning it as the weakest performer among the group for this single observation period. The relative strength is clearly stratified, with TLT showing the most robust performance, and SHY experiencing a fractional decline.
It is critical to underscore that this analysis is severely constrained by the limited data set, comprising only a single daily percentage change for each symbol. Traditional technical analysis relies heavily on historical price series, volume data, and the identification of recurrent chart patterns or indicator divergences to establish trends, support/resistance levels, or momentum shifts. With only one data point per instrument, it is unlikely to derive any meaningful trend identification, assess volatility characteristics, or recognize established chart patterns such as reversals or continuations. Therefore, any conclusions regarding future price movements or underlying market sentiment should be viewed with extreme caution, as the basis for such conclusions is almost entirely absent.
Given the singular nature of the data, the predictive power for future price action for any of these symbols is roughly even chance. While Symbol TLT’s positive performance might imply a continuation of upward momentum, and Symbol SHY’s negative print could suggest further weakness, there is an almost certainly not sufficient basis to form such a conclusion based solely on one day’s movement. An alternative scenario is that these single-day movements are anomalies or part of normal market noise, and subsequent days could see entirely different behaviors, including reversals or accelerations that are not foreshadowed by this limited data. Without multiple data points to establish context within a timeframe, it is highly unlikely to identify any actionable technical signals.
Technical Market Commentary: Two-Day Analysis of Treasury Bond ETFs
Analysis of the provided two-day candlestick data for US Treasury bond ETFs reveals distinct patterns across varying durations, suggesting a nuanced near-term outlook for the fixed income market. For the longer-duration iShares 20+ Year Treasury Bond ETF (TLT), the price action suggests a likely bullish reversal. Day one presented a bearish candle, opening higher but closing near its low on significantly high volume of over 35 million shares, indicating strong selling pressure. However, on day two, TLT opened lower, establishing a new intraday low, yet recovered decisively to close at its daily high of 90.63. This robust recovery, closing above the prior day’s high and erasing the prior day’s losses, forms a powerful bullish engulfing-like pattern. While day two’s volume, at 33.5 million, was slightly less than day one, it remains sufficiently high to lend credence to the reversal. Given this price action, it is highly likely that TLT will experience continued upward momentum in the immediate future, potentially targeting resistance levels above the current two-day high. An alternative scenario, though less likely, could involve a retest of the Day 2 open if the bullish momentum unexpectedly wanes.
Moving to intermediate-duration bonds, the iShares 7-10 Year Treasury Bond ETF (IEF) also exhibited bullish tendencies. Day one closed with a solid bullish candle, showcasing upward momentum. Day two, despite opening slightly higher and then pulling back to print a new two-day low, demonstrated strong buying conviction by rallying to close at its daily high, above the prior day’s close. This suggests a likely continuation of bullish momentum for IEF. The accompanying volume, while decreasing from 9.15 million to 7.71 million on day two, still supports the general upward trend, albeit with slightly reduced conviction compared to the previous day. In contrast, the iShares 3-7 Year Treasury Bond ETF (IEI) displayed a pattern of potential bullish consolidation. Following a bullish day one, day two saw the price continue to hold above day one’s open but within a narrower range and on significantly reduced volume. The close at day two’s high is a positive sign, indicating persistent buying interest into the close. However, the overall reduced volume and narrower range suggest a roughly even chance of continued consolidation or a modest upward drift, rather than a strong directional surge.
The shortest-duration iShares 1-3 Year Treasury Bond ETF (SHY) showed distinct signs of consolidation. Over both days, SHY traded within an extremely tight range between 83.04 and 83.10. Day one was a small bullish candle, followed by day two which effectively closed flat or negligibly lower than its open, indicating a strong lack of directional conviction. The consistently high volume across both days, despite the minimal price movement, points to a strong equilibrium between buyers and sellers at current levels. Therefore, a continuation of this tight range-bound trading is likely for SHY in the very near term. Lastly, the US Treasuries 20+ Year (UTHY) also showed a bullish reversal on day two, following a bearish close on day one. Day two opened at its low and rallied to close at its high, forming a strong bullish candle. However, the extremely low trading volume for UTHY on both days (3,402 and 3,995 shares) means that patterns observed in this instrument are significantly less reliable than those with higher liquidity. While the candlestick pattern itself is bullish, the lack of substantial participation renders any firm conclusions highly uncertain; a roughly even chance exists for either continued upward movement or a swift reversal due to low conviction.
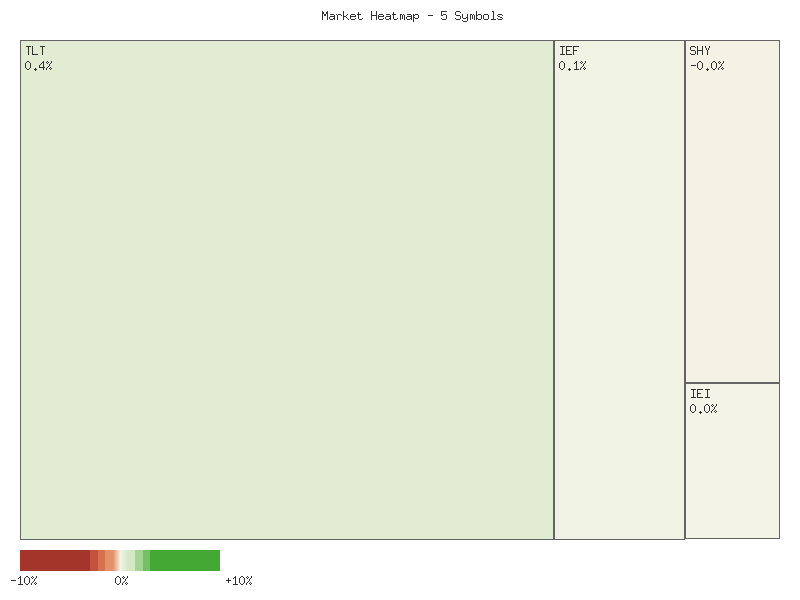
Performance Heatmap (TLT, UTHY, IEF, IEI, SHY)
Generated for 2days timeframe analysis
Magnificent 7 & Friends
We observe the daily percentage change for the selected equities as of 2025-11-26. The performance for this single session varied considerably among the ten symbols analyzed, ranging from a substantial gain of 4.181% to a notable decline of -1.079%. To provide a clear overview, the daily performance is presented below in descending order:
| Symbol | Daily Percent Change |
|---|---|
| CRWV | 4.181% |
| AVGO | 3.168% |
| ANET | 2.095% |
| MSFT | 1.784% |
| TSLA | 1.712% |
| NVDA | 1.372% |
| AAPL | 0.206% |
| AMZN | -0.200% |
| META | -0.410% |
| GOOGL | -1.079% |
For this particular trading session, CRWV demonstrated the strongest positive performance, closing up 4.181%. AVGO and ANET also exhibited robust gains, with increases of 3.168% and 2.095%, respectively. These movements suggest concentrated buying interest in these specific names during the session. However, based solely on a single day’s data, we judge there is a roughly even chance that these strong performances represent the initiation of new short-term momentum or are isolated, idiosyncratic movements. Drawing conclusions about sustained trends from this limited information would be premature.
Conversely, GOOGL experienced the most significant decline, dropping -1.079%, followed by META and AMZN with losses of -0.410% and -0.200%, respectively. While these indicate selling pressure in these names for the day, it is unlikely that this single session’s negative performance is sufficient to establish a bearish trend. We assess there is a substantial possibility that these declines are simply part of normal daily volatility or minor profit-taking, rather than the onset of a sustained downtrend. Further data would be required to ascertain if these are indeed directional shifts.
It is critical to underscore that this analysis is based exclusively on a single day’s percentage change data. Therefore, we lack the necessary historical context, volume information, or pattern formations typically employed in rigorous technical analysis to confirm trends, identify support/resistance levels, or predict future price action with a high degree of confidence. While the positive performance of seven out of ten symbols might suggest a marginally bullish bias across this specific basket of equities for the session, we judge that deriving broader market sentiment or individual stock trajectories from such minimal data carries a high degree of uncertainty. Future price action is highly unpredictable based on this isolated data point.
Technical Market Commentary: Two-Day Price Action Analysis (November 25-26, 2025)
Our technical analysis of the provided two-day candlestick data reveals a mixed, yet predominantly bullish, market sentiment across the selected equities. A significant portion of the analyzed symbols—namely MSFT, CRWV, AVGO, and TSLA—exhibited strong upward momentum. Each of these stocks posted two consecutive bullish candles, with the second day often opening higher (gapping up) than the first day’s close and maintaining a robust close near its daily high. This price action, particularly evident in MSFT and CRWV with their clean bullish continuation, suggests that these securities are highly likely to experience continued upward momentum in the immediate term. The consistent buying pressure reflected in these patterns indicates a prevailing bullish conviction among market participants for these specific names.
Other securities, while maintaining an upward trajectory, displayed subtle technical nuances that suggest potential for consolidation or reduced momentum. ANET showed two strong bullish days with a significant gap up on the second day, closing near its high. However, the second day’s volume was lower than the first, and the price closed slightly off its peak. Similarly, NVDA saw a powerful bullish surge on the first day, followed by a gap up on the second day, but closed with an upper wick and significantly decreased volume. While ANET is highly likely to continue its upward momentum, it is also likely to encounter minor consolidation before further upward movement, given the slight intraday selling pressure. For NVDA, the reduced volume and closing off the high after a gap up imply that the strong upward momentum is likely to face resistance or consolidate; a sharp continuation upward without a pause is unlikely.
Conversely, a segment of the market displayed signs of weakening bullish sentiment or potential reversals. AAPL registered two relatively small bullish candles with minimal upward progress and decreasing volume on the second day. This pattern suggests that AAPL is likely to enter a period of sideways consolidation rather than a strong directional move. A significant upward acceleration without increased conviction (e.g., higher volume and wider ranges) is unlikely in the immediate future. More notably, META and AMZN both posted strong bullish candles on the first day, but their second day’s action formed a bearish reversal pattern. Both stocks gapped up at the open but then closed lower than their respective first day’s close, indicating a potential near-term top. With decreased volume accompanying these reversals, it is likely that both META and AMZN will experience downward pressure or consolidation. A robust continuation of their prior bullish trend is unlikely without renewed buying interest.
Finally, GOOGL stands out as the sole security exhibiting a clear bearish sentiment during this two-day period. It recorded two consecutive bearish candles, characterized by lower highs, lower lows, and lower closes. While the declining volume on the second bearish day might suggest waning selling conviction, the overall pattern indicates that GOOGL is highly likely to experience continued downward pressure or at least a period of consolidation in the immediate term. A strong bullish rebound for GOOGL is unlikely without a clear and sustained reversal pattern emerging from subsequent trading sessions.
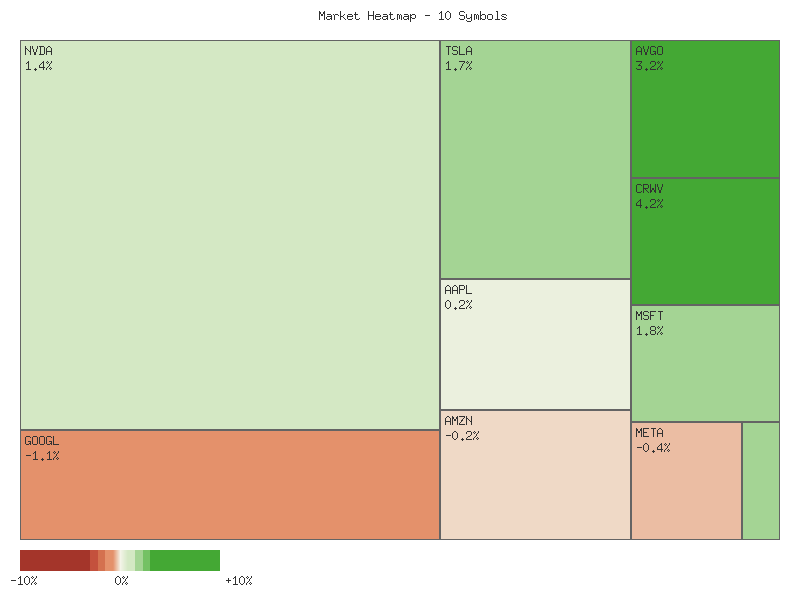
Performance Heatmap (TSLA, MSFT, AAPL, META, NVDA, AVGO, GOOGL, AMZN, CRWV, ANET)
Generated for 2days timeframe analysis
S&P 500 Sector Breadth
The daily performance of the eleven S&P 500 sectors indicates a broadly positive market session. Out of the eleven sectors analyzed, ten registered positive daily percentage changes, suggesting robust market breadth. Only one sector, XLV (Healthcare), concluded the day with a decline. This widespread participation from a significant majority of sectors typically reflects an underlying constructive sentiment among market participants.
The daily percentage change values for each sector, sorted in descending order, are as follows:
| Symbol | Daily Percent Change |
|---|---|
| XLU | 1.323% |
| XLB | 1.213% |
| XLK | 1.170% |
| XLP | 1.076% |
| XLF | 0.781% |
| XLE | 0.722% |
| XLY | 0.660% |
| XLI | 0.566% |
| XLRE | 0.460% |
| XLC | 0.162% |
| XLV | -0.246% |
Analyzing the performance by offensive and defensive sector classifications reveals further insights. Among the offensive sectors (XLK, XLY, XLF, XLI, XLB, XLE, XLC), all seven posted gains, with XLB and XLK showing particularly strong advances of 1.213% and 1.170% respectively. Conversely, for the defensive sectors (XLU, XLP, XLV, XLRE), three out of four advanced, while XLV was the sole decliner across all eleven sectors. Notably, XLU, a defensive sector, was the top performer of the day with a 1.323% gain, followed closely by XLB, an offensive sector.
Given that seven out of the ten advancing sectors are classified as offensive, it is likely that overall market sentiment leans towards a risk-on environment. The broad-based gains among these growth-oriented sectors suggest investors are favoring assets with higher beta. The fact that the only declining sector, XLV, is defensive further reinforces this inclination toward risk appetite. While XLU, a defensive sector, was the top performer, its outperformance does not appear to negate the overall bullish breadth seen across the offensive sectors. We judge that a significant market rotation into defensive assets is unlikely to be indicated by this single day’s data, although the top performer being defensive suggests there is roughly an even chance of some continued mixed leadership in the immediate term.
Market Commentary: Sector ETF Technical Analysis (2-Day Review)
Based on the provided two-day candlestick data for eleven SPDR Sector ETFs, the market currently exhibits a predominantly bullish short-term bias. A significant majority of sectors, including XLY (Consumer Discretionary), XLE (Energy), XLI (Industrials), XLF (Financials), XLB (Materials), XLP (Consumer Staples), and XLU (Utilities), recorded consecutive higher closes over the period. This widespread positive price action, often characterized by higher highs and higher lows, suggests robust short-term momentum across a broad segment of the market, indicating buyer conviction has been prevalent.
Several sectors displayed particularly strong bullish patterns. XLRE (Real Estate) stands out with two consecutive strong bullish candles, both higher highs and higher lows, crucially supported by increasing trading volume on the second day. This combination makes further upward movement highly likely for XLRE. Similarly, XLY, XLF, XLB, and XLP also closed strongly higher for two consecutive days. For these sectors, a continuation of the upward trend is highly likely. However, for XLY, XLF, XLB, XLP, XLI, XLE, and XLU, the strong upward price action on the second day occurred on noticeably decreasing volume. This suggests a roughly even chance that the current pace of ascent might moderate or that a period of consolidation could emerge without sustained buying interest.
Not all sectors presented such clear bullish signals. XLK (Technology) displayed strong bullishness initially, but the second day involved a gap-up followed by a close below its open, despite a net higher close. This, combined with a significant volume reduction, indicates some hesitation, suggesting a roughly even chance of consolidation or a minor pullback before further substantial gains. XLC (Communication Services) showed only marginal bullishness with small candle bodies and decreasing volume, implying aggressive upward continuation is unlikely; sideways consolidation is more likely. XLV (Health Care) saw a powerful bullish first day, followed by a bearish inside bar on the second day with decreased volume. This pattern, suggesting indecision or profit-taking, implies a continuation of aggressive upward momentum is unlikely immediately, with a roughly even chance of a short-term reversal or deeper consolidation.
In summary, the market, as represented by these key sector ETFs, currently leans bullish, with most showing upward price momentum. Continuation of this short-term bullish trend is likely for most sectors. However, the pervasive observation of decreasing volume accompanying strong price advances across many, coupled with signs of hesitation in XLK and XLV, introduces caution. While a broad market reversal is unlikely based on this limited data, the sustainability of current upward velocity without renewed volume interest remains uncertain. Therefore, a period of reduced upside momentum or consolidation across several sectors holds a roughly even chance of materializing in the very near term.
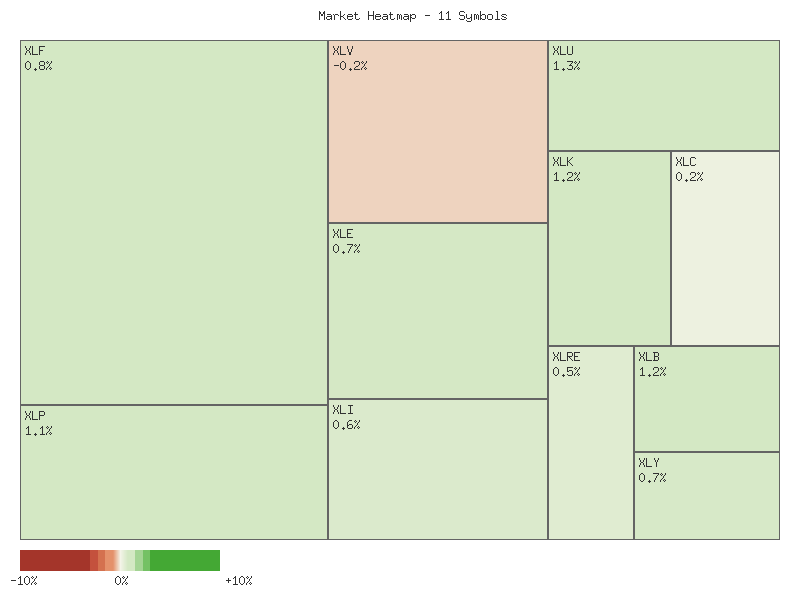
Performance Heatmap (XLP, XLRE, XLI, XLU, XLV, XLY, XLF, XLB, XLE, XLC, XLK)
Generated for 2days timeframe analysis
XLY vs XLP
The XLY/XLP ratio, representing Consumer Discretionary versus Consumer Staples, has demonstrated an upward trend over the past seven days. This observed movement, where XLY is outperforming XLP, typically implies a moderately risk-on market sentiment during this specific period. The ratio advanced approximately 2.27% from its initial value. However, it is important to note that the identified trend strength is characterized as “weak,” which suggests that while the overall direction is positive, the underlying conviction or momentum supporting this ascent may be limited.
Analysis of the daily data points reveals a clear range of movement within the observed timeframe. Following an initial rise, the ratio experienced a pullback, establishing a low of 2.869 on November 20th. Subsequently, it resumed an upward path, reaching its peak for this period at 2.990 on November 25th. The ratio concluded the observed period at 2.978 on November 26th. This minor retreat from the recent high, despite the broader upward movement, suggests that the upward momentum might be facing some resistance or entering a phase of consolidation. The current ratio is positioned near the upper bound of its 7-day trading range, specifically at approximately 89.8% of that range.
The observed volatility of 0.00178 during this seven-day period is relatively low, which aligns with the assessment of a “weak” trend strength rather than a highly dynamic market phase. Given the weak strength of the overall uptrend and the slight pullback from the recent high, there is a roughly even chance that the ratio could continue its upward trajectory in the immediate short term, albeit likely with limited vigor. However, it is also plausible that the ratio may enter a period of consolidation or experience a minor corrective pullback toward its 7-day average of 2.935 before potentially attempting to establish new highs. A sustained breakthrough above the 2.990 level would be required to confirm renewed bullish momentum with higher conviction. Conversely, a decisive move below the average ratio would likely signal a shift towards a more neutral or weakening trend for this particular ratio.
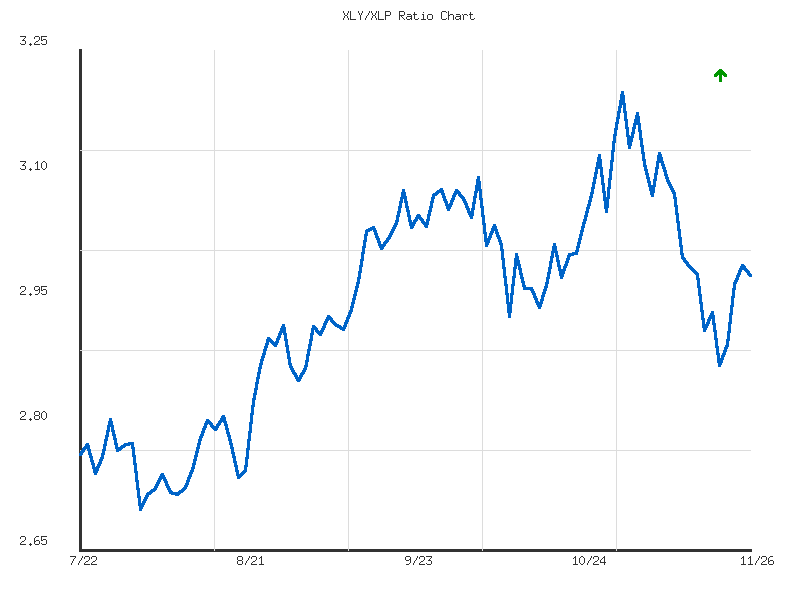
As a Chartered Market Technician with over 15 years of experience, I have analyzed the provided 90-day XLY/XLP ratio data, focusing exclusively on its technical patterns and using strict estimative language. The XLY/XLP ratio, which compares the Consumer Discretionary sector to the Consumer Staples sector, often serves as an indicator of market risk appetite. An increasing ratio suggests a preference for riskier assets (XLY) over defensive ones (XLP).
Over the 90-day period from July 22, 2025, to November 26, 2025, the XLY/XLP ratio has exhibited an overall upward trend, moving from approximately 2.76 to its current level of 2.978. The embedded trend analysis confirms an “up” direction with “moderate strength,” reflecting a 7.8% increase during this timeframe. The ratio’s trading range spanned from a 90-day low of 2.695 on August 1st to a high of 3.199 recorded on November 3rd. The current ratio of 2.978 is positioned above the average ratio of 2.938 for the period and stands slightly above the midpoint of its observed range, indicating a bias towards the higher end of its recent historical performance. The noted volatility of 0.0171 is relatively low, suggesting the observed directional movements were not characterized by extreme day-to-day fluctuations.
Following an early August low, the XLY/XLP ratio entered a distinct uptrend, marked by several constructive phases. Initial resistance around the 2.80-2.82 level, observed in late July and early August, was successfully overcome and subsequently appeared to function as support in mid-August. A similar pattern was observed around the 2.90-2.92 level in late August and early September. The ratio demonstrated notable strength through September, breaching the psychological 3.00 level mid-month and extending its ascent into early October, establishing intermediate highs around 3.097. While minor pullbacks occurred, such as the one around October 10th where the ratio dipped to 2.928, these were generally contained and short-lived, failing to negate the prevailing bullish momentum. This price action throughout the majority of the 90-day period underscores a consistent underlying demand for consumer discretionary assets relative to consumer staples.
The ratio reached its 90-day peak of 3.199 on November 3rd, marking a strong culmination of the prior upward momentum. However, this peak was immediately followed by a distinct and sharp corrective phase. From November 3rd to November 20th, the ratio experienced a significant decline of approximately 10.2%, dropping to a low of 2.869. This substantial retracement represents the largest single decline observed within the 90-day analysis period. The most recent price action, from November 20th to November 26th, shows a notable bounce from this low, with the ratio recovering to 2.978, regaining a portion of the recent loss. This rebound from the Nov 20th low is a critical development for assessing the near-term trajectory.
The immediate outlook is critically influenced by the current bounce from the November 20th low, which has carried the ratio back above its 90-day average. We assess there is a roughly even chance that this rally could be a re-establishment of the broader uptrend. This scenario is contingent upon the ratio sustaining its upward momentum and successfully overcoming previous resistance levels, specifically the 3.00 to 3.05 area observed in late October. Should the ratio fail to breach these resistance levels and instead begin to decline, we would then assess a roughly even chance that the current upward movement is an interim rally within a developing downtrend originating from the November 3rd peak. A decisive break and sustained trading below the November 20th low of 2.869 would make a full trend reversal to the downside likely. Conversely, a sustained move and hold above the 3.05 level would make a retest of the 90-day high of 3.199 likely within the near term.
Ratio Analysis: XLY/XLP
Generated for 90days timeframe analysis
Equity Breadth
The recent 7-day data for S&P 500 breadth indicators reveals a notable shift in market participation. The percentage of S&P 500 members trading above their 50-day Moving Average (SPXA50R) initially declined from 36% on November 18th to a low of 29.6% on November 20th. This movement suggested a contraction in short-to-medium term bullish momentum, with a significant minority of components holding above their 50-day average. However, following this dip, the indicator experienced a sharp rebound, steadily climbing to 57.2% by November 26th. This rapid recovery above the 50% threshold likely indicates a renewed and broadening short-term uptrend among S&P 500 constituents.
Concurrently, the percentage of S&P 500 members above their 200-day Moving Average (SPXA200R) followed a remarkably similar trajectory. It began at 47.8% on November 18th, briefly dipped to 42.6% on November 20th, and then consistently rose to 55.4% by November 26th. This parallel movement suggests that the improvement in market breadth is not confined to just short-term price action but is also influencing the longer-term health of individual components. The move of SPXA200R above 50% is likely a significant technical development, signaling increased participation in a longer-term uptrend.
The synchronous rebound and subsequent increase above the 50% mark for both the 50-day and 200-day breadth indicators is a strong technical observation. It is highly likely that this simultaneous expansion in participation indicates an improving underlying market structure for the S&P 500. When over half of the components are trading above both their intermediate and long-term moving averages, it generally points to a more robust and sustainable upward bias for the index itself. This broad-based strength reduces the risk of an index rally being driven by only a few large-cap stocks.
Considering alternative scenarios, it is plausible that this rebound represents a temporary correction from an oversold condition rather than a definitive trend reversal. A subsequent and rapid decline in both SPXA50R and SPXA200R below the 50% threshold, particularly if accompanied by an increase in volatility, would probably invalidate the current bullish interpretation of market breadth. However, based solely on the provided data, the sustained upward movement over the past four days, pushing both indicators comfortably above 50%, strongly suggests an emerging positive trend in market breadth. Continued monitoring for divergence between the index performance and these breadth indicators will be critical; a rising SPX with declining breadth would make a sustained rally unlikely.
SPY Daily
SPY has demonstrated notable volatility and a strong recovery over the past seven trading days, with the most recent daily candle suggesting renewed bullish momentum. Following a sharp decline on November 20th to a low of 651.89 with significant volume (154.7M), pushing the RSI below 40 to 35.10, SPY exhibited a swift rebound. The subsequent three trading days (November 21st, 24th, and 25th) saw price recover steadily, with the RSI climbing from oversold territory to approximately 53.86. The session on November 26th extended this recovery, closing near its daily high at 679.64 on average volume, with the RSI reaching 56.84, indicating building upward momentum from the recent low. This quick recovery from an oversold condition, especially reclaiming levels above the 50-day Exponential Moving Average (EMA), typically suggests robust buying interest emerging after a period of weakness.
The broader technical picture remains generally constructive. The 50-day EMA, currently positioned at 666.47, is trending upwards and remains well above the 200-day EMA, which is at 627.66 and also rising. This “golden cross” configuration of EMAs indicates a sustained long-term uptrend. The recent dip on November 20th saw SPY briefly trade below its 50-day EMA, but the price quickly recovered above this dynamic support level by November 24th. This re-establishment above the 50-day EMA reinforces the underlying bullish trend and suggests that this moving average is likely to act as a significant support zone around the 665-667 level in the near future.
Resistance is likely to be encountered in the 685-690 price range, defined by prior highs observed in late October (e.g., high of 689.7 on October 29th) and mid-November (high of 684.96 on November 12th). Should SPY manage to decisively break above this zone, particularly on increasing volume, it would likely signal a continuation of the rally toward new all-time highs. Conversely, immediate short-term support resides at the prior low of approximately 651.89 from November 20th.
Considering alternative scenarios, a bullish case suggests that the strong bounce from the November 20th low, coupled with the RSI moving towards neutral from oversold, could provide the impetus for SPY to challenge and potentially surpass the 685-690 resistance, with a high likelihood of continued upward momentum. In contrast, a bearish scenario might materialize if SPY encounters resistance in the 685-690 zone and fails to sustain its upward trajectory, possibly leading to a retest of the 50-day EMA (around 666) or even the recent 650-652 support area. There is also a roughly even chance of a neutral scenario developing, wherein SPY consolidates within a range, possibly between the 50-day EMA and the 685-690 resistance, as market participants assess the sustainability of the recent rebound.
From a purely technical perspective, sentiment appears to be shifting back towards bullishness after the recent shakeout. The aggressive buying that lifted SPY out of oversold conditions and back above its 50-day EMA suggests that dip buyers remain active. However, the high volume associated with the November 20th decline indicates that there is still a notable presence of sellers who may be inclined to take profits or initiate short positions as price approaches prior resistance levels. The struggle around the 685-690 zone will likely serve as a critical test for market participants’ conviction.
As a Chartered Market Technician, my analysis of SPY over the past 90 days, based solely on the provided price and 14-day Relative Strength Index (RSI) data, suggests a nuanced technical picture.
The SPY has exhibited an overarching bullish trend over the 90-day period, characterized by a general ascent from the low in late July to near the by late November, establishing a pattern of higher highs and higher lows. This upward trajectory was interspersed with notable corrections. A significant pullback occurred in early August, with prices declining from approximately to , accompanied by exceptionally high volume. Another sharp correction in mid-October saw SPY fall from about to , again supported by substantial selling volume. The most recent price action, spanning from mid-November to the end of the data set, reveals a sharp decline from near to a low of on November 20. This was immediately followed by a robust recovery to close near .64 by November 26, forming a discernible V-shaped pattern on the chart. This recovery suggests strong demand emerged at the recent low. The prior peak around from late October likely represents a key near-term resistance level.
Volume data provides additional context to these price movements. The high-volume selling observed during the early August and mid-October corrections, along with the particularly high volume (over 150 million shares) on November 20 as SPY hit its low, suggests strong conviction behind these downside movements. Conversely, the subsequent rebound in the final trading days, while substantial in price, has generally occurred on moderating or lower volume compared to the significant selling spikes. This diminished volume accompanying the recent recovery introduces a degree of uncertainty regarding the underlying strength of the upward move, suggesting a roughly even chance that the rally might face headwinds without further confirmation from stronger buying interest.
The 14-day Relative Strength Index (RSI) further illuminates market sentiment. In late July, the RSI consistently registered above 70, indicating overbought conditions and preceding the early August pullback that brought the RSI down to 47. For much of August and September, the RSI mostly remained above the 50-level, consistent with an ongoing uptrend, occasionally touching overbought territory (e.g., above 70 in mid-September). During the mid-October correction, the RSI plunged from the low 70s to approximately 41.8. Most recently, the RSI saw a significant decline from near 70 (late October) to a clearly oversold level of 35.1 on November 20. The subsequent sharp price recovery has propelled the RSI back to 56.84 by November 26. This move from oversold territory and a cross above the 50-level indicates a likely shift towards positive short-term momentum.
Considering the combined technical signals from the price action and RSI, the SPY appears to be in an immediate recovery phase. The robust price rebound from the November 20 low, coupled with the RSI moving out of oversold conditions and above the 50-level, makes it likely that this short-term upward momentum could continue. However, the relatively lighter volume on the recent rally compared to the preceding high-volume selling introduces a cautionary note regarding its sustained strength. There is a plausible scenario for SPY to retest the prior resistance zone near . Conversely, it might encounter significant resistance in the - range, leading to consolidation or a renewed pullback. A decisive breach above on strong volume would significantly increase the likelihood of further upward progression, while a failure to advance beyond current levels, particularly if accompanied by weak volume or a bearish reversal pattern, would suggest a higher probability of retesting recent support, possibly towards or the range.