Daily Market Technical Analysis
The market displays a broad bullish bias across equity indices and S&P 500 sectors over the last two days, with small and mid-cap segments exhibiting outperformance. SPY has rebounded robustly from oversold conditions, and improving breadth indicators suggest strengthening internal market health; a continued upward momentum is highly likely. However, technology-focused QQQ faces a roughly even chance of consolidation, while NVDA and CRWV show likely bearish reversals requiring careful monitoring. The energy commodity complex (USO, UNG, UGA) is experiencing significant downward pressure, signaling likely further declines. Conversely, Treasury bonds, particularly longer durations, demonstrate likely continued upward momentum amid decreasing implied volatility (VIX). Investors should prioritize broad market strength while watching for sector rotations and specific equity vulnerabilities.
Market Indices
The provided market data presents a consolidated view of daily percentage changes across several key U.S. equity indices. Sorted in descending order, the performance for the recent trading session is as follows:
| Symbol | Daily Percent Change |
|---|---|
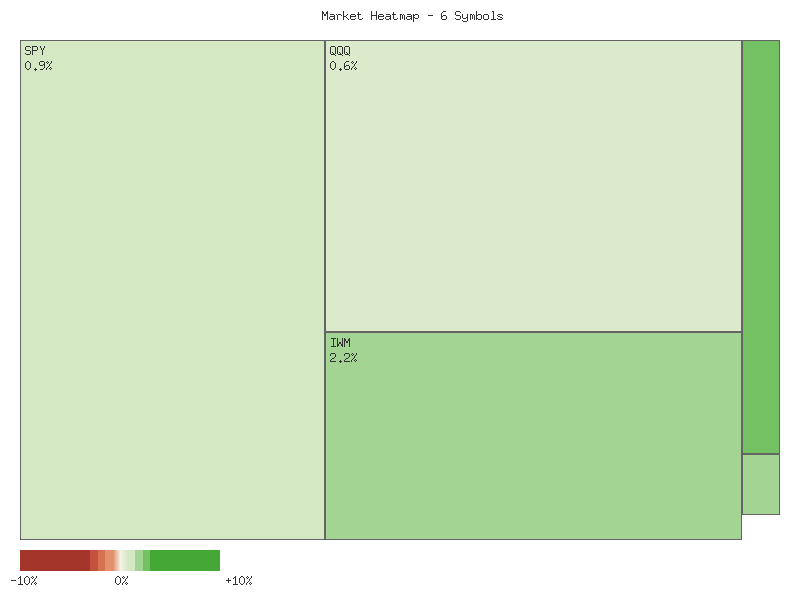
| IJR | 2.61% |
| IWM | 2.18% |
| MDY | 1.84% |
| SPY | 0.93% |
| OEF | 0.75% |
| QQQ | 0.58% |
This observation reveals a uniformly positive session, as all six tracked symbols concluded the day with gains.
The market breadth, based on this specific selection of ETFs, appears robustly positive for the observed period. With all six symbols—representing small-cap (IJR, IWM), mid-cap (MDY), large-cap (SPY, OEF), and growth-oriented large-cap (QQQ) segments—advancing, it indicates a high degree of participation across market capitalizations. This widespread upward movement suggests that market strength was broadly distributed rather than concentrated in a few specific areas. It is likely that this broad participation contributes to an overall perception of market strength for the session.
Examining the relative performance, it is highly probable that small- and mid-cap indices led the market on this particular day. IJR (S&P SmallCap 600) and IWM (Russell 2000) recorded the most significant gains, followed by MDY (S&P MidCap 400). In contrast, the large-cap oriented SPY (S&P 500) and OEF (S&P 100), along with the tech-heavy QQQ (Nasdaq 100), registered more modest, albeit still positive, advances. This divergence in performance suggests a potential shift in investor preference towards smaller and more cyclically sensitive segments, or at minimum, a notable broadening of market leadership beyond the typical mega-cap influences.
While a single day’s data provides limited context for long-term trends, the unanimous positive performance and strong breadth, particularly the outperformance of small and mid-caps, points to a likely constructive immediate-term market environment. However, it is a roughly even chance that this momentum will sustain into subsequent sessions without further confirming data, as market dynamics can shift rapidly. An alternative scenario suggests that this could be a temporary rotation, and large-cap leadership could reassert itself. Further observation of successive trading days would be essential to ascertain if this broad-based strength represents the beginning of a sustained trend or merely a single-session anomaly.
Technical Market Commentary: Two-Day ETF Performance Analysis (November 24-25, 2025)
Analysis of the provided two-day candle data for SPY, QQQ, IWM, IJR, MDY, and OEF indicates a broad-based display of bullish momentum across various market capitalization segments. All six exchange-traded funds (ETFs) concluded the two-day period with notable gains, reflecting a strong upward trajectory. For SPY, IWM, and IJR, the second day of trading (November 25) saw an increase in volume alongside robust price appreciation, which we judge with high confidence signals continued buying pressure and confirms the strength of the bullish sentiment. These instruments exhibited clear consecutive bullish candles, consistently closing near their daily highs, suggesting sustained demand.
The SPY, representing large-cap equities, demonstrated two consecutive strong bullish candles, achieving higher highs and higher lows, with an expanding range on the second day supported by increased volume. Similarly, IWM (Russell 2000) and IJR (S&P SmallCap 600), both proxies for small-cap performance, displayed exceptionally strong bullish action. Both small-cap ETFs recorded significantly expanded ranges and closed very near their highs on November 25, reinforced by a notable increase in trading volume. This price-volume action in the small-cap segment strongly suggests that market participants are rotating into or expanding exposure to riskier assets, signaling widespread market optimism. A continuation of this upward momentum for these segments appears likely in the immediate term.
QQQ (Nasdaq 100), MDY (S&P MidCap 400), and OEF (S&P 100) also registered two consecutive bullish days. However, a minor divergence exists with these ETFs: while their price action remained decidedly bullish, their trading volumes on November 25 showed a slight decrease compared to November 24. For QQQ, the second day’s bullish candle had a relatively smaller body and a more pronounced upper wick compared to the first day, despite closing higher. This suggests that while buyers maintained control, there was some intra-day selling pressure at the higher price levels. Given the strong preceding price action, it is unlikely this volume dynamic immediately negates the bullish trend, but it does introduce a roughly even chance that these particular ETFs could experience minor consolidation before further upward movement.
In summary, the aggregated technical picture across these diverse ETFs strongly points to a market exhibiting significant bullish conviction over the past two trading days. All observed instruments have successfully cleared the resistance levels established by their prior day’s highs, with current immediate overhead resistance now defined by their respective November 25 daily highs. Given the consistent higher closes and the accompanying volume support in key segments, it is highly likely that the broader market will test these newly established resistance levels in the upcoming session. While minor volume discrepancies in QQQ, MDY, and OEF warrant monitoring, the overall pattern suggests that a sustained short-term uptrend is the most probable scenario.
Performance Heatmap (SPY, QQQ, IWM, IJR, MDY, OEF)
Generated for 2days timeframe analysis
As a CMT with extensive experience, I’ve conducted a rigorous technical analysis of SPY using the provided 90-day candle and 14-day Relative Strength Index (RSI) data. It is important to note that MACD data, while mentioned in the chart description, was not provided in the detailed market data for analysis and is therefore not included in this assessment.
Over the 90-day period, SPY exhibited a clear upward trend, characterized by sequential higher highs and higher lows until the recent November correction. Initial price action from late July saw SPY reach peaks around , accompanied by an RSI well into overbought territory (above 70). This was followed by a sharp pullback in early August, where SPY declined to approximately , with RSI dropping significantly into the upper 40s. Following this consolidation, a robust uptrend emerged, propelling SPY to new highs through September and into early October. Volume analysis indicates that significant price movements, particularly sharp declines such as on August 1st and October 10th, were often accompanied by elevated trading volumes, suggesting strong conviction behind these moves.
The upward momentum in September saw RSI consistently hovering around or above the 70 overbought threshold, particularly from mid-September to early October, as SPY progressed from the mid- to the . This extended period of overbought readings, while typically signaling caution, also underscored the strength of the bullish trend during that phase. However, a notable shift occurred on October 10th, when SPY experienced a substantial decline from approximately to . This sharp price drop was mirrored by the 14-day RSI plunging from the mid-60s to approximately 41.8, reflecting a significant bearish impulse and a rapid dissipation of bullish momentum.
Subsequent to the October 10th correction, SPY embarked on another leg higher, establishing a significant resistance level around - in late October. During this phase, RSI again approached overbought levels, reaching roughly 69.7. The period from late October through mid-November then witnessed another correction, with SPY retreating from its late October peak. This decline was characterized by the 14-day RSI progressively moving downwards, eventually entering the low-to-mid 30s by November 20th. This marked a deeply oversold condition, indicating intense selling pressure and a likely exhaustion of sellers in the short term, which often precedes a bounce or consolidation.
In the most recent trading days, SPY has rebounded from a low around - on November 20th to close at .01 on November 25th. The 14-day RSI has concurrently recovered from its oversold reading of 35.1 to approximately 53.8, suggesting a significant easing of immediate bearish pressure and a re-establishment of more neutral momentum. The - price zone now appears to be a critical short-term support level, having been tested and held on two separate occasions (October 10th and November 20th). However, the late October peak of - now presents a substantial resistance hurdle, with the current price rebound yet to challenge this level directly.
Considering the recent price action and indicator readings, there is a roughly even chance of SPY continuing its short-term bounce towards the - range, potentially testing the prior lower high established in early November. A sustained break above this immediate resistance, followed by a challenge and eventual break of the - resistance with increasing volume and RSI re-entering overbought territory, would likely signal a resumption of the broader upward trend. Conversely, a failure to overcome these resistance levels, coupled with a renewed decline that breaches the - support, particularly on higher volume, would likely indicate a deeper correction or a potential shift to a more bearish intermediate-term trend. Traders should closely monitor volume and RSI for confirmation signals in either direction.
SPY Price & Indicators (RSI_14_DAY, MACD_13_21_DAY)
Technical Analysis of QQQ (90 Days)
The NASDAQ 100 ETF (QQQ) has demonstrated a complex interplay of bullish expansion and significant corrective phases over the past 90 days. The price action from mid-August through late October established a discernible uptrend, with QQQ advancing from roughly to a peak around by October 29th. This robust ascent was supported by the 14-day Relative Strength Index (RSI), which consistently resided in overbought territory (above 70) during much of this period, reaching 75.35 on September 22nd and 71.73 on October 29th. These readings indicate strong buying pressure and sustained bullish momentum, suggesting a high probability of continued upward movement within that specific timeframe.
However, the bullish momentum experienced a pronounced shift beginning in late October. From its peak on October 29th, QQQ initiated a sharp decline, characterized by a series of large red candles and notably elevated trading volumes. Significant selling pressure became evident, particularly between October 30th and November 7th, where QQQ dropped from approximately to about , with daily volumes frequently exceeding 60 million shares. This downward pressure accelerated dramatically from November 13th, culminating in a sharp sell-off to a low of .75 on November 20th, accompanied by exceptionally high volume of over 111 million shares. Such high volume on a steep decline often indicates capitulation or widespread distribution, making a significant bearish shift likely.
The 14-day RSI corroborated this bearish turn, dropping decisively from its overbought readings above 70 to near oversold levels, registering 35.35 on November 20th. This movement below the 50-mark for a sustained period signaled a clear loss of bullish momentum and the establishment of a short-term bearish trend. The current price action, observed from November 21st to November 25th, shows a rebound from the November 20th low, pushing QQQ back towards the - range. The RSI has simultaneously recovered to approximately 50.69, indicating that the immediate oversold conditions have alleviated and momentum is now approaching a neutral state.
Considering these patterns, it is a roughly even chance that the current rebound is either a short-term relief rally within an ongoing corrective phase or the very early stages of a nascent recovery. A sustained upward movement beyond the current price levels is unlikely without QQQ demonstrating a more decisive break above resistance levels, such as the - zone, coupled with a strong conviction move in the RSI above 55-60. Conversely, a retest of the - support zone is probable if buying interest wanes or if the current rally proves unsustainable. A failure to hold this support would make further downside continuation likely.
It is important to note that analysis of the MACD indicator (13,21-day) was requested but the corresponding data was not provided in the market data for analysis. Therefore, this component has been omitted from the current technical assessment.
QQQ Price & Indicators (RSI_14_DAY, MACD_13_21_DAY)
Technical Analysis Commentary on IWM (90-Day View)
IWM’s price action over the last 90 days has exhibited notable volatility, characterized by distinct phases of upward momentum and significant pullbacks. Following an initial downtrend in late July into early August, the index established a robust rally through mid-September, reaching a peak around - by September 18th. This was followed by a period of consolidation and a moderate decline into early October. A subsequent attempt at a new high in mid-October, reaching approximately , was not sustained, leading to a sharp downturn that culminated in a low around by November 20th. However, the most recent trading days, specifically November 21st, 24th, and 25th, have witnessed a pronounced two-day rebound from this low, with prices climbing from .14 to .13. This analysis is solely based on the provided 14-day Relative Strength Index (RSI) and candle chart data, as MACD data was not available for review.
The 14-day Relative Strength Index (RSI) provides critical insights into momentum and potential reversals. During the initial rally from early August, RSI ascended from an early August low of 41.36, briefly touching overbought territory (above 70) on September 18th with a reading of 71.23. Subsequently, as IWM’s price attempted to establish new highs in mid-October (approx. on Oct 15) and late October (approx. .30 on Oct 27), the RSI exhibited a clear bearish divergence. Specifically, the RSI peaked at 62.99 on October 15th and then at 58.76 on October 27th, while prices made comparable or slightly higher highs compared to the September 18th price peak. This pattern, where price makes higher highs but the indicator makes lower highs, signaled weakening momentum and it was likely that a significant price correction would ensue. Indeed, this divergence preceded the notable decline into mid-November, where the RSI descended sharply, reaching a near oversold level of 32.63 on November 20th.
The recent price rebound has been accompanied by a rapid improvement in the RSI. From its November 20th low of 32.63, the RSI has recovered significantly, closing at 56.13 on November 25th. This upward trajectory in RSI, moving away from oversold conditions and approaching the neutral 50-60 range, suggests a potential for continued upward price movement in the immediate short term. It is likely that the momentum from the two-day rebound will persist, at least in the very near term, as the market digests this sharp recovery. The previous resistance levels around -, established in mid to late October, will likely present a challenge to further sustained advances.
Considering the technical factors, there is a roughly even chance that IWM will encounter resistance as it approaches the - price area, given the prior failure to sustain breakouts above these levels and the preceding bearish divergence in RSI. While the current momentum is positive, a retest of these resistance zones could lead to consolidation or another short-term pullback. An alternative scenario suggests that if the current buying interest proves robust enough to convincingly breach on increasing volume, then a more sustained bullish phase becomes likely. However, without additional indicators or further compelling price action, the likelihood of a straightforward, unimpeded climb above prior highs is not sufficiently clear from the provided data. Traders should observe whether the index can consolidate above the level to establish a new support base.
IWM Price & Indicators (RSI_14_DAY, MACD_13_21_DAY)
VIX Fear Index
The VIX experienced a significant surge in implied volatility during the initial days of the observation period, rising from an open of 19.58 on November 17th to a peak close of 26.41 on November 20th. This upward trajectory was characterized by strong bullish candles, including one on November 20th that touched a high of 28.27. This pattern strongly indicated a period of increasing market uncertainty and risk aversion, with clear upward momentum in implied volatility during this segment of the provided data.
Following this peak, the VIX entered a pronounced downtrend. The candle on November 21st showed an initial bearish reversal from its open. This bearish momentum intensified with a strong red candle on November 24th, closing near its daily low. The decline culminated on November 25th with a significant price drop, evidenced by a close of 18.62 and a daily percentage change of -9.79%. This strong bearish candle on the final day, pushing the VIX decisively below its November 17th open, makes it likely that market participants are anticipating or experiencing a reduction in near-term volatility.
The decisive close below the 19.58 level, coupled with the sharp daily percentage decrease, suggests that a further contraction in implied volatility is likely in the immediate term, potentially testing lower support levels. The sustained bearish pressure over the last three sessions points to a resolution of prior uncertainty. However, the VIX often exhibits mean-reversion tendencies, and there remains a roughly even chance that the current lower levels could represent a temporary consolidation before another upward surge if underlying market conditions were to shift unexpectedly. Absent such shifts, continued market stability would render a sustained VIX decline likely.
VIX Technical Analysis: Navigating Evolving Volatility (90-Day Outlook)
The VIX index, commonly known as the market’s “fear gauge,” has presented a discernible pattern of escalating volatility over the past 90 days, characterized by a series of higher highs and sharp, though temporary, pullbacks. Analysis of the VIX candle data reveals three primary spikes in implied volatility: an early August peak around 20.38, a more pronounced surge to 21.66 in mid-October, and the most recent ascent to 26.41 on November 20. Each of these significant VIX rallies was accompanied by its 14-day Relative Strength Index (RSI) entering or closely approaching overbought territory (above 65, specifically 73.09 on October 10 and 71.67 on November 20). This consistent correlation between VIX price spikes and overbought RSI conditions suggests that the RSI has served as a reliable momentum gauge within this observed period, signaling periods of heightened short-term volatility.
The most recent data points indicate a sharp retreat in VIX from its November 20 peak. Following the VIX’s close at 26.41 on November 20, the index has pulled back significantly, closing at 18.62 on November 25. Concurrently, the 14-day RSI has mirrored this price action, declining from an overbought reading of 71.67 to a more neutral 46.73. This rapid unwinding from overbought conditions is likely to signal a short-term reduction in the immediate upward pressure on VIX. The current technical configuration implies that the period of intense fear or uncertainty that drove the VIX to recent highs is undergoing a tactical easing.
From a structural perspective, the VIX is now positioned near a critical juncture. The area between 18 and 19 has historically functioned as a pivotal zone, sometimes offering support following volatility spikes or acting as resistance during periods of market calm. A sustained move below this range, particularly if the RSI continues its downward trajectory and approaches the lower end of its neutral zone (below 40), would suggest a moderately high likelihood of further VIX deceleration and a more extended period of reduced market anxiety. However, considering the established pattern of rebounding from such pullbacks, it is plausible that this level could act as a temporary floor.
Looking ahead, the VIX’s behavior around the 18-19 support zone will be critical in determining its near-term direction. Should the index consolidate around these levels and the RSI stabilize or show signs of turning upward from its current neutral position, a renewed increase in volatility expectations would become more probable. The 26-28 region remains a significant overhead resistance level, demonstrated by the VIX’s inability to sustain closes above this area during its most recent surges. Given the series of successive higher VIX peaks observed over the past three months, it is unlikely that the index will remain in a calm, low range for an extended period without retesting higher volatility levels.
VIX Price & Indicators (RSI_14_DAY, MACD_13_21_DAY)
Tech Sector Analysis
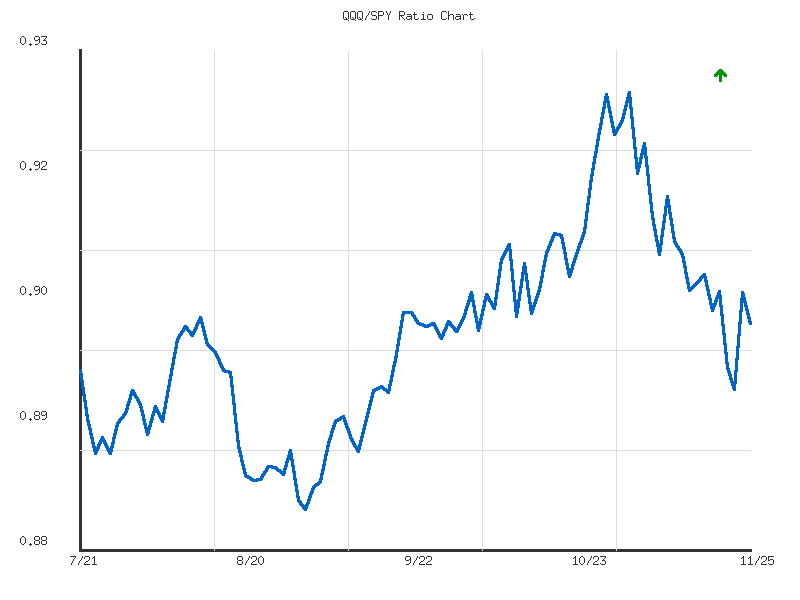
The provided data indicates a likely underperformance of the NASDAQ-100 (QQQ) relative to the S&P 500 (SPY) over the recent 14-day observation period. The overall trend in the QQQ/SPY ratio is identified as ‘down’ with ‘weak’ strength, reflecting a -1.16% decline in relative performance. This suggests that the technology-heavy index has, on balance, been losing ground against the broader market during this timeframe.
The ratio initiated the period near 0.9126 on November 6th and reached its highest point at 0.9146 on November 10th. Following this peak, it is highly probable that QQQ began to lose relative strength, as the ratio subsequently declined to its lowest point of 0.8954 on November 21st. This pattern established a series of lower highs and lower lows for the majority of the observed timeframe, which implies a consistent, albeit weak, shift in relative market leadership away from QQQ. The current ratio of 0.9020 on November 25th sits at approximately 34% of the way between the period’s low and high, confirming that it remains in the lower portion of its recent range.
Toward the end of the period, the ratio exhibited a minor rebound from its November 21st low, rising to 0.9050 on November 24th before settling slightly lower at 0.9020 on November 25th. This recent price action could suggest a potential stabilization or a temporary pause in the relative downtrend. However, given the weak overall downward trend and the low volatility of 0.0000258 observed, which indicates a lack of strong conviction behind moves, a continuation of QQQ’s relative underperformance remains probable in the immediate short term. There is a roughly even chance that the recent bounce represents a minor corrective move within the broader downtrend or a precursor to a more significant stabilization. A definitive shift would likely require sustained upward momentum in the ratio, breaking above recent lower high levels.
Technical Analysis: QQQ/SPY Relative Performance (90-Day View)
The QQQ/SPY ratio over the past 90 days, spanning from late July to late November, has demonstrated distinct phases of relative strength between the Nasdaq 100 (QQQ) and the S&P 500 (SPY). While the provided overarching trend analysis characterizes the 90-day period as “sideways” with “weak” strength, reflecting a net change of merely 0.53% from start to finish, a closer examination of the internal price action reveals significant shifts in market leadership. The ratio began the period around 0.897, experienced a notable rally, and has recently undergone a pronounced pullback, culminating at 0.902 as of the last data point on November 25th. The entire observed range has been between a low of 0.8834 and a high of 0.9250, indicating periods where QQQ significantly outperformed and underperformed SPY.
Following an initial dip in late July and early August, where the ratio touched a low around 0.888-0.890, a robust period of QQQ outperformance commenced. From its low of 0.8834 on September 2nd, the ratio embarked on a sustained ascent, establishing a clear uptrend that lasted until early November. This phase saw QQQ consistently gaining ground relative to SPY, reaching its 90-day peak of 0.9250 on November 3rd. This extended rally suggests a period where growth and technology stocks, prominent in QQQ, were largely favored over the broader market represented by SPY, indicating strong conviction in that sector during this interval. The move from the early September low to the early November high represents a substantial 4.7% increase in relative strength.
However, the momentum shifted decisively after the November 3rd peak. Since then, the QQQ/SPY ratio has experienced a significant and relatively rapid decline. This reversal indicates that SPY has been outperforming QQQ in the most recent trading weeks, suggesting a rotation away from the tech-heavy Nasdaq 100 or a broader market catch-up. The current ratio of 0.9020 is a substantial retreat from the peak, retracing approximately 55% of the prior uptrend’s gains. This level around 0.902-0.903 has previously acted as both a minor resistance level in mid-August before being broken, and then a consolidation area in late September, suggesting it may now offer some immediate technical support.
Looking forward, the immediate bias is for continued pressure on QQQ’s relative strength against SPY. Given the pronounced downtrend since early November, it is likely that the ratio will continue to test lower support levels in the near term. A critical support zone appears to be established around the 0.890-0.895 range, which saw multiple instances of support and resistance during late July and early August. The most robust support observed within this 90-day dataset lies near the 0.8834 level from early September. A break below the current 0.902 level, which appears to be occurring, would probably lead to a retest of the 0.890-0.895 area. Conversely, for QQQ to regain relative strength, the ratio would need to establish a base and then overcome the resistance formed by the recent decline, with initial resistance roughly around 0.910-0.915, representing the recent consolidation high. A resurgence to challenge the 0.9250 peak in the short term appears unlikely, given the current bearish momentum.
Ratio Analysis: QQQ/SPY
Generated for 90days timeframe analysis
IWM vs. SPY
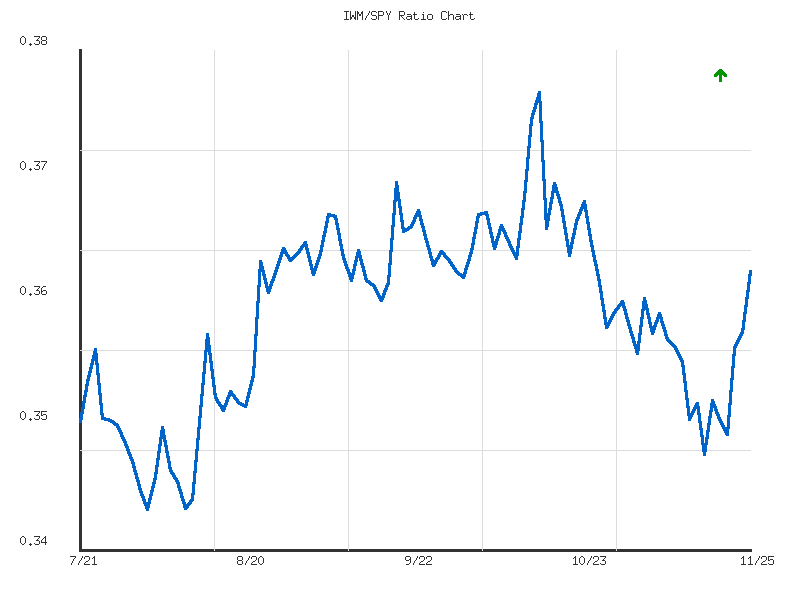
An analysis of the RATIO:IWM/SPY over the provided 14-day period indicates a nuanced picture regarding the relative performance of the Russell 2000 (IWM) against the S&P 500 (SPY). The data summary identifies an overall “up” trend with “weak” strength, reflecting a net increase of 1.26% in the ratio. The ratio commenced near 0.3586 on November 6th and concluded at 0.3631 on November 25th, which is also the high point for the observed period. This suggests that while the broader relative trend for this specific window is upward, its overall intensity has been subdued, possibly due to intra-period fluctuations masking a more decisive underlying momentum.
Examining the price action within this 14-day span reveals a distinct two-phase movement. Following an initial slight peak around 0.3601 on November 7th, the IWM/SPY ratio experienced a decline, reaching a low of approximately 0.3496 by November 17th. This sustained downward movement over several trading sessions suggests a period where the S&P 500 was likely outperforming the Russell 2000. However, from November 18th, the ratio decisively reversed course, initiating a consistent ascent that culminated in the period’s high of 0.3631 on November 25th. This recent upward trajectory appears to be a more robust move, with IWM regaining relative strength against SPY in the latter half of the analysis window.
Based on the recent price action, it is highly likely that IWM is currently experiencing a period of relative outperformance against SPY. The ratio’s ability to not only recover from its 14-day low but also establish a new high suggests emerging strength in the small-cap segment relative to large-cap technology-heavy stocks. We assess with moderate confidence that this relative strength will probably continue in the immediate short term, provided the ratio holds above its recent support levels. However, given the overarching “weak” strength reported for the entire 14-day trend, there is roughly an even chance that this recent surge could represent a temporary mean reversion rather than the initiation of a sustained leadership rotation. Traders should observe whether the ratio can maintain above the previous high of 0.3601 to confirm continued relative strength. Failure to do so might indicate a reassertion of the weaker overall trend, suggesting a return to SPY outperformance.
As a Chartered Market Technician with 15 years of experience, the provided 90-day ratio data for IWM/SPY presents a clear technical picture of relative performance. The ratio, representing the strength of Russell 2000 (IWM) against the S&P 500 (SPY), has exhibited a moderate upward trend over the observed period. This implies a general environment where small-cap equities have moderately outperformed their large-cap counterparts. The ratio’s value has appreciated by approximately 3.12% during this window, moving from an early August low of 0.34568 to its most recent reading of 0.36315. The current ratio stands above its 90-day average of 0.35990, reinforcing the prevailing upward bias. All price action has been contained within a defined range, with the absolute low at 0.34568 and the high at 0.37633. The low volatility recorded (0.000047) suggests that this trend has been relatively orderly, without extreme price swings.
From a structural perspective, key technical levels have emerged over the 90-day period. A significant support zone for the IWM/SPY ratio appears to be established around the 0.345-0.347 range, as evidenced by price reversals in late July and early August. This area previously acted as a base where buying interest was sufficient to stem relative declines. More recently, the ratio demonstrated resilience by finding support around 0.35232 in mid-November, forming what appears to be a higher low relative to the August bottom. On the resistance side, the 90-day high of 0.37633, recorded on October 15, marks a critical overhead barrier. This peak was followed by a noticeable retracement, indicating that sellers became more aggressive at or above this level, creating a zone of significant supply.
Considering the recent dynamics, the IWM/SPY ratio has experienced a robust rebound from its mid-November low of 0.35232, climbing to 0.36315. This upward movement suggests a renewed phase of relative outperformance for small caps. Given the formation of a higher low and the current position above the 90-day average, it is likely that the moderate upward trend will continue in the near term. This suggests a plausible scenario where the ratio will test the resistance area around 0.368, a level that previously curtailed advances in mid-October. A decisive breach above 0.368 would then open the path for a challenge of the 90-day high at 0.37633. Conversely, should the resistance near 0.368 prove formidable, there is a roughly even chance that the ratio could enter a period of consolidation or experience a minor pullback towards the 0.358-0.360 region (approaching the 90-day average) before a potential renewed attempt at higher levels. It is unlikely that the ratio will rapidly revert to the absolute 90-day low of 0.34568 without first decisively breaking below the more recent and stronger support level established at 0.35232.
Ratio Analysis: IWM/SPY
Generated for 90days timeframe analysis
Commodities
| Symbol | Daily Percent Change |
|---|---|
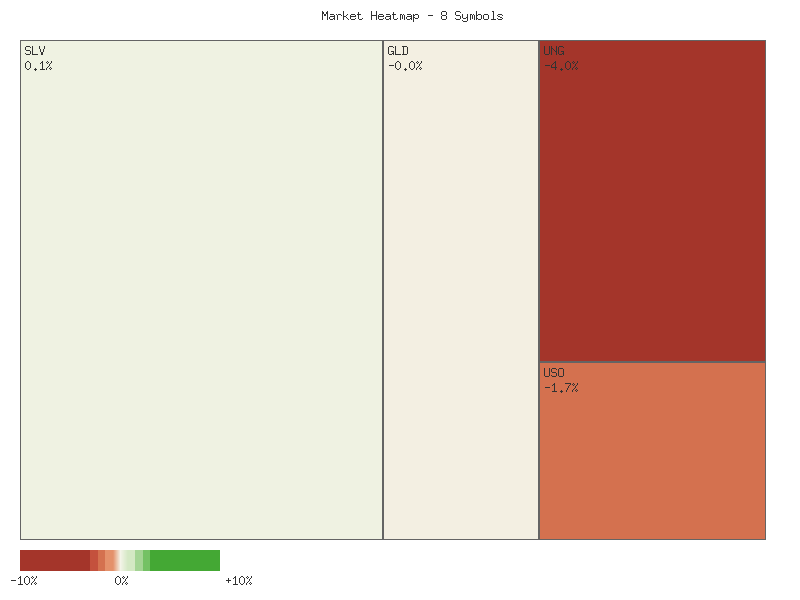
| CORN | 0.313% |
| CPER | 0.257% |
| SLV | 0.113% |
| GLD | -0.035% |
| DBC | -0.530% |
| UGA | -1.652% |
| USO | -1.703% |
| UNG | -4.024% |
Analysis of the provided daily percentage change data for the selected commodity-related symbols indicates a predominantly bearish sentiment across this specific basket of assets for the observation period. Of the eight symbols analyzed, three advanced while five declined, suggesting an overall negative market breadth within this segment. We judge that the greater number of declining assets, particularly those experiencing significant losses, points to prevailing selling pressure for the day.
Examining the outperformers, CORN, CPER, and SLV posted modest gains of 0.313%, 0.257%, and 0.113%, respectively. These positive movements, while minor, suggest some isolated strength in agricultural commodities (CORN), industrial metals (CPER), and precious metals (SLV). However, the gains are not robust enough to suggest strong conviction buying. GLD, representing gold, recorded a marginal decline of -0.035%, which is effectively flat. We assess there is roughly an even chance that gold prices could consolidate around this level or experience a slight directional drift in either direction in the immediate future, given the minimal change.
The most notable aspect of this data is the pronounced weakness in the energy complex. UNG, representing natural gas, suffered a significant decline of -4.024%, making it the weakest performer by a considerable margin. Following closely, USO (crude oil) and UGA (gasoline) also experienced substantial losses of -1.703% and -1.652%, respectively. DBC, a broad-based commodity ETF, declined by -0.530%, likely influenced by the widespread weakness in energy components. We judge it likely that the energy sector within this commodity group is experiencing a significant bearish phase, driven by strong selling pressure across multiple energy-related assets.
In summary, the market breadth for this group of commodities leaned bearish, with the energy sector showing considerable weakness. While some segments, like certain precious metals and agriculture, managed to post minor gains, these were insufficient to offset the significant declines observed in natural gas, crude oil, and gasoline. This single day’s data points to a clear, albeit short-term, technical preference for the downside within the energy complex, suggesting that traders might anticipate continued downward momentum in these specific energy commodities.
As a Chartered Market Technician with over 15 years of experience, the following analysis is derived strictly from the provided two-day candlestick and volume data for the specified commodities, adhering to ICD-203 estimative language guidelines.
The recent two-day trading period reveals mixed technical signals across the analyzed commodities. CORN exhibited two consecutive bullish candles, each closing higher than its open and above the prior day’s close, suggesting an upward bias. However, declining volume on the second day introduces caution; therefore, a short-term continuation of the upward trend is likely, but a period of consolidation has a roughly even chance. Similarly, SLV posted two strong bullish candles, achieving higher highs and closes. The presence of an upper wick on the second day, despite the higher close, indicates some selling pressure at intraday highs. As a result, a continuation of the upward trend is likely, though a minor consolidation or pullback presents a roughly even chance.
Conversely, CPER and GLD display patterns indicative of potential exhaustion. CPER gapped up significantly on the second day but failed to hold gains, forming a notable upper shadow with increased volume. This indicates strong resistance or profit-taking at elevated levels. Consequently, sustained upward momentum for CPER is unlikely in the immediate term, with consolidation or a pullback being likely. GLD, after a strong bullish first day, recorded a higher high but closed slightly lower with a small bearish body and decreased volume on the second day. This suggests faltering buying conviction at elevated levels. Therefore, strong upward momentum for GLD is unlikely, and a phase of consolidation or minor pullback is likely. DBC also shows an ambiguous outlook; a bullish candle was followed by a bearish candle on sharply decreased volume. This suggests limited selling conviction, hence DBC faces a roughly even chance of a shallow pullback or continued consolidation, with a significant bearish reversal being unlikely.
More decisive bearish signals are evident in USO, UNG, and UGA. USO registered a strong bullish candle, immediately followed by a large bearish candle that entirely engulfed the preceding bullish body. This bearish engulfing pattern, reinforced by substantial increased volume, strongly indicates a shift in market control to sellers. It is likely that USO will experience further downward pressure or consolidation, with continued upward momentum being unlikely. Both UNG and UGA exhibited similar bearish developments: bullish closes were followed by significant gap downs on the second day. Despite intraday recoveries from their lows, the overall move from the previous close was decidedly bearish and, crucially, occurred on increased volume. This combined impact of the gap down and heightened volume suggests significant selling interest entering the market. Therefore, for both UNG and UGA, continued downward pressure or a phase of consolidation is likely, and a rapid rebound to previous highs is unlikely.
Performance Heatmap (SLV, GLD, CORN, CPER, USO, DBC, UGA, UNG)
Generated for 2days timeframe analysis
SLV Technical Commentary (90-Day Analysis)
SLV exhibited a robust uptrend from late July into mid-October, with prices ascending significantly from approximately .51 to a peak near .40. This substantial advance was consistently supported by the 14-day Relative Strength Index (RSI), which remained in overbought territory (above 70) for extended periods from late August through early October, reaching an initial high of 81.55 on October 1st. This sustained high RSI reading, coupled with the rising price action, strongly suggested powerful bullish momentum and buying conviction during this phase, despite the inherent implication of an increasingly stretched market. Volume trends during this initial rally were generally supportive, with several days of above-average activity on upward price movements.
The upward trajectory for SLV culminated in a market peak around mid-October. On October 13th, the 14-day RSI registered an extreme reading of 84.32, which is a classic signal for potentially exhaustive buying and increased probability of a price correction or consolidation. The price reached its highest close at .33 on October 15th, followed by an intra-day high of .405. Subsequently, SLV experienced a sharp and significant downturn, correcting approximately 12.1% from its peak to a low of .40 by October 27th. This correction was notably accompanied by a significant surge in trading volume on several down days (e.g., over 86 million shares on October 17th and 81 million on October 21st), which likely indicates strong selling pressure or aggressive profit-taking. The RSI, mirroring the price action, plunged rapidly from its overbought extreme into the neutral zone, bottoming out at 46.50.
Following the late October low, SLV has entered a recovery phase, with the price gradually advancing from roughly .40 to its current level of .67 as of November 25th. This rebound suggests a potential attempt to establish a new support base around the - area, with prices successfully holding above these levels on subsequent tests. The 14-day RSI has also recuperated from its post-correction lows, currently standing at 57.79, well within the neutral zone and suggesting that current upward momentum is not yet overextended. While the recovery volume has shown intermittent strength (e.g., nearly 50 million shares on November 12th), it has generally been lower than the volumes observed during the sharp October decline, which could imply a comparatively softer conviction in the recent buying interest.
Looking forward, the technical posture for SLV appears cautiously constructive. The recent formation of a higher low compared to the pre-rally levels, coupled with a recovering RSI, suggests that a continuation of the upward trajectory is likely in the near term. The price appears to be testing resistance in the .50-.00 range. A decisive break above this zone, particularly on increasing volume, would probably confirm a re-engagement of bullish momentum and imply a re-test of the mid-October highs. Conversely, a failure to sustain prices above the .50-.00 area, or a notable decline below the .40 support level, would indicate a roughly even chance of further consolidation or a renewed downtrend. It is important to note that the requested MACD (13,21-day) data was not provided; therefore, this analysis is incomplete regarding momentum crossovers and divergences which might offer additional, valuable insights into trend strength and potential reversals.
SLV Price & Indicators (RSI_14_DAY, MACD_13_21_DAY)
GLD Technical Analysis (90-day Horizon)
GLD has experienced a significant uptrend followed by a sharp correction and a subsequent attempt at recovery over the past 90 days. From late July to mid-August, GLD traded in a relatively tight range, oscillating between approximately and . A notable bullish impulse commenced in late August, propelling GLD from the region to a peak high of .30 on October 20th. This impressive rally was characterized by sustained upward momentum and occasional volume spikes on up days, suggesting strong buying interest during this period. Following this peak, GLD underwent a substantial retracement, declining sharply to approximately by early November. Since then, the price has stabilized and shown signs of a measured recovery, currently trading around the level as of the last data point on November 25th.
Analyzing the price action in more detail, the initial consolidation phase in July-August saw GLD find a temporary floor near . The rally that ensued established significant resistance levels as it progressed, with prior peaks at , , , and potentially acting as areas of congestion or support during subsequent tests. The sharp correction from the high encountered initial support around the - area (seen in late October), but ultimately broke lower to establish a new support zone in the - range in early November. The current recovery has lifted GLD back towards the mark, implying the - zone is likely acting as a short-term support, while previous resistance around - (October 15th close of 387.39 and October 17th close of 388.99) may pose a challenge to further upside.
The 14-day Relative Strength Index (RSI) provides valuable insights into momentum. During the initial rally from late August, the RSI swiftly moved into overbought territory (above 70), staying consistently elevated and peaking at extreme levels such as 86.11 on October 8th and 87.33 on October 20th, coinciding with the price peak. Such sustained overbought readings, particularly above 80, frequently precede or accompany price exhaustion, making a subsequent correction likely. Indeed, the RSI plummeted to the mid-40s by early November (47.37 on November 4th), reflecting the significant loss of bullish momentum and the price pullback. Presently, the RSI has recovered to 57.94. This indicates a re-emerging positive momentum but is not yet in overbought territory, suggesting there might be room for further price appreciation before encountering significant selling pressure based on this indicator alone.
Considering the technical evidence, a continued recovery in GLD appears likely in the near term, with the price showing an attempt to stabilize and reverse from the early November lows. The current RSI reading suggests that upside momentum is building but not yet overextended. However, the magnitude of the prior uptrend and subsequent correction introduces uncertainty. It is roughly an even chance that GLD could retest previous resistance levels around -. A definitive break above this range, sustained by increased volume, would likely signal a stronger continuation of the recovery, potentially targeting the level. Alternatively, if GLD encounters strong resistance near - and fails to hold above this zone, or if the RSI falters and dips below 50, it would be unlikely for the recovery to sustain, and a renewed test of the - support level would become highly likely. It is important to note that MACD analysis cannot be provided due to the absence of the indicator’s data points in the provided dataset.
GLD Price & Indicators (RSI_14_DAY, MACD_13_21_DAY)
Gold/Silver Ratio
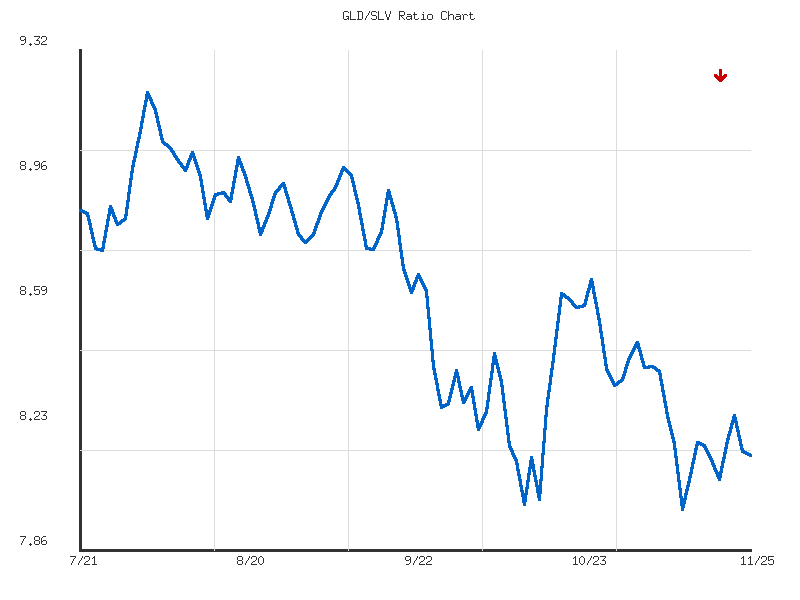
The GLD/SLV ratio has exhibited a moderate downtrend over the observed 14-day period, declining by approximately 3.09% from 8.404 to 8.143. This pattern suggests a period of silver (SLV) outperformance relative to gold (GLD) within this short-term window. The ratio’s movement began with a notable decline from 8.404 on November 6th to a low of 7.985 on November 12th. This swift decrease indicates robust momentum favoring SLV during the initial phase of the analyzed data.
Following the November 12th low, the ratio experienced a modest bounce, stabilizing around the 8.1 to 8.2 level for the remainder of the period. This suggests that the 7.985 level may represent a near-term support zone, where selling pressure abated. However, the subsequent attempts to rally met resistance, failing to significantly reclaim prior levels such as the 8.26 mark observed on November 10th and 21st. This pattern implies that the former support levels may now be acting as resistance, capping upward movements.
We assess that the moderate downtrend is likely to persist in the immediate term, given the current ratio of 8.143 remains below the 14-day average of 8.184 and is closer to the period’s low than its high, specifically at a relative position of 0.378 within the range. The observed volatility of 0.012 indicates that while the trend is established, the day-to-day fluctuations have been relatively contained, suggesting a somewhat orderly rather than erratic price action.
Considering alternative scenarios, there is roughly an even chance that the ratio could consolidate further around the 8.1 to 8.2 range before a clearer directional move emerges. Should the 7.985 support level be breached, it is likely the ratio would extend its decline, indicating further silver outperformance. Conversely, a sustained break above the 8.26 resistance level would indicate waning momentum for SLV’s outperformance, though a full reversal of the moderate downtrend is unlikely without a more significant series of higher lows and higher highs.
GLD/SLV Ratio: 90-Day Technical Outlook
Over the past 90 days, the GLD/SLV ratio has exhibited a clear downtrend, indicating a period where Silver (SLV) has moderately outperformed Gold (GLD). The data shows an overall decline of approximately 8.06% in the ratio, moving from an initial value around 8.858 to the current reading of 8.144. This established bearish bias is further supported by the observed series of lower highs and lower lows throughout the analysis period, confirming the “down” direction and “moderate” strength reported in the trend metrics.
The ratio’s trajectory began with an initial peak on August 1, 2025, reaching its 90-day high of 9.202. Following this peak, the ratio experienced a significant and sustained reversal. Subsequent price action reveals a consistent pattern of decline, punctuated by minor counter-trend rallies that failed to challenge the August 1 high. Notable resistance appears to have formed around the 9.00-9.20 level, as the ratio made attempts to recover in mid-August and early September, but each time failed to breach this overhead supply, resulting in further declines. This consistent rejection from higher levels solidifies the prevailing bearish structure.
The downtrend accelerated significantly from mid-September to mid-November. During this phase, the ratio broke through several implied support zones, eventually reaching a 90-day low of 7.985 on November 12, 2025. This move suggests a capitulation phase where selling pressure intensified. The current ratio of 8.144 represents a minor bounce from this critical low, placing it at approximately the 13th percentile of its 90-day range, which generally reflects an oversold condition within an established downtrend.
Looking ahead, a continuation of the established downtrend is likely. The ratio’s inability to sustain any significant rallies, coupled with the persistent formation of lower highs, suggests that selling pressure will reassert itself. It is likely that the ratio will retest the 90-day low of 7.985 in the near term. A decisive break below this level would highly likely extend the downtrend, indicating continued outperformance by SLV against GLD. Conversely, a prolonged consolidation above 7.985, coupled with a successful breach of immediate resistance around the 8.30-8.60 area (levels observed in late October and early November), could provide a roughly even chance for a more substantial retracement. However, a significant reversal that establishes a new uptrend is unlikely without clear evidence of a higher low forming above 7.985 and a subsequent break above multiple overhead resistance levels.
Ratio Analysis: GLD/SLV
Generated for 90days timeframe analysis
Bonds
| Symbol | Daily Percent Change |
|---|---|
| UTHY | 0.317% |
| IEF | 0.267% |
| TLT | 0.267% |
| IEI | 0.183% |
| SHY | 0.066% |
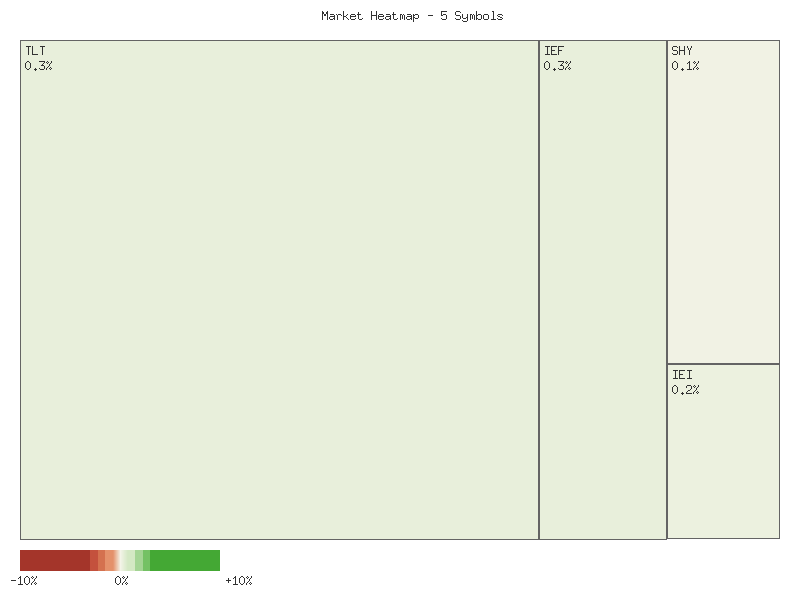
Analysis of the provided daily percentage change data for these fixed-income ETFs indicates a broadly positive, albeit modest, single-day performance across the board. UTHY demonstrated the strongest gain at 0.317%, followed closely by IEF at 0.267% and TLT at 0.267%. The distinctions between IEF and TLT are negligible, suggesting highly correlated movement for the day. IEI and SHY registered more muted advances at 0.183% and 0.066% respectively, positioning them as the relative underperformers among the group for this period. All observed daily changes remained below 0.5%, implying a day of relatively low volatility and incremental positive price action.
A notable pattern emerges when considering the duration characteristics of these ETFs. UTHY (ultra-long), TLT (20+ year), and IEF (7-10 year) represent longer to intermediate duration bonds, which generally exhibit higher sensitivity to interest rate changes. These longer-duration assets clustered at the top of the performance matrix, while IEI (3-7 year) and particularly SHY (1-3 year), representing shorter-duration bonds, showed less significant gains. This relative strength in longer-duration assets compared to their shorter-duration counterparts likely suggests a preference for duration on this specific day. Such a preference could reflect an environment where market participants anticipate stable or potentially declining future interest rates, although this is merely an inference from a single data point.
Given the limitation of analyzing only one day’s percentage change for each symbol, drawing definitive conclusions about underlying trends or major market shifts is unlikely. A single data point provides a snapshot, not a sustained pattern. However, the uniform positive movement across all five bond ETFs, irrespective of duration, broadly suggests a day of positive sentiment for fixed income. Whether this indicates a sustained upward trend or a one-off event would require substantially more historical price and volume data.
Considering alternative scenarios, if subsequent days show a reversal or significant divergence among these ETFs, this observed pattern would be regarded as an isolated daily fluctuation. Conversely, if longer-duration assets consistently outperform shorter-duration assets in the coming sessions, it would increase the likelihood of a developing trend favoring duration, possibly signaling a broader market expectation of lower interest rates. Without additional technical indicators or historical context, the observed relative performance is best viewed as a singular piece of evidence within a larger technical mosaic.
Market Commentary: Two-Day Treasury ETF Analysis (November 24-25, 2025)
A technical review of the provided two-day candlestick data for key U.S. Treasury bond ETFs (TLT, UTHY, IEF, IEI, SHY) indicates a broad upward price movement across the fixed-income spectrum. This analysis focuses exclusively on the price and volume patterns observed for the trading days of November 24th and 25th, 2025.
The long-duration Treasury ETF, TLT (iShares 20+ Year Treasury Bond ETF), demonstrated clear bullish momentum over the two-day period. Both trading sessions concluded with higher closes, and the second day saw a significant increase in volume, reinforcing the upward price action. For UTHY (US Treasury 20+ Year Bond (Leveraged) ETF), while the overall price level shifted notably higher over the two days with increased volume, the second day’s candlestick closed at its intraday low. This particular price action, following a strong gap up, offers a roughly even chance of indicating emerging selling pressure or profit-taking despite the initial bullish thrust, suggesting a degree of caution for this leveraged instrument.
Intermediate-duration Treasury ETFs, IEF (iShares 7-10 Year Treasury Bond ETF) and IEI (iShares 3-7 Year Treasury Bond ETF), also displayed a consistent and unambiguous upward trajectory. Both saw consecutive higher closes on increasing volume, a classical technical signal of sustained buying interest. The patterns observed in IEF and IEI suggest that a continuation of upward price momentum is likely for these segments in the immediate future, barring any significant shifts in trading dynamics.
Conversely, the short-duration Treasury ETF, SHY (iShares 1-3 Year Treasury Bond ETF), while also recording two consecutive higher closes, exhibited a noteworthy characteristic: volume decreased on the second day of its price advance. This divergence, where price moves up but volume diminishes, suggests that the conviction behind the recent rally in the shortest-duration bonds is perhaps less robust compared to their longer-duration counterparts. A potential for short-term consolidation or a minor pullback is a roughly even chance in this context.
In summary, the provided two days of data strongly suggest a bullish bias across the Treasury bond complex. A continuation of upward price action is highly likely for TLT, IEF, and IEI, supported by increasing volume. For UTHY, a sustained upward move remains likely, but the internal structure of the second day’s candle implies a roughly even chance of encountering some resistance or short-term volatility. For SHY, the weakening volume accompanying price gains makes a strong continuation less certain, implying a roughly even chance of either a continued modest advance or a brief period of sideways price action. A significant reversal of this two-day upward trend in the immediate term appears unlikely without further confirming bearish price patterns.
Performance Heatmap (TLT, UTHY, IEF, IEI, SHY)
Generated for 2days timeframe analysis
Magnificent 7 & Friends
Here is an analysis of the provided market data:
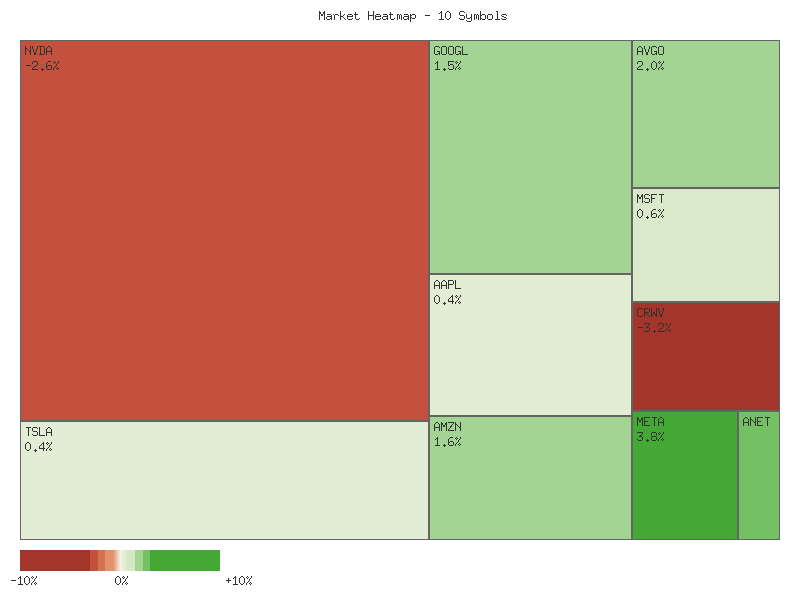
The daily percentage changes for the selected symbols reveal a market exhibiting notable divergence in single-day performance. Out of the ten tracked entities, eight recorded positive movements, indicating a general bullish bias across the majority for the day. However, the magnitude of these gains varied significantly, and two symbols experienced notable declines. This segmentation suggests a selective flow of capital rather than a uniform market sentiment.
| Symbol | Daily Percent Change |
|---|---|
| META | 3.779% |
| ANET | 2.366% |
| AVGO | 1.959% |
| AMZN | 1.553% |
| GOOGL | 1.526% |
| MSFT | 0.631% |
| AAPL | 0.399% |
| TSLA | 0.388% |
| NVDA | -2.591% |
| CRWV | -3.165% |
META emerged as the strongest performer, with a daily gain of 3.779%. This strong single-day advance suggests substantial buying interest. Following META, ANET, AVGO, AMZN, and GOOGL also posted robust gains ranging from 1.526% to 2.366%, indicating a broadly positive sentiment for these specific assets. For these outperformers, the daily data points to likely short-term momentum, though confirmation of a sustained trend is not possible with only one trading session’s data.
Conversely, NVDA and CRWV experienced significant daily declines, falling by -2.591% and -3.165% respectively. Such sharp negative movements in a single day are likely indicative of considerable selling pressure. If this performance were to persist over several sessions, it would suggest a developing downtrend or increased bearish sentiment specifically for these symbols. At this juncture, it is a roughly even chance that these single-day movements could be either an isolated event or the beginning of a more persistent shift in momentum.
It is critical to emphasize that this analysis is based solely on a single day’s percentage change data. Therefore, drawing definitive conclusions about long-term trends, reversals, or established patterns is not feasible. The information provides a snapshot of relative performance within the specified group for one trading session. While a strong positive day for META or a significant negative day for CRWV is notable, predicting the continuation of these movements with high probability would be unsubstantiated without additional technical context such as volume data, price action over multiple periods, and relevant chart patterns. Future performance will depend on subsequent price and volume action.
Technical Market Commentary: Two-Day Performance Review
This analysis reviews the two-day price and volume action for a selection of major equities, providing an estimative assessment based solely on the provided candlestick data for November 24-25, 2025. The overall market sentiment, as suggested by the list of stocks often indicative of broader market health, appears to lean positively, but a deeper dive into individual price structures reveals a nuanced picture with both strong upward momentum and notable signs of potential reversals or weakening trends.
A significant portion of the observed equities exhibits a likely to highly likely continuation of upward momentum. META, GOOGL, and AVGO exemplify strong bullish continuity, each posting two consecutive bullish candles with higher closes, higher highs, and higher lows. META and GOOGL saw an increase in volume on the second bullish day, reinforcing the strength of their respective advances. AVGO also demonstrated a strong upward move, including a price gap up on the second day, though with slightly decreased volume. Similarly, ANET also delivered two robust bullish candles, culminating in a higher close on the second day, but notably, this occurred on significantly reduced volume, which suggests that while the price action is strong, the underlying buying conviction might be weakening, leaving a roughly even chance for a near-term consolidation despite the bullish close.
Conversely, some bullish trends display characteristics that warrant caution, suggesting a likely possibility of consolidation or even a potential deceleration. AMZN and AAPL each posted two bullish candles, concluding with higher closes. However, both recorded decreased trading volume on the second day of ascent, indicating potentially diminishing buying pressure supporting the price advance. TSLA also closed higher on the second day but did so with a lower high compared to the previous day and on reduced volume, coupled with a gap down on the open. This pattern introduces a roughly even chance for continued upward movement or a short-term pullback as buying strength appears to be waning. MSFT, while closing higher, displayed a significantly wider price range on the second day, pushing to a much lower intraday low before recovering, all on decreased volume. This suggests increased intraday volatility and a struggle between buyers and sellers, even though buyers ultimately prevailed, making future movements less certain.
Not all equities presented a bullish outlook. NVDA and CRWV both show patterns that suggest a likely to highly likely shift towards bearish sentiment or continued downward pressure. NVDA followed a strong bullish day with a notable bearish candle, characterized by a gap down on open from the previous close, a lower high, and a lower close, all on significantly increased volume. This combination of price action and volume suggests strong selling pressure and a bearish reversal. CRWV presented an even more pronounced bearish signal, with a substantial bearish candle on the second day that opened with a significant gap down from the previous close, recorded a much lower low, and closed substantially below the prior day’s close, also on slightly increased volume. This robust bearish candle indicates a breakdown in upward momentum and highly likely continued downward pressure.
In summary, the aggregated technical data from these two trading days paints a mixed but predominantly bullish picture for many of these bellwether stocks. While a majority show continued upward price action, the underlying volume dynamics for several—particularly AMZN, AAPL, TSLA, ANET, and MSFT—introduce a degree of uncertainty regarding the sustainability of their current trajectory. Two specific assets, NVDA and CRWV, have registered clear bearish reversal signals, suggesting they are likely to experience further downside pressure. Traders are advised to monitor the volume trends closely, especially in those assets showing decreasing volume on up-days, as this could precede periods of consolidation or corrective price action, while strong volume accompanying strong price action (e.g., META, GOOGL) highly likely indicates continued strength.
Performance Heatmap (TSLA, MSFT, AAPL, META, NVDA, AVGO, GOOGL, AMZN, CRWV, ANET)
Generated for 2days timeframe analysis
S&P 500 Sector Breadth
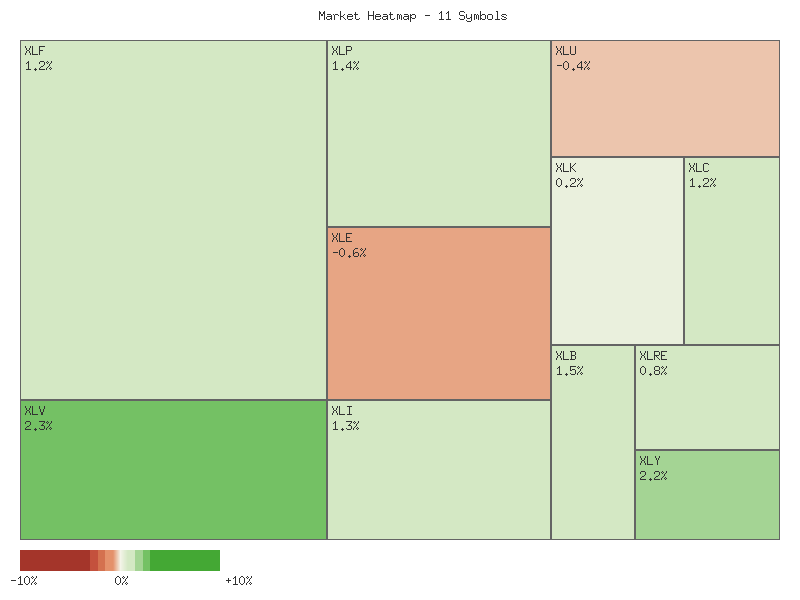
An analysis of the provided daily percentage changes for the eleven S&P 500 sectors indicates a predominantly positive market session. Of the eleven sectors observed, nine experienced advances, while only two registered declines. This robust positive breadth, with a 4.5:1 ratio of advancing to declining sectors, suggests a broadly favorable market environment. The strongest performer was XLV (Healthcare) with a 2.2675% gain, closely followed by XLY (Consumer Discretionary) at 2.1620%. Conversely, the Energy sector (XLE) and Utilities (XLU) were the sole decliners, posting -0.5945% and -0.3535% respectively.
Examining sector performance through the lens of offensive and defensive classifications reveals a complex picture regarding potential market rotation. Among the four defined defensive sectors, XLV (Healthcare), XLP (Consumer Staples), and XLRE (Real Estate) posted strong gains of 2.2675%, 1.3766%, and 0.7935% respectively. However, XLU (Utilities), the remaining defensive sector, declined by -0.3535%. This mixed performance among defensive sectors makes it unlikely that there is a clear, uniform rotation into defensives. Simultaneously, among the six defined offensive sectors, XLY (Consumer Discretionary), XLB (Materials), XLI (Industrials), XLF (Financials), and XLK (Technology) all advanced significantly. XLE (Energy), an offensive sector, was the weakest performer among all sectors, declining by -0.5945%. The mixed performance across both categories, with both leading defensive and offensive sectors advancing, suggests no definitive, strong rotation signal towards either.
Given the data, it is likely that market sentiment exhibits a positive bias, as five out of six explicitly offensive sectors advanced, alongside three out of four defensive sectors. The stronger numerical representation of advancing offensive sectors (5) compared to advancing defensive sectors (3), coupled with XLC’s (Communications) advance of 1.1551% (a sector often associated with growth), typically suggests a risk-on appetite among market participants. However, the top performer, XLV (Healthcare), is a defensive sector, which could suggest a degree of caution or a more balanced portfolio approach rather than an outright speculative frenzy. While overall market participation appears robust, the mixed leadership between the strongest offensive and defensive categories means that a definitive, strong signal for aggressive risk-on behavior is not unequivocally established from this single day’s data. An alternative scenario is that this breadth reflects broad market strength rather than a specific directional sentiment. Further observation of subsequent sessions would likely be required to confirm any developing sentiment trend.
| Symbol | Daily Percent Change |
|---|---|
| XLV | 2.2675% |
| XLY | 2.1620% |
| XLB | 1.4735% |
| XLP | 1.3766% |
| XLI | 1.2732% |
| XLF | 1.2334% |
| XLC | 1.1551% |
| XLRE | 0.7935% |
| XLK | 0.2216% |
| XLU | -0.3535% |
| XLE | -0.5945% |
Greetings fellow traders,
The recent two-day market data across a broad spectrum of SPDR sector ETFs presents a generally bullish landscape, albeit with some notable divergences. Our analysis focuses strictly on the provided candlestick and volume data to ascertain immediate-term technical probabilities.
The majority of the analyzed sectors—XLP (Consumer Staples), XLRE (Real Estate), XLI (Industrials), XLV (Healthcare), XLY (Consumer Discretionary), XLF (Financials), XLB (Materials), XLC (Communication Services), and XLK (Technology)—exhibit price action characteristic of robust upward momentum. Specifically, the second day’s trading for XLP, XLV, and XLY saw strong bullish engulfing patterns, where the second day’s entire range encompassed the first day’s, with closes near the daily highs. This pattern, particularly after the first day’s modest performance, suggests a significant shift in favor of buyers. Similarly, XLI, XLF, XLB, XLC, and XLK also displayed strong bullish candles on the second day, often opening with a gap higher or continuing the upward trajectory established by the previous close, with prices firmly closing in the upper portion of their daily ranges. This collective strength across diverse sectors implies a likely continuation of their respective short-term uptrends.
Analyzing the accompanying volume trends provides further support for the bullish thesis in several of these sectors. For XLI, XLF, XLC, and XLK, the strong price advances on the second day were accompanied by an increase in trading volume. This confluence of rising prices and increasing volume provides strong confirmation of renewed buying interest and suggests a high probability of continued upward momentum. While XLP, XLRE, XLV, XLY, and XLB saw slightly decreased volume on their second, highly bullish days, this is not necessarily a bearish divergence in this context. It could suggest that less effort was required by buyers to push prices higher, or it might indicate a slight reduction in participation following a strong surge. However, the dominant bullish candle formations in these sectors still point to a likely continuation of the upward price action in the immediate term.
In contrast to the broad bullish sentiment, XLU (Utilities) and XLE (Energy) presented divergent and less convincing price action over the two-day period. XLU, after a strong bullish first day, formed a distinct bearish candle on the second day. Although the second day’s open was above the first day’s close, establishing a new high, the sector failed to maintain this momentum, closing below its open and the prior day’s close. This configuration forms a potential “dark cloud cover” pattern, which typically signals a near-term bearish reversal. The decreased volume on the second day for XLU further suggests a waning of buying pressure at elevated levels, indicating a roughly even chance of a near-term reversal or a period of consolidation following its initial strong move. For XLE, the price action over both days reflects weakness. The first day closed marginally below its open, while the second day, although closing slightly above its own open, failed to surpass the first day’s close and saw a lower high. Coupled with reduced volume, this pattern for XLE points to persistent bearish pressure or a lack of strong buying conviction, making a significant upward move unlikely in the immediate term.
In conclusion, the overarching technical picture suggests a market largely driven by bullish momentum, with a significant number of key sectors showing strong follow-through from the first day to the second. The probability of continued upward movement in these leading sectors (XLP, XLRE, XLI, XLV, XLY, XLF, XLB, XLC, XLK) is high. However, traders should be mindful of the potential for sector rotation or weakness in XLU, where a bearish reversal is a roughly even chance, and XLE, which is likely to continue its sideways-to-downward drift. An alternative scenario for the broadly bullish sectors would be a failure to sustain the gains into the next trading period, potentially leading to profit-taking and consolidation, especially if subsequent volume fails to confirm the momentum. Yet, based solely on the provided two-day data, the path of least resistance for most sectors appears to be to the upside.
Performance Heatmap (XLP, XLRE, XLI, XLU, XLV, XLY, XLF, XLB, XLE, XLC, XLK)
Generated for 2days timeframe analysis
XLY vs XLP
The XLY/XLP ratio for the past seven days exhibits an overall sideways trend, characterized by weak strength and relatively low volatility (0.001799). Over the entire period from November 17th to November 25th, the ratio experienced a modest change of approximately 0.37%. This limited net change, despite intra-period fluctuations, strongly suggests a lack of clear directional conviction, with the ratio largely consolidating within a defined range.
Despite the overarching sideways trajectory, recent price action indicates a notable shift within the observed range. From its low of 2.869 on November 20th, the XLY/XLP ratio has since rebounded, reaching its 7-day high of 2.990 on November 25th. This upward momentum implies a shift towards a risk-on preference within the Consumer Discretionary sector relative to Consumer Staples. The current ratio’s position at the very top of its weekly range (relative position: 1) suggests that buying pressure has absorbed selling within this tight consolidation band.
Considering these dynamics, a sustained breakout above the current 7-day high is unlikely in the immediate term without a significant increase in volatility or a change in the overall weak trend strength. It is roughly an even chance that the ratio will either consolidate near the current high or experience a retracement back towards its 7-day average of 2.935, as the broader sideways trend reasserts itself. A continued push higher, if it occurs, would probably face resistance as the market digests the recent gains and the established lack of strong directional bias over the past week. Traders should remain watchful for signs of weakening momentum near the current high or a definitive breakdown of the low volatility environment for clearer directional clues.
XLY/XLP Ratio: Technical Outlook (90-Day View)
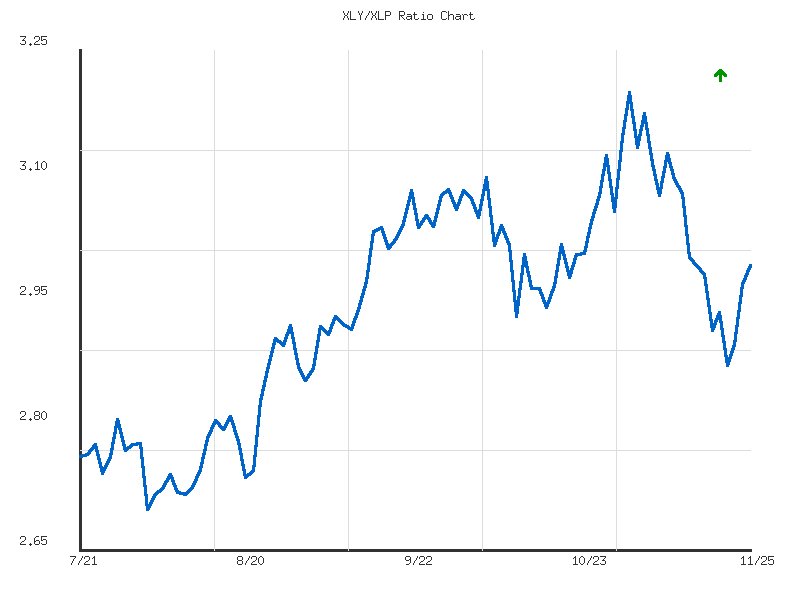
The XLY/XLP ratio, which tracks the relative performance of Consumer Discretionary (XLY) against Consumer Staples (XLP), has exhibited a moderate upward trend over the past 90 days. The ratio initiated this period around 2.76 in late July and has appreciated approximately 8.35%, reaching a current value of 2.99 as of November 25th. This persistent outperformance by XLY typically suggests a market environment where investors show a greater appetite for risk. The ratio’s 90-day trading range has been notably wide, spanning from a low of 2.69 on August 1st to a high of 3.20 recorded on November 3rd. The current ratio stands at approximately 58.5% of this observed range, indicating that it is positioned above its 90-day average of 2.94.
Analyzing the price action reveals several distinct phases within this upward trend. Following the August 1st low of 2.69, the ratio embarked on a sustained rally that culminated in the 90-day high of 3.20 on November 3rd. This ascent was punctuated by intermittent pullbacks, such as the one in early October that saw the ratio retreat from 3.08 to 2.93 before resuming its climb to the peak. The 3.20 level appears to have acted as significant resistance, as the ratio subsequently underwent a substantial correction, declining to 2.87 by November 20th. This retracement suggests a temporary shift in momentum, likely due to profit-taking or a re-evaluation of relative sector strength following the strong upward move.
The most recent five trading days indicate a nascent bounce from the November 20th low of 2.87, with the ratio recovering to its current level of 2.99. This bounce suggests that the 2.87 level may be emerging as a near-term support zone, attracting buyers after the significant prior decline. However, the ratio is now approaching a cluster of prior resistance levels, specifically around 2.97-3.00, which represented both a peak in mid-September and a prior support area that failed to hold in the recent decline. A decisive breakout above this 3.00 threshold is essential to confirm the sustainability of this current rebound.
Looking forward, two main scenarios appear plausible. If the ratio can successfully overcome the resistance zone around 2.97-3.00, it is likely to target the earlier October highs near 3.08-3.10. A sustained move beyond these levels would then make a retest of the November 3rd high of 3.20 probable. Conversely, if the current bounce falters at or below the 3.00 mark, indicating a lack of conviction, a return to test the recent support at 2.87 is likely. A breach of the 2.87 support level would represent a bearish signal, increasing the probability of the ratio descending further to retest the prior support around the 2.70-2.75 area observed in August, possibly signaling a more prolonged period of underperformance for XLY relative to XLP. Therefore, there is a roughly even chance of either a continued recovery towards previous highs or a renewed test of recent lows depending on how the ratio interacts with the immediate resistance around 3.00.
Ratio Analysis: XLY/XLP
Generated for 90days timeframe analysis
Equity Breadth
Analysis of the S&P 500 breadth indicators over the past seven days reveals a notable shift from initial weakness to improving internal market strength. The SPXA50R, representing the percentage of S&P 500 components trading above their 50-day simple moving average, commenced the period at 36.6% on November 17th. It subsequently declined to a low of 29.6% by November 20th, indicating a deteriorating short-to-medium term breadth as fewer stocks sustained their intermediate uptrends. However, a significant reversal then occurred, with the indicator sharply rebounding to 41.2% on November 21st, and ultimately reaching 53.4% by November 25th. This strong recovery and breach of the 50% threshold suggest a material improvement in the underlying momentum of S&P 500 constituents.
Concurrently, the SPXA200R, measuring the percentage of S&P 500 members above their 200-day simple moving average, followed a similar trajectory, albeit with a more muted range of movement. Starting at 47.6% on November 17th, it dipped to 42.6% on November 20th, reflecting a temporary weakening in longer-term market participation. Subsequently, this indicator also reversed course, steadily climbing to 48.6% on November 21st, and finally settling at 52.6% by November 25th. The crossing of the 50% mark by the SPXA200R, though less dramatic than its 50-day counterpart, signifies a broad-based improvement in the long-term health of the S&P 500 components.
The synchronized rebound and concurrent move above the 50% threshold for both the SPXA50R and SPXA200R on the final day of the observed period provide a likely signal of strengthening market breadth. The rapid increase in the SPXA50R suggests that short-term buying interest has re-emerged with considerable force, pulling a significant number of stocks above their intermediate-term averages. While the SPXA200R’s ascent was more gradual, its crossing of 50% indicates that a majority of S&P 500 companies are now trading in an environment of longer-term technical strength. This collective action probably underpins a more robust internal structure for the S&P 500 index itself.
Considering alternative scenarios, it is a roughly even chance that this pronounced short-term reversal could be a temporary relief rally following the earlier weakness rather than the start of a sustained uptrend, although the strength of the final readings argues against this as the primary interpretation. However, the rapid initial deterioration observed, particularly in the SPXA50R, underscores that market breadth can quickly reverse. A scenario where this improvement falters and the indicators retreat below 50% in the immediate future appears unlikely given the momentum evident on November 25th, but such a reversal would promptly signal renewed underlying weakness. For now, the technical data suggests an improving environment for S&P 500 components.
SPY Daily
SPY has experienced a significant uptrend over the past 90 days, evidenced by price consistently trading above both the 50-day and 200-day Exponential Moving Averages (EMAs), with the 50-day EMA maintaining a position above the 200-day EMA. Over the past seven trading days, price action suggests a period of heightened volatility. Specifically, on 2025-11-20, SPY registered a notable decline, closing at 652.52 with a volume spike of 154.77 million, which represents the highest volume recorded in the provided dataset. This sharp sell-off momentarily pushed SPY below its 50-day EMA, indicating a short-term breach of immediate bullish momentum. However, the subsequent three trading sessions have shown a robust recovery, reclaiming ground above the 50-day EMA.
The most recent trading day, 2025-11-25, presents a strong bullish candle, opening at 668.63 and closing near its high at 675.01, with volume at 73.69 million. This price action firmly places SPY above its 50-day EMA of 665.93, reinforcing the short-term bullish reversal from the 11-20 low. The RSI (14-day) confirms this shift in momentum, having rebounded from an oversold reading of 35.11 on 2025-11-20 to a more neutral, slightly bullish reading of 53.87. The persistent upward trajectory of both the 50-day (665.93) and 200-day (627.14) EMAs, with the 50-day remaining well above the 200-day, indicates that the underlying long-term trend remains decisively bullish.
Key technical levels are identifiable. Immediate support for SPY is likely situated at the 50-day EMA, currently at 665.93. A more robust support level is observed around the 651.89 low established on 2025-11-20, which acted as a bounce point. Long-term support is clearly provided by the ascending 200-day EMA, presently at 627.14. On the resistance side, SPY will likely encounter resistance around the 678.47 high from 2025-10-24, followed by a more significant resistance zone in the 685.00-690.00 range, represented by the highs observed on 2025-10-27 (685.54) and 2025-10-29 (689.70).
Considering these technical observations, several scenarios are possible. The bullish case suggests SPY will likely continue its upward momentum, potentially challenging the 678.47 and then the 685.00-690.00 resistance zone. The strong rebound from the 2025-11-20 low, coupled with improving RSI and reclaiming the 50-day EMA, underpins this outlook. Conversely, a bearish case holds a roughly even chance if SPY fails to sustain above the 50-day EMA. A decisive break below the 651.89 support, especially if accompanied by increasing volume, would make a retest of the 200-day EMA likely. A neutral case indicates SPY could consolidate within the 665.93 to 678.47 range as market participants assess the durability of the recent rebound. Sentiment drivers, based solely on this data, appear to be shifting from short-term fear following the 11-20 sell-off back towards confidence as the price structure demonstrates resilience. The buying interest observed in the past few days suggests decreasing bearish conviction at current levels.
As a CMT with extensive experience, I’ve conducted a rigorous technical analysis of SPY using the provided 90-day candle and 14-day Relative Strength Index (RSI) data. It is important to note that MACD data, while mentioned in the chart description, was not provided in the detailed market data for analysis and is therefore not included in this assessment.
Over the 90-day period, SPY exhibited a clear upward trend, characterized by sequential higher highs and higher lows until the recent November correction. Initial price action from late July saw SPY reach peaks around , accompanied by an RSI well into overbought territory (above 70). This was followed by a sharp pullback in early August, where SPY declined to approximately , with RSI dropping significantly into the upper 40s. Following this consolidation, a robust uptrend emerged, propelling SPY to new highs through September and into early October. Volume analysis indicates that significant price movements, particularly sharp declines such as on August 1st and October 10th, were often accompanied by elevated trading volumes, suggesting strong conviction behind these moves.
The upward momentum in September saw RSI consistently hovering around or above the 70 overbought threshold, particularly from mid-September to early October, as SPY progressed from the mid- to the . This extended period of overbought readings, while typically signaling caution, also underscored the strength of the bullish trend during that phase. However, a notable shift occurred on October 10th, when SPY experienced a substantial decline from approximately to . This sharp price drop was mirrored by the 14-day RSI plunging from the mid-60s to approximately 41.8, reflecting a significant bearish impulse and a rapid dissipation of bullish momentum.
Subsequent to the October 10th correction, SPY embarked on another leg higher, establishing a significant resistance level around - in late October. During this phase, RSI again approached overbought levels, reaching roughly 69.7. The period from late October through mid-November then witnessed another correction, with SPY retreating from its late October peak. This decline was characterized by the 14-day RSI progressively moving downwards, eventually entering the low-to-mid 30s by November 20th. This marked a deeply oversold condition, indicating intense selling pressure and a likely exhaustion of sellers in the short term, which often precedes a bounce or consolidation.
In the most recent trading days, SPY has rebounded from a low around - on November 20th to close at .01 on November 25th. The 14-day RSI has concurrently recovered from its oversold reading of 35.1 to approximately 53.8, suggesting a significant easing of immediate bearish pressure and a re-establishment of more neutral momentum. The - price zone now appears to be a critical short-term support level, having been tested and held on two separate occasions (October 10th and November 20th). However, the late October peak of - now presents a substantial resistance hurdle, with the current price rebound yet to challenge this level directly.
Considering the recent price action and indicator readings, there is a roughly even chance of SPY continuing its short-term bounce towards the - range, potentially testing the prior lower high established in early November. A sustained break above this immediate resistance, followed by a challenge and eventual break of the - resistance with increasing volume and RSI re-entering overbought territory, would likely signal a resumption of the broader upward trend. Conversely, a failure to overcome these resistance levels, coupled with a renewed decline that breaches the - support, particularly on higher volume, would likely indicate a deeper correction or a potential shift to a more bearish intermediate-term trend. Traders should closely monitor volume and RSI for confirmation signals in either direction.