Daily Market Technical Analysis
Market indices, including SPY and QQQ, show a short-term bullish bias with widespread gains across sectors, indicating likely positive investor sentiment. However, this recent price appreciation across equities, including many Magnificent 7 stocks, has been accompanied by generally decreasing volume, introducing a roughly even chance of sustained momentum or short-term consolidation. SPY and QQQ experienced recent high-volume sell-offs followed by lower-volume recoveries; a bearish continuation for SPY is likely, with a retest of recent lows probable. In commodities, precious metals like GLD and SLV exhibit likely bullish continuation, while the VIX has decisively reversed from recent highs, indicating a probable period of decreasing volatility. The QQQ/SPY and IWM/SPY ratios suggest continued relative underperformance for tech and small-caps against the broader market, making a sustained shift in leadership unlikely without new catalysts.
Market Indices
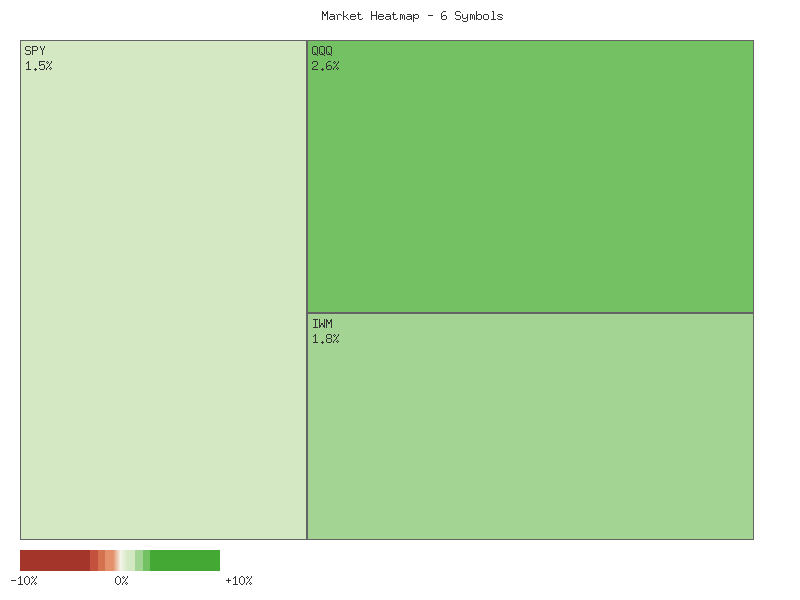
The provided daily percentage change data for a selection of key broad market ETFs reveals a uniformly positive session. All six symbols observed — QQQ, IWM, OEF, SPY, IJR, and MDY — registered gains. The following matrix illustrates the performance, sorted in descending order of daily percentage change:
| Symbol | Daily Percent Change |
|---|---|
| QQQ | 2.579% |
| IWM | 1.810% |
| OEF | 1.779% |
| SPY | 1.484% |
| IJR | 1.272% |
| MDY | 0.960% |
This initial observation indicates a widespread upward movement across different market capitalizations and sectors represented by these diversified funds.
From a market breadth perspective, the data presents a strong bullish signal for the observed group. There are 6 advancing symbols and 0 declining symbols out of the 6 surveyed. This perfect advancing-to-declining ratio, albeit based on a limited selection of ETFs, indicates a day of robust, broad participation in the rally. Notably, the technology-heavy Nasdaq 100 proxy, QQQ, led the gains with a significant 2.579% increase. Following closely were the small-cap Russell 2000 proxy (IWM) at 1.810% and the S&P 100 proxy (OEF) at 1.779%. The broad S&P 500 (SPY), small-cap S&P 600 (IJR), and mid-cap S&P 400 (MDY) also posted solid, albeit relatively smaller, advances.
The uniformly positive performance across these diverse market segments suggests that underlying buying pressure was broad-based, not confined to just a few large-cap leaders. Such strong positive market breadth on a single day is typically observed during periods of renewed market confidence or short covering. Given this snapshot, it is likely that market sentiment, at least for this particular session, was overwhelmingly positive. However, it is crucial to recognize that this analysis is based solely on one day’s data for a limited set of indices. A sustained trend of strong breadth, indicated by similar advancing-to-declining ratios over several sessions, would provide more robust evidence of a definitive bullish shift. Without further contextual data, it remains a roughly even chance that this single day represents the beginning of a sustained rally or merely a temporary upward correction within a broader pattern.
Based on this singular day of data, the strong positive breadth and the significant advances across all observed ETFs, especially in QQQ and IWM, likely indicate a supportive environment for equity prices in the very near term. The leadership from both growth-oriented large-caps (QQQ) and more economically sensitive small-caps (IWM) could suggest increasing investor appetite for risk. Conversely, if subsequent days show a reversal or a significant contraction in breadth, it would be unlikely that this single day’s strength represented a foundational shift in market dynamics. Traders might monitor for follow-through buying pressure in the coming sessions to confirm the potential for continued upward momentum across these indices.
Market Commentary: Short-Term ETF Analysis (November 21-24, 2025)
The market data across the specified ETFs (SPY, QQQ, IWM, IJR, MDY, OEF) for the two-day period of November 21st and November 24th, 2025, presents a broadly bullish short-term picture. All six instruments displayed significant positive price action, consistently closing higher over both days. On November 21st, most ETFs formed bullish candles, with IWM, IJR, and MDY showing particularly strong closes near their daily highs, indicating robust buying interest. The overall market breadth, as suggested by the performance across different market capitalization segments represented by these ETFs, appears to lean towards positive sentiment, suggesting a synchronized upward movement.
The upward momentum largely continued and, in some cases, intensified on November 24th. QQQ, OEF, and SPY notably opened with bullish price gaps above their previous day’s closes, signifying strong overnight buying pressure or a positive market opening. IWM, IJR, and MDY also opened above their respective prior closes, albeit without significant gaps. All six ETFs formed strong bullish candles on November 24th, with their closing prices near or at their daily highs. This sustained upward trajectory, coupled with strong daily closes, suggests that the immediate technical outlook for these indices is likely bullish, indicating a continuation of buying pressure into the next trading session.
A consistent pattern across all observed ETFs is the noticeable decrease in trading volume on November 24th compared to November 21st. For SPY, QQQ, IWM, IJR, and MDY, this volume reduction was significant, while OEF experienced a more modest decline. This divergence between rising prices and declining volume presents a nuanced technical signal. On one hand, it could indicate that selling pressure has diminished, allowing prices to advance on less effort, which might be interpreted as a healthy continuation of the uptrend. On the other hand, a rally on decreasing volume could suggest a potential lack of broad market participation or conviction among buyers, making the current advance potentially vulnerable to a reversal. Therefore, while a continuation of the rally is likely, the declining volume introduces a roughly even chance of either reduced selling pressure or diminishing buying interest.
Given the strong bullish candle patterns and consistent higher closes across a diversified set of ETFs, the immediate technical outlook for the broader market, as represented by these instruments, appears to be bullish. The consistent closing near daily highs strongly implies that short-term momentum is to the upside. However, the accompanying decrease in trading volume across the board warrants careful consideration. While the momentum indicators derived from price action are overtly positive, the volume profile suggests that this upward movement could be susceptible to changes in sentiment if conviction does not broaden. Traders would be prudent to monitor subsequent volume trends for confirmation of a sustained rally or for early signs of exhaustion.
Performance Heatmap (SPY, QQQ, IWM, IJR, MDY, OEF)
Generated for 2days timeframe analysis
SPY Technical Analysis: November 24, 2025
The SPY ETF has exhibited a clear uptrend through much of the 90-day period under review, beginning in mid-July and extending into early October 2025. During this phase, SPY consistently made higher highs, with a notable peak reached around 673.95 on October 9th. Accompanying this bullish price action, the 14-day Relative Strength Index (RSI) frequently entered overbought territory (above 70), indicating strong momentum. For instance, the RSI peaked at 75.58 on July 25th, aligning with a local price high, and repeatedly exceeded 70 in September and early October, confirming the strength of the rally.
A significant shift in market dynamics became apparent around October 10th. Following the peak, SPY experienced a sharp single-day decline to 653.02, which caused the RSI to drop substantially from 65.75 to 41.81. While not strictly entering oversold territory below 30, this abrupt move signaled a material loss of bullish momentum. This event marked a turning point, as the market subsequently transitioned into a more consolidative and then bearish phase.
From late October through the current date, SPY’s price action has deteriorated, showing a pattern of lower highs and lower lows. After attempting to recover and re-testing resistance near the 689.70 level in late October, the ETF has been in a sustained downtrend. The RSI mirrored this bearish sentiment, declining from high 60s levels and approaching oversold conditions. On November 20th, the RSI reached 35.10, the lowest point observed in the entire 90-day data set, coinciding with a significant price drop to 652.52 on elevated volume, which suggests strong selling pressure. The most recent data point shows SPY closing at 668.82 with the RSI recovering slightly to 49.54, suggesting a relief rally from recent lows but still remaining below the neutral 50-level.
Considering the recent price action and RSI, a bearish continuation in the near term is likely. The bounce observed from 652.52 to 668.82 appears to be a corrective move within a broader downtrend rather than a definitive reversal, given that the RSI has yet to decisively reclaim the 50-level. A retest of the recent low around 652.52 is probable. Should this critical support level fail to hold, a further decline towards prior support levels, potentially around the early August low of 621.72, becomes likely. For a shift back to a bullish bias, SPY would need to sustain its current recovery, with RSI breaking above both the 50-level and subsequently the 60-level. A clear reversal of the established downtrend would require a break above the previous swing high of approximately 689.70, which is currently unlikely without new market information not present in the provided technical data. It is important to note that the requested MACD_13_21_DAY indicator data was not provided, therefore this analysis relies exclusively on price action and the 14-day RSI, precluding a comprehensive assessment that would otherwise incorporate momentum crossover and divergence signals from the MACD.
SPY Price & Indicators (RSI_14_DAY, MACD_13_21_DAY)
QQQ Technical Analysis: Navigating Recent Volatility (July 2025 - November 2025)
The QQQ, tracking the Nasdaq 100, has exhibited considerable volatility over the past 90 days, characterized by a series of strong uptrends punctuated by sharp, high-volume corrections. From late July to early August, QQQ experienced an initial upward surge, with its price appreciating from approximately to , while the 14-day Relative Strength Index (RSI) consistently registered in overbought territory, peaking around 73.11. This sustained overbought condition signaled a likely exhaustion of buying momentum. Following this, the price experienced a significant pullback, notably on August 1st, where a large red candle with elevated volume pushed QQQ from down to , simultaneously driving the RSI sharply lower to 48.26, indicating a significant shift from overbought to near neutral conditions.
A subsequent period from late August through early October saw QQQ enter a robust uptrend. Price climbed steadily from the to reach new highs above . This advance was frequently accompanied by the RSI again pushing into overbought territory, with multiple readings above 70 and a peak near 75.35 on September 22nd. Such persistent overbought readings, while reflecting strong bullish conviction, also indicate an increasing probability of a short-term correction. Indeed, on October 10th, QQQ experienced a sharp single-day decline from to on exceptionally high volume, causing the RSI to plummet from 69.27 to 45.42. This pattern of rapid ascent followed by a swift, high-volume reversal highlights a market segment sensitive to sudden shifts in sentiment.
Despite the abrupt drop on October 10th, QQQ mounted a strong recovery, demonstrating resilience by climbing to yet another new high around by October 29th. The RSI mirrored this recovery, quickly re-entering overbought levels and peaking around 71.73. However, this bullish momentum proved unsustainable. From late October into November, QQQ initiated another significant decline, marked by consecutive red candles and increasing selling pressure. The drop intensified on November 20th with an extremely large red candle and the highest volume observed in the 90-day period, which strongly suggests a capitulation event or aggressive distribution. This sharp sell-off drove the RSI deep into oversold territory, reaching a low of 35.35, a level that historically makes a bounce more likely.
Presently, QQQ has seen a bounce over the last couple of trading sessions, closing significantly higher on November 24th, with the RSI recovering from its oversold lows to 48.69. While this rebound from deeply oversold conditions is a positive sign, the RSI remains below the 50-level, suggesting that bullish momentum is not yet firmly re-established. Given the magnitude of the recent decline and the substantial volume accompanying the sell-off, it is a roughly even chance that this bounce could be either the beginning of a sustained recovery or merely a dead cat bounce before further downside. Without the MACD data, which was not provided, a complete assessment of momentum convergence or divergence is not possible. Traders should observe whether QQQ can reclaim and sustain levels above recent resistance points, or if the current rebound stalls, which would make a retest of the recent lows more likely.
QQQ Price & Indicators (RSI_14_DAY, MACD_13_21_DAY)
IWM Technical Analysis: Navigating Volatility with Price Action and RSI
This analysis focuses solely on the provided 90-day price and RSI data for IWM, from mid-July to late November 2025. It is important to note that MACD indicator data was specified but not provided in the dataset, thus no conclusions regarding MACD can be drawn. Over the 90-day period, IWM exhibited a general upward trajectory, moving from approximately to nearly . However, this overall advance was punctuated by significant corrections and volatility, particularly in the latter part of the period. Identifying key support and resistance levels, alongside momentum shifts, will be crucial for understanding the immediate outlook.
From mid-July to late October, IWM displayed a pronounced uptrend, marked by successive higher highs and higher lows. Notable rallies occurred in mid-August, propelling the price from approximately to , and again in late August, pushing towards . The uptrend continued into September and October, with the price reaching a peak around .77 on October 15th, followed by a retest of highs on October 27th (.21 intraday) and October 29th (.14 intraday). Volume during upside moves was generally moderate, while some of the more significant downside moves, such as on October 10th and 17th, saw spikes in selling volume. This bullish phase culminated in a sharp, high-volume correction throughout November. From November 13th to November 20th, IWM experienced a substantial decline from .63 to .14, accompanied by exceptionally high trading volume, notably on November 20th and 21st, which could indicate a capitulation event or significant institutional interest at lower prices. The close on November 21st, a strong bullish reversal candle with high volume, followed by a continuation higher on November 24th, suggests a potential short-term bottom may have formed.
The 14-day Relative Strength Index (RSI) largely corroborated the price action. During the August-October uptrend, RSI frequently entered overbought territory (above 70), indicating strong bullish momentum. Critically, several instances of bearish divergence were observable. As IWM recorded higher price highs on September 18th and October 15th, the RSI formed lower peaks (71.23 on September 18th vs. 62.99 on October 15th), signaling weakening upward momentum despite continued price appreciation. This bearish divergence was a probable precursor to the subsequent significant price correction in November. During the November decline, the RSI trended downwards, reaching near-oversold conditions (low 30s) around November 20th, with a low of 32.63. The subsequent rebound in price has lifted RSI to 49.95 by November 24th, approaching the 50-level centerline, which often acts as a demarcation between bullish and bearish momentum.
Considering the recent price action and RSI, the immediate outlook presents a roughly even chance for a short-term continuation of the current rebound versus a pause or renewed downward pressure. The strong bullish reversal on November 21st, coupled with the RSI’s bounce from near-oversold territory, makes a continued push higher in the near term likely. However, the RSI is currently just below the 50-level, and a decisive break above 50 would provide stronger evidence of regaining bullish momentum. An alternative scenario is that the bounce is merely a reaction within a larger downtrend, especially given the heavy selling volume preceding it. If IWM fails to sustain price levels above the recent consolidation area (roughly -), a retest of the support area established on November 20th becomes probable. Traders should monitor for sustained upward movement on increasing volume, and for the RSI to confidently cross and hold above the 50-mark to confirm a more robust recovery.
IWM Price & Indicators (RSI_14_DAY, MACD_13_21_DAY)
VIX Fear Index
The VIX experienced an initial upward trajectory during the observed period, ascending from a close of 20.07 on November 14th to reach a peak high of 28.27 on November 20th. This rally, punctuated by two consecutive bullish candles on November 17th and 18th, indicated a period of increasing market volatility expectations. The November 20th candle was notably strong, showing a significant range and closing near its high, which could be interpreted as a potential climactic move given the subsequent price action.
Following this peak, the VIX demonstrated a clear bearish reversal pattern. The November 21st candle opened near the previous day’s high but closed significantly lower, signaling a shift in sentiment. This bearish momentum was strongly reinforced by the November 24th candle, which gapped down considerably from the previous close and ended near its daily low of 20.64. The provided daily percentage change for November 24th, a notable decline of -12.65%, unequivocally underscores the pronounced unwinding of volatility expectations over this short timeframe. This sequence of price action suggests that the upward trend in implied volatility has likely concluded, and a period of decreasing volatility is probable.
The current closing level of 20.64 places the VIX in proximity to a previously observed support zone, roughly between 19.50 and 20.50, which includes the low of 19.56 on November 14th and the low of 19.28 on November 20th. A roughly even chance exists that this zone will provide a temporary floor for the VIX, potentially leading to a period of consolidation or a minor technical rebound. However, a sustained breach below the 19.50 level would make a further decline in the VIX likely, indicating a continued reduction in perceived market risk. Conversely, a failure to hold this established support, followed by a rally above the recent high of 23.68, would suggest a resurgence of volatility, though this alternative scenario is less likely given the recent decisive bearish price action. Volume data is unavailable for this period, preventing any assessment of market participation or conviction behind these price movements.
VIX Technical Commentary (90-Day View)
The VIX demonstrated a discernible shift in volatility behavior over the 90-day period under review, transitioning from a predominantly subdued range to periods of elevated activity. Throughout July and August, the VIX largely oscillated between approximately 14.00 and 17.00, with an intermittent spike to 20.38 on August 1st. This initial phase established a zone of historical support around the 14.00-14.50 level, which consistently held during several tests, including lows near 14.21 in late August. By early October, the VIX continued to largely trade within the 14.50-17.50 range, indicating a relative calm despite occasional intra-day fluctuations.
A significant surge in implied volatility initiated around October 10th, catapulting the VIX from approximately 16.36 to 21.66. This marked the beginning of a more volatile phase. The VIX continued its ascent through October and November, making several attempts to break above the 20.00-22.00 threshold. Notably, on October 17th, the VIX recorded an intra-day high of 28.99, only to close significantly lower at 20.78, forming a long upper shadow suggestive of substantial selling pressure or a lack of conviction at higher levels. This resistance proved temporary, however, as the VIX mounted another rally, culminating in a close of 26.41 on November 20th.
Concurrent analysis of the 14-day Relative Strength Index (RSI) provides additional context to the price movements. The RSI generally correlated with VIX price action, entering overbought territory (above 70) during periods of sharp upward momentum. On October 10th, the VIX’s spike to 21.66 corresponded with an RSI reading of 73.09, signaling an overbought condition. Following a brief cooling period, the VIX’s most recent rally to 26.41 on November 20th was also accompanied by the RSI reaching 71.67, again indicating an overextended state. From this peak, the VIX has experienced a pronounced retracement, closing at 20.64 on November 24th, with the RSI subsequently declining to 51.79. This movement of RSI out of overbought territory is a notable development.
Considering the recent price action and indicator signals, a continuation of the short-term downtrend in VIX is likely, as the index has receded significantly from its recent peak and the RSI has cooled from overbought conditions. The immediate outlook suggests that the VIX will likely seek support in the 17.00-18.00 region, which aligns with previous consolidation areas. A rapid return to the November 20th highs around 26.00-28.00 is unlikely in the immediate term, given the current momentum profile. However, there remains a roughly even chance of the VIX consolidating around current levels (low 20s) before any further directional move, as the market digests the recent volatility surge. Renewed upward pressure would likely require a significant shift in underlying market sentiment not evident in the current technical data.
VIX Price & Indicators (RSI_14_DAY, MACD_13_21_DAY)
Tech Sector Analysis
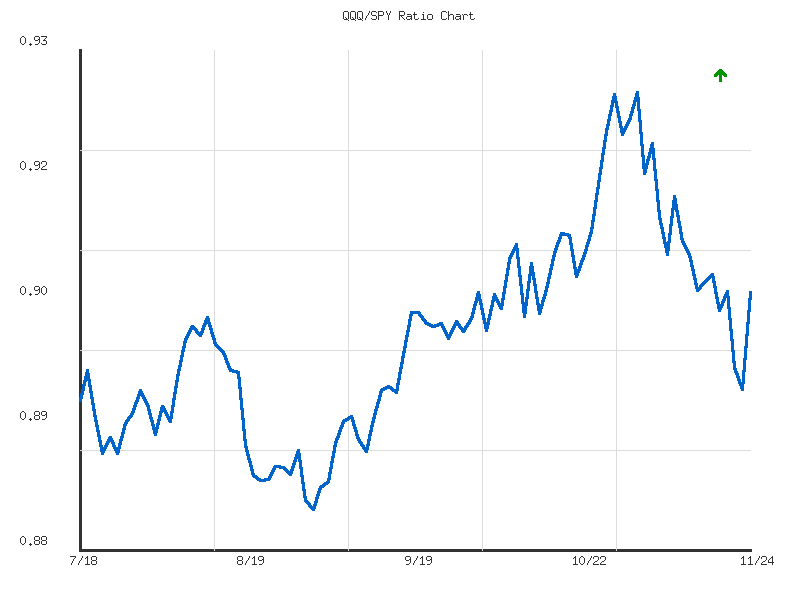
The provided 14-day ratio data for QQQ/SPY indicates a general period of underperformance for the NASDAQ-100 (QQQ) relative to the S&P 500 (SPY). Over this timeframe, the ratio has trended downwards, specifically a 1.61% decrease from the initial observation to the most recent data point. The trend analysis categorizes this as a “down” direction with “weak” strength. The ratio commenced at approximately 0.9199 on November 5th and generally eroded to a current value of 0.9050. This suggests that the broader market, as represented by SPY, has demonstrated greater resilience or upward momentum than the technology-heavy QQQ during this specific two-week interval.
Closer inspection of the data points reveals a fluctuating but predominantly declining trajectory. After an initial dip from 0.9199 to a temporary low of 0.9088 by November 7th, the ratio experienced a brief recovery to 0.9146 on November 10th. However, this rebound proved temporary, with the ratio then embarking on a more sustained decline. This extended downturn culminated in a 14-day low of 0.8954 on November 21st. The average ratio over the period was approximately 0.9071, indicating the current ratio of 0.9050 is slightly below the recent average. The low volatility reading suggests these movements have been gradual rather than abrupt.
The most recent data point, November 24th, shows a notable upward movement in the ratio, closing at 0.9050 after reaching the 14-day low of 0.8954 on November 21st. This specific bounce represents a recovery from the lower bound of its recent range. While the overall trend for the 14 days remains downward and weak, this recent upward shift places the ratio at 39.4% of the way from its 14-day low to its 14-day high. This short-term recovery is a technical observation that warrants attention.
Given the weak downward trend over the 14-day period, a continued relative underperformance of QQQ versus SPY remains likely in the near term. However, the bounce from the 14-day low on November 21st to the current ratio on November 24th introduces a roughly even chance of a short-term consolidation or a brief upward corrective movement in the ratio before the overall weak downward trend potentially resumes. A sustained move above the 14-day average of 0.9071 would be required to suggest a more significant shift away from the established underperformance. Conversely, a failure to maintain above the recent low of 0.8954 would make further relative underperformance highly likely.
As a CMT with extensive experience, I will provide a technical analysis of the QQQ/SPY ratio based solely on the provided 90-day market data, adhering strictly to estimative language guidelines.
The QQQ/SPY ratio, which gauges the relative performance of the Nasdaq 100-tracking ETF (QQQ) against the S&P 500-tracking ETF (SPY), has exhibited a discernible weak upward bias over the past 90 days. Commencing at approximately 0.8943 in mid-July, the ratio concluded the observed period at 0.9050 on November 24, representing a modest 1.20% increase. This weak upward trend has unfolded within a well-defined range, from a low of 0.8834 observed on September 2 to a high of 0.9250 recorded on November 3. The overall volatility of the ratio, as indicated by a metric of 0.0000988, suggests relatively stable day-to-day movements, with major shifts typically developing over several sessions rather than abruptly.
Following the peak at 0.9250 on November 3, the ratio entered a clear corrective phase, systematically declining to approximately 0.8954 by November 21. This retracement marked a significant shift from the preceding two-month rally. However, the most recent data point, November 24, shows a notable rebound to 0.9050. This strong single-day recovery from the immediate lows suggests a potential short-term inflection point. It is a roughly even chance that this upward move represents the initial leg of a renewed rally for QQQ relative to SPY, or merely a counter-trend bounce within a larger consolidation phase.
From a levels perspective, the ratio’s current standing at 0.9050 positions it slightly above its 90-day average of 0.9005, implying a marginal return to relative outperformance compared to its recent historical average. Should the current upward momentum persist, the prior high of 0.9250 will likely act as a formidable resistance level, potentially capping further immediate gains. Conversely, the recent low established around 0.8954 on November 21 is highly likely to serve as immediate technical support. A sustained breach below this level would make it likely that the ratio targets the stronger support zone around the 0.8834 multi-month low.
Considering these dynamics, there are two primary scenarios. It is a roughly even chance that the ratio could oscillate within a new, tighter trading range, perhaps between 0.895 and 0.915, as market participants assess the sustainability of QQQ’s relative strength. Alternatively, a decisive breakout above the 0.9250 resistance would indicate a high likelihood of QQQ resuming a more pronounced and sustained period of outperformance against SPY, potentially leading to new relative highs beyond the observed 90-day period. Without additional data beyond November 24, discerning the conviction behind the most recent bounce remains challenging, thus warranting caution and observation of future price action relative to these key technical levels.
Ratio Analysis: QQQ/SPY
Generated for 90days timeframe analysis
IWM vs. SPY
The IWM/SPY relative strength ratio has exhibited a weak sideways trend over the observed 14-day period. The ratio began at approximately 0.3612 on November 5th and concluded at 0.3587 on November 24th, representing a modest decline of approximately -0.69% for the duration. This pattern suggests that while neither index has demonstrated dominant relative strength, the S&P 500 (SPY) has marginally outperformed the Russell 2000 (IWM) during this specific timeframe. The reported “sideways” trend with “weak” strength indicates a period of consolidation or indecision in relative performance rather than a clear shift in market leadership.
Within this sideways environment, the ratio established a clear range. The high for the period was 0.3612, observed at the beginning of the dataset, while the low was 0.3497 on November 17th. The current ratio of 0.3587 is positioned towards the upper end of this 14-day range, with a reported relative_position of approximately 0.78. This indicates a recent recovery from the low, but the ratio remains below the period’s initial high. The very low volatility reported for this ratio further confirms the lack of strong directional conviction, implying that relative strength shifts have been minor and largely contained within this narrow trading band.
Given the established weak sideways trend and the current position near the upper end of the recent range, it is roughly an even chance that the ratio will continue to oscillate within the defined high-low band in the immediate future. A sustained move above the 0.3612 level would likely signal a potential for IWM to begin outperforming SPY more definitively, indicating a rotation towards smaller capitalization stocks. Conversely, a decisive break below the 0.3497 support level would likely indicate a renewed period of SPY outperformance. However, without additional data beyond this 14-day window to confirm a breakout or breakdown, the path of least resistance appears to be continued ranging.
Technical Analysis: IWM/SPY Ratio (90-Day)
The IWM/SPY ratio, which quantifies the relative performance between small-cap stocks (Russell 2000 ETF, IWM) and large-cap stocks (S&P 500 ETF, SPY), has demonstrated an overall weak upward bias over the past 90-day period. Commencing on 2025-07-18 at 0.3542, the ratio concluded on 2025-11-24 at 0.3586, registering a modest 1.247% gain across the entire timeframe. Despite the classification of an “up” trend, its designated “weak” strength and exceptionally low volatility (0.000047) are critical observations, indicating a lack of strong directional conviction and relatively stable price action. The ratio’s trading range has been defined by a 90-day low of 0.3456 on 2025-08-01 and a high of 0.3763 recorded on 2025-10-15. Notably, the current ratio of 0.3586 sits just below the 90-day average of 0.3598, suggesting a slight underperformance relative to its mean over the period.
While the aggregate 90-day trend indicates a weak ascent, a more granular examination of the recent data reveals a distinct shift in momentum. Following the peak of 0.3763 on 2025-10-15, the IWM/SPY ratio has experienced a significant and consistent decline, retreating to its current level of 0.3586. This substantial pullback from its 90-day high strongly suggests that the limited bullish momentum observed in earlier parts of the period has dissipated. The ratio’s current position, closer to its 90-day low (relative position 0.424) than its high, further reinforces the interpretation of recent underperformance and a potential shift toward a corrective or consolidation phase.
From a technical perspective, key levels for the IWM/SPY ratio include the established 90-day support at 0.3456 and resistance at 0.3763. Given the pronounced decline from the October high and the overarching weak trend strength, a continuation of consolidation or a further drift lower toward intermediate support levels, potentially in the 0.352-0.350 range, appears likely. A retest of the absolute 90-day low of 0.3456 is a conceivable outcome if the current bearish pressure intensifies. Alternatively, there is a roughly even chance that the ratio could find short-term stability around current levels and attempt a mean reversion towards its 90-day average of 0.3598, or even test the prior resistance established around 0.364-0.367 in September. However, a powerful resumption of the uptrend to decisively challenge the 0.3763 high in the immediate future seems unlikely without new catalysts driving a substantial increase in momentum beyond what is currently indicated by the weak trend and low volatility.

Ratio Analysis: IWM/SPY
Generated for 90days timeframe analysis
Commodities
Analyzing the provided daily percent change data for the specified commodity-related ETFs reveals a nuanced, albeit broadly positive, market sentiment within this defined basket of assets for the period under review.
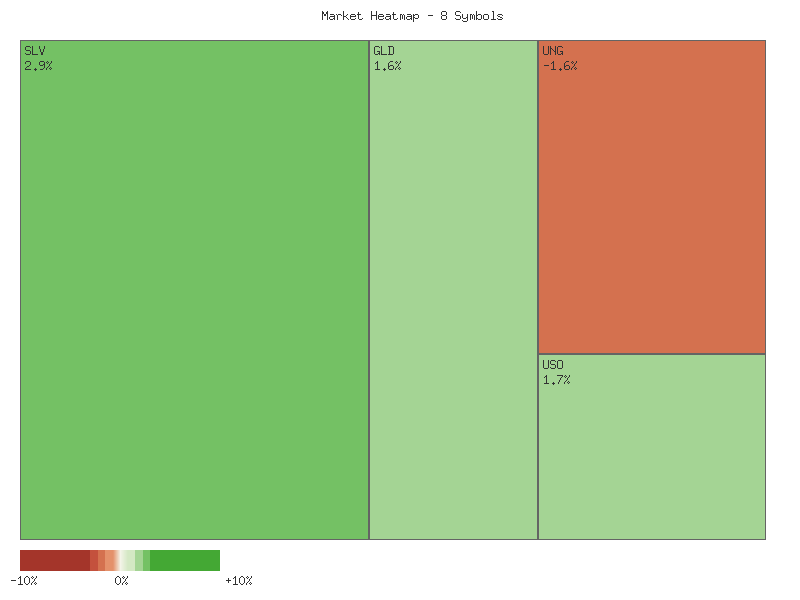
The performance matrix for these symbols, sorted in descending order of daily percent change, is as follows:
| Symbol | Daily Percent Change |
|---|---|
| SLV | 2.908% |
| USO | 1.703% |
| GLD | 1.598% |
| UGA | 1.235% |
| DBC | 0.488% |
| CPER | 0.097% |
| CORN | -0.057% |
| UNG | -1.587% |
Examining the market breadth for this specific group, we observe that six out of eight symbols (SLV, USO, GLD, UGA, DBC, CPER) advanced, while two symbols (CORN, UNG) declined. This indicates a clearly positive breadth, suggesting that a majority of assets within this selected commodity set experienced upward momentum. This broad participation on the bullish side makes it likely that overall sentiment for these commodities, as a collective, was favorable during this trading period, rather than being driven by isolated strength in a few names.
The strongest performers for the day were SLV (+2.908%), USO (+1.703%), and GLD (+1.598%). The significant outperformance in precious metals (SLV and GLD) and crude oil (USO) suggests a particular strength in these areas. While a single day’s data has limited predictive power for sustained trends, such a robust move in these key commodities could likely attract further attention from market participants. Conversely, the declines in UNG (-1.587%) stand out as the most significant weakness. CORN’s fractional decline (-0.057%) indicates roughly even chance for it to move in either direction in the immediate subsequent period, as it is essentially flat.
Considering alternative scenarios, despite the positive breadth, the notable decline in UNG suggests that the observed strength is not universally distributed across all commodity sectors. It is unlikely that this single-day performance indicates an across-the-board commodity rally without considering the specific underperformers. While the majority advancing signals a short-term bullish inclination for this selection, sustained upward momentum would require further confirmation from subsequent price action and volume analysis. The concentration of significant gains in precious metals and energy could suggest a flight-to-safety or inflation-hedging narrative, but without external context, we must limit conclusions to the relative price strength itself.
CMT Market Commentary: Two-Day Technical Snapshot
This technical analysis focuses exclusively on the provided two-day candlestick and volume data for a selection of commodity-related Exchange Traded Funds (ETFs) from November 21st to November 24th, 2025. Our assessment adheres strictly to technical patterns observed within this specific timeframe.
The precious metals complex, represented by GLD and SLV, exhibited a distinctly bullish tone over the two-day period. SLV, the iShares Silver Trust, formed a strong bullish candle on November 24th, closing near its high and effectively engulfing the prior day’s price action. Similarly, GLD, the SPDR Gold Shares, also printed a robust bullish candle, gapping up slightly and closing at the absolute high for the two-day observation. While both saw slightly decreased volume on the second day, this immediate price action strongly suggests a likely continuation of upward momentum for both gold and silver. A retest of the November 24th highs is a plausible scenario for both.
Within the energy sector, divergent patterns emerged. USO, the United States Oil Fund, displayed significant bullish strength on November 24th, closing near its daily high after opening slightly lower than the previous day’s close. This indicates a likely upward trajectory for crude oil prices. However, the notable decrease in volume accompanying this strong move introduces uncertainty regarding the sustainability of this rally without a short-term consolidation or pullback, which is a plausible alternative. In contrast, UGA, the United States Gasoline Fund, showed a strong bullish reversal on November 24th, recovering substantially from a gap down to close at its daily high. This suggests a probable short-term bottom; however, the dramatically lower volume on this recovery candle raises concerns about conviction. Conversely, UNG, the United States Natural Gas Fund, presented a notable bearish reversal pattern on November 24th. Following an initial bullish day, UNG gapped down significantly and closed lower than its open, indicating a likely shift to downward momentum. A continuation of this decline is probable, with a retest of Day 2’s high being an unlikely scenario in the immediate term.
Other commodity sectors show a mix of consolidation and mild bullishness. CPER, the United States Copper Index Fund, recorded two consecutive closes above its respective opens, hinting at a mild bullish bias. However, the slightly lower high on the second day and an open below the prior day’s close suggest underlying resistance, making a continued mild upward drift plausible but also allowing for a consolidation phase as a non-negligible possibility. CORN, the Teucrium Corn Fund, reflected a period of indecision, characterized by small, range-bound candles and a roughly even chance of minor upward or downward movement given the tight two-day range. DBC, the Invesco DB Commodity Index Tracking Fund, generally exhibited a moderate bullish bias, closing higher on the second day. While the bullish conviction might not be overwhelmingly strong due to a lower open on Day 2 and slightly reduced volume, a continuation of minor upward momentum for the broader commodity index is probable.
Performance Heatmap (SLV, GLD, CORN, CPER, USO, DBC, UGA, UNG)
Generated for 2days timeframe analysis
SLV Technical Analysis (90-Day View)
Our analysis of SLV over the past 90 days reveals a distinct bullish phase followed by a notable correction and a recent attempt at recovery. It is important to note that the provided data for MACD (13-21-Day) is absent, thus our assessment relies solely on price action, volume, and the 14-day Relative Strength Index (RSI).
SLV initiated a strong upward trend from late August, advancing significantly from approximately .40 to a peak near .33 by mid-October. This bullish leg was characterized by several strong upward candles, frequently accompanied by elevated trading volumes, suggesting robust buying interest. During this period, the 14-day RSI consistently remained above the 50-level, frequently entering overbought territory (above 70), reaching as high as 84.32 on October 13th and 83.09 on October 15th. Such extended periods in overbought conditions often precede a consolidation or correction phase, as buying pressure becomes stretched.
Following the mid-October peak, SLV experienced a sharp price reversal, declining from .33 to .79 between October 15th and October 21st. This downturn was particularly significant due to the exceptionally high trading volumes observed on October 17th (86 million) and October 21st (81 million). We assess that this substantial volume during the decline indicates strong selling pressure entering the market, contributing to the break in the prior uptrend. Concurrently, the 14-day RSI plummeted from its overbought extreme of 83.09 to a more neutral level of 52.87, reinforcing the loss of bullish momentum.
In the period subsequent to the mid-October correction and leading up to the most recent data point (November 24th), SLV largely consolidated within a range, primarily between and . The price action suggests a period of equilibrium as buyers and sellers contended. However, the most recent data shows SLV closing at .6175, following a series of higher closes from November 20th, accompanied by a modest increase in the 14-day RSI from 52.12 to 57.58. This indicates that buying interest has re-emerged from the consolidation range.
Considering the recent bounce, it is likely that SLV will attempt to retest prior resistance levels, specifically around the .00 - .00 zone, in the near term. The RSI’s movement back towards the neutral-to-bullish zone supports this potential upward trajectory. However, the significant selling volume witnessed during the mid-October peak suggests that this level could present considerable resistance. There is a roughly even chance that if SLV fails to decisively breach and hold above .00 with sustained high volume, the current bounce could be construed as a retest of broken support, subsequently acting as resistance. In such a scenario, SLV would be likely to revert and retest the - support level. A clear break above .33 on strong volume would be required to suggest a resumption of the broader uptrend, whereas a rejection near this level would signal continued caution.
SLV Price & Indicators (RSI_14_DAY, MACD_13_21_DAY)
Technical Analysis of GLD (90-Day View)
Over the past 90 days, GLD has exhibited a dynamic price trajectory, transitioning from a period of early August stability into a robust, sustained uptrend, followed by a significant correction and subsequent consolidation. This analysis focuses exclusively on the provided candle data and the 14-day Relative Strength Index (RSI), as MACD data, while specified in the chart request, was not available in the provided dataset. Our assessment indicates that GLD experienced a powerful bullish phase, culminating in a sharp reversal, and is currently navigating a period of market indecision.
The period from mid-August through mid-October was characterized by a pronounced bullish impulse. GLD initiated a strong rally from approximately - levels, gaining substantial upward momentum that propelled it to a peak of .15 on October 20th. This uptrend was marked by a series of higher highs and higher lows, with several large bullish candles appearing on above-average volume, particularly during breakout phases in early September and early October. Concurrently, the 14-day RSI consistently reflected this strong momentum, dwelling in overbought territory (above 70) for extended durations, reaching an extreme reading of 87.33 at the October peak. Such sustained overbought conditions are typically indicative of strong bullish conviction but also signal an increased probability of an impending price correction.
Following the October 20th high, GLD underwent a swift and significant bearish correction. The day after the peak (October 21st), the price dropped sharply from .15 to .24, accompanied by exceptionally high volume (53.69 million shares), which is a strong technical signal of capitulation or aggressive selling. This sudden reversal continued, with GLD falling to a low of .12 by October 28th. The 14-day RSI mirrored this rapid decline, plummeting from its overbought extreme of 87.33 to below 50 in just a few trading sessions, confirming the dramatic shift in short-term momentum and relieving the previous overbought condition. This abrupt change suggests a likely exhaustion of the prior bullish trend.
The price action throughout November has largely been characterized by a period of consolidation, ranging roughly between and . After the sharp October decline, GLD has generally traded within this band, displaying more balanced supply and demand dynamics, with volumes generally lower than during the peak rally and correction phases. The 14-day RSI has stabilized in a more neutral range, mostly oscillating between 47 and 65, suggesting a lack of clear directional momentum. The latest closing price of .20 on November 24th positions GLD near the upper end of this recent consolidation, with the RSI at 58.10, indicating slightly bullish momentum within this range but without re-entering overbought territory.
Looking forward, the market faces roughly even chances of two primary scenarios emerging from the current consolidation. GLD could either attempt a breakout above the resistance, potentially signaling a resumption of the broader uptrend seen before October’s correction, supported by sustained volume and a rising RSI. Alternatively, a breakdown below the - support zone (notably the Oct 28th low and the early November support) is also plausible, particularly if bearish volume increases, which would suggest a continuation of the downtrend from the October peak. Traders should closely monitor these key price levels for resolution of the current indecision.
GLD Price & Indicators (RSI_14_DAY, MACD_13_21_DAY)
Gold/Silver Ratio
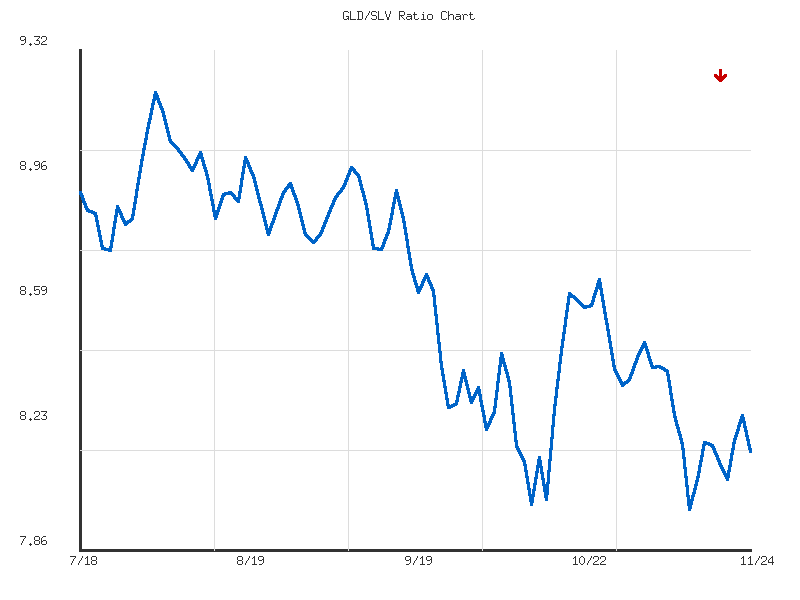
The GLD/SLV ratio has exhibited a weak downtrend over the past 14 days, registering a net change of -2.89%. This initial phase saw the ratio decline from its starting point of 8.398, peaking at 8.404 on 2025-11-06, before falling significantly to a low of 7.985 on 2025-11-12. This sustained decline over the first half of the period likely suggests that market participants were favoring SLV (silver) over GLD (gold), with silver demonstrating stronger relative performance. The consistent erosion of the ratio value points to a bearish sentiment for gold relative to silver during this particular stretch. The observed weakness in the trend strength further implies that while the direction is down, the conviction behind this move may not be robust.
Following the notable low of 7.985, the GLD/SLV ratio has shown signs of stabilization and a modest recovery, climbing back to 8.155 by the period’s end on 2025-11-24. This rebound from the 14-day low indicates that the selling pressure on the ratio may have abated, at least temporarily. However, the current ratio of 8.155 still resides below the 14-day average of 8.202, suggesting that despite the recent bounce, the overall sentiment remains tilted towards SLV’s relative strength. The ratio’s relative position within its 14-day range, at 0.4067, confirms it is in the lower half of this period’s price action, reinforcing that the recovery has not fully negated the earlier decline. The low volatility (0.0151) observed throughout the period suggests that the movements, while directional, were not marked by extreme price swings.
Considering the weak downtrend and recent corrective bounce, we assess it is a roughly even chance that the ratio could either resume its downward trajectory or consolidate in the current range. A decisive break below the 7.985 support level would likely confirm the continuation of silver’s outperformance against gold, potentially targeting lower ratio values. Conversely, for the ratio to exhibit a more bullish reversal, it would need to sustain a move above the 14-day average of 8.202, and ideally clear the recent minor resistance level around 8.260 (from 2025-11-21). A failure to break above these levels would make a significant shift in trend unlikely in the immediate future, instead favoring either consolidation or a resumption of the weak downtrend. Traders should monitor these key technical levels for clearer directional cues.
CMT Technical Analysis: GLD/SLV Ratio – 90-Day Outlook
The GLD/SLV ratio has exhibited a clear and sustained downtrend over the past 90 days, indicating a period of significant outperformance by silver (SLV) relative to gold (GLD). The data reveals an overall decline of approximately 8.47% from the initial observation point, with the trend officially characterized as “down” with “moderate” strength. This downward trajectory commenced after an early peak, suggesting that the prevailing market sentiment has favored silver’s appreciation over gold’s for the duration of this observed timeframe. The ratio’s ability to maintain this bearish channel underscores the persistent strength in SLV relative to GLD.
Examining the price action more closely, the ratio initially peaked at 9.202 on August 1st, representing the highest point within this 90-day window. Following this peak, the ratio began a gradual descent, finding initial support near the 8.75 level in late July and again in mid-August. A more pronounced decline initiated around mid-September, pushing the ratio decisively below its 90-day average of 8.613. This breakdown below the average ratio, which has largely acted as resistance since early October, suggests that buying interest for GLD relative to SLV has diminished considerably.
The bearish momentum accelerated further in late September and October, leading the ratio to establish a new low at 7.985 on November 12th. This specific low acts as a critical short-term support level. Subsequent to reaching this trough, the ratio has experienced a modest rebound, currently trading around 8.156. This price action suggests a phase of consolidation or a minor corrective bounce after touching a significant support zone. Given its current relative position (13.98% above the low for the period), the ratio is currently situated near the lower end of its observed range, reinforcing the notion of sustained silver outperformance.
In the immediate term, there is a roughly even chance that the ratio will continue its current phase of consolidation or attempt a minor rally from the 7.985 low. Should the 8.15-8.20 area hold, a further move towards the 8.35-8.45 resistance zone appears likely. However, the overall moderate downtrend remains intact, and a sustained move above the average ratio of 8.613 is unlikely without a significant shift in market dynamics. For GLD to regain relative strength against SLV, a decisive break and hold above the 8.613 average would be required, potentially targeting the prior high of 9.202.
Conversely, the primary risk scenario involves a breakdown below the critical support at 7.985. A convincing close below this level would strongly indicate a continuation of silver’s outperformance and would likely lead to new lows in the GLD/SLV ratio. While this scenario is currently less certain than a short-term consolidation given the recent bounce, the overarching downtrend makes it a probable outcome if the current minor rebound fails to gain momentum. Traders should closely monitor the 7.985 level for potential breakdown signals, which would likely reinforce the bearish technical outlook for the GLD/SLV ratio.
Ratio Analysis: GLD/SLV
Generated for 90days timeframe analysis
Bonds
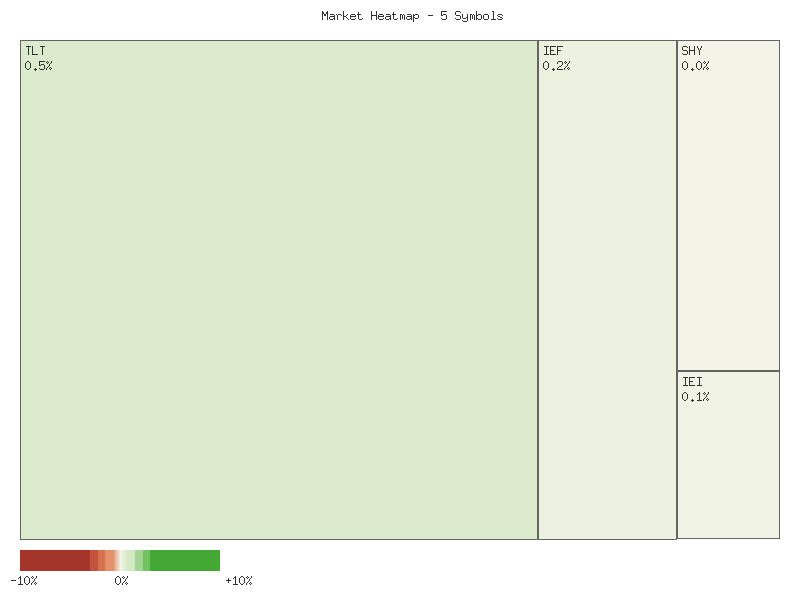
The daily percentage changes for the observed fixed-income instruments on the given day present a clear, consistent pattern. All instruments recorded positive daily gains, ranging from 0.018% to 0.547%. The following matrix summarizes these movements:
| Symbol | Daily Percent Change |
|---|---|
| TLT | 0.547% |
| UTHY | 0.435% |
| IEF | 0.154% |
| IEI | 0.054% |
| SHY | 0.018% |
We observe a discernible relationship between the duration of the fixed-income instruments and their daily percentage performance. Longer-duration instruments, such as TLT (long-term U.S. Treasury bonds) and UTHY, exhibited the most substantial positive changes. Specifically, TLT led the group with a 0.547% gain, followed by UTHY at 0.435%. Conversely, intermediate-duration instruments (IEF, IEI) saw more modest gains, while SHY, representing short-term U.S. Treasury bonds, posted the smallest increase at 0.018%. This structure suggests that market participants favored longer-duration exposure for this particular trading day.
Based solely on this technical data, we assess that the stronger performance in longer-duration bonds relative to shorter-duration bonds is likely indicative of either declining long-term interest rate expectations or an increased demand for long-dated maturities. The uniform positive performance across all duration segments, albeit with varying magnitudes, suggests a broadly positive sentiment for fixed income on this single day. However, without additional price action data (e.g., historical trends, candlestick patterns, volume analysis), it is difficult to infer if this represents a significant trend reversal or merely a one-day anomaly.
Considering the limitations of a single data point, we judge there is roughly an even chance that this pattern could be an isolated event or the initial signal of a developing technical trend favoring longer-duration bonds. It is unlikely that such a consistent gradation across various durations occurred without a specific underlying market dynamic influencing fixed-income pricing. However, confirming the sustainability of this dynamic would require observing subsequent trading days and integrating volume analysis. Alternative scenarios include this being a minor retracement within a broader trend or a reaction to an intra-day event not captured by the end-of-day percentage change. We caution against extrapolating a robust trend from this limited dataset.
Market Commentary: Fixed-Income ETF Technical Review (Nov 21-24, 2025)
The provided two-day market data for selected fixed-income Exchange Traded Funds (ETFs) reveals a notable shift in immediate-term technical posture. We judge that a short-term bullish bias is likely developing across the observed instruments, primarily characterized by upward price movements and gap-ups from the close of November 21st to the open of November 24th. This broad directional move suggests a general positive sentiment for bonds in the immediate term, although the conviction behind these rallies varies significantly based on individual volume patterns.
Examining TLT, IEF, and IEI, a common theme emerged: a bullish gap-up from the prior day’s close and a higher close on November 24th. For IEI, this upward momentum was accompanied by a slight increase in volume, which we assess with high confidence supports a likely continuation of its short-term bullish trend. In contrast, TLT and IEF, despite their bullish price action, saw a notable decrease in trading volume on November 24th. For these two, we assess with moderate confidence that further upward momentum is likely, but the reduced volume introduces uncertainty. A plausible alternative scenario for TLT and IEF involves a period of consolidation or a retest of the recent gap area to establish stronger conviction.
SHY, representing shorter-term treasuries, exhibited exceptionally tight price action over the two days. With negligible price movement and a very small-bodied candle on both days, it closed marginally higher on slightly increased volume on November 24th. We assess with high confidence that SHY is likely to continue trading within a very narrow, sideways range, with a slight upward bias. A significant directional breakout from this tight consolidation appears unlikely without a substantial shift in volume or range. UTHY, the 3-month Treasury Bill ETF, also presented a bullish gap-up and higher close on November 24th. However, its trading volume collapsed by over 80% on the second day. While a short-term bullish bias is evident, we judge that there is a roughly even chance of sustained upward movement versus a retracement or consolidation due to the extremely low conviction implied by such a drastic reduction in volume, alongside its generally thinly traded nature.
In conclusion, the two-day period concludes with a prevalent immediate-term bullish bias for these fixed-income ETFs. While the overall direction appears upward-leaning, the varying degrees of volume participation are critical for assessing conviction. Investors should note that IEI’s bullish move appears more robust due to supportive volume, whereas TLT, IEF, and particularly UTHY, face a higher risk of consolidation or pullback as they seek to confirm their recent gains with stronger buying interest. We emphasize that these assessments are based on extremely limited data and pertain solely to the very immediate technical outlook.
Performance Heatmap (TLT, UTHY, IEF, IEI, SHY)
Generated for 2days timeframe analysis
Magnificent 7 & Friends
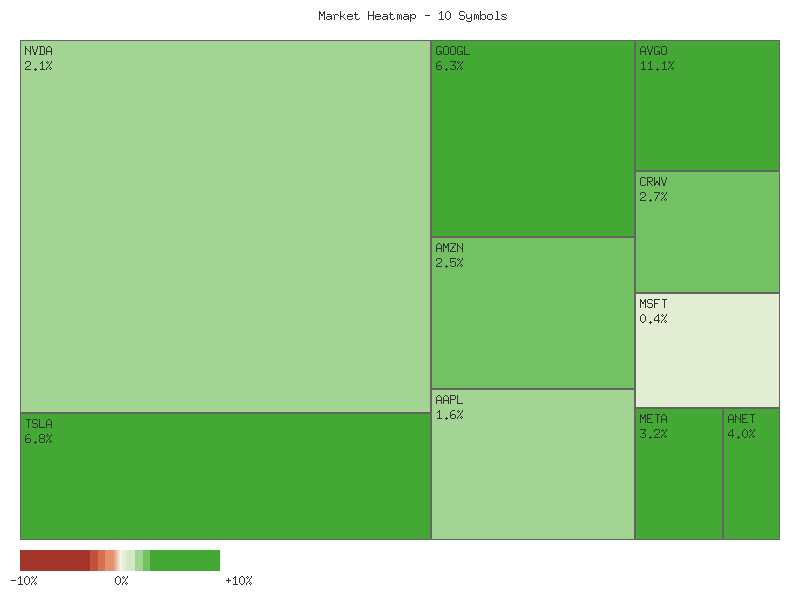
| Symbol | Daily Percent Change |
| :----- | :------------------- |
| AVGO | 11.121% |
| TSLA | 6.825% |
| GOOGL | 6.314% |
| ANET | 4.020% |
| META | 3.164% |
| CRWV | 2.736% |
| AMZN | 2.452% |
| NVDA | 2.052% |
| AAPL | 1.614% |
| MSFT | 0.398% |

Analysis of the provided daily percentage change data suggests a predominantly bullish sentiment across the sampled equities for the observed single day. All ten symbols posted positive daily returns, with AVGO demonstrating significant outperformance, gaining 11.121%. This magnitude of gain for AVGO is noteworthy and suggests strong immediate-term buying pressure, making it likely that this stock experienced a catalyst that attracted considerable demand during the period. Following AVGO, TSLA and GOOGL also exhibited substantial appreciation, with gains of 6.825% and 6.314% respectively, indicating a robust upward impulse for these particular names. This broad-based strength in key technology and growth sectors provides some evidence of positive momentum.

The remaining cohort of stocks—ANET, META, CRWV, AMZN, NVDA, AAPL, and MSFT—also recorded positive daily changes, ranging from ANET's 4.020% to MSFT's 0.398%. The fact that every single equity in this diverse sample closed in positive territory is a significant observation for the day. While MSFT's gain of under half a percent is modest compared to its peers, it still contributes to a collective positive bias. This widespread participation in gains, even if varied in intensity, suggests that overall market sentiment for this group of securities was constructive. It is likely that this positive breadth indicates a general willingness among participants to accumulate across multiple segments within the observed group.

Considering these data patterns, it is highly probable that the immediate technical outlook for the general market, as represented by these selected equities, maintains a positive bias. The uniform daily advances across all symbols suggest a lack of significant selling pressure on the observed day. However, it is crucial to acknowledge that this analysis is based solely on a single day's price action. While the breadth of positive performance is compelling, a single data point does not establish a trend. It is roughly even chance that this strong positive day could be followed by consolidation or a slight retracement as short-term profit-takers emerge. Conversely, it is also likely that such widespread positive momentum could attract further buying interest in the very near term, potentially extending the upward move. Future sessions would need to confirm if this broad buying interest represents a sustainable shift or merely a temporary surge.
As a Chartered Market Technician with 15 years of experience, this analysis relies solely on the provided two-day candle data, adhering strictly to ICD-203 estimative language guidelines.
The two-day technical data for the selected instruments indicates a predominantly bullish sentiment across the cohort, with notable price advances observed in several key names. We assess that the collective price action suggests strengthening demand for many of these securities. This period has revealed both clear bullish continuation patterns and significant bullish reversals, providing an estimative framework for near-term expectations. The analysis of these 2-day candle formations, alongside their associated volume, allows us to infer immediate directional bias based purely on chart patterns.
We observe robust bullish continuation in several instruments. AAPL and META both displayed strong follow-through, with higher closes and supporting volume dynamics, making further upward movement likely. GOOGL similarly presented a powerful bullish pattern, characterized by a substantial gap-up, large bullish body, and increased volume, suggesting further appreciation is highly likely. Conversely, TSLA and ANET demonstrated potent bullish reversals after prior dips; TSLA’s large bullish candle and ANET’s gap-up reversal make continued upward trajectory probable, despite some volume moderation. Most notably, AVGO exhibited an exceptionally powerful reversal, with a massive gap-up, wide range, and close near its high, all on significantly increased volume, indicating that strong bullish continuation is highly probable. For CRWV and AMZN, while upward momentum is evident, decreasing volume introduces a roughly even chance of continued strength or consolidation, though continued upward pressure remains likely given strong closes.
Not all instruments presented clear directional signals. MSFT exhibited a small-bodied, indecisive candle following a bearish day. The tight range and virtually flat volume indicate a roughly even chance of either continuation of prior bearish sentiment or a potential minor rebound. For NVDA, a recovery candle followed a strong bearish day, but it failed to reclaim the prior day’s high. The significant decrease in volume on the recovery day suggests a lack of strong conviction. Consequently, we assess that while an immediate continuation of the recovery is possible, the likelihood of a sustained strong upward trend is less probable, with a roughly even chance of consolidation or renewed selling pressure.
Performance Heatmap (TSLA, MSFT, AAPL, META, NVDA, AVGO, GOOGL, AMZN, CRWV, ANET)
Generated for 2days timeframe analysis
S&P 500 Sector Breadth
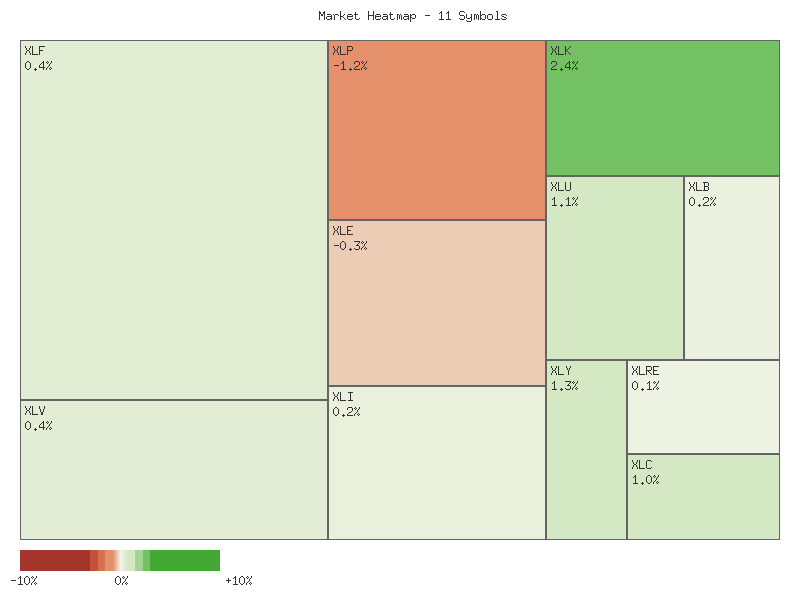
The daily sector performance data indicates a generally positive market breadth. Of the eleven S&P 500 sectors analyzed, nine sectors advanced while only two declined. This suggests a likely broad participation in upward price action across a significant portion of the market, although the magnitude of these movements varies considerably.
Examining the breakdown between offensive and defensive sectors reveals a mixed, yet predominantly risk-on, sentiment. Among the offensive sectors, Technology (XLK) was the strongest performer, advancing by 2.412%, followed by Consumer Discretionary (XLY) with a 1.308% gain. Communication Services (XLC), Financials (XLF), Industrials (XLI), and Materials (XLB) also posted gains. Only Energy (XLE) declined among the offensive group, retreating by -0.302%. For defensive sectors, Utilities (XLU) showed robust strength with a 1.112% gain, while Healthcare (XLV) and Real Estate (XLRE) also advanced modestly. Consumer Staples (XLP) was the weakest performer overall, declining by -1.181%.
The observed sector movements suggest a nuanced market rotation. The strong performance of key offensive sectors like Technology and Consumer Discretionary indicates a likely preference for growth-oriented assets. However, the significant advance in Utilities, a traditionally defensive sector, alongside the decline in Consumer Staples, presents a more complex picture. This pattern could imply that while investors are generally favoring offensive plays, there is also selective positioning within defensive areas, potentially as a hedge or based on specific fundamental drivers not visible in this technical data. The decline in both a cyclical (Energy) and a defensive (Consumer Staples) sector indicates that not all segments are moving in concert with the prevailing upward momentum.
Based on the preponderance of advancing offensive sectors and their strong leadership in gains, the overall market sentiment appears to be likely leaning towards optimism and risk-taking. The top two performers are unequivocally offensive sectors, driving the overall positive breadth. While the strong performance of Utilities could suggest some underlying caution, it does not outweigh the broad-based gains in offensive areas. Therefore, market participants are likely exhibiting confidence in economic prospects, supporting a continued allocation to more cyclical and growth-oriented segments. An alternative scenario, though less likely, might be that the strong performance in specific offensive sectors (e.g., XLK) masks underlying weakness in broader market sentiment, but this is not directly supported by the current data.
Here is a summary of the daily percent changes:
| Symbol | Daily Percent Change |
|---|---|
| XLK | 2.412% |
| XLY | 1.308% |
| XLU | 1.112% |
| XLC | 0.965% |
| XLF | 0.406% |
| XLV | 0.375% |
| XLI | 0.241% |
| XLB | 0.174% |
| XLRE | 0.122% |
| XLE | -0.302% |
| XLP | -1.181% |
Technical Analysis: SPDR Sector ETFs (XLP, XLRE, XLI, XLU, XLV, XLY, XLF, XLB, XLE, XLC, XLK) over Two Days
The market data spanning the last two trading days for the eleven SPDR Sector ETFs presents a predominantly bullish picture across most sectors, albeit with a persistent and noteworthy trend of declining volume. Eight out of the eleven sectors recorded higher closes on the second day, suggesting a continuation of buying interest. However, a significant reduction in trading volume accompanied this bullish price action in nearly all sectors, which likely signals a potential weakening of conviction behind the moves or a broader participation slowdown. This divergence between price and volume warrants careful consideration for the near-term outlook.
Several sectors demonstrated strong bullish momentum during the period. Technology (XLK) and Consumer Discretionary (XLY) charted robust higher highs and higher closes on the second day, with XLK’s second day body notably engulfing the first day’s range, indicating strong bullish continuation. Similarly, Utilities (XLU) showed a pronounced bullish engulfing pattern on day two, pushing to higher levels. While these price actions are very likely indicative of immediate bullish strength, the significantly decreased volume in XLK (over 50% drop), XLY (over 40% drop), and XLU (approx. 20% drop) raises a cautionary flag. This weakening volume behind strong advances often precedes a period of consolidation or a retracement, making a sustained high-momentum rally less likely without renewed buying interest.
Other sectors exhibited more moderate bullish continuation or consolidation. Industrials (XLI), Healthcare (XLV), Financials (XLF), and Communication Services (XLC) all recorded higher closes with higher highs on the second day, yet also experienced notable volume declines ranging from 30% to over 50%. Materials (XLB) and Real Estate (XLRE) both formed inside bars on the second day, closing slightly higher but failing to exceed their prior day’s high, indicating a pause in momentum after initial bullish moves. The significantly reduced volume in these sectors further supports the interpretation of a short-term consolidation phase, where a continuation of upward momentum is likely to face resistance without an influx of new buying volume.
Conversely, two sectors displayed signs of short-term weakness. Consumer Staples (XLP) saw its second day form a bearish outside bar with a close below the prior day’s open, and its high matching the prior day’s close—a likely sign of resistance and short-term selling pressure. Energy (XLE) also registered a bearish candle on day two, closing below its prior day’s close and failing to make a higher high relative to the first day’s high. Both XLP and XLE experienced reduced volume on their bearish days, which, while indicating less selling conviction than if volume were high, still suggests that a retracement or continued downward pressure is likely in the immediate term.
In conclusion, the overarching technical picture suggests a market bias that is likely bullish across many sectors, evidenced by widespread positive price action over the two days. However, the pervasive and significant decline in trading volume is a critical technical input. This widespread reduction in volume following bullish moves introduces a roughly even chance of momentum fading or price retracing in the near future, despite the immediate upward trajectory. Traders should consider that continued price appreciation without an accompanying increase in volume could be unsustainable, making these sectors more susceptible to profit-taking or a pullback.
Performance Heatmap (XLP, XLRE, XLI, XLU, XLV, XLY, XLF, XLB, XLE, XLC, XLK)
Generated for 2days timeframe analysis
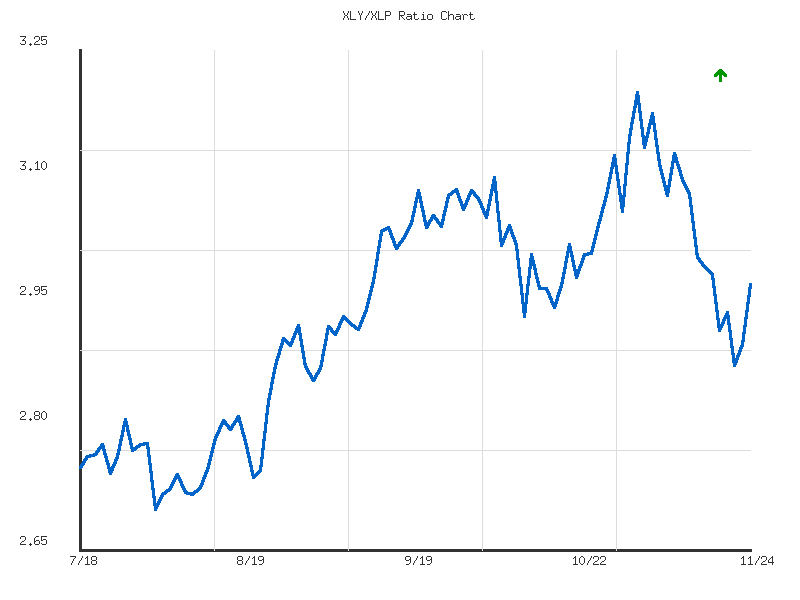
XLY vs XLP
The XLY/XLP ratio exhibited a short-term sideways trend over the past seven trading days, characterized by weak strength. The period commenced on November 14th with the ratio at approximately 2.989. Following this, the ratio experienced a noticeable decline, reaching a low of roughly 2.869 on November 20th. This movement represented a roughly 4% depreciation in the relative performance of Consumer Discretionary versus Consumer Staples over a four-day span, implying a short-lived reduction in risk appetite within this specific timeframe.
Subsequent to the low on November 20th, the ratio staged a robust rebound, closing on November 24th at approximately 2.967. This upward movement has positioned the current ratio at 0.8199 relative to its 7-day range, indicating it is near the higher end of the observed price action for this period. The overall net change for the seven days was a modest decline of -0.72%, reinforcing the observed sideways directional bias, despite the recent upward momentum. Volatility remained relatively low at 0.001777, suggesting consolidation rather than a strong directional breakout.
Considering the recent strong rebound and the ratio’s current proximity to its 7-day high, it is roughly even chance that the ratio will attempt to test the 2.989 resistance level in the immediate term. However, given the overarching “sideways” trend designation for the period, a sustained breakout above this level is currently unlikely without further confirming data. An alternative, and perhaps equally likely, scenario is a reversion to the average ratio of 2.935, potentially indicating continued range-bound trading between the established support near 2.869 and resistance at 2.989. Further data points are required to assess the potential for a directional shift beyond this contained range.
Technical Analysis: XLY/XLP Ratio (90-Day)
The XLY/XLP ratio, which measures the performance of the Consumer Discretionary sector (XLY) relative to the Consumer Staples sector (XLP), has exhibited a discernible upward trend over the past 90 days, increasing by approximately 8.04%. This moderate bullish directional trend suggests that investor preference has generally favored growth-oriented discretionary spending over defensive, essential goods during this period. The early phase of this 90-day window, spanning from mid-July to early August, observed the ratio consolidating primarily between 2.70 and 2.80. A brief, sharp dip to the 90-day low of 2.69 on August 1st appears to have served as a probable catalyst for the subsequent sustained rally, establishing a pattern of higher lows and higher highs.
Following the August 1st low, the ratio initiated a robust ascent, indicating a strengthening appetite for risk. This upward momentum gained significant traction in late August and throughout September, as the ratio successfully breached key psychological resistance levels at 2.90 and subsequently 3.00. Such decisive breakouts typically attract further buying interest, contributing to the trend’s continuation. The ratio ultimately culminated in a 90-day peak of 3.199 on November 3rd, marking the apex of this bullish phase. However, this peak was immediately followed by a substantial correction, with the ratio experiencing an approximately 10.5% decline to a recent low of 2.86 by November 20th. This sharp pullback suggests a shift in short-term sentiment, potentially driven by profit-taking after the significant rally.
The most recent data points indicate a potential stabilization and a subsequent bounce from the November 20th low. The ratio has advanced from 2.86 to the current level of 2.967 as of November 24th, notably reclaiming its 90-day average ratio of 2.933. This move above the average suggests that the recent decline from the November 3rd peak may have encountered at least temporary support, with some buying interest returning to the ratio. The overall volatility figure of 0.0177 for the period, while suggesting moderate daily price swings on average, does not preclude sharper movements, as evidenced by the recent correction and rebound. At this juncture, a roughly even chance exists for either a continued short-term bounce towards previous resistance levels or a resumption of downward pressure, potentially retesting the recent 2.86 low.
Looking ahead, key technical levels warrant close observation. If the XLY/XLP ratio can sustain its position above the 90-day average, a test of the prior resistance zone in the 3.00-3.05 range is likely. A successful penetration and hold above this area could signal a resumption of the broader uptrend. Conversely, a failure to maintain levels above the 90-day average, particularly a break below the 2.90 level, would suggest that the recent bounce might have been merely a short-term relief rally. In such an alternative scenario, a retest of the November 20th low of 2.86 is probable, and a further decline toward the 2.80-2.85 area, which served as a significant breakout level earlier in the trend, would not be unlikely. The overarching moderate upward trend, despite the recent correction, might suggest that the larger bullish structure could still be intact, but further clear price action, specifically the formation of higher lows, is required to provide clearer confirmation of renewed upward momentum.
Ratio Analysis: XLY/XLP
Generated for 90days timeframe analysis
Equity Breadth
The S&P 500 breadth indicators over the past seven trading days reveal a clear pattern of initial weakening followed by a notable short-term recovery. Examining the percentage of S&P 500 members trading above their 50-day moving average (SPXA50R), we observed a decline from 42.4% on November 14th to a low of 29.6% by November 20th. This movement indicates a contraction in short-term bullish participation, suggesting internal market weakness was likely pervasive during this period. Subsequently, the SPXA50R experienced a sharp rebound, escalating to 41.2% on November 21st and further to 43.2% by November 24th, recovering all prior week’s losses and then some. This swift reversal in breadth is a positive technical development, indicating a renewed short-term buying interest and broader participation among constituent stocks.
Concurrently, the percentage of S&P 500 members trading above their 200-day moving average (SPXA200R) also exhibited a downtrend, falling from 52.8% on November 14th to 42.6% on November 20th. This decline, while less severe than the SPXA50R’s drop, suggests a deterioration in the underlying long-term health of the index’s components. However, similar to the shorter-term indicator, the SPXA200R also saw a recovery, moving to 48.6% on November 21st and closing at 49.2% on November 24th. This rebound, while steady, was less aggressive than the SPXA50R’s recovery, implying that while short-term momentum is improving, the market’s long-term technical structure is mending at a more deliberate pace.
The divergence in the magnitude of the respective rebounds between SPXA50R and SPXA200R is a noteworthy observation. The swift and strong recovery in the SPXA50R suggests that a short-term bullish impulse is highly likely currently influencing the market’s internal dynamics. This indicates a favorable environment for near-term price appreciation for many S&P 500 components. However, the more subdued recovery in SPXA200R suggests that the market’s broader, longer-term trend may still be contending with underlying pressures or is in an earlier stage of a structural recovery. Therefore, while a short-term rally is likely, the sustainability of a more significant, longer-term uptrend requires further evidence of strengthening in the 200-day breadth.
Considering alternative scenarios, there is a roughly even chance that the pronounced short-term recovery in SPXA50R could be part of a counter-trend bounce within a broader, more negative long-term context, particularly given that the SPXA200R has not fully recovered its earlier highs from November 14th. If the SPXA200R fails to ascend above 52.8% in the coming days, it could signal that the long-term trend remains constrained despite the short-term enthusiasm. Conversely, if the SPXA200R continues its upward trajectory and surpasses previous resistance levels, it would provide strong confirmation of improving market health across a broader time horizon, making a sustained rally highly likely. Traders should continue to monitor both breadth indicators for confirmation of trend direction and strength.
SPY Daily
SPY has maintained a robust long-term uptrend over the past 90 days, with the 50-day Exponential Moving Average (EMA) consistently remaining above the 200-day EMA, both trending positively. This configuration is widely considered a bullish signal, indicating that buyers have generally been in control across intermediate and longer timeframes. Price action has predominantly stayed above these key moving averages, reinforcing the underlying strength of the market. The Relative Strength Index (RSI_14_DAY) has frequently resided in the upper half of its range, often dipping into overbought territory, which further supports the prevailing bullish sentiment throughout much of this period.
The market’s behavior over the past seven days exhibits heightened volatility and a significant shift in short-term momentum. Following a period of modest gains, November 20th witnessed a substantial bearish candlestick, closing well below its open and significantly beneath the 50-day EMA, on very high volume (154.7 million shares). This event drove the RSI down to 35.11, indicating deeply oversold conditions and suggesting a strong wave of selling pressure. However, the subsequent two trading days (November 21st and 24th) demonstrated a notable recovery. The session on November 24th saw SPY open higher, maintain positive momentum throughout the day, and close at 668.82, reclaiming its position above the 50-day EMA (665.56). This recovery occurred on lighter volume (67.1 million shares) compared to the prior selling climax, with the RSI rebounding to 49.55, nearing the neutral 50-level.
Looking forward, several scenarios appear plausible. The bullish case suggests that the bounce from the oversold RSI and the reclaim of the 50-day EMA on November 24th indicate a resumption of the broader uptrend. It is likely that the prior dip served as a healthy correction within an established bullish channel, attracting new buyers. Price might now retest resistance levels around the October 29th high of 689.70 or the November 12th high of 684.96. Conversely, the bearish case posits that the high-volume sell-off on November 20th signifies a more fundamental shift in sentiment. The subsequent rebound on lower volume might be indicative of a weak rally rather than strong conviction. A failure to hold above the 50-day EMA (665.56) could lead to a retest of immediate support at the recent swing lows around 650-652. A decisive break below this zone would likely target the 200-day EMA (626.66) as the next significant support level.
A neutral case appears to have a roughly even chance, given the conflicting signals. The market might consolidate around the 50-day EMA, with price oscillating between approximately 660 and 675, as the RSI attempts to stabilize around 50. This consolidation would allow the market to digest the recent volatility before a clearer directional bias emerges. Sentiment drivers in the near future will likely be influenced by whether the technical reclamation of the 50-day EMA on reduced volume can sustain itself. If buying interest increases on subsequent upward moves, it would confirm a renewed bullish sentiment. Conversely, any downward pressure accompanied by increasing volume would likely reinforce bearish sentiment and indicate vulnerability. The market’s ability to defend recent lows and hold above the 50-day EMA will be a critical determinant of short-term psychological leanings among participants.
SPY Technical Analysis: November 24, 2025
The SPY ETF has exhibited a clear uptrend through much of the 90-day period under review, beginning in mid-July and extending into early October 2025. During this phase, SPY consistently made higher highs, with a notable peak reached around 673.95 on October 9th. Accompanying this bullish price action, the 14-day Relative Strength Index (RSI) frequently entered overbought territory (above 70), indicating strong momentum. For instance, the RSI peaked at 75.58 on July 25th, aligning with a local price high, and repeatedly exceeded 70 in September and early October, confirming the strength of the rally.
A significant shift in market dynamics became apparent around October 10th. Following the peak, SPY experienced a sharp single-day decline to 653.02, which caused the RSI to drop substantially from 65.75 to 41.81. While not strictly entering oversold territory below 30, this abrupt move signaled a material loss of bullish momentum. This event marked a turning point, as the market subsequently transitioned into a more consolidative and then bearish phase.
From late October through the current date, SPY’s price action has deteriorated, showing a pattern of lower highs and lower lows. After attempting to recover and re-testing resistance near the 689.70 level in late October, the ETF has been in a sustained downtrend. The RSI mirrored this bearish sentiment, declining from high 60s levels and approaching oversold conditions. On November 20th, the RSI reached 35.10, the lowest point observed in the entire 90-day data set, coinciding with a significant price drop to 652.52 on elevated volume, which suggests strong selling pressure. The most recent data point shows SPY closing at 668.82 with the RSI recovering slightly to 49.54, suggesting a relief rally from recent lows but still remaining below the neutral 50-level.
Considering the recent price action and RSI, a bearish continuation in the near term is likely. The bounce observed from 652.52 to 668.82 appears to be a corrective move within a broader downtrend rather than a definitive reversal, given that the RSI has yet to decisively reclaim the 50-level. A retest of the recent low around 652.52 is probable. Should this critical support level fail to hold, a further decline towards prior support levels, potentially around the early August low of 621.72, becomes likely. For a shift back to a bullish bias, SPY would need to sustain its current recovery, with RSI breaking above both the 50-level and subsequently the 60-level. A clear reversal of the established downtrend would require a break above the previous swing high of approximately 689.70, which is currently unlikely without new market information not present in the provided technical data. It is important to note that the requested MACD_13_21_DAY indicator data was not provided, therefore this analysis relies exclusively on price action and the 14-day RSI, precluding a comprehensive assessment that would otherwise incorporate momentum crossover and divergence signals from the MACD.