Weekly Market Technical Analysis
Following a period of intense selling, broader market indices staged a notable rebound on November 21st, led by small-cap performance, though it is a roughly even chance this is a short-term bottom or a relief rally. The VIX remains moderately bullish, suggesting elevated volatility is likely to persist. Significant sector divergence is apparent: while short-to-intermediate duration bonds show clear bullish momentum (highly likely to continue), technology and consumer discretionary sectors are likely to face further downside pressure. Most “Magnificent 7” equities exhibit prevailing bearish trends that are highly likely to persist, contributing to SPY’s likely continued downward pressure after breaking key moving averages. Consequently, caution remains warranted, with market leadership consolidating in defensive or shorter-duration assets.
Market Indices
On the most recent trading day, November 21, the market indices under review displayed uniform positive performance. The daily percent changes are presented below:
| Symbol | Daily Percent Change |
|---|---|
| IJR | 3.140% |
| IWM | 2.832% |
| MDY | 2.387% |
| SPY | 0.999% |
| QQQ | 0.755% |
| OEF | 0.744% |
This robust market breadth, with all six symbols advancing, is likely indicative of broad buying interest on the specific day, suggesting a probable relief from prior selling pressure.
Examining the 14-day data, the price action clearly reveals a period of pronounced volatility characterized by sharp pullbacks preceding the latest advance. Multiple instances of significant daily declines were observed across the indices, particularly around November 13, 17, and 20, with QQQ exhibiting some of the larger percentage drops (e.g., -2.352% on Nov 20). These periods of decline strongly suggest underlying bearish pressure was dominant on those specific days. The sequential declines followed by the recent strong bounce form a pattern that might represent a V-shaped recovery or a test of support levels.
The subsequent sharp upward reversal on November 21, notably with small-cap indices IJR (+3.140%), IWM (+2.832%), and MDY (+2.387%) leading the gains, is a significant development. This stronger performance by smaller capitalization indices compared to large-caps (SPY, QQQ, OEF) on the rebound could indicate a potential shift in market sentiment towards higher-beta assets or an attempt by the broader market to participate in the rally. It is plausible that this signifies a rotation, though further data would be necessary to confirm such a trend.
The overarching trend for the past 14 days is best characterized as a dynamic period of consolidation and price discovery, marked by sharp, short-term corrections followed by equally aggressive rebounds. While the recent strong bounce is likely to alleviate immediate selling pressure, whether this constitutes a definitive trend reversal or merely a relief rally within a broader indecisive range remains uncertain. A sustained upward trend would probably necessitate follow-through buying volume and subsequent higher closes in the coming sessions to be confirmed. Conversely, a failure to hold these gains might suggest that the prior bearish pressures could reassert themselves, making a continuation of the volatile, range-bound environment a distinct possibility.
Market Commentary: Technical Analysis of Major US Equity ETFs (November 2025)
Our technical analysis of the provided 14-day candle data for SPY, QQQ, IWM, IJR, MDY, and OEF indicates a broad market rally in the first week of November, followed by a significant downturn, culminating in potential short-term reversals at the end of the period. Across all six ETFs—representing large-cap, mid-cap, and small-cap segments—we observe a consistent pattern of price appreciation from roughly November 4th to November 12th. For instance, SPY advanced from approximately to , QQQ from to , and IWM from to . This initial upward movement was generally supported by moderate to elevated trading volumes, suggesting a degree of conviction behind the early-month bullish sentiment. The uniform nature of this rally across different market capitalizations suggests that the buying pressure was widespread.
Subsequently, a notable shift in market dynamics occurred, with all six indices experiencing a pronounced decline from approximately November 13th through November 20th. This downturn was characterized by a series of bearish candles, many displaying larger bodies and closing near their daily lows. The selling pressure appears to have intensified around November 17th, with elevated trading volumes accompanying the declines, particularly for SPY, QQQ, and IWM. For example, SPY saw its price retreat from its peak of to a low of .89 on November 20th, a decline of roughly 4.5%, with trading volume significantly increasing to over 154 million shares on November 20th. Similarly, QQQ experienced a sharper percentage decline, shedding approximately 6% from its high, also on exceptionally high volume on November 20th. The increased volume on down days is often interpreted as a sign of strong bearish conviction and the likely capitulation of some market participants.
The trading session on November 20th appears particularly pivotal, with all ETFs printing strong bearish candles, often reaching new lows for the observed 14-day period, and consistently on very high volume. This pattern, characterized by large red bodies and low closing prices, generally reflects a day dominated by sellers. However, the subsequent session on November 21st exhibits a compelling counter-pattern. All indices, without exception, formed bullish reversal candlesticks, such as hammers or bullish engulfing patterns, closing significantly above their open prices and well off their intraday lows. This reversal was also accompanied by substantially elevated volumes across the board (e.g., SPY at 116M, QQQ at 99M, IWM at 94M). We judge it likely that this collective price action on November 21st signals a short-term exhaustion of selling pressure and the emergence of buying interest at these lower price levels.
Considering these patterns, we assess a roughly even chance that the market has established a short-term bottom on November 20th, making a temporary rebound likely in the immediate future. The coordinated bullish reversal across multiple market segments, supported by high volume, provides some credibility to this thesis. However, it is also plausible that this is merely a ‘dead cat bounce’ within a broader, emerging downtrend. The previously established support levels for each ETF, which were broken during the recent decline (e.g., SPY’s ~670 and QQQ’s ~608), will likely now act as resistance. A failure to reclaim these levels on meaningful volume would render a sustained upward trajectory unlikely, instead suggesting a continuation of the mid-November bearish momentum. Continued monitoring of volume accompanying any upward movement will be crucial for discerning the true nature of this potential reversal.
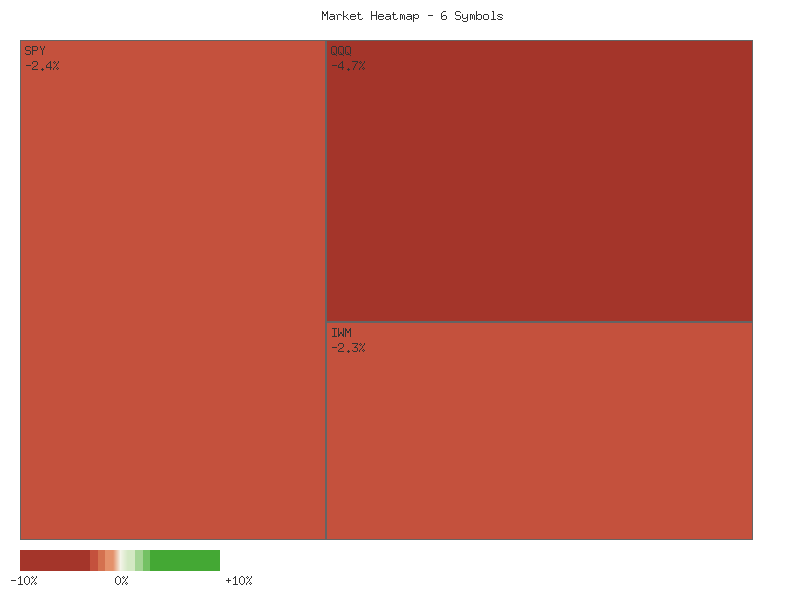
Performance Heatmap (SPY, QQQ, IWM, IJR, MDY, OEF)
Generated for 14days timeframe analysis
Market Commentary: SPY Technical Outlook (90-day Horizon)
The SPY ETF has exhibited a discernible upward bias over the past 90 days, advancing from the low 620s in July to establish an all-time high within this dataset near 689 in late October. This general uptrend, however, has been punctuated by several notable price corrections, suggesting periods where profit-taking has exerted significant downward pressure. Recent price action indicates a material retreat from the late October peak, bringing the ETF back to test a crucial support area. Volume analysis further reveals that selling pressure intensified during these declines, with higher volumes accompanying significant price drops, indicating conviction behind the bearish moves during those specific periods. This overall pattern hints at an established uptrend that has recently encountered robust resistance and distribution.
A thorough examination of the 14-day Relative Strength Index (RSI) largely corroborates these price dynamics, frequently signaling overbought conditions immediately preceding price pullbacks. The RSI registered above the 70 threshold on multiple occasions, notably peaking at 75.58 on July 25th, 73.70 on September 22nd, and approaching overbought at 69.71 on October 29th. Each of these instances was followed by a subsequent price decline. Most recently, the RSI experienced a sharp descent, reaching 35.10 on November 20th, positioning it near the oversold threshold of 30. This near-oversold reading coincided precisely with the lowest price point of the latest correction. The subsequent rebound in the RSI to 41.50 on November 21st, alongside a positive price close, suggests a likely exhaustion of immediate selling pressure and introduces a moderate probability of a short-term price bounce.
From a price structure perspective, a significant resistance level has emerged around the 689 mark, representing the highest trading point within the provided 90-day data, achieved on October 29th. Following this peak, SPY experienced a substantial decline, with initial support evident near 653 on October 10th. The most recent sell-off, which culminated on November 20th, rigorously retested this critical price zone, as SPY touched 651.89 before closing slightly higher at 652.52. The subsequent trading session on November 21st witnessed a convincing rebound, with the price closing notably higher at 659.04. This convergence of a prior swing low and the recent price action delineates a significant support area roughly between 651.89 and 653.02. The elevated volume accompanying both the November 20th low and the November 21st rebound strongly indicates that this support level has attracted substantial buying interest.
Synthesizing these technical inputs, there is a roughly even chance for a near-term recovery to extend towards previous resistance levels, potentially retesting the 670-680 range, given the robust bounce from a prominent support level and the RSI’s rebound from near-oversold territory. However, the recurring pattern of RSI indicating overbought conditions prior to pullbacks implies that a sustained breakout above the 689 peak would likely necessitate a material and prolonged shift in buying momentum, a scenario currently assessed as having only a moderate probability in the immediate term. An alternative, yet lower probability, scenario involves the potential failure of the 651.89-653.02 support zone. Should SPY breach and sustain trade below this critical area, especially on elevated volume, it would likely signal a higher probability of further downside, possibly targeting the low 630s based on prior consolidation areas identified earlier in the 90-day period. This bearish outlook, while less likely given recent buying activity, remains a plausible risk if the current bounce lacks consistent follow-through.
SPY Price & Indicators (RSI_14_DAY, MACD_13_21_DAY)
Technical Analysis of QQQ (Last 90 Days)
The Invesco QQQ Trust (QQQ) experienced a robust uptrend over the initial portion of the 90-day period, characterized by a series of higher highs and higher lows from mid-July through late October 2025. Following a base around the 550-560 range in late July and early August, the price ascended steadily, reaching a peak close of .77 on October 29. During this bullish phase, the 14-day Relative Strength Index (RSI) frequently resided in overbought territory (above 70), notably in late July, mid-September, and early October, indicating strong upward momentum and enthusiastic buying. Volume during this period was generally moderate, with some spikes accompanying minor pullbacks, suggesting a relatively orderly advance.
A significant shift in market dynamics became evident following the late October peak. From October 30 onwards, QQQ entered a distinct downtrend, marked by lower highs and lower lows. A sharp decline on October 10, characterized by a dramatic price drop from .40 to .50 on the highest volume seen in the period until then (94.4 million shares), acted as an early warning of potential volatility, despite a subsequent recovery to new highs. The sustained selling pressure from late October was accompanied by noticeably elevated trading volumes on down days, particularly a cluster of high-volume declines in November. This pattern, where increasing volume accompanies price depreciation, typically suggests strong distribution and heightened bearish conviction.
Currently, QQQ is exhibiting strong bearish momentum. The price has recently broken below a key support level established by the October 10 low (.50), with the close on November 20 reaching .70. The 14-day RSI has concurrently plummeted from overbought levels in late October to 35.35 on November 20, and 38.73 on November 21. While not strictly in the traditional oversold region (below 30), this rapid descent into the lower third of the RSI range indicates a substantial loss of bullish strength and suggests significant selling pressure. The extremely high volumes recorded on November 20 (111.7 million shares, the highest in the entire data set) and November 21 (99.5 million shares) on these recent down moves reinforce the bearish sentiment, often signaling capitulation or exhaustion of selling pressure.
Looking forward, we judge it is a roughly even chance that QQQ experiences a short-term rebound. The combination of price reaching new lows for this period and the RSI entering the lower range, coupled with exceptionally high selling volume on November 20 and 21, often precedes at least a temporary bounce as sellers may become exhausted and short-covering emerges. However, given the established downtrend since late October and the clear pattern of lower highs, it is likely that any rebound would be met by overhead resistance. A sustained recovery above the recently broken support near - would require a significant shift in buying conviction, which is not yet definitively supported by the available data. Conversely, should the price continue to break lower with high volume, a continuation of the downtrend is likely.
QQQ Price & Indicators (RSI_14_DAY, MACD_13_21_DAY)
Here is a technical analysis of IWM based exclusively on the provided 90-day market data for price action and the 14-day Relative Strength Index (RSI).
Over the past 90 days, IWM has experienced significant price volatility, transitioning from a period of general uptrend to a more recent phase of pronounced selling pressure. From mid-July, IWM traded largely range-bound between approximately and before breaking out higher in mid-August. The subsequent rally established a series of higher highs, peaking at approximately .77 on October 15. This upward trajectory was characterized by several high-volume upward movements, particularly in late August and mid-September, indicating strong bullish conviction during those periods. Key resistance levels were observed near , , , and , which were successively overcome during the ascent.
The 14-day RSI largely mirrored the price action, confirming the momentum shifts. In late July and early August, the RSI dipped into the low 40s, indicating a loss of upward momentum, preceding a price consolidation. The subsequent rallies in mid-August and throughout September pushed the RSI into overbought territory (above 70) multiple times, specifically reaching 67.21 on August 13 and 71.23 on September 18. Despite these overbought readings, price continued its ascent for a period, suggesting strong underlying demand. However, a sharp drop in price on October 10 was accompanied by a significant decline in RSI from roughly 60 to 45, indicating a strong shift in short-term momentum.
The most recent period, particularly from late October through mid-November, reveals a notable bearish shift. Following the peak on October 15, IWM began to decline, breaching several minor support levels. The selling intensified significantly between November 13 and November 20, characterized by large bearish candles and exceptionally high trading volumes, including a staggering 93.8 million shares on November 20. During this aggressive downturn, the RSI moved from the low 50s into deeply oversold territory, reaching 32.63 on November 20. This penetration below 30 strongly suggested a short-term exhaustion of selling pressure. On the last day of available data, November 21, IWM exhibited a strong rebound, forming a bullish engulfing-like candle from its lows on very high volume (94.7 million shares), simultaneously causing the RSI to bounce to 43.98.
Considering the recent price action and indicator readings, there is a roughly even chance that IWM could experience a further short-term recovery. The robust price rebound on November 21, coupled with the prior oversold RSI condition, suggests that a short-term bottom may have formed. However, the magnitude of the preceding decline on very high volume implies substantial overhead resistance is likely to emerge in the - range. An alternative scenario suggests that this rebound may be a relief rally within a broader downtrend. Continued selling pressure would likely push IWM to retest or break below the recent low, especially if volume during any subsequent rallies proves to be insufficient. Therefore, traders are likely to monitor the - range closely for signs of either renewed buying interest or sustained bearish rejection.
IWM Price & Indicators (RSI_14_DAY, MACD_13_21_DAY)
VIX Fear Index
The VIX, often regarded as the “fear index” indicating market expectations of near-term volatility, has demonstrated a pronounced upward trend over the observed 14-day period. The index commenced near 18.87 on November 4th and concluded at 23.63 on November 21st, reflecting an increase in market uncertainty. The initial phase, from November 4th to November 12th, largely saw the VIX consolidating between approximately 17.10 and 20.48. This period was characterized by mixed daily percentage changes, including a notable -7.90% drop on November 10th, suggesting a temporary equilibrium or reduction in volatility expectations. The sustained price action within this range appears to have established a short-term support zone around the 17.00-17.50 level. The absence of volume data limits our ability to gauge the conviction behind these early price movements.
A significant shift in market sentiment is highly likely to have occurred around November 13th. This day is marked by a substantial bullish candle, opening at 17.61 and closing at 20.37, which can be interpreted as a likely bullish engulfing pattern relative to the prior day’s close of 17.48. This pattern, following a period of consolidation, appears to have initiated a more aggressive uptrend in the VIX. The subsequent days saw the VIX breaking above previous resistance levels, driven by multiple double-digit percentage increases, including +16.53% on November 13th, +11.36% on November 17th, +9.22% on November 18th, and +11.62% on November 20th. This pattern of escalating percentage changes indicates a likely acceleration of perceived risk and increasing fear in the underlying markets.
The VIX reached its peak within this dataset on November 20th, with an intraday high of 28.27 and a close at 26.41, signaling heightened volatility. However, the final day, November 21st, presented an indecisive candlestick pattern featuring long upper and lower shadows, with the VIX closing at 23.63 after opening at 25.97. This movement was accompanied by a significant -10.53% daily decline. This price action suggests a roughly even chance of either short-term exhaustion from the recent VIX rally or the beginning of a consolidation phase. Given the strong upward momentum observed in the preceding days, it is unlikely that the current high level of volatility will reverse sharply back to the low 17s without further significant price action or a more extended period of consolidation. An alternative scenario involves the VIX attempting to retest the recent high of 28.27, particularly if market uncertainty persists; however, an immediate sharp upward continuation is unlikely without first encountering further intraday battles given the indecisive nature of the final candle.
As a Chartered Market Technician, I will analyze the provided VIX data using rigorous technical analysis principles, adhering strictly to ICD-203 estimative language guidelines. This analysis relies solely on the VIX candle data and the 14-day Relative Strength Index (RSI) provided for the 90-day period.
Over the past 90 days, the VIX has exhibited a pattern of increasing volatility, transitioning from a predominantly sideways consolidation to a more pronounced uptrend. Beginning in mid-July around 17.16, the index initially declined, finding temporary support around the 14.20-14.70 area in late July and late August. A notable surge occurred on August 1st, pushing the VIX to 20.38, before a retreat. The VIX then traded largely within a 14.00-17.00 range through much of September and early October. However, a significant upward shift became evident from early October, with a sharp spike to 21.66 on October 10th. The most recent period, particularly November, has seen the VIX establish a higher baseline, culminating in peaks around 24.41 on November 18th and 26.41 on November 20th. The current closing price of 23.63 suggests a sustained elevation in market volatility expectations compared to the preceding months.
The 14-day Relative Strength Index (RSI) provides additional context to the VIX price action. Early in the period, the RSI moved below 40, indicating weakening upward momentum as the VIX declined to its lower range. Subsequent VIX surges, such as on August 1st and October 10th, were mirrored by the RSI pushing into overbought territory, reaching 65.38 and 73.09 respectively. Critically, the VIX’s recent ascent in November has also seen the RSI move significantly above the 70 threshold, hitting 71.67 on November 20th. The most recent RSI reading of 60.85 on November 21st, while still elevated, indicates a retreat from the extreme overbought conditions observed immediately prior. This suggests a likely deceleration in the VIX’s immediate upward momentum, although the underlying trend remains one of increased volatility.
Combining the price action with the 14-day RSI, the VIX exhibits a clear pattern of volatility expansion. Recent VIX peaks at 24.41 and 26.41 occurred concurrently with RSI readings well into overbought territory (69.58 and 71.67). The subsequent VIX decline to 23.63, coupled with the RSI retracting to 60.85, suggests a highly likely short-term consolidation or minor retracement following the intense buying pressure. However, the VIX has established a series of higher lows and higher highs since late October, with the 17.00-17.50 level appearing to transition from a resistance zone to potential support. The VIX remaining above its mid-range, combined with the RSI still being above 50, makes a complete reversal of the recent uptrend seem unlikely in the immediate term.
It is imperative to note that data for the MACD (13,21-day) indicator was not provided, therefore no technical analysis or conclusions can be drawn regarding MACD signals such as crossovers or divergences. Based exclusively on the available VIX candle data and 14-day RSI, the technical posture for VIX is moderately bullish, indicating an elevated expectation of future volatility. While a short-term correction is plausible given the recent overbought RSI conditions and the VIX’s current position below its November 20th high, a continued upward trajectory for the VIX, potentially retesting or surpassing recent highs, remains likely. Conversely, a sustained drop below the 17.00-17.50 range would diminish the bullish outlook, suggesting a roughly even chance of a more significant retracement.
VIX Price & Indicators (RSI_14_DAY, MACD_13_21_DAY)
Tech Sector Analysis
The RATIO:QQQ/SPY data over the past 28 days reveals a distinct shift in relative performance. Initially, from October 14th to November 3rd, QQQ exhibited relative strength, with the ratio advancing from approximately 0.903 to a peak of 0.925. This period likely saw the technology-heavy NASDAQ-100 outperforming the broader S&P 500. However, a significant reversal commenced after November 3rd, leading to a consistent decline in the ratio, which reached its lowest point of 0.8954 on November 21st, the most recent data. The overall trend is identified as “sideways” with “weak” strength and a negative change of -0.84% across the entire period. This indicates that despite the initial outperformance, the latter half of the observation window has been characterized by QQQ’s underperformance relative to SPY, with strong downside momentum presently dominating.
From a technical perspective, the ratio’s peak at 0.925 on November 3rd now functions as a short-term resistance level, indicating the point at which relative outperformance encountered significant selling pressure. Prior to the recent decline, the ratio found some initial support near 0.903 (October 14th), and subsequently within the 0.905-0.908 range (October 15-23), but these levels have since been breached. The current low of 0.8954 on November 21st establishes a new, immediate support level. Given that this is the lowest point observed in the dataset, a breach below 0.8954 would imply the ratio is entering uncharted territory for this specific 28-day period, with no historical support within this window to reference.
Considering potential future price action, a bullish case for QQQ’s relative performance would require a strong rebound from the 0.8954 level. This scenario implies that the recent underperformance is an exhausted move, and capital rotation back into technology stocks is imminent. A move above the average ratio of 0.9110 would be necessary to confirm renewed relative strength, but the probability of an immediate bullish reversal appears low given the current momentum. The bearish case appears more likely in the immediate term. The ratio has established a clear downtrend since November 3rd, breaking key prior support levels and currently resting at its 28-day low. Sustained relative weakness would likely see the ratio breach 0.8954, opening the path for further underperformance. A neutral case would involve the ratio consolidating around 0.8954, trading in a tight range between this support and perhaps minor resistance around 0.905. There is a roughly even chance of short-term consolidation as the market digests the recent move before a clearer directional bias emerges.
The discernible shift in the RATIO:QQQ/SPY indicates a change in market sentiment. The initial ascent of the ratio strongly suggests that investor sentiment favored growth and technology stocks, leading to QQQ outperforming SPY. However, the consistent decline since early November, culminating in the current underperformance, implies a probable rotation of capital away from the technology sector and into broader market segments. This behavioral dynamic suggests that market participants are either becoming more cautious about highly concentrated technology exposure, shifting to sectors perceived as more resilient, or engaging in profit-taking in the NASDAQ-100 relative to the S&P 500. The current trend suggests that sentiment has become less favorable for concentrated technology exposure, preferring broader market diversification or different sector leadership.
Technical Analysis: QQQ/SPY Ratio (90-Day View)
The QQQ/SPY ratio, spanning a 90-day period from mid-July to late November 2025, presents a complex picture classified broadly as a “sideways” trend with “weak” underlying strength. Despite this overarching characterization, a detailed technical review reveals distinct phases of relative performance. The ratio oscillated within a significant range, reaching a 90-day low of approximately 0.8834 on September 2nd and a high of around 0.9251 on November 3rd. The current ratio stands at 0.8954, placing it closer to the lower boundary of this observed trading range, as indicated by its relative position of 0.288 within the 90-day high-low spectrum.
The initial phase of this 90-day window, from mid-July through early September, was characterized by a general decline in the ratio or consolidation near the lower end of its range. Following an initial dip from approximately 0.8945, the ratio established a significant support area around the 0.883 to 0.889 zone, culminating in the 90-day low on September 2nd. This period reflected either underperformance or a lack of strong outperformance by QQQ relative to SPY. This established floor at 0.8834 is a critical level to monitor for future movements, as its resilience proved fundamental in the subsequent rally.
From early September to early November, the QQQ/SPY ratio experienced a robust rally, ascending from its 0.8834 low to peak at 0.9251. This phase indicated a period of notable outperformance by the Nasdaq 100 components over the broader S&P 500. The advance demonstrated strong bullish momentum in the ratio, signaling investor preference for growth-oriented QQQ assets during this specific timeframe. The high of 0.9251 on November 3rd now stands as a key resistance level, representing the apex of the ratio’s relative strength over the past three months.
However, the period from November 3rd to the present (November 21st) has seen a sharp and substantial retracement. The ratio has declined significantly from its high of 0.9251 to the current level of 0.8954. This represents a deep retracement, approximately 71% of the prior rally from the September 2nd low to the November 3rd high. Such a pronounced pullback, exceeding the 61.8% Fibonacci retracement level, strongly suggests that the bullish momentum observed in the previous phase has been largely eroded. The ratio is now re-testing a crucial support confluence zone, roughly between 0.890 and 0.895, which has acted as both support and resistance at various points in late July and August.
Looking forward, the technical indicators suggest a period of continued uncertainty. There is a likely chance that the QQQ/SPY ratio will continue to test the established support zone around 0.890-0.895. A sustained break below this area would increase the probability of a further decline toward the 90-day low of 0.8834. Considering the depth of the recent retracement and the overall “weak” trend strength, a significant and immediate rebound to re-challenge the 0.9251 high appears unlikely without clear signs of accumulation. Conversely, there is a roughly even chance that the ratio could find temporary stability around the current 0.895 level, potentially leading to a period of consolidation. However, even if consolidation occurs, renewed bearish pressure is plausible given the deep correction experienced from the November high.
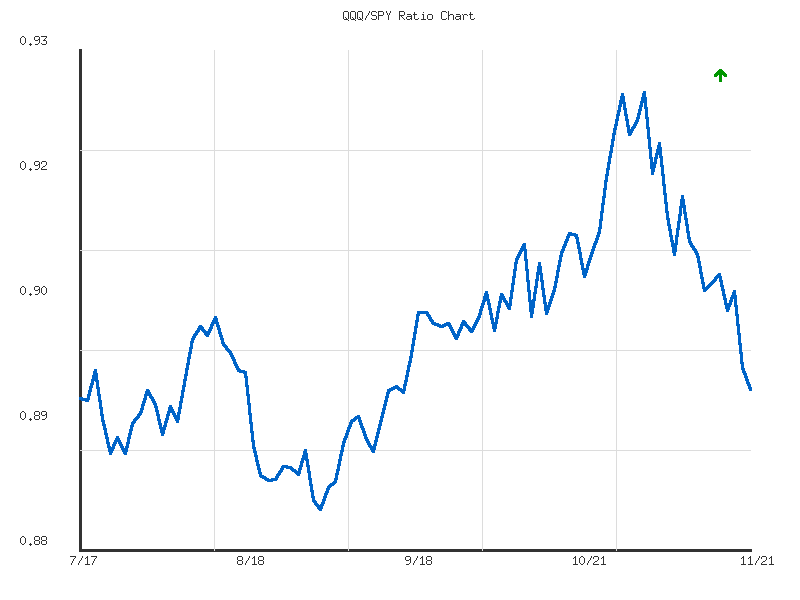
Ratio Analysis: QQQ/SPY
Generated for 90days timeframe analysis
IWM vs. SPY
The relative performance ratio of IWM to SPY over the past 28 days indicates a moderate downtrend, with IWM underperforming SPY by approximately 4.49%. The ratio began near 0.3743 on October 14th, experiencing an initial peak at 0.3763 on October 15th before systematically declining. The current ratio stands at 0.3575, positioned within the lower third of its observed range for this period. This sustained downward trajectory suggests a consistent preference for larger-cap equities (represented by SPY) over small-cap equities (represented by IWM) among market participants during this observation window. The overall momentum is clearly negative, albeit at a moderate pace, signifying a prevailing sentiment favoring broader market stability and growth represented by the S&P 500.
Analyzing the price action more closely, the ratio established a clear resistance zone around the initial peak of 0.3763. Subsequently, several attempts to sustain above 0.365 proved unsuccessful, with declines following each minor rally. A notable support level emerged around 0.3497 on November 17th, which was tested and held. Following this, the ratio experienced a rebound, closing at 0.3575 on the last day, demonstrating a potential short-term shift from this low. However, immediate overhead resistance is likely to be encountered near the 0.360-0.362 level, which acted as a support in late October and early November before being broken. The rally from 0.3497 to 0.3575 is significant, though it has yet to overcome established minor resistance levels.
Considering future price action, a bearish case is likely if the existing moderate downtrend reasserts itself, potentially leading the ratio to re-test the recent low of 0.3497. A break below this level would signal a continuation of IWM’s underperformance, with the next technical support level not clearly defined in this limited dataset, but possibly extending towards 0.345. Conversely, a bullish case might develop if the recent bounce from 0.3497 gathers momentum. There is a roughly even chance that the ratio could consolidate around current levels or attempt to break past immediate resistance near 0.362. A sustained move above 0.362 would indicate a shift in relative strength, making IWM’s outperformance of SPY a more likely scenario.
A neutral case appears to have a roughly even chance, where the ratio may oscillate within the recent range, perhaps between 0.350 and 0.365, before a clearer directional bias emerges. Sentiment drivers, strictly based on this technical data, suggest a prevailing preference for larger-cap stability (SPY) over the higher growth/risk profile of small-cap companies (IWM), as evidenced by the sustained downtrend. The most recent uptick in the ratio could indicate a nascent shift in this implied sentiment, suggesting that market participants might be starting to rotate back into small-caps or anticipate an environment where small-caps could perform better. However, this observation is based on a single data point’s rebound and does not yet constitute a confirmed change in the broader relative trend or a strong shift in market preference.
Technical Analysis: IWM/SPY Ratio (90-Day)
The IWM/SPY ratio, which measures the relative performance of the Russell 2000 (IWM) against the S&P 500 (SPY), has exhibited a broadly sideways trend over the past 90 trading days, fluctuating within a range of approximately 0.3457 to 0.3763. While the overall trend has been classified as sideways with weak directional strength, closer examination of the data reveals distinct phases of shifting relative strength. The current ratio of 0.3575 sits in the lower-middle portion of this observed range, indicating that the recent period has not established sustained outperformance for either small-caps or large-caps when viewed from a longer-term perspective within this window.
Following a peak on October 15th at a ratio of 0.3763, IWM entered a clear period of relative underperformance compared to SPY. This downtrend in the ratio persisted, reaching a low of 0.3497 on November 17th. This sustained decline suggests that for roughly a month, the S&P 500 was notably outperforming the Russell 2000. The level around 0.349-0.350 has demonstrated characteristics of a significant short-term support zone, as indicated by the ratio reversing its decline from this level. The subsequent four trading days, concluding on November 21st, show a modest but discernible rebound from this support, pushing the ratio to its present level of 0.3575, implying a short-term pause or reversal in the previous underperformance.
The recent rebound has brought the IWM/SPY ratio to a critical juncture, testing a resistance level near the 0.357-0.358 area. This zone previously acted as both support and resistance in late July and early August. For IWM to demonstrate more convincing relative strength, a sustained move above this current level would be required. Looking ahead, additional resistance is likely to be encountered near 0.360-0.362, a zone that previously served as a consolidation area in late September and early October. A more substantial challenge would present itself around 0.364-0.365, which historically functioned as both significant support in late September and subsequent resistance in mid-October. Overcoming these successive hurdles would signal a potentially more meaningful shift in IWM’s relative performance.
Considering the technical landscape, a continuation of the current rebound from the 0.3497 support level carries roughly an even chance. The ratio has demonstrated a tendency to reverse from the lower boundaries of its recent 90-day range. If the ratio fails to maintain upward momentum and hold above the 0.357-0.358 resistance, a retest of the 0.3497 support, and potentially even the 90-day low of 0.3457, becomes likely. Conversely, if the ratio successfully breaches the immediate resistance at 0.357-0.358 and subsequently clears the 0.360-0.362 zone, it is likely to test the next resistance cluster around 0.364-0.365. While such a move would imply an improving short-term outlook for IWM’s relative strength, establishing new highs above the 0.3763 peak observed in October appears unlikely in the immediate term given the recent strong bearish impulse.
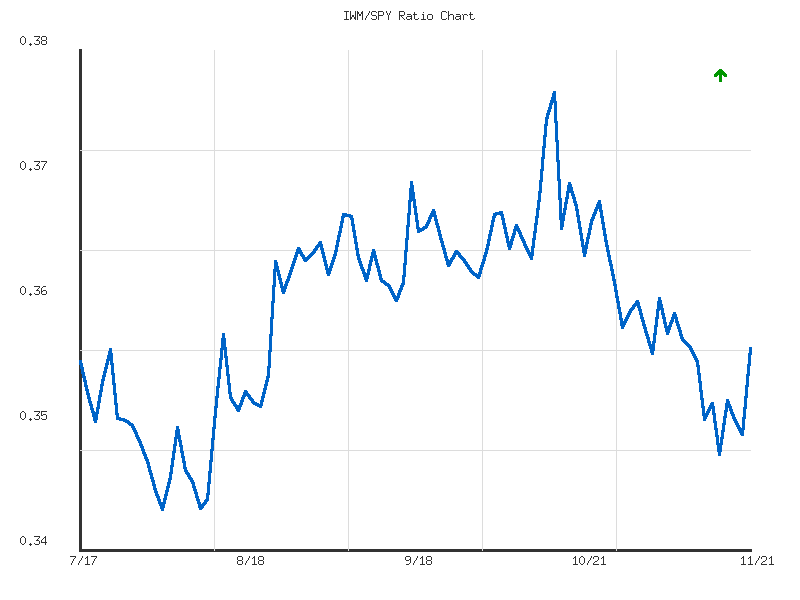
Ratio Analysis: IWM/SPY
Generated for 90days timeframe analysis
Commodities
| Symbol | Daily Percent Change |
|---|---|
| UNG | 1.5777% |
| CPER | 1.1624% |
| CORN | -0.0591% |
| GLD | -0.1867% |
| DBC | -0.6831% |
| SLV | -1.0777% |
| USO | -1.2543% |
| UGA | -1.9038% |
Analysis of the provided daily percentage change data reveals a mixed, though predominantly negative, session across the selected commodity ETFs. Leading the modest gains were UNG (Natural Gas) and CPER (Copper), posting increases of 1.58% and 1.16% respectively. This suggests specific pockets of strength. Conversely, UGA (Gasoline) was the significant laggard, declining by 1.90%, closely followed by USO (Crude Oil) with a 1.25% drop. The broad-based commodity index, DBC, also saw a notable decline of 0.68%. Precious metals, GLD (Gold) and SLV (Silver), experienced minor to moderate losses, while CORN exhibited a negligible daily change. The overall price action suggests that the underlying momentum for the majority of these commodities, particularly in the energy complex and broader indices, was to the downside for the session.
Focusing on directional momentum, the positive closes for UNG and CPER indicate that buying interest probably exceeded selling pressure in those specific markets, at least for this particular session. Their ability to close higher suggests a degree of relative strength compared to the overall commodity complex. In contrast, the substantial declines in UGA and USO, and the broader DBC, imply that selling pressure was likely dominant. The negative closes across multiple significant commodity components suggest a prevailing bearish momentum across a substantial portion of the commodity spectrum, with only select areas showing resilience.
Given only a single day’s percentage change data, identifying traditional support and resistance zones with high confidence is infeasible. However, the previous day’s closing price for each asset now serves as the immediate reference point. For UNG and CPER, sustaining trade above their prior closing prices would constitute an initial indication of support forming around those levels, signaling that buyers are willing to step in. Conversely, for assets like UGA and USO, the previous day’s close now functions as an immediate resistance level; reclaiming and holding above these levels would be necessary to negate the day’s bearish sentiment. Failure to do so would likely reinforce the perceived resistance at those prior closing values.
Considering alternative scenarios, a bullish case would likely involve UNG and CPER extending their gains in subsequent sessions, indicating a strengthening trend in natural gas and copper, possibly drawing broader market attention. For the decliners, a swift reversal, where UGA, USO, and DBC recover their losses and close above their previous day’s close, would suggest that the recent selling was transient, perhaps representing a “shakeout” before a resumption of an underlying bullish trend, though this is less likely given the current data. A sustained move above their prior day’s close would probably confirm a shift in short-term sentiment.
Conversely, a bearish case is perhaps more likely for the majority of these assets. This scenario would involve continued weakness in UGA, USO, DBC, GLD, and SLV, with prices failing to hold current levels or break above their immediate resistance (prior day’s close). A breakdown in UNG and CPER from their current positive momentum, reverting to negative performance, would further consolidate the bearish outlook across the entire commodity complex, signaling widespread selling pressure. Such a development would probably lead to a test of lower price levels.
Regarding potential sentiment drivers strictly based on this technical data, the pronounced divergence in performance could shape trader perceptions. The relative strength demonstrated by UNG and CPER might attract momentum traders, possibly leading to a self-reinforcing bullish sentiment in these specific assets. Conversely, the broad weakness, particularly in the energy complex, could foster increased bearish sentiment for those components, potentially encouraging further shorting or profit-taking in the near term. The lack of significant upside in precious metals suggests that current market dynamics are not strongly driving safe-haven demand, which could also influence broader risk sentiment.
Here is a technical analysis of the provided market data, adhering strictly to CMT principles and ICD-203 estimative language guidelines.
Precious Metals: GLD & SLV Dynamics Precious metals exhibited a pronounced two-phase pattern over the 14-day observation period. Both GLD and SLV experienced substantial rallies from November 4th to November 12th, with GLD rising from approximately to and SLV from .76 to .345. These upward movements were accompanied by significant increases in trading volume, peaking on November 12th, which typically indicates strong conviction from buyers. However, a sharp reversal then transpired. On November 13th, both ETFs formed large bearish candles on very high volume, suggesting widespread profit-taking or an exhaustion of buying momentum. GLD subsequently consolidated, establishing temporary support around -, with recent trading showing indecision. It is roughly even chance GLD will hold this support in the immediate term; a sustained break below this level would likely signal further decline towards the initial breakout levels. SLV’s correction was more severe, failing to establish clear support and instead continuing to trend lower. The sustained high volume during its decline and the close near its 14-day low on November 21st make it very likely that SLV will continue to test lower price levels, potentially targeting the low 40s.
Agricultural and Industrial Metals: CORN & CPER CORN’s price action over the 14-day period was largely characterized by a narrow trading range, oscillating between approximately .50 and .30. A notable bullish breakout attempt on November 13th, reaching .267 on high volume, proved ephemeral, as the subsequent day saw a complete reversal with a strong bearish candle, implying a failed breakout. The price has since resumed a gradual decline, closing near the lower extreme of its range on November 21st. It is likely that CORN will continue to face downward pressure within its established range, with a potential test of the .50 support level. CPER initially demonstrated a shallow uptrend, reaching a high of .87 by November 12th. However, it encountered resistance near the .90 mark and experienced a bearish reversal on November 13th, signaled by a strong bearish candle on moderate volume. Following this, CPER traded in a tighter range, showing stabilization attempts near .70. The final day’s bullish candle, occurring near a potential support area, suggests a roughly even chance for CPER to stabilize or attempt a minor rebound, though the overall upward momentum from early in the period appears to be waning.
Energy Sector: USO, UGA, DBC, and UNG Divergence The energy complex presented a predominantly bearish picture for most assets examined, with UNG being a notable exception. USO, the oil ETF, established a clear downtrend after peaking on November 11th. A sharp decline initiated on November 12th, marked by elevated selling volume, persisted through the period, with USO closing at its 14-day low of .28 on November 21st on the highest volume observed. This suggests strong bearish conviction, making it very likely USO will continue its downward trajectory. UGA, the gasoline ETF, followed a similar downtrend after an initial modest rally, consistently forming lower highs and lower lows to close at its period low of .18. It is likely to continue declining in the near term. DBC, the diversified commodities index, also showed weakness, particularly in the latter half of the period, closing at its lowest point of .535 after two consecutive bearish candles with increased volume, suggesting it is likely to experience further downside. Conversely, UNG (Natural Gas) displayed significant bullish strength, maintaining an upward trend from .92 to .81 by November 13th. Despite short-term pullbacks, UNG found consistent buying interest, culminating in a strong rebound and close near its recent highs on November 21st. Based on robust price action characterized by higher highs and higher lows, coupled with sustained high volume, it is very likely that UNG will continue its upward trend, demonstrating a clear divergence from its energy peers and the broader commodity complex observed.
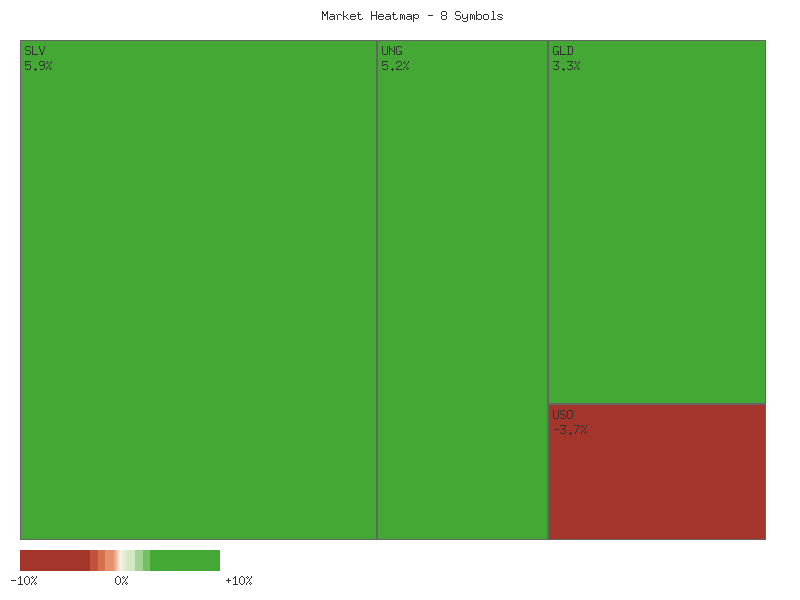
Performance Heatmap (SLV, GLD, CORN, CPER, USO, DBC, UGA, UNG)
Generated for 14days timeframe analysis
Technical Analysis: SLV (90-Day Outlook)
SLV’s price action over the last 90 days exhibits distinct phases, beginning with a period of consolidation and a minor dip in late July and early August, followed by a robust and sustained uptrend. From late August, SLV experienced a significant rally, climbing from approximately to a peak near .40 by mid-October. This upward movement was characterized by strong bullish candles and frequently elevated trading volumes, particularly on breakout days, which is a strong indication of significant buying interest and accumulation during the primary trend. However, this strong advance culminated in a sharp correction that began in mid-October, testing the sustainability of the preceding rally.
The correction phase in late October saw SLV decline sharply from its peak, demonstrating increased selling pressure, often accompanied by higher-than-average volume, suggesting conviction behind the bearish move. Following this pullback, SLV attempted a recovery, re-establishing some upward momentum and reaching another high around .69 by mid-November. Nevertheless, the latest data points, spanning the past week, indicate a renewed decline. The recent drop from the mid-November peak has been accompanied by sustained high volumes on several down days (e.g., Nov 13, 14, 17, 19, 20, 21), which is a characteristic frequently associated with distribution and a potential shift in sentiment. The sequence of lower highs and lower lows in this most recent period suggests that bullish momentum is likely weakening.
The 14-day Relative Strength Index (RSI) largely corroborated the price movements. During the robust uptrend from late August to mid-October, the RSI consistently resided in overbought territory, frequently exceeding 70 and even touching 84.32 on October 13th. Such extended periods above 70 typically indicate that the asset is becoming overextended and a pullback is probable. The subsequent sharp decline in the RSI from its elevated levels in mid-October down to the mid-40s by late October clearly signaled the loss of bullish momentum and validated the price correction. Although the RSI managed to rebound alongside the price in early November, reaching a high of 69.08 on November 12th, it has since reversed course and is currently trending downwards, settling at approximately 52.12 as of November 21st.
Considering the recent price action and indicator readings, it is likely that SLV is currently undergoing a further period of consolidation or decline in the near term. The combination of declining prices from the mid-November peak, accompanied by notable volume on down days, and the RSI turning lower from near-overbought levels, collectively points to prevailing selling pressure. It is a roughly even chance that SLV may test support levels established during the late October / early November correction, potentially in the .50 to .50 range. An alternative scenario is that if buying interest resumes and pushes the price above the mid-November peak of .69 with strong volume, it would signal a possible resumption of the broader uptrend; however, based on the current data, this scenario appears unlikely in the immediate future.
SLV Price & Indicators (RSI_14_DAY, MACD_13_21_DAY)
GLD Technical Analysis: Post-Correction Consolidation and Neutral Momentum
GLD experienced a significant and robust uptrend spanning from late August through mid-October 2025, reaching an apparent peak around 403.15. This period was characterized by strong price appreciation and notable increases in trading volume. Following this peak, GLD underwent a sharp and rapid correction in late October, retracing a substantial portion of its previous gains. Currently, the price action suggests GLD is in a consolidation phase or attempting a nascent recovery. It is important to note that a detailed MACD analysis is omitted from this commentary due to the absence of specific numerical data points for the indicator in the provided market information.
During the vigorous uptrend from late August to mid-October, the 14-day Relative Strength Index (RSI) consistently registered in overbought territory, frequently exceeding the 70 threshold. The RSI touched highs such as 73.72 on September 2nd, and a notable peak of 87.33 on October 20th, coinciding with the price peak. While an overbought RSI reading often signals a potential reversal, the sustained nature of these high RSI values throughout this period strongly underscored the exceptional strength and bullish momentum driving GLD’s price, rather than indicating an immediate bearish turn until the trend decisively changed.
The sharp correction initiated on October 21st saw GLD’s price decline considerably. Concurrently, the 14-day RSI plummeted from its overbought extreme of 87.33 to 48.46 by October 29th. This rapid and decisive shift in momentum, indicated by the steep fall in RSI, suggests a significant loss of bullish conviction among market participants. Although the RSI did not descend into deeply oversold territory (below 30), its swift retreat from extreme overbought levels provides a compelling technical signal that the strong upward momentum had dissipated. Since this correction, GLD has largely traded within a range, with the RSI oscillating around the neutral 50-60 level, indicative of a market lacking a clear directional bias. A brief surge in RSI to 64.56 on November 12th corresponded with a modest price recovery, but this upward momentum proved temporary, with the RSI currently at 52.82.
The present technical posture, derived from GLD’s price action and the 14-day RSI, suggests a roughly even chance for either a renewed upward move or continued consolidation/downside pressure in the immediate future. The RSI’s current neutral position provides little conclusive evidence for strong directional impetus. Should GLD’s price experience a sustained breakout above its recent minor resistance levels (e.g., the November 12th high of 386.06), coupled with the RSI consistently moving above the 60-65 range, it would likely indicate that the recovery attempt is gaining traction. Conversely, a consistent decline in the RSI below the 45 level, particularly if accompanied by a breach of recent price lows (around 360-362), would suggest that the bearish momentum observed during the late October correction is reasserting itself. The substantial trading volume observed during the peak and initial decline phases of late October is noteworthy, implying significant activity, potentially distribution, which reinforces the significance of that price high. Traders are likely observing for a decisive breakout from the current consolidation range, confirmed by a directional shift in momentum as indicated by the RSI.
GLD Price & Indicators (RSI_14_DAY, MACD_13_21_DAY)
Gold/Silver Ratio
The GLD/SLV ratio over the past 28 days reveals a significant rally from approximately 8.01 on October 15th to a peak of 8.65 by October 27th, indicating a period of strong GLD outperformance. This was followed by a sharp reversal, driving the ratio down to a low of 7.98 on November 12th, suggesting SLV gained relative strength. Currently, the ratio shows a weak rebound to 8.26. The provided trend analysis confirms an “up” direction but highlights “weak” strength. The current ratio remains below its 28-day average of 8.326 and is positioned closer to its low for the period, reinforcing the tentative nature of this upward movement.
Key technical levels are apparent. The 7.98 low (November 12th) serves as a primary support, reinforced by an earlier low near 8.01. Intermediate support appears around 8.12-8.17. On the resistance side, the 28-day high of 8.65 (October 27th) is a significant ceiling, with a cluster around 8.50-8.59 from late October. The 28-day average ratio of 8.326 is likely to act as immediate overhead resistance.
A bullish scenario would likely unfold if the ratio can decisively break above the 28-day average of 8.326. Such a move would probably signal renewed GLD outperformance, potentially targeting the 8.40-8.47 resistance range and then higher towards 8.50-8.60. Conversely, a bearish outcome is plausible if the ratio fails to overcome the 8.326 resistance. A subsequent decline breaking below the intermediate support of 8.12-8.17 would likely lead to a retest of the primary support at 7.98. A breach of 7.98 would be a significant bearish signal, indicating further relative underperformance of GLD.
A neutral case presents a roughly even chance, suggesting the ratio could consolidate between the intermediate support around 8.12-8.17 and the immediate resistance near 8.326. Such sideways movement would reflect ongoing market indecision about the relative strength of GLD and SLV, potentially indicating a search for a new equilibrium after recent volatility. The moderate volatility observed during this period supports the potential for such ranging behavior in the near term.
The technical price action suggests a market grappling with shifting sentiment. An initial strong preference for GLD was abruptly replaced by strong interest in SLV. The current weak rebound indicates tentative buying interest, but without strong conviction. This fluctuating sentiment points to uncertainty regarding the future relative valuation of these precious metals, with the market currently assessing whether the rebound from the 7.98 low can gather sufficient strength to reverse the prior downtrend or if consolidation will persist.
As a Chartered Market Technician with over 15 years of experience, I offer the following technical analysis of the GLD/SLV ratio over the past 90 days, based strictly on the provided market data.
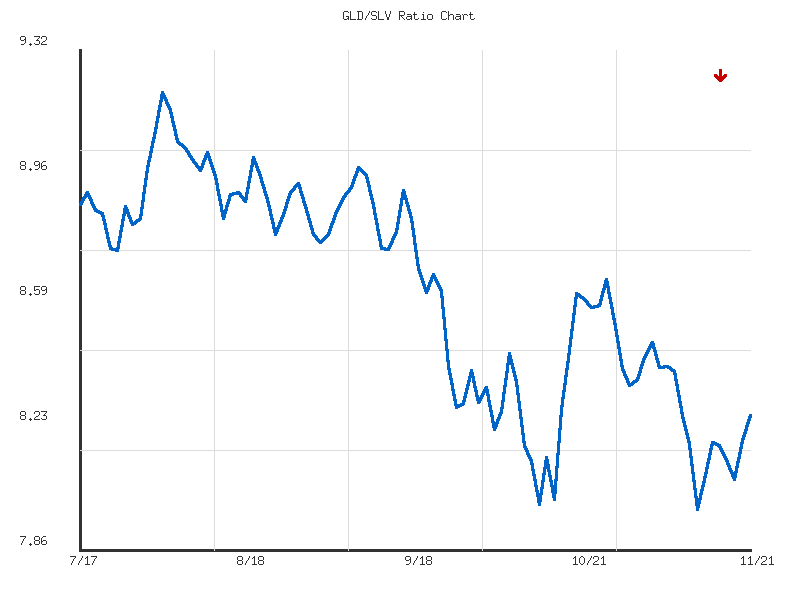
The GLD/SLV ratio has exhibited a clear and sustained downward trend over the 90-day period, as indicated by the “down” direction and “moderate” strength reported in the trend summary. Commencing near 8.877 on July 17th, the ratio reached its peak at 9.202 on August 1st before initiating a consistent decline. This overall downtrend is further underscored by a total change of -6.94% from the period’s start to its conclusion on November 21st. The 90-day average ratio stands at 8.6214, which is notably above the current ratio of 8.2609, reinforcing the prevailing bearish pressure favoring SLV’s performance relative to GLD. This persistent decline suggests that silver, as represented by SLV, has generally outperformed gold (GLD) over this analytical horizon.
Following its August peak, the ratio consistently posted lower highs and lower lows, a classic technical characteristic of a downtrend. This pattern persisted until November 12th, when the ratio established a significant 90-day low at 7.9855. This trough represents a critical support level established by the market over this specific period. The moderate volatility of 0.1028 suggests that while the trend was pronounced, price movements were not excessively erratic, thereby providing a relatively clear technical picture. The ratio’s current position at 8.2609 places it in the lower 22.63% of its 90-day range, closer to the established low than to the high, which may suggest that prior downside momentum could be nearing exhaustion or is temporarily paused.
In the most recent trading days, specifically from November 12th to November 21st, the GLD/SLV ratio has shown a short-term upward bounce, recovering from its 90-day low of 7.9855 to 8.2609. This move represents a counter-trend rally within the broader downtrend. Given the established strength of the preceding decline, a sustained reversal to an uptrend is unlikely without further compelling technical evidence, such as a breakout above significant resistance levels and a shift in the pattern of lower highs. It is more likely that this recent bounce represents either a temporary price correction within the existing downtrend or a period of consolidation. Traders should monitor whether the ratio can sustain momentum or if it will encounter resistance and resume its previous trajectory.
Key resistance levels for this ratio are anticipated around the clustered values from late October and early November, specifically between 8.35 and 8.47. A more substantial resistance area would be the 90-day average of 8.6214, which, if tested and held, would likely confirm the continuation of the downtrend. Conversely, the 90-day low of 7.9855 remains the primary support level. A breach below this level would likely signal a resumption of aggressive selling pressure and potentially usher in new lows. Currently, there is a roughly even chance that the current upward momentum will fade, leading to a retest of the 7.9855 support level, especially if the ratio fails to break above the immediate resistance cluster. The sustained observation of lower highs, despite the recent bounce, indicates that the path of least resistance probably remains to the downside.
Ratio Analysis: GLD/SLV
Generated for 90days timeframe analysis
Bonds
| Symbol | Daily Percent Change |
|---|---|
| IEF | 0.304% |
| TLT | 0.291% |
| UTHY | 0.275% |
| IEI | 0.209% |
| SHY | 0.102% |
The technical data for these bond-focused instruments over the last 14 trading days presents a nuanced picture of oscillating momentum, with distinct patterns emerging across different durations. The latest daily percentage changes, as summarized in the matrix above, show all instruments closing positively on November 21st, 2025, albeit with relatively modest gains. This marks a short-term shift from periods of more pronounced negative movements earlier in the observed timeframe. Longer-duration instruments (TLT, UTHY) consistently exhibit higher volatility, with larger percentage swings both to the upside and downside compared to their intermediate (IEF, IEI) and short-duration (SHY) counterparts.
Analyzing the directional bias and momentum, TLT and UTHY experienced significant pullbacks in the range of -1.1% to -0.8% on several days, notably around November 5th, 13th, and 14th. However, these sharp declines were often followed by robust positive corrections, indicating underlying buying interest at these lower implied volatility levels. Towards the end of the 14-day period, both instruments posted consecutive positive changes, suggesting a potential short-term bullish momentum shift. IEF and IEI displayed a more contained range of movement, with IEF showing slightly more pronounced positive reversals. SHY, representing short-duration bonds, consistently demonstrated the lowest volatility, with daily changes rarely exceeding +/-0.15%, indicating remarkable stability and less sensitivity to the drivers affecting longer-duration assets.
Given the absence of absolute price data, defining traditional support and resistance levels is not feasible. However, we can infer volatility thresholds or reversal zones based on the daily percentage changes. For TLT and UTHY, declines of approximately -0.8% to -1.1% often appear to act as short-term demand zones, as buying interest tends to emerge at these magnitudes, leading to subsequent positive daily changes. Conversely, positive daily movements exceeding +0.9% for TLT and +0.8% for UTHY have occasionally preceded days of consolidation or reversal, suggesting these might be areas where upside momentum meets selling pressure. IEF shows implied resistance around +0.5% and implied support around -0.48%. For IEI and SHY, their tighter ranges suggest strong price stability, with reversals typically occurring after minimal percentage shifts, reflecting their lower risk profile and limited volatility. The sustained positive closes across all instruments on November 20th and 21st suggest a recent short-term accumulation or consolidation above prior downturns.
Considering future price action, a bullish case might unfold if the momentum from the last two positive trading days continues. It is likely that this recent demand, especially in the longer-duration bonds, could propel prices moderately higher in the immediate near-term, potentially testing the implied resistance volatility thresholds. A bearish case suggests that the overall volatility observed, particularly the sharp downturns, indicates that underlying selling pressure could resurface. It is likely that any attempt to sustain significant gains might be met with renewed supply, leading to a consolidation or reversal, especially if the previous “resistance” volatility thresholds are approached. A neutral case is roughly even chance for the intermediate and short-duration instruments (IEF, IEI, SHY), which have consistently exhibited range-bound characteristics throughout the period. Sentiment, inferred from these technical patterns, appears to be characterized by periods of cautious risk-on (bond selling, especially longer duration) followed by risk-off flows (bond buying, especially longer duration), leading to a choppy, undecided market. The consecutive positive closes could indicate a temporary abatement of “risk-on” sentiment, or simply a technical rebound after prior declines.
Market Commentary: Bond ETF Technical Outlook (November 4 - November 21, 2025)
The technical landscape for the observed bond ETFs over the past fourteen trading days exhibits a nuanced picture, characterized by initial broad weakness followed by varied recovery and distinct performance across the duration spectrum. While all five instruments—TLT, UTHY, IEF, IEI, and SHY—experienced a general price dip around November 5th and again around November 14th, the subsequent rallies have diverged. Shorter and intermediate-duration instruments (SHY, IEI, IEF) have demonstrated stronger conviction and bullish breakouts towards the end of the period, whereas longer-duration (TLT) and ultra-short (UTHY) ETFs have shown more volatility and less decisive upward momentum on a net basis. The increasing volume observed during significant price movements, particularly during the recent rallies, suggests underlying market conviction or strong reactions to price levels.
Focusing on the long-duration segment, TLT, the iShares 20+ Year Treasury Bond ETF, exhibited a volatile, largely range-bound pattern, ultimately closing net lower than its initial point. After finding temporary resistance near 90.11 on November 12th, the instrument faced significant selling pressure, leading to a retest of the 88.87-88.94 support zone on November 14th and 19th. While the final two trading days show a recovery from these lows, closing at 89.50, TLT has not decisively overcome its earlier resistance levels. This indicates that price action is likely to remain choppy, with a roughly even chance of retesting the 88.80-88.90 support zone or attempting to challenge resistance around 90.00-90.10 in the immediate term. Sustained trading above the 90.00 psychological level would be required to suggest a more robust upward trend is developing.
Intermediate-duration Treasury ETFs, specifically IEF (7-10 Year) and IEI (3-7 Year), present a more unequivocally bullish technical posture. Both ETFs followed the broader market dip-and-recovery pattern but managed to stage significant rallies during the final week of observations. IEF recorded a strong close at 97.18, breaking above its prior resistance at approximately 96.90 with notable volume on November 21st. Similarly, IEI closed at 120.075, effectively surpassing its mid-period high and establishing new resistance-turned-support levels. Given the strong closes and accompanying volume on their upward moves, it is highly likely that IEF and IEI will experience continued upward momentum in the near term, with previous resistance levels now acting as strong support.
The shortest-duration ETFs, SHY (1-3 Year) and UTHY (ultra-short), offer a mixed but generally supportive outlook. SHY demonstrated the most consistent upward trajectory throughout the period, exhibiting minimal volatility relative to its longer-duration counterparts. Its strong close at 83.02, breaking above previous resistance levels around 82.90 on increasing volume, suggests robust demand. It is highly likely that SHY will continue to consolidate or extend its gains above the 83.00 mark. UTHY, while mirroring TLT’s broader swings, also found solid support around 42.01, though its closing price of 42.26 indicates it has not fully recovered to its initial levels or demonstrated the breakout strength of SHY, IEI, or IEF. A retest of the 42.01 support cannot be ruled out for UTHY, though the overall upward bias in the short-duration space makes further upside momentum also likely.
In summary, the technical data suggests a bifurcated market within the bond ETF landscape. Shorter to intermediate-duration Treasury ETFs (SHY, IEI, IEF) are exhibiting clear bullish momentum, confirmed by decisive breakouts above resistance and supportive volume, making continued strength highly likely for these instruments. Conversely, the long-duration TLT and ultra-short UTHY have displayed greater price volatility and a less clear directional bias over the 14-day period, ending either net flat or slightly down, and are likely to continue trading within established ranges. While the overall bond market appears to have found a floor and is attempting to move higher, the leadership is distinctly emerging from the shorter end of the duration curve, suggesting a differential performance across bond maturities in the immediate future.
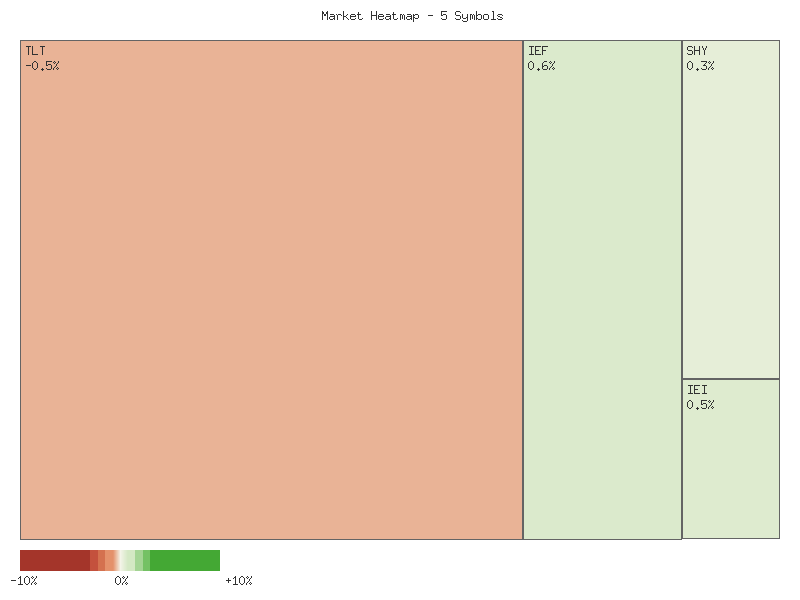
Performance Heatmap (TLT, UTHY, IEF, IEI, SHY)
Generated for 14days timeframe analysis
Magnificent 7 & Friends
We assess the collective price action over the past 14 days for these selected technology stocks indicates a predominant bearish trend for a majority of the constituents. Most symbols (TSLA, AMZN, MSFT, NVDA, ANET, AVGO, META, CRWV) exhibit a clear prevalence of negative daily percentage changes, suggesting sustained selling pressure. The momentum appears largely downward, with notable exceptions like GOOGL showing intermittent strong positive reversals. CRWV and ANET display particularly strong bearish momentum, marked by multiple instances of significant double-digit percentage declines, which likely reflects significant investor apprehension.
Given the data exclusively in daily percentage changes, traditional price-based support and resistance levels cannot be precisely identified. However, we can infer zones of momentum exhaustion. For tickers like CRWV and ANET, downward momentum appears to find temporary exhaustion (acting as a “percentage-change support”) in the range of -7% to -8% on specific days, leading to subsequent, albeit often short-lived, positive rebounds. Conversely, positive momentum for many of these stocks appears to face resistance when daily gains approach or exceed +2% to +4%, as evidenced by subsequent immediate pullbacks for TSLA and NVDA after their stronger positive days. This suggests a deficiency of sustained buying interest at those levels.
Looking ahead, we assess it is likely that the prevailing bearish momentum will continue for CRWV, ANET, AMZN, and MSFT, given their consistent negative performance and significant daily declines; these stocks probably face further downside pressure. GOOGL and, to a lesser extent, AAPL, present a roughly even chance of a bullish reversal or continued sideways consolidation within their recent range of volatility. GOOGL’s recent strong positive days, interspersed with negatives, could indicate accumulation attempts, while AAPL shows mixed signals. For TSLA, NVDA, AVGO, and META, the pattern suggests a roughly even chance of continued high volatility and choppy price action, with both strong declines and occasional rebounds.
The widespread daily declines, especially pronounced in CRWV and ANET, indicate strong negative technical sentiment across much of this group. The inability of most stocks to sustain rallies above modest percentage gains suggests a lack of conviction among buyers and a tendency for profit-taking or shorting at the first sign of strength. The vigorous positive days observed in GOOGL and NVDA, though not sustained, hint at pockets of opportunistic buying or short covering, which could act as a sentiment floor for brief periods. Overall, the pattern implies that fear of further declines likely outweighs bullish optimism for the majority of these assets in the immediate future, with traders probably quick to sell into any strength.
Here is a technical analysis of the provided market data for the specified equities over the 14-day period.
The aggregate technical landscape for the majority of the analyzed equities indicates a pervasive bearish sentiment during the observed 14-day period. Stocks such as Amazon (AMZN), CrowdStrike (CRWV), NVIDIA (NVDA), Arista Networks (ANET), Tesla (TSLA), Microsoft (MSFT), and Meta Platforms (META) have predominantly exhibited characteristics of established downtrends. These patterns include the formation of successive lower highs and lower lows, which is a classic indicator of bearish price action. Volume analysis further supports this observation; notably, larger downside price movements across these symbols were frequently accompanied by elevated trading volumes, suggesting strong conviction behind the selling pressure. For instance, NVDA demonstrated significant downward momentum, culminating in a large red candle on 2025-11-20 with exceptionally high volume, followed by another high-volume down day, indicating robust supply. Similarly, CRWV experienced steep declines with marked increases in volume during major down days, solidifying its bearish trajectory. It is highly likely that this prevailing bearish trend will persist for these particular equities in the immediate near-term, as there are limited technical reversal signals of significant magnitude.
Apple (AAPL) and Broadcom (AVGO) present a more nuanced, yet still predominantly bearish, picture. AAPL has largely been range-bound during the period, oscillating within a defined horizontal channel, although with a slight downward bias. Despite some sessions showing demand, such as the moderate green candle on 2025-11-21 accompanied by elevated volume, these appear to be corrections within a broader sideways movement rather than definitive trend reversals. A sustained breakout above the upper boundary of this range on significantly increased volume would be necessary to alter this outlook. AVGO, on the other hand, made a noticeable attempt at a bullish reversal on 2025-11-19 with a strong green candle on elevated volume. However, this attempt was immediately negated by subsequent large red candles on increasing volume, effectively reinforcing the bearish pressure and suggesting that supply at higher price levels remains dominant. Consequently, there is a roughly even chance that AAPL will continue its consolidation, with a slightly higher probability of a downward resolution given the broader market weakness observed. For AVGO, a continuation of its downtrend is likely, as reversal attempts have been met with swift selling.
In contrast to the general market weakness, Alphabet (GOOGL) has displayed relative strength, particularly in the latter half of the 14-day period. After an initial dip, GOOGL exhibited several strong green candles, notably on 2025-11-10, 2025-11-17, 2025-11-19, and 2025-11-21, all of which were supported by increasing and, at times, significantly high trading volumes. The price action on 2025-11-19 and 2025-11-21, breaking above recent resistance levels on exceptionally high volume, suggests a potential shift in momentum favoring the bulls. This relative outperformance indicates underlying demand. It is likely that GOOGL could test higher resistance levels if this momentum is sustained. However, given the broader bearish sentiment among its peers, there remains a roughly even chance that it could experience a retest of its recent support levels if the overall market pressure intensifies, despite its individual strength.
Considering the data provided, the prevailing technical posture for the majority of these major equities is bearish. The persistent formation of lower highs and lower lows, coupled with elevated volume on downside moves, strongly suggests that sellers retain control. While individual stocks like GOOGL demonstrate notable relative strength, the widespread nature of the downtrends among other significant components indicates that caution is warranted. Any short-term bullish reactions in the weaker names are likely to be corrective bounces within larger downtrends rather than genuine reversals. It is improbable that a broad bullish shift will occur without more definitive and sustained technical reversal patterns emerging across multiple symbols, supported by a significant shift in trading volume dynamics.
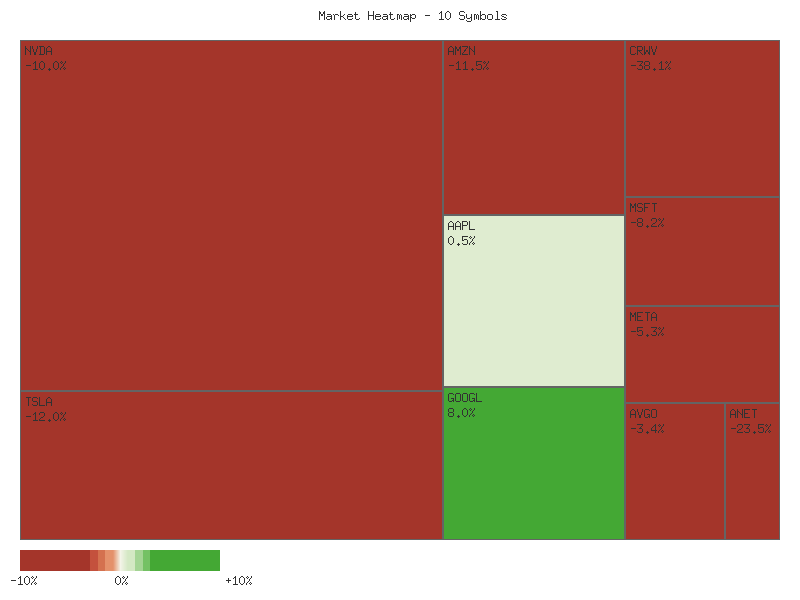
Performance Heatmap (TSLA, MSFT, AAPL, META, NVDA, AVGO, GOOGL, AMZN, CRWV, ANET)
Generated for 14days timeframe analysis
S&P 500 Sector Breadth
The latest available daily price action (2025-11-21) indicates a broadly advancing market across the S&P 500 sectors provided. All eleven symbols registered positive daily percentage changes, suggesting a highly positive market breadth for the session. This uniform ascent across all analyzed sectors is a notable technical event. The leading performers were XLB (Materials) with a 2.273% gain, followed closely by XLV (Health Care) at 2.167%, and XLY (Consumer Discretionary) with a 1.999% advance. Even the lowest performer, XLU (Utilities), still managed a positive change of 0.114%.
Analysis of the 14-day data for these sectors reveals a period of significant daily volatility rather than a clear, sustained directional trend for most symbols. Many sectors experienced considerable swings, with notable declines often succeeded or preceded by strong advances. For instance, XLK (Technology) displayed multiple daily drops exceeding -1.5% and a -3.128% decline, alongside a +2.578% day. Similarly, XLY (Consumer Discretionary) exhibited declines of -2.316% and -2.455%, but also advanced by +1.999% on the latest day. This pattern of pronounced daily oscillations suggests a market that has been largely lacking in consistent momentum over the two-week period, with buyers and sellers frequently contesting control. Therefore, while the latest session shows broad strength, the preceding period makes it difficult to characterize a definitive sustained trend beyond short-term movements.
On the latest day, offensive sectors appear to be driving a significant portion of the market’s upward momentum. Seven out of the eleven sectors analyzed are classified as offensive (XLK, XLY, XLF, XLI, XLB, XLE, XLC), and all of them advanced. Notably, XLB (Materials) and XLY (Consumer Discretionary) were among the top performers, signaling a likely resurgence in risk appetite. All four defensive sectors (XLU, XLP, XLV, XLRE) also posted gains, with XLV (Health Care) showing particularly strong performance. This widespread participation, especially with strong showings from offensive sectors, suggests an overall market sentiment that is likely “risk-on.” The current data points to a probable, though not yet confirmed, rotation into offensive areas given their broad participation in the latest market rally. However, the concurrent robust performance across both offensive and defensive sectors implies broad-based buying interest, making a clear and exclusive rotation away from defensives improbable at this juncture. Instead, it suggests a general uplift in sentiment.
| Symbol | Daily Percent Change |
|---|---|
| XLB | 2.273% |
| XLV | 2.167% |
| XLY | 1.999% |
| XLC | 1.709% |
| XLRE | 1.338% |
| XLI | 1.245% |
| XLP | 1.103% |
| XLF | 1.095% |
| XLE | 0.642% |
| XLK | 0.389% |
| XLU | 0.114% |
Here is a technical analysis of the provided market data:
The provided 14-day market data, spanning November 4th to November 21st, 2025, reveals a clear divergence in performance across various S&P 500 sectors. This fragmentation suggests a market environment where broad, unified trends are less prevalent, requiring a highly selective approach from retail traders. Volume analysis supports this view, with heightened participation observed during significant price swings in individual sectors, both on the upside for advancing sectors and on the downside for declining ones. Technical patterns indicate a sector-driven market rather than a broad market move. The immediate outlook suggests that sector-specific strategies are likely to yield more consistent results, as the overall market lacks strong directional conviction.
Within this period, Health Care (XLV) and Consumer Staples (XLP) exhibit robust bullish technical patterns, suggesting they are likely candidates for continued upward momentum. XLV maintained a consistent uptrend, consistently forming higher highs and higher lows, culminating in a significant breakout to new 14-day highs on November 21st, confirmed by exceptionally high volume. A continuation of this uptrend is highly likely. XLP, following a period of consolidation, also delivered a powerful bullish engulfing-like candle on November 21st, on very high volume, breaking above prior resistance. Further upside for XLP is likely in the immediate term. Materials (XLB) and Energy (XLE) likewise showed positive net performance and strong bullish reversals on November 21st on elevated volume, suggesting recent pullbacks were likely corrective, making a test of their respective overhead resistance levels likely.
Conversely, Technology (XLK) and Consumer Discretionary (XLY) have faced pronounced and sustained bearish pressure. XLK displayed a clear downtrend with consistent lower highs and lower lows, punctuated by a massive bearish candle on November 20th. Despite a minor bounce on November 21st, the overwhelming selling pressure and breakdown of previous support levels suggest further downside is likely for XLK. XLY similarly exhibited a consistent downtrend with increasing volume on declines. While the November 21st candle for XLY formed a hammer-like pattern, suggesting a potential short-term bounce from oversold conditions, the dominant downtrend and breakdown of key support levels indicate a continuation of bearish price action remains likely, with any rebound likely facing strong resistance. Financials (XLF) also shifted from a mild uptrend to a sharp decline on very high volume, pointing to a likely continuation of selling pressure.
Real Estate (XLRE), Utilities (XLU), and Communication Services (XLC) present a more mixed or consolidating technical picture, indicating a roughly even chance of continued range-bound trading or marginal directional shifts. XLRE traded largely sideways, with its November 21st bullish candle remaining within a defined range, suggesting a roughly even chance of continued range-bound trading. XLU experienced a mild downtrend but found support near its 14-day lows without a definitive bullish reversal, suggesting consolidation or a slight downward bias is likely. XLC, after an initial uptrend, turned lower, testing support before a modest rebound. With its price currently testing prior support as resistance, a roughly even chance exists for continued consolidation or a retest of its recent lows.
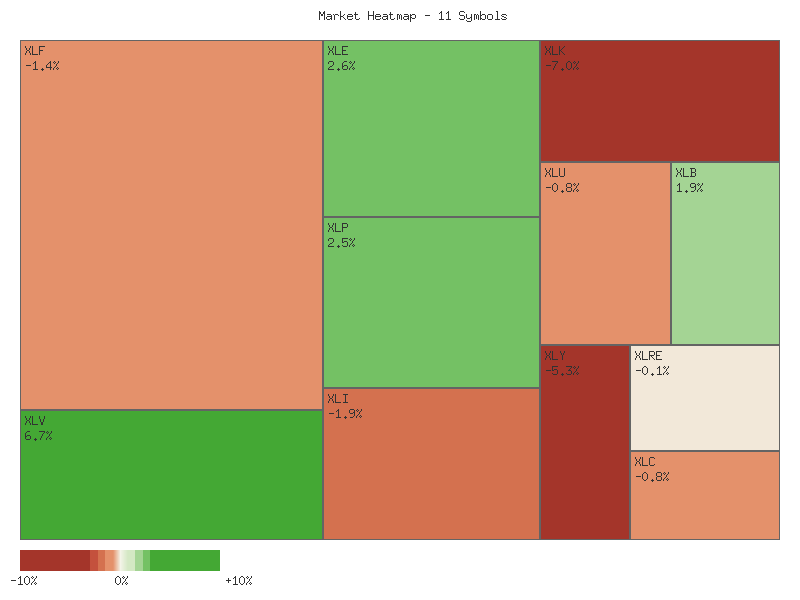
Performance Heatmap (XLP, XLRE, XLI, XLU, XLV, XLY, XLF, XLB, XLE, XLC, XLK)
Generated for 14days timeframe analysis
XLY vs XLP
The XLY/XLP ratio, tracking the relative performance of Consumer Discretionary against Consumer Staples, has exhibited a moderate downward trend over the past 14 days, with a cumulative decline of approximately 7.6%. This movement suggests a shift in market preference away from discretionary spending and towards more defensive, essential goods and services. Initially, the ratio showed an upward thrust from 3.1334 on November 4th to a peak of 3.1742 on November 5th. This brief surge indicates that at the outset of this period, there was an inclination towards growth sectors. However, this bullish momentum proved transient, with the ratio failing to sustain these higher levels.
Following the peak on November 5th, the ratio commenced a persistent decline, consistently forming lower highs and lower lows through much of the analysis period. The ratio encountered significant downward pressure, particularly from the 3.11-3.07 range, which appeared to act as resistance as the trend established itself. The ratio notably broke below the 3.00 mark on November 13th, falling to 3.0004, and continued its descent to a 14-day low of 2.8690 on November 20th. This sustained weakness in the XLY/XLP ratio likely signifies an increasing risk-off sentiment within the market, as investors pivot from cyclical sectors towards more stable alternatives. The consistent erosion of value confirms the moderate strength of the downtrend.
The most recent trading session shows the ratio closing at 2.8945 on November 21st, reflecting a slight bounce from the preceding day’s low. While this uptick interrupts the immediate downtrend, it is unlikely to signal a definitive reversal at this juncture, given the established moderate downward trajectory and the ratio’s current position near the lower end of its 14-day range (relative position: 0.0833). The market’s volatility over this period, at 0.00919, indicates consistent but not extreme daily fluctuations within the broader downtrend. A continuation of the current downward pressure on the ratio remains likely in the immediate term, potentially testing new lows if the prevailing risk-off sentiment persists.
However, an alternative scenario presents a roughly even chance for a period of short-term consolidation or a minor technical rebound should the recent low at 2.8690 prove to be a temporary support level. Such a rebound would probably be corrective in nature, rather than indicative of a fundamental shift back to sustained outperformance by Consumer Discretionary. Without further data to confirm a reversal in the series of lower highs and lower lows, the technical evidence points to continued underperformance of XLY relative to XLP, suggesting that caution in risk-oriented sectors remains warranted.
XLY/XLP Ratio Analysis: Moderate Uptrend Challenged by Recent Sharp Reversal
The XLY/XLP ratio, which measures the relative performance of the Consumer Discretionary sector against the Consumer Staples sector, has demonstrated a moderate upward trend over the provided 90-day period from mid-July to mid-November. The ratio commenced near 2.715 and concluded at 2.894, reflecting an overall gain of approximately 6.61%. This general upward trajectory, reaching a 90-day peak of 3.199 on November 3rd, likely signifies a prevailing risk-on sentiment for a substantial portion of this timeframe, where investors favored growth-oriented discretionary companies over more defensive staples. The calculated volatility of 0.018 indicates a moderate degree of price fluctuation over the period, consistent with the observed range.
Following an initial consolidation phase in late July and early August, where the ratio found support around the 2.70-2.75 level, a clear upward momentum began to establish itself. A notable rally in late August propelled the ratio above the 2.90 threshold, which subsequently acted as a significant support and resistance area. After a period of consolidation below 2.93 in early September, the ratio experienced a further robust push, decisively breaching the psychological 3.00 level by mid-September. This progression, marked by a consistent pattern of higher highs and higher lows through mid-October, highly likely suggested strong underlying demand for Consumer Discretionary relative to Consumer Staples, with minor pullbacks being met with renewed buying interest.
The upward trend culminated in the ratio achieving its 90-day apex at 3.199 on November 3rd. However, this peak was immediately followed by a sharp and decisive reversal. From November 4th to November 20th, the ratio experienced a significant decline, shedding approximately 9% from its peak, establishing a new intermediate low of 2.869. This rapid depreciation, characterized by a series of lower daily closes and a break below previously established support zones such as 3.00, highly likely indicates a substantial weakening of the bullish momentum. The velocity of this decline likely points to a material shift towards a more risk-averse environment where Consumer Staples are beginning to outperform their discretionary counterparts.
As of the latest data point on November 21st, the ratio has shown a modest bounce, closing at 2.894 from the new intermediate low of 2.869 established on November 20th. However, this brief recovery follows a prior failed rebound on November 19th, which led to the new low. The failure to maintain above the 2.91 level, which provided temporary support on November 18th, and the subsequent creation of a lower low at 2.869, likely suggests that bearish momentum remains dominant in the immediate term. It is likely that any attempts at a sustained rally will encounter significant overhead resistance, particularly around the 2.90-2.93 zone, which was a critical support area earlier in the period. An alternative scenario suggests that if the ratio fails to decisively clear and hold above 2.93 in the coming sessions, the path of least resistance likely remains to the downside, with a retest of the 2.869 low being probable. A sustained break below this level could extend losses, likely targeting the early August support levels in the 2.70-2.75 range.
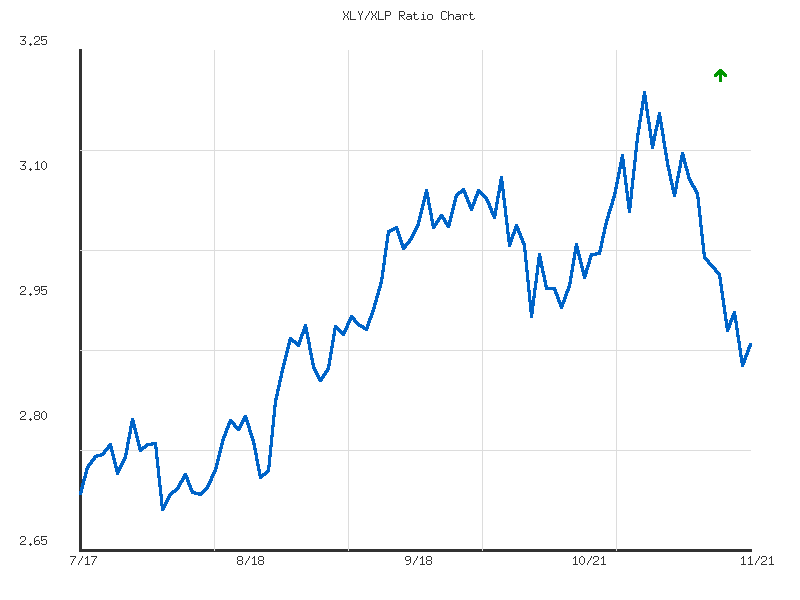
Ratio Analysis: XLY/XLP
Generated for 90days timeframe analysis
Equity Breadth
Analysis of the SPXA50R and SPXA200R data over the past 14 days reveals a narrative of initial strengthening breadth followed by a significant deterioration. From November 4th to November 12th, the percentage of S&P 500 members trading above their 50-day Moving Average (SPXA50R) ascended from approximately 38.1% to 51.4%, while those above their 200-day Moving Average (SPXA200R) climbed from about 49.9% to 56.8%. This concurrent upward movement in both indicators suggests an improving underlying market structure and a likely increase in participation across the index during this initial phase, indicating an expanding bullish sentiment.
Following this peak on November 12th, a distinct reversal in market breadth occurred, marking a shift toward weakness. SPXA50R experienced a sharp decline, plummeting from 51.4% to a trough of 29.6% by November 20th. This substantial contraction below the 30% threshold for the 50-day average is a significant technical development, suggesting a widespread short-term downtrend among S&P 500 components. Concurrently, SPXA200R also deteriorated, moving from its peak of 56.8% down to 42.6% by November 20th. While less precipitous than the 50-day breadth, this move below the 50% mark indicates that a majority of S&P 500 members were no longer maintaining their long-term bullish posture, signaling a probable weakening of the intermediate-to-long-term trend.
On the final day of the observation period, November 21st, both indicators registered a modest rebound, with SPXA50R rising to 41.2% and SPXA200R to 48.6%. This recovery could suggest a potential short-term stabilization or a bounce from oversold conditions following the previous sharp declines. However, it is unlikely to negate the clear bearish momentum that characterized the majority of the latter half of the 14-day period. The overall trend characterization for this two-week span appears to be a transition from an environment of improving internal strength to one of clear and significant breadth deterioration, indicating a likely increase in the number of S&P 500 members facing corrective pressure.
SPY 180 Days
The SPY experienced significant volatility over the 180-day period. Price action initially exhibited a sharp decline from approximately to a low of .80 in early April 2025, marked by considerable selling volume and the 14-day Relative Strength Index (RSI) falling significantly below the 30-level, indicating oversold conditions. This bearish phase was abruptly reversed, leading to a robust, sustained uptrend from April through late October. During this prolonged rally, the EMA_50 consistently remained above the EMA_200, with both moving averages demonstrating a clear upward slope, which is indicative of a well-established bullish trend. The price frequently traded above both EMAs, and the RSI often registered in overbought territory (above 70), confirming strong buying momentum.
However, the prevailing technical narrative shifted dramatically in November. After reaching a peak near .70 in late October, the SPY initiated a sharp pullback. Price action in mid-November definitively broke below both the EMA_50 (currently around .43) and the EMA_200 (currently around .23), a notable bearish development. The 14-day RSI, which was in overbought territory in late October, has since fallen to approximately 41.50, reflecting a considerable loss of upward momentum. Key support zones are identified around - (based on the mid-October low after a sharp drop) and further down at - (a previous consolidation area in early August). Overhead resistance is likely to be encountered at the EMA_50 around , followed by the historical high near .70.
A bullish scenario is plausible if SPY can quickly reverse its recent losses and reclaim the EMA_50. A sustained move back above , ideally accompanied by increased buying volume and the RSI moving convincingly above 50, would suggest renewed bullish conviction. Reasserting control above the EMA_50 could lead to a retest of the prior resistance near the - zone. However, given the current breakdown, this outcome appears less likely in the immediate future.
Conversely, a bearish scenario appears more probable in the near term. The decisive break below both the EMA_50 and EMA_200 on elevated volume is a strong signal of weakening sentiment. A failure to consolidate or rebound above the EMA_50, with continued price action below the EMA_200, would likely lead to further downside. In this event, SPY could test the - support zone, and a break below this level would likely target the Psychological level. The relatively high volume observed during recent down days, particularly on November 20th (154.77 million shares), indicates significant selling pressure, reinforcing a bearish outlook.
A neutral scenario could develop if the SPY finds temporary stability around the EMA_200 (.23) and begins to consolidate between this level and the recently broken EMA_50 (.43). Price action oscillating within this range, perhaps with the RSI meandering around the 50-mark without a clear directional bias, would suggest a period of indecision among market participants. Technically, sentiment appears cautious to bearish, particularly given the strong rejection at the previous high and the subsequent high-volume breakdown, indicating that aggressive sellers have gained control, at least in the short-to-medium term.
As a Chartered Market Technician with over 15 years of experience, this analysis of SPY utilizes the provided 14-day Relative Strength Index (RSI) and daily candle data over the past 180 days. It is important to note that while the chart description referenced MACD, the corresponding data for MACD was not provided and therefore cannot be included in this technical assessment.
Over the past 180 trading days for SPY, the technical landscape has evolved from an initial period of volatility and correction into a robust bullish trend, which has recently shown signs of significant weakening. From March through late October 2025, SPY largely demonstrated an upward trajectory, marked by ascending price action and generally strengthening Relative Strength Index (RSI) readings. However, the most recent data into November suggests a discernible shift towards increasing selling pressure. This analysis focuses exclusively on the provided 14-day RSI and daily candle patterns for SPY; MACD data, although referenced in the chart description, was not included in the market data set for examination.
The initial phase, spanning from early March to early April 2025, was characterized by a sharp corrective decline in SPY’s price, falling from approximately 575.92 to a low of 496.48. This downturn pushed the 14-day RSI into deeply oversold territory on multiple occasions, reaching as low as 21.47 on April 8th. Historically, such extreme oversold readings often precede at least temporary bounces or a reversal of short-term selling pressure. Indeed, following these RSI lows, SPY experienced a strong rebound, confirming the technical expectation of a relief rally. This recovery was underscored by periods of elevated trading volumes, indicative of significant market activity at these turning points.
Subsequent to the early spring recovery, SPY established a persistent bullish trend that extended from May through late October. During this period, the price action consistently exhibited higher highs and higher lows, underscoring strong underlying demand. The 14-day RSI predominantly remained above the 50-level, frequently moving into overbought territory (above 70), particularly in June, July, and September, and peaked around 75.58 in late July. While sustained overbought conditions can denote robust trend strength, the consistent high RSI readings, coupled with the extended upward price movement, likely signaled an increasing degree of market overextension as the period progressed.
The technical picture has changed notably from late October into November. After reaching a peak near 689.70 on October 29th, SPY initiated a sharp decline, marked by significant down candles and rising selling volume, particularly on November 20th, where volume exceeded 154 million shares with the close near the daily low. Correspondingly, the 14-day RSI has rapidly retreated from its near-overbought levels of 69.71 to 41.50 by November 21st, briefly touching 35.10. This concurrent deterioration in both price and momentum indicators suggests that bullish control has dissipated, and bears have gained the upper hand. We assess that SPY is likely to face continued downward pressure in the immediate term, potentially targeting lower support levels. An alternative scenario of a quick reversal would probably require the RSI to dip into deeply oversold territory or for a significant surge in buying volume, which is not currently evident.