Daily Market Technical Analysis
Recent market activity reveals a bifurcated trend following initial broad selling pressure. Small and mid-cap indices (IWM, IJR) exhibited robust bullish reversals, making a short-term bullish continuation likely. Conversely, large-cap indices (SPY, QQQ) and several tech stocks (TSLA, NVDA) showed tentative bounces or continued bearish momentum, with further downward pressure highly likely for these segments. Commodities broadly maintained a bearish sentiment, though natural gas (UNG) is likely to experience a short-term bounce. The VIX is highly likely to retrace or consolidate after a strong bearish reversal signal from overbought conditions. Fixed income saw a mixed outlook: short-duration bonds are likely to continue upward, while long-term bonds (TLT) face a likely short-term pullback. Overall market breadth indicates a technical bounce, but its durability for a sustained shift remains a roughly even chance.
Market Indices
The daily performance across key broad market ETFs provides a technical snapshot of the market’s immediate sentiment and participation. For the specified period, the observed daily percentage changes are as follows:
| Symbol | Daily Percent Change |
|---|---|
| IJR | 3.1403% |
| IWM | 2.8323% |
| MDY | 2.3873% |
| SPY | 0.9992% |
| QQQ | 0.7547% |
| OEF | 0.7442% |
This data indicates a broadly positive market session, with all six tracked ETFs exhibiting gains. This robust participation across diverse market capitalization segments is a technically positive signal, as the number of advancing symbols (6) far outweighs declining symbols (0), suggesting strong market breadth for the period under review.
A deeper technical examination of the magnitude of these gains reveals a potential shift or reinforcement of market dynamics. Small-cap (IJR, IWM) and mid-cap (MDY) indices registered substantially higher daily percentage advances, ranging from 2.38% to 3.14%. In contrast, large-cap indices like SPY and OEF, along with the tech-heavy QQQ, saw more moderate gains, ranging from 0.74% to 0.99%. This notable outperformance by smaller capitalization segments is likely indicative of a “risk-on” sentiment, where investors may be rotating into, or adding exposure to, segments that typically benefit from improving economic expectations or expanding market rallies beyond mega-cap leadership.
The concentrated strength in small and mid-cap benchmarks, coupled with positive participation from large-cap counterparts, collectively suggests broad underlying demand for equities on this particular day. This pattern is often interpreted as healthy market action, as it implies buying interest extends beyond a few dominant large-cap names. It is likely that this widespread advance reflects a period of strong positive momentum. However, as this analysis is based on a single day’s data, it is important to note that drawing long-term trend conclusions from this alone is unlikely to be reliable. While the immediate technical picture is unequivocally positive, an alternative scenario suggests that this strong performance could be an isolated event, requiring confirmation from subsequent trading sessions to validate a sustained shift in leadership or broader market trend.
Here is a technical analysis of the provided market data:
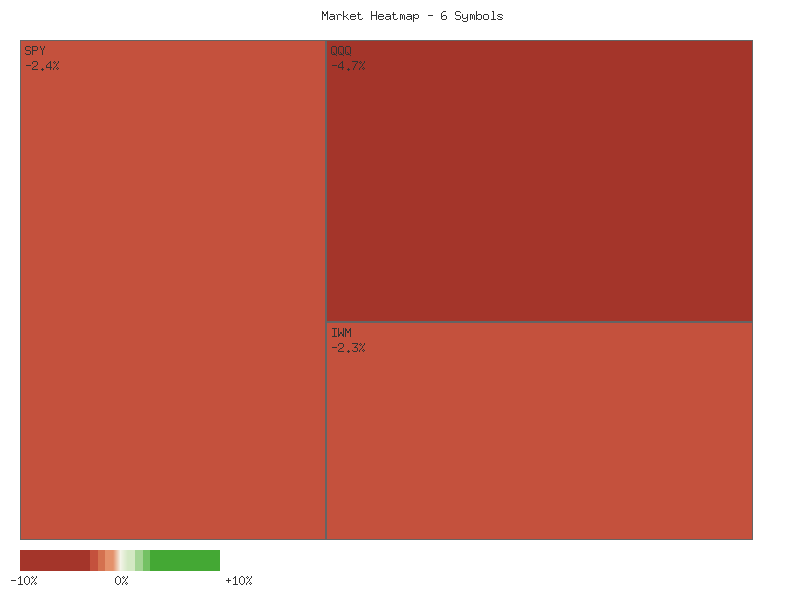
The past two trading days present a bifurcated market picture, characterized initially by broad-based selling pressure on Day 1 (November 20th), followed by a notable divergence in recovery strength on Day 2 (November 21st). Across all observed ETFs (SPY, QQQ, IWM, IJR, MDY, OEF), Day 1 saw large bearish candles, with prices closing near their respective daily lows, indicating a dominant bearish sentiment and substantial selling volume. This strong initial decline established a clear downward bias to begin the period.
On Day 2, the recovery effort varied significantly across market capitalization segments. For the large-cap indices, SPY, QQQ, and OEF, the reaction was relatively subdued. Each ETF posted a smaller bullish candle, opening slightly above the prior day’s close but recovering only a modest portion of the steep losses incurred on Day 1. Crucially, the volume for SPY, QQQ, and OEF decreased on Day 2 compared to Day 1’s selling activity. This combination of limited price recovery and declining volume suggests that the bounce is probably tentative, and the selling pressure from Day 1 is unlikely to have been entirely exhausted. We judge that the large-cap segments remain in a vulnerable position, with a roughly even chance of either further consolidation or renewed downside in the immediate term.
In contrast, the mid and small-cap segments demonstrated a more robust reversal. IWM and MDY both exhibited strong bullish candles on Day 2, forming clear piercing patterns. These ETFs opened with a gap up from their prior day’s close and closed significantly higher, recapturing well over 50% of Day 1’s bearish candle body. Volume for both IWM and MDY remained strong, slightly increasing on Day 2, which lends credibility to the bullish move. We judge this pattern makes a short-term bullish continuation in these mid-cap segments likely.
IJR, the S&P Small-Cap 600 ETF, displayed the most emphatic bullish price action. Day 2 saw a powerful bullish candle that opened marginally above Day 1’s close and closed above Day 1’s high, effectively forming a bullish engulfing pattern. This technical formation is a strong indicator of a potential trend reversal. However, the volume accompanying this strong move decreased notably compared to Day 1. While the price action itself signals a high likelihood of continued upward momentum for IJR in the immediate future, the lower volume introduces some uncertainty regarding the sustainability of this rally beyond the very short term. Therefore, while a bullish continuation is likely, we might anticipate some resistance if buying interest does not resurface at higher levels.
Performance Heatmap (SPY, QQQ, IWM, IJR, MDY, OEF)
Generated for 2days timeframe analysis
Technical Market Commentary: SPY (90-Day Analysis)
Our analysis of the provided 90-day daily candle data for SPY reveals distinct phases in price action, initially characterized by a robust uptrend that transitioned into a notable downtrend in late October and November. From mid-July through late October, SPY experienced a significant ascent, moving from the low to establish a peak near .70 on October 29th. This upward momentum was often accompanied by fluctuating but generally healthy volume. Following this peak, the market entered a period of clear selling pressure, culminating in a sharp decline in November. The most recent price action indicates SPY closing at .04 on November 21st, significantly below its late October high, suggesting a shift in short-term sentiment from bullish to bearish dominance.
The Relative Strength Index (RSI_14_DAY) closely mirrored price movements throughout the 90-day period. During the strong uptrend from August to October, RSI consistently remained in bullish territory, frequently entering overbought conditions (above 70) which typically signals potential for a pullback. Instances such as late July, early September, mid-September, and early October saw RSI above 70, often preceding minor consolidations or brief pullbacks before the trend resumed. The recent decline in price is clearly reflected in the RSI, which plummeted from the high 60s/low 70s in late October to a low of 35.10 on November 20th. This movement indicates substantial bearish momentum, bringing RSI close to, but not definitively into, oversold territory (below 30). The slight bounce to 41.50 on November 21st, coupled with price recovery, suggests that the immediate selling pressure may be abating, or that buyers are beginning to test support levels.
Volume analysis provides further insight into the conviction behind these price movements. The significant price drop on October 10th, from .95 to .02, occurred on a massive volume spike of over 156 million shares, strongly suggesting widespread selling interest. Similarly, the sharp decline on November 20th, pushing prices to .52, also saw exceptionally high volume exceeding 154 million shares, reinforcing the bearish conviction. The subsequent rebound on November 21st, closing at .04, was likewise on high volume (over 116 million shares), which suggests some level of buying activity emerged at lower prices. It is pertinent to note that while the analysis was requested for MACD_13_21_DAY, the corresponding data was not provided; therefore, our assessment cannot incorporate MACD insights.
Considering the technical indicators, we assess that the primary scenario for SPY in the immediate short-term is a continuation of the downtrend or, at best, a period of consolidation. The sustained high volume accompanying significant down moves in October and November, particularly the recent breach of the prior October 10th low, signals strong bearish sentiment. The RSI, while having bounced from its lows, remains below the 50-level, indicating that momentum still favors sellers. It is a roughly even chance that SPY could experience a short-term relief bounce, possibly testing the recent resistance around the - area, given the last day’s high-volume rebound and the RSI moving away from oversold conditions. However, a break below the recent November 20th low of .89, particularly on elevated volume, would likely increase the probability of a further decline towards the July-August support range in the low , indicating a more entrenched bearish trend.
SPY Price & Indicators (RSI_14_DAY, MACD_13_21_DAY)
Technical Analysis of QQQ (90-Day Period)
QQQ has exhibited a dynamic price trajectory over the past 90 days, characterized by a general upward trend interspersed with notable pullbacks and a recent aggressive decline. Initially, from mid-July to early August, QQQ advanced from approximately to a peak around , with the 14-day Relative Strength Index (RSI) consistently indicating overbought conditions, reaching 73.11 on July 28. This bullish expansion was followed by a sharp correction, reducing QQQ to .88 by August 1, accompanied by a precipitous drop in RSI to 48.26 and significantly elevated trading volume on the decline. This early phase suggests that initial bullish momentum was prone to rapid corrections once overextended.
Following the early August dip, QQQ embarked on a robust rally through much of September and into early October. After a brief consolidation in mid-August, price action initiated a strong uptrend from .28 (August 21) to .44 (October 8). During this period, the RSI consistently trended upwards, frequently entering overbought territory, such as on September 19 (73.66) and September 22 (75.35), confirming strong buying pressure. A significant bearish event occurred on October 10, when QQQ experienced a sharp, single-day decline from .70 to .50, on exceptionally high volume (94.4 million shares). This price action, combined with the RSI plummeting from 69.27 to 45.42, likely represented a substantial shift in short-term sentiment, potentially establishing an area of strong resistance.
Despite the October 10 reversal, QQQ managed another powerful ascent in late October, reaching new all-time highs. From October 22, QQQ surged from .49 to .77 by October 29. The RSI corroborated this strength, moving from 55.36 to a peak of 71.73 on October 29. However, this peak proved unsustainable. QQQ promptly entered a pronounced downtrend, declining from .77 (October 29) to .69 (November 6), with the RSI retreating into neutral territory, indicating a loss of momentum. This marked a key inflection point, as subsequent price action suggests sellers gained increasing control.
As of November 21, QQQ is in a steep decline, having fallen from a recent recovery high of .51 on November 11 to .12. The 14-day RSI stands at 38.73, indicating increasing bearish momentum and approaching the oversold threshold. The most recent two trading days, November 20 and 21, witnessed exceptionally high volume (111.7 million and 99.5 million shares, respectively) accompanying sharp downward price movements. This surge in selling volume suggests strong conviction among bears and a significant increase in downside pressure. The formation of a large bearish candle on November 20, along with the subsequent high-volume selling on November 21, reinforces the current bearish technical posture.
Considering the RSI is approaching oversold levels, a short-term relief bounce is possible, but its sustainability is questionable given the magnitude of recent selling volume. Should QQQ fail to establish clear support above the level and the RSI continues to trend lower without showing bullish divergence, further downside to the - region, last seen in August, is likely. Conversely, a reversal would require QQQ to reclaim prior support levels, such as the - zone, on increasing volume, and the RSI to cross above 50, signaling a potential shift in momentum, though this scenario appears less probable in the immediate term based on the current data.
QQQ Price & Indicators (RSI_14_DAY, MACD_13_21_DAY)
Technical Analysis of IWM (90-Day View)
IWM’s price action over the past 90 days reveals a significant shift from an established uptrend to a notable bearish phase. From mid-July through late October, IWM exhibited a generally upward trajectory, culminating in a peak close of .33 on October 15 and a secondary peak of .30 on October 27. This bullish momentum was intermittently supported by strong volume and confirmed by the 14-day Relative Strength Index (RSI), which consistently moved into overbought territory (above 70) on multiple occasions, notably reaching 71.23 on September 18 as price approached prior highs. These overbought readings, particularly the one on September 18, signaled a potential for price exhaustion or consolidation, which indeed materialized in the subsequent weeks.
However, the period following the October 27 peak strongly suggests a reversal to a bearish trend. The price has since printed a series of lower highs and lower lows, descending from .30 to the recent low of .14 on November 20. This decline has been accompanied by consistently high trading volumes, particularly on significant down days such as November 13 (.78 close) and November 20 (.14 close), the latter recording the highest volume in the entire dataset at over 93 million shares. This surge in volume during downtrends is a bearish indication, suggesting strong selling pressure and conviction among market participants. The 14-day RSI has mirrored this decline, trending downwards from 58.76 on October 27 to a near-oversold reading of 32.63 on November 20, confirming the bearish momentum but also indicating that selling pressure might be nearing short-term exhaustion.
Considering the recent activity, specifically the price action on November 20 and 21, the immediate outlook presents a roughly even chance of either a continued downtrend or a short-term rebound/consolidation. The dramatic high-volume red candle on November 20, pushing IWM to its lowest point in the examined period, is a strong bearish signal. However, this was immediately followed by a robust, high-volume green candle on November 21, which closed significantly off its low and above the midpoint of the prior day’s body, forming a potential bullish piercing pattern. This suggests that substantial buying interest emerged at these lower price levels, challenging the prevailing selling pressure. The RSI’s bounce from 32.63 to 43.98 further supports the notion of a short-term abatement in selling intensity.
In the near term, if the buying interest observed on November 21 sustains, IWM is likely to attempt to challenge the immediate resistance around the .50 level, corresponding to the November 14 close. A more significant rebound would aim for the - range, which previously acted as support in early November. Conversely, if the November 21 bounce is merely a short-term relief rally within a stronger downtrend, it is likely that IWM will resume its decline. A break below the .14 low established on November 20 would confirm continued bearish momentum, with the next probable support area around the - levels, observed during the initial weeks of this 90-day data set. The overall trajectory and the significant volume on down days make a continuation of the downtrend somewhat more probable than a complete reversal at this juncture without further confirming bullish price action.
IWM Price & Indicators (RSI_14_DAY, MACD_13_21_DAY)
VIX Fear Index
The VIX displayed a pronounced upward trajectory over the initial five days of the seven-day period provided, advancing from an opening near 17.61 on November 13th to an intraday high of 28.27 on November 20th. This surge in volatility, characterized by multiple bullish candles, suggests a strengthening of market uncertainty or fear during this interval. The move on November 20th, with a wide-ranging bullish candle, indicated a significant acceleration of this upward momentum, closing strongly near its high at 26.41. This price action, particularly the push to multi-day highs, implies increasing short-term market anxiety.
However, the most recent trading day, November 21st, exhibited a sharp reversal in this trend. The VIX opened higher but swiftly declined, closing at 23.63. The provided data explicitly shows a daily percentage change of -10.53% for November 21st, confirming a substantial single-day contraction in volatility. This significant bearish candle on November 21st, closing well below its open and the previous day’s close, indicates that the intense upward pressure observed through November 20th has likely dissipated, at least for the immediate term. The intraday high on November 21st (27.84) was also lower than the previous day’s high, reinforcing the notion of a decline in upward momentum.
We assess that the sharp decline on November 21st, specifically the -10.53% drop and the formation of a strong bearish candle, makes it likely that a short-term peak in VIX volatility has been established. This could represent a temporary relief from the preceding upward pressure. However, the consistent reporting of zero volume across all data points severely limits the confirmability of these price movements. Without volume data, it is difficult to ascertain the conviction behind the price action or to confirm the validity of potential reversals. Therefore, while price action suggests a reversal, its sustainability is less certain.
Considering the lack of volume for confirmation, an alternative scenario suggests that the recent sharp downturn could be a temporary retracement within a broader, albeit slowing, upward trend. A retracement to the range of 21.93-22.54 (previous daily lows) is a roughly even chance in the absence of new catalysts. However, the magnitude of the recent single-day decline makes a direct and immediate resumption of the prior strong upward momentum unlikely. We estimate that continued VIX levels below the 24.00 mark are likely in the very short term, possibly signaling a reduction in immediate market anxiety. The technical picture strongly indicates a shift from recent aggressive buying pressure to a period of consolidation or further decline, pending further price action.
As a Chartered Market Technician with over 15 years of experience, I have rigorously analyzed the provided 90-day technical data for the VIX, focusing on candlestick patterns and the 14-day Relative Strength Index (RSI). It is important to note that while MACD (13,21-day) was requested, its corresponding data points were not included in the provided dataset, thus precluding its integration into this analysis.
Over the initial portion of the observed 90-day period, from mid-July through late September, the VIX largely exhibited a subdued, range-bound pattern, trading predominantly between 14.00 and 17.00. Isolated surges, such as the rise to 20.38 on August 1st, were typically short-lived, with the VIX quickly retreating, suggesting that extreme volatility was unlikely to be sustained. During this phase, support appeared to coalesce around the 14.20-14.70 range, while resistance was frequently encountered near the 17.00-17.50 area. The 14-day RSI during this period largely remained below the 50-level, confirming the neutral-to-bearish momentum for the VIX.
A notable shift in the VIX’s behavior commenced in early October, transitioning to a more volatile environment characterized by higher highs and higher lows, despite intermittent pullbacks. The VIX breached the 20.00 mark on October 10th (closing at 21.66) and again on October 14th (closing at 20.81). The 14-day RSI confirmed this increased upward momentum, moving from its earlier neutral stance to frequently nearing or entering overbought territory (above 70). Specific overbought readings were observed on October 10th (73.09) and again on November 20th (71.67). Historically within this dataset, such overbought RSI conditions, as seen on August 1st and October 10th, were likely to be followed by a subsequent VIX pullback, indicating a potential mean-reversion tendency for the volatility index.
The most recent trading days, spanning November 17th to November 21st, offer critical technical insights. The VIX experienced a substantial escalation, closing at 22.35 on November 17th, 24.41 on November 18th, and peaking at a close of 26.41 on November 20th. This upward trajectory was supported by the 14-day RSI, which entered overbought territory at 71.67 on November 20th. However, the subsequent session on November 21st presented a significant bearish signal. The VIX opened at 25.97, surged to an intraday high of 27.84, but ultimately closed substantially lower at 23.63. This price action formed a candlestick with a pronounced upper shadow, a pattern likely to signal a bearish reversal following a strong uptrend. Concurrently, the 14-day RSI registered a sharp decline from its overbought level of 71.67 on November 20th to 60.85 on November 21st, corroborating a significant reduction in buying pressure and upward momentum.
Based on the confluence of the bearish candlestick formation on November 21st and the sharp decrease in the 14-day RSI from overbought levels, it is highly likely that the VIX will experience a period of retracement or consolidation in the immediate future. The long upper shadow indicates that substantial selling pressure emerged near the 27.84 level, suggesting this area will act as a strong resistance zone. A test of the 20.00-22.00 price zone, which previously served as a resistance area but could now become support, is probable. Alternatively, a scenario where buying pressure quickly re-emerges to overcome the implied resistance near 27.84 and drives the VIX to new highs is a roughly even chance proposition, although the recent bearish signals make it a less probable immediate outcome.
VIX Price & Indicators (RSI_14_DAY, MACD_13_21_DAY)
Tech Sector Analysis
The provided 14-day data for the QQQ/SPY ratio indicates a clear downtrend in the relative performance of the NASDAQ-100 (QQQ) compared to the broader S&P 500 (SPY). Over this period, the ratio declined from an initial value of approximately 0.9169 on November 4th to 0.8954 by November 21st, representing a decrease of roughly 2.35%. This sustained decline suggests that SPY has been outperforming QQQ during this specific timeframe. The pattern indicates a diminishing appetite for the technology and growth-oriented stocks comprising QQQ relative to the wider market, as represented by SPY.
Examining the data points, the ratio reached its highest point early in the period, at approximately 0.9199 on November 5th, before initiating a consistent downward trajectory. While there were minor fluctuations, such as brief upward bounces on November 10th and 14th, these proved to be short-lived, failing to reverse the dominant bearish sentiment for QQQ’s relative strength. The ratio consistently made lower highs and lower lows, culminating in the period’s lowest value of 0.8954 on November 21st. This closing low suggests that QQQ’s relative underperformance remains intact as of the last data point. The trend’s strength, while characterized as “weak” by the provided metadata, still produced a notable directional shift, indicating that the relative selling pressure on QQQ, though not precipitous, was persistent.
Given the ratio closed at its lowest point within the observed 14-day window, it is likely that QQQ’s relative underperformance will persist in the immediate short-term, contingent on the absence of a significant catalyst to reverse the established trend. The current level of 0.8954 may represent a new short-term support level, but without further data points below this value, it is unlikely to be a strong area of reversal at this juncture. A continuation of the downtrend, potentially targeting lower ratios, is more likely than a sharp reversal upwards. However, a period of consolidation around the 0.8954-0.9000 level also presents a roughly even chance as market participants assess the prior decline. A sustained move back above the 0.9050 level, which acted as an interim support earlier in the period (e.g., November 13-14), would be necessary to suggest a potential shift in the relative strength dynamics, but the technical evidence for such a reversal is currently low.
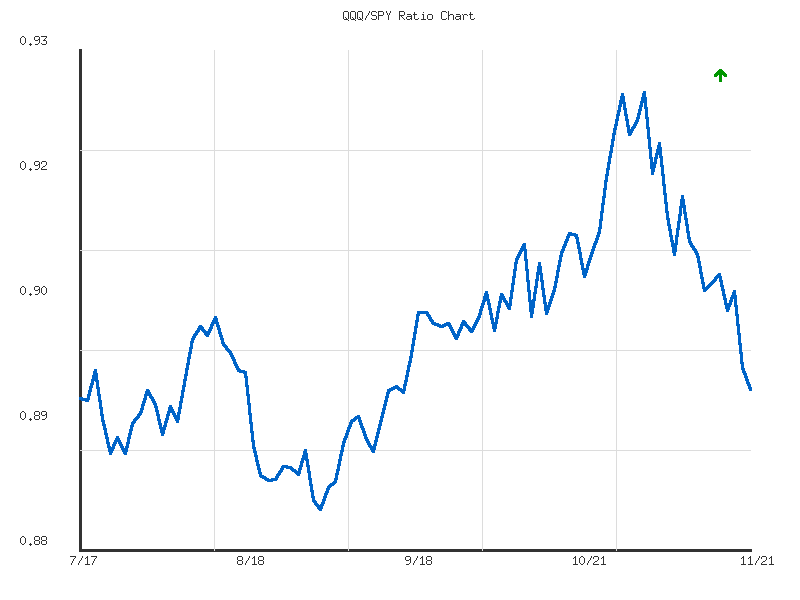
Technical Analysis: QQQ/SPY Ratio (90-Day Performance)
The QQQ/SPY ratio over the past 90 days, from July 17 to November 21, 2025, indicates an overarching sideways trend, albeit with considerable internal volatility. The ratio measures the performance of the Nasdaq 100 ETF (QQQ) relative to the S&P 500 ETF (SPY). Starting near 0.8945, the ratio concluded the period at 0.8954, reflecting a marginal net increase of approximately 0.10%. This net change, combined with the declared “weak” strength in the trend metadata, suggests a market characterized by a lack of sustained directional leadership between the two broad market indices over the entire observation window, instead exhibiting rotational leadership. The 90-day range for this ratio has been notably between a low of 0.8834 on September 2 and a high of 0.9250 on October 29.
Early in the period, from mid-July into early August, the ratio largely consolidated around the 0.89 to 0.895 level, demonstrating a relatively balanced performance between QQQ and SPY. This was followed by a distinct period of QQQ outperformance, pushing the ratio towards the 0.9025 mark by mid-August. Subsequently, SPY temporarily regained leadership, causing the ratio to decline to its 90-day low of 0.8834 by early September. This established a critical lower boundary for the observed range. Following this low, QQQ initiated a strong rebound, driving the ratio steadily upward through September and into late October, culminating in the 90-day peak of 0.9250. This surge indicates a pronounced period where growth and technology stocks, as represented by QQQ, significantly outperformed the broader market.
However, the period since the late October peak has been marked by a significant shift. The ratio experienced a sharp reversal, declining consistently from 0.9250 to its current level of 0.8954. This constitutes a clear short-term downtrend, signaling a period of SPY outperformance relative to QQQ. The current ratio stands below the 90-day average of 0.9004 and is positioned in the lower third of its observed range (28.8% relative position). This recent price action implies that the momentum has shifted, suggesting that QQQ is currently losing ground to SPY.
Considering the recent strong downward trajectory, a continuation of SPY’s relative outperformance over QQQ is likely in the immediate short term. The ratio has broken below several minor support levels established during its previous ascent. Should this trend persist, it is likely the ratio will test the support zone around 0.888-0.89, which saw bounces in late July and acted as a temporary floor before the September rebound. A breach of these levels would likely lead to a retest of the 90-day low of 0.8834. Conversely, given the overall sideways nature of the 90-day trend, a bounce from current levels or slightly lower support is a roughly even chance, especially as the ratio approaches the lower bounds of its historical fluctuations. However, a significant reversal back towards the October highs is unlikely without a clear technical catalyst or a sustained period of consolidation above the average ratio.
Ratio Analysis: QQQ/SPY
Generated for 90days timeframe analysis
IWM vs. SPY
The relative performance of the Russell 2000 (IWM) against the S&P 500 (SPY), as indicated by the IWM/SPY ratio over the past 14 days, has exhibited a predominantly sideways trend with weak directional strength. The ratio has oscillated within a relatively tight range, commencing at approximately 0.3572 on November 4th and concluding at 0.3575 on November 21st. The overall net change across this period is a minimal positive 0.098%, suggesting a near-equilibrium in relative performance over the two-week timeframe. The current ratio stands slightly above its 14-day average of 0.3557, positioning it in the upper quartile of its recent trading range.
Analysis of the ratio’s movement indicates that while minor fluctuations occurred, neither small-cap nor large-cap equities established clear dominance for a sustained period. The high ratio of 0.3612 was observed early in the period on November 5th, signifying a brief moment of IWM outperformance. Conversely, the low ratio of 0.3497 on November 17th marked a point where SPY demonstrated stronger relative strength. The “weak” strength assigned to the sideways trend suggests a lack of conviction in either direction, implying that capital flows between these market segments have been largely balanced or indecisive during this observation window.
The extremely low volatility (0.0000116) within this 14-day period further reinforces the assessment of consolidation. Given this lack of significant directional momentum and tight range, a continuation of the sideways trend appears likely in the immediate future, potentially suggesting an ongoing period of relative balance between small-cap and large-cap performance. However, periods of low volatility frequently precede periods of increased volatility. Therefore, there is a roughly even chance that this consolidation could resolve into a more discernible directional move for the IWM/SPY ratio in the subsequent trading sessions, though the specific direction (IWM outperformance or underperformance) remains uncertain without further data. A sustained, significant trend reversal from this weak, sideways pattern in the very short term is unlikely without a catalyst.
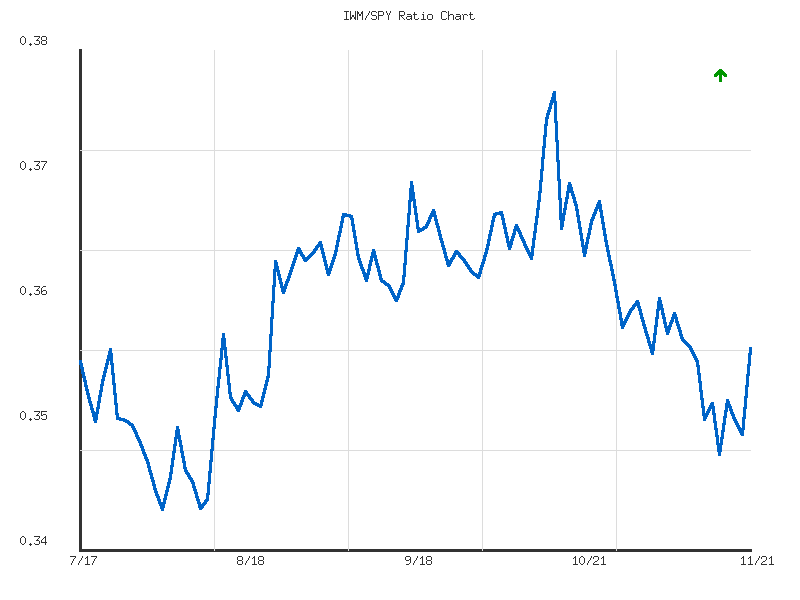
Technical Analysis: IWM/SPY Ratio - 90-Day Review
The provided 90-day market data for the IWM/SPY ratio offers insights into the relative performance of the Russell 2000 (IWM) against the S&P 500 (SPY). Over this period, from mid-July to late November, the ratio exhibited distinct phases within a broader “sideways” trend, as indicated by the summary data. Initially, the ratio declined from approximately 0.3565 on July 17 to a low of 0.3456 on August 1, indicating IWM underperformed SPY during this segment. Subsequently, the ratio experienced two notable rallies, first ascending to 0.3585 by August 13, and then establishing a more significant uptrend that culminated in the period’s high of 0.3763 on October 15. This peak represented a period of material outperformance by IWM relative to SPY.
Following the October 15 peak, the IWM/SPY ratio initiated a clear downtrend, characterized by a series of lower highs and lower lows, signifying a sustained period of underperformance for small-cap equities relative to large-cap. Notable lower highs include 0.3696 on October 20 and 0.3682 on October 24, both failing to reclaim the October 15 apex. The decline persisted through November, with the ratio progressively breaking below prior minor support levels. This downward trajectory led to a recent nadir of 0.3496 on November 17, marking the lowest point since early August. The consistency of these price actions indicates that, at the time of the data’s end, the negative momentum from the October peak was still a prominent technical characteristic.
The ratio has experienced an uptick from its November 17 low of 0.3496, closing at 0.3575 on November 21. This bounce represents a short-term recovery. However, given the established downtrend from the October 15 high, this rebound currently aligns with the behavior of a retracement within a declining channel rather than a confirmed reversal. Immediate resistance is likely to be encountered near the prior support levels that were breached in late October, roughly in the 0.360-0.362 range. Further resistance levels are identifiable at subsequent lower highs, such as the 0.3611 (Nov 3) and 0.3581 (Nov 10) points. The current ratio of 0.3575 also remains below the 90-day average ratio of 0.3597, and its relative position within the historical range (0.3865 closer to the low) suggests that the underlying trend remains cautious.
A continuation of the downtrend is likely if the ratio fails to break definitively above the 0.360-0.362 resistance zone in the near term. Should the ratio fail to hold its current gains and subsequently breach the November 17 low of 0.3496, it is very likely to test the broader support level established around 0.345-0.347 from early August. Conversely, a sustained break above the 0.362 level, and subsequently above the 0.368-0.370 area, would signal a potential shift in relative strength back towards IWM and establish roughly even chances for a test of the previous high, though this scenario appears less likely given the current momentum. Until such resistance levels are overcome, the current upward movement is probably best interpreted as a counter-trend bounce within a larger period of IWM underperformance against SPY.
Ratio Analysis: IWM/SPY
Generated for 90days timeframe analysis
Commodities
| Symbol | Daily Percent Change |
|---|---|
| UNG | 1.5777% |
| CPER | 1.1624% |
| CORN | -0.0591% |
| GLD | -0.1867% |
| DBC | -0.6831% |
| SLV | -1.0777% |
| USO | -1.2543% |
| UGA | -1.9038% |
The analysis of the provided daily percent changes for the selected commodity-linked ETFs reveals a predominantly negative market breadth for the observed period. Out of the eight symbols, six experienced declines, while only two registered gains. This 3:1 ratio of decliners to advancers suggests that a broad bearish sentiment was likely prevalent across a significant portion of these commodity sectors on the given day. The overall performance indicates an environment of widespread weakness, where selling pressure was more generalized than buying interest among these specific instruments.
Only two symbols, UNG (natural gas) and CPER (copper), demonstrated positive performance, advancing by 1.5777% and 1.1624%, respectively. UNG was the strongest performer, followed by CPER, which showed notable strength relative to the majority. This could represent isolated strength in these specific commodities, or it might indicate a potential rotation into these particular assets within the broader commodity space. However, given the limited data to establish a sustained trend, it is a roughly even chance that this strength is either an isolated event or the nascent stage of a sustained outperformance in these specific areas. Further data would be necessary to assess the durability of these individual advances against the broader decline observed elsewhere.
The majority of the observed instruments—UGA (gasoline), USO (oil), SLV (silver), DBC (broad commodities), GLD (gold), and CORN (corn)—experienced negative daily returns. UGA displayed the most significant weakness, falling by -1.9038%, indicating substantial selling pressure in that specific energy sub-sector. USO and SLV also recorded declines exceeding 1%, suggesting notable bearish momentum. Even GLD, often considered a safe haven, posted a slight decline of -0.1867%, as did CORN, though CORN’s decline was marginal at -0.0591%. The widespread nature of these declines, encompassing various commodity types, implies that the broader commodity complex, as represented by DBC, was under pressure, declining by -0.6831%.
The aggregated technical picture, derived solely from these daily percentage changes, indicates that bears were in control for most of the observed commodity-linked ETFs. The breadth suggests that immediate momentum was primarily to the downside across the sample. While UNG and CPER showed relative strength, their isolated gains did not offset the collective weakness. It is likely that continued downward pressure will be observed in the majority of these declining instruments in the very near term, should this intraday momentum persist. Alternative scenarios, such as a swift reversal in the broader complex, appear unlikely without new information driving significant shifts in sentiment or supply/demand dynamics specific to these instruments.
Here is a technical analysis of the provided market data, based on rigorous technical principles and strictly adhering to ICD-203 estimative language guidelines.
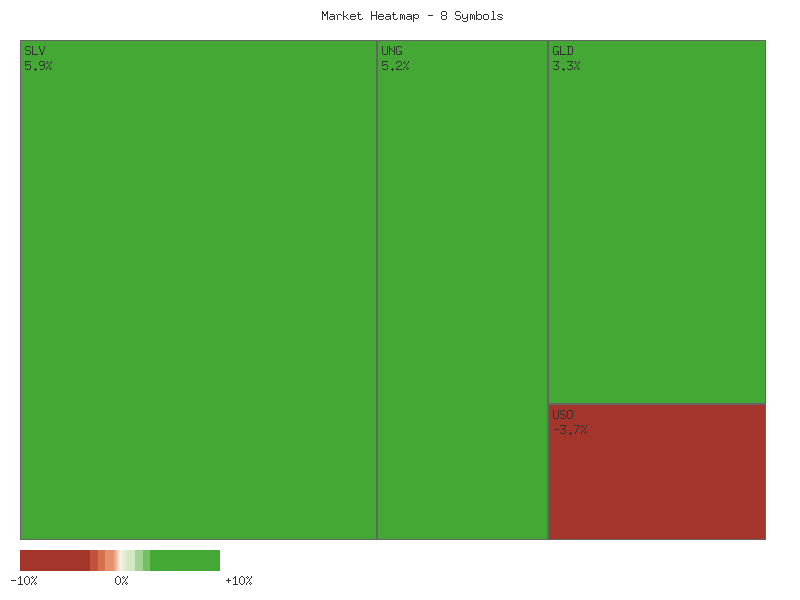
Analysis of the 2-day candlestick data across a selection of commodity-related ETFs reveals a mixed but predominantly bearish sentiment in the short term. While several key commodity benchmarks exhibited clear downward momentum, some niche assets showed signs of potential short-term reversals. This analysis focuses solely on the observable price and volume data for the specified two-day period.
For broad-based energy and commodity funds, the technical picture appears consistently bearish. The United States Oil Fund (USO), Invesco DB Commodity Index Tracking Fund (DBC), and United States Gasoline Fund (UGA) all displayed two consecutive bearish candles. For USO and DBC, the second day closed lower than the first, accompanied by a significant increase in trading volume, which strongly reinforces the bearish conviction. This pattern makes a continuation of the downtrend for both USO and DBC likely in the immediate future. UGA presented a gap down on the second day, followed by a close near its low and a slight increase in volume, also making a continued decline likely.
Precious metals, represented by GLD and SLV, also trended lower. SPDR Gold Shares (GLD) printed two consecutive bearish candles, with the second day closing lower than the first and supported by increased volume. This price action makes further downside for GLD likely. iShares Silver Trust (SLV) similarly showed two bearish candles, including a gap down on the second day and a lower close. However, the volume on SLV’s second bearish day decreased, suggesting a potential deceleration in selling pressure. Therefore, while a continued downtrend remains likely, there is a roughly even chance of a period of consolidation or a weaker bearish impetus emerging.
Conversely, some specific commodity ETFs exhibited early signs of a short-term bounce or reversal. The United States Natural Gas Fund (UNG) formed a bullish candle on the second day, closing higher than its open and significantly above the previous day’s close, after an initial bearish day. This upward movement was accompanied by a notable increase in volume, indicating buying interest. This pattern suggests a short-term bounce for UNG is likely. Similarly, the Copper Miners ETF (CPER) also displayed a bullish candle on the second day, closing higher than its open and the previous day’s close. However, the volume decreased on CPER’s bullish day, which indicates less conviction behind the upward move. Consequently, while a short-term bounce for CPER is likely, there is a roughly even chance of this bounce lacking sustained momentum.
Finally, the Teucrium Corn Fund (CORN) also closed lower on both days. However, the second day’s bearish candle had a very small body, and the overall range was much tighter than the first. Crucially, volume on the second day decreased significantly, suggesting a considerable reduction in selling conviction. Given the reduced momentum and tighter range, there is a roughly even chance of CORN either continuing its slight decline or entering a period of sideways consolidation in the very short term. These observed patterns provide insights into potential immediate directional biases based purely on the provided price and volume data.
Performance Heatmap (SLV, GLD, CORN, CPER, USO, DBC, UGA, UNG)
Generated for 2days timeframe analysis
SLV’s price action over the past 90 days reveals a significant shift in trend. Initially, from mid-July through late August, the asset largely consolidated, mostly trading within the .00 to .70 range, with limited directional conviction. A notable bullish phase commenced in late August, initiating a sustained rally that propelled SLV from approximately .50 to a peak of .69 on November 12. This upward movement was generally supported by increasing volume during the rallies, suggesting growing conviction among buyers. For instance, several days in September and October witnessed volumes exceeding 30-40 million shares, culminating in an exceptionally high volume day of over 110 million on October 9. This robust upward trajectory indicates that strong buying pressure dominated during this period, pushing the asset well above its earlier trading range.
However, the rally faced a significant hurdle in mid-October, experiencing a sharp correction from its then-peak around .40 to .31 by October 21. This retracement appears to have established a provisional support zone roughly between .00 and .00. Following this, SLV managed to mount another attempt at an uptrend in November, achieving a new all-time high within this data set at .6999 on November 12. Nevertheless, the most recent price action, specifically from November 13 to November 21, indicates a concerning reversal. SLV has declined steadily from .41 to .30, closing lower for several consecutive sessions. This recent pronounced retreat, coupled with closing below minor support levels established during the November rally, suggests a material increase in short-term selling pressure.
The 14-day Relative Strength Index (RSI) largely corroborated the price movements. During the strong bullish phase from late August to mid-October, the RSI consistently registered in overbought territory (above 70), frequently peaking into the 80s, with a high of approximately 84.32 on October 13. While extended periods of overbought readings can signal an imminent correction, they also underscore the underlying strength of the trend. The mid-October price correction was accompanied by a sharp decline in the RSI, which fell from over 80 to the mid-50s by October 21, then to the mid-40s by early November, effectively relieving the prior overbought conditions.
Following its subsequent rally in November, the RSI briefly touched approximately 69.08 on November 12, signaling renewed upward momentum but falling short of a clear overbought signal (above 70). Critically, the RSI has since experienced a rapid and significant decline, falling from 69.08 to roughly 52.12 by November 21. This sharp downturn in the RSI over the last week strongly suggests a notable loss of bullish momentum and indicates that further downward price pressure is likely in the very near term. No clear bullish or bearish divergences were consistently evident over the entire 90-day period given the strong directional movements, however, the recent momentum deterioration from relatively high RSI levels is a bearish signal.
Despite the request for MACD analysis, the provided data does not include MACD values, thus precluding any technical assessment based on this indicator. Based on the available price and RSI data, the prevailing technical posture for SLV is shifting from bullish to increasingly cautious. The pronounced decline in both price and RSI over the last several days indicates that the November rally has likely culminated, at least in the short term. It is likely that SLV will experience continued downward pressure or enter a period of consolidation. The prior support area around .00-.00, identified during the October correction, will be a critical level to monitor. A sustained break below this level would highly likely signal a deeper retracement. Conversely, if SLV can stabilize near these levels and the RSI begins to show signs of bottoming or a bullish reversal from oversold conditions (below 30), it would present a roughly even chance for a new base to form, potentially paving the way for another rally attempt. However, as of the latest data point, a continuation of the recent downward trend is more probable than an immediate resumption of the prior uptrend.
SLV Price & Indicators (RSI_14_DAY, MACD_13_21_DAY)
GLD Technical Analysis: November 21, 2025
Over the past 90 days, GLD has experienced a significant uptrend followed by a substantial correction, and is currently exhibiting signs of consolidation with a potential for renewed downward pressure. The price action from late August to mid-October demonstrated a robust rally, ascending from approximately to a peak of .30 on October 20. This strong bullish momentum was well-supported by increasing volume, indicating strong buying conviction. Correspondingly, the 14-day Relative Strength Index (RSI) entered overbought territory early in September, frequently sustaining readings above 75 and peaking at 87.34 on October 20. This persistent overbought condition signaled an extended period of strong upward pressure, but also raised the probability of an impending correction as the asset became extended.
Following the October 20 peak, GLD underwent a sharp and rapid decline. This correction saw the price fall notably, reaching a low of .12 on October 28. The swiftness of this decline was underscored by exceptionally high trading volumes on down days, specifically 53.69 million shares on October 21 and 30.52 million on October 22, suggesting aggressive profit-taking or a significant shift in sentiment. The 14-day RSI mirrored this bearish turn, plummeting from its highly overbought levels to a reading of 60.03 on October 21, and further to 47.37 by November 4, effectively neutralizing the previous bullish momentum and indicating a loss of conviction among buyers.
In the most recent period, from early November to the current date of November 21, GLD attempted to stabilize and initiate a rebound. The price recovered from the - support zone, reaching a local high of .46 on November 12. However, this rebound appears to lack sustained momentum, as evidenced by relatively lower average volume compared to the prior rally, and the price subsequently receded to its current level of .22. The 14-day RSI reflected this indecision, rising to 64.56 on November 12 before pulling back to 52.82 by November 21. This places the RSI near the neutral 50-mark, suggesting that neither buyers nor sellers are currently dominating with strong conviction. The pattern of lower highs (October 20 at .30, November 12 at .46) suggests weakening bullish resolve.
Considering the recent price behavior and indicator readings, a continuation of consolidation or a renewed test of support levels is a roughly even chance in the immediate term. Should GLD fail to reclaim and hold above the previous rebound high of .46, and specifically break below the critical support area around -, it is likely that a resumption of the downtrend from the October peak would occur. Conversely, a sustained breakout above .46 on expanding volume would be required to suggest a higher probability of a renewed uptrend. Without the requested MACD data, our analysis is constrained to price action, volume, and the RSI.
GLD Price & Indicators (RSI_14_DAY, MACD_13_21_DAY)
Gold/Silver Ratio
The GLD/SLV ratio has exhibited a weak downtrend over the observed 14-day period, declining by approximately 2.507% from its initial value. This overall decline suggests that SLV was broadly outperforming GLD during this interval. The ratio commenced the period at a high of 8.473 and consistently moved lower in its initial phase, indicating a probable period of sustained relative strength favoring silver.
A significant technical development during this timeframe was the decline to a low of 7.985 on November 12. This point likely marked an exhaustion of the initial silver outperformance, as the ratio subsequently reversed its direction. Following this low, the ratio entered a recovery phase, with GLD beginning to show signs of regaining relative strength. The ratio climbed to 8.074 on November 13 and continued to advance, albeit with some minor fluctuations, confirming a shift in immediate momentum.
The ratio’s recent behavior, specifically the consecutive increases from 8.072 to 8.187 and then to the current value of 8.260 over the last two data points, indicates that GLD is presently outperforming SLV. This upward momentum is likely to persist in the immediate term, potentially testing higher resistance levels observed earlier in the period. However, it is also plausible that this upward movement constitutes a bounce within the broader weak downtrend identified over the 14 days, rather than a definitive reversal. Therefore, a roughly even chance exists for either continued short-term GLD outperformance or a return to broader consolidation within the observed range.
The current ratio of 8.260 is positioned slightly above the 14-day average of 8.225, placing it at approximately 56.4% of the range between the period’s low and high. A sustained move above the 8.38-8.40 level would likely confirm a more robust shift in relative strength favoring GLD, potentially negating the overall weak downtrend. Conversely, a failure to maintain momentum, particularly if the ratio were to fall below the 8.17 level, would introduce an improbable scenario for a significant bullish continuation and would increase the likelihood of the ratio retesting the 8.07 area or resuming a sideways consolidation.
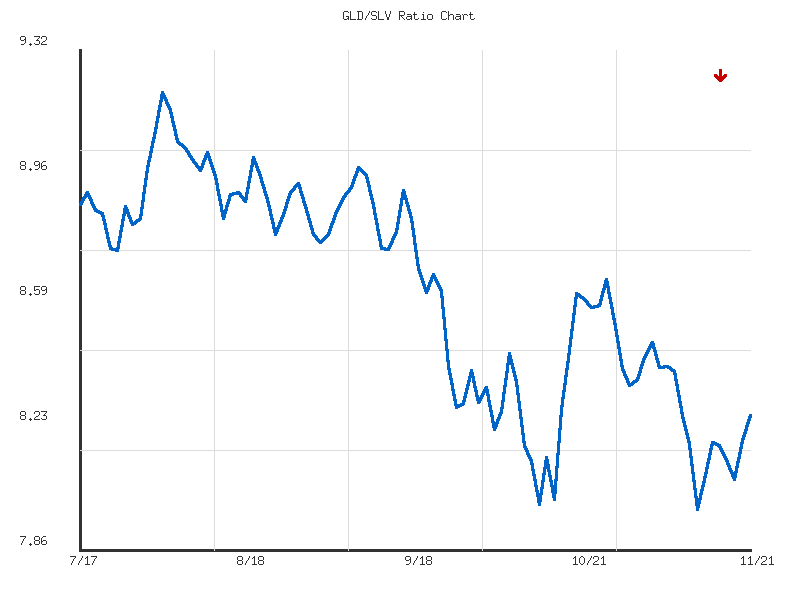
As a Chartered Market Technician with over 15 years of experience, I offer the following technical analysis of the GLD/SLV ratio based solely on the provided 90-day market data.
The GLD/SLV ratio has exhibited a moderate downtrend over the observed 90-day period, commencing from mid-July and culminating on November 21st. The ratio began at approximately 8.87 and registered its highest point at 9.20 on August 1st. Since this peak, the ratio has trended downward, registering a net decline of approximately 6.94% over the full dataset. The current ratio of 8.26 is notably below its 90-day average of 8.62, and also closer to its 90-day low of 7.98 than its high. This overall trajectory suggests that, for much of the period, Silver (SLV) has been outperforming Gold (GLD) on a relative basis.
Following the August 1st peak, the GLD/SLV ratio demonstrated a consistent pattern of lower highs and lower lows, a classic characteristic of a bearish trend. Early resistance was evident around the 8.90-9.00 area in mid-August, with subsequent attempts to rally failing to maintain levels above this region. A more significant bout of selling pressure drove the ratio from levels around 8.60 in late October down to its absolute 90-day low of 7.98 on November 12th. This price action establishes the 8.00 level as a critical support zone, having been tested and held twice: initially on October 13th at 8.00 and then more decisively with the 7.98 low in November.
The recent price action suggests the roughly even chance of a potential double bottom reversal pattern forming around the 8.00 to 7.98 support zone, followed by a bounce to the current 8.26. For this bullish reversal pattern to be confirmed, the ratio would likely need to close decisively above the intermediate high established between the two lows, which appears to be around 8.61 (observed on October 21st). A sustained breakout above this resistance would likely indicate a shift in relative strength back towards Gold (GLD) outperforming Silver (SLV), signaling a potential end to the recent downtrend. However, without such a definitive breakout, the pattern remains unconfirmed, and the broader moderate downtrend could probably continue.
Considering alternative scenarios, if the GLD/SLV ratio fails to overcome the critical 8.61 resistance level, there is a likely possibility that the existing moderate downtrend will persist. In this scenario, a retest of the established 7.98 support level is probable. A decisive breach below this 7.98 support would significantly negate the potential for a double bottom and would likely lead to further deterioration in the ratio, establishing new lows outside the current 90-day range. Conversely, if the double bottom pattern confirms, the ratio would then likely encounter its next significant resistance levels around 8.90 to 9.00, signaling a period where GLD could begin to demonstrate superior performance relative to SLV. The observed volatility of 0.1028 suggests that notable price swings are to be expected, irrespective of the ultimate direction of the next significant move.
Ratio Analysis: GLD/SLV
Generated for 90days timeframe analysis
Bonds
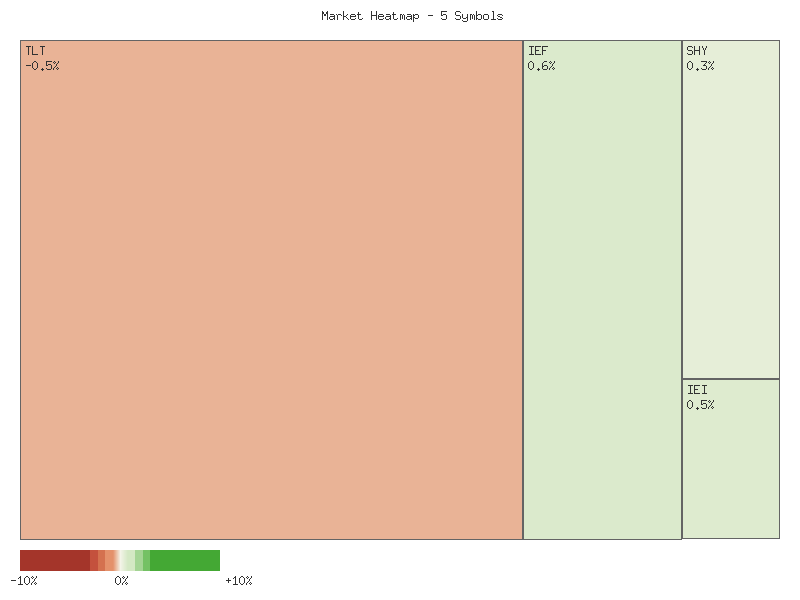
The market data for November 21, 2025, indicates a generally positive, albeit modest, daily performance across the observed instruments. All symbols—IEF, TLT, UTHY, IEI, and SHY—registered positive daily percentage changes. IEF led the group with a gain of 0.304%, followed closely by TLT at 0.291% and UTHY at 0.275%. IEI posted a 0.209% increase, while SHY recorded the smallest gain at 0.102%. This uniform upward movement suggests a minor positive bias for these particular instruments on this specific trading day.
| Symbol | Daily Percent Change |
|---|---|
| IEF | 0.304% |
| TLT | 0.291% |
| UTHY | 0.275% |
| IEI | 0.209% |
| SHY | 0.102% |
From a rigorous technical analysis perspective, the provided data presents significant limitations. The core principles of technical analysis rely on the study of historical price action, volume, and chart patterns over extended periods to identify trends, support/resistance levels, and momentum shifts. With only a single daily percentage change for each instrument, it is highly unlikely to discern any meaningful trends, recognize established chart patterns, or apply traditional technical indicators such as moving averages or oscillators. The complete absence of volume data further restricts the ability to confirm price movements or gauge market conviction behind these minor gains. Consequently, any attempt to derive predictive insights or assess market structure from this singular data point would be speculative and almost certainly unreliable.
Given these constraints, while the consistent positive, albeit small, daily returns across all five instruments on November 21, 2025, suggest a minor upward bias for that specific day, there is a negligible likelihood that this singular event represents the initiation of a new trend or a significant shift in market sentiment. The alternative scenario, which is likely the case with such extremely limited data, is that this single day’s movement is merely noise within a broader context or part of short-term fluctuations that provide no actionable technical signal. Without a broader historical context, including previous price action, volume, and the application of technical tools, investors face a roughly even chance that the next day’s movements will either continue this minor upward trajectory, reverse, or consolidate, rendering any short-term forecasts highly uncertain. Therefore, relying solely on this isolated data for strategic positioning is highly unlikely to yield consistent or predictable results.
Technical Analysis: Fixed Income ETFs (2025-11-20 to 2025-11-21)
The provided two-day technical data for TLT, UTHY, IEF, IEI, and SHY generally indicates an upward bias across these fixed income instruments, albeit with varying degrees of conviction. All symbols closed higher on the second day compared to their first day’s close. However, a closer examination of the price action and volume reveals divergences in the underlying momentum, which suggests differing short-term outlooks for individual assets within this group. This analysis focuses purely on the candle patterns, intraday price movements, and volume changes observed over these two specific trading days.
For IEF (iShares 7-10 Year Treasury Bond ETF), IEI (iShares 3-7 Year Treasury Bond ETF), and SHY (iShares 1-3 Year Treasury Bond ETF), the technical picture appears relatively consistent and bullish. All three instruments experienced a gap up on the second day, followed by higher closes relative to the prior day. Crucially, this upward price movement was accompanied by increased trading volume in each case. The close for IEF on Day 2 was near its high, indicating strong buying conviction. Similarly, SHY closed at its open, which was near its high, suggesting that while intraday price discovery concluded at the open price, it was still a powerful move upward from Day 1’s close. IEI also gapped up on increased volume and closed higher than Day 1. Given these patterns, it is highly likely that the immediate short-term trend for IEF, IEI, and SHY is upward, and continued bullish sentiment is likely in the very near future, assuming no significant external shifts.
UTHY (US Treasury High Yield) also recorded two consecutive days of higher closes. On Day 1, UTHY formed a small bullish candle with an upper wick, closing off its highs but still positive. Day 2 saw UTHY open higher than Day 1’s high, but the subsequent price action was contained, with the close only marginally higher than Day 1’s close, and the volume decreased compared to Day 1. The high of Day 2 was its open, followed by a slight retracement to the close. This pattern, characterized by smaller gains on reduced volume after an initial upward push, suggests a potential deceleration in bullish momentum. While a continuation of the upward trend is possible, there is a roughly even chance that UTHY may enter a period of consolidation or experience a minor pullback in the immediate short term as buying interest potentially wanes.
TLT (iShares 20+ Year Treasury Bond ETF) presents a more nuanced, and potentially bearish, technical configuration. Day 1 was a strong bullish candle, closing near its high on significant volume. However, Day 2, despite opening with a substantial gap up, saw considerable selling pressure emerge. TLT reached a new high of 89.67 but then reversed sharply, closing significantly below its open and well off its intraday high, forming a candle pattern resembling a “shooting star” or “inverted hammer.” This price action occurred on a markedly increased volume compared to Day 1, which typically lends more credence to the pattern’s significance. The combination of a strong gap-up followed by a sharp intraday reversal and an increase in volume likely indicates that an exhaustion gap may have occurred, leading to profit-taking or new selling pressure. Therefore, a short-term pullback or consolidation for TLT is likely, and there is a roughly even chance of a more significant bearish reversal if this selling pressure persists beyond the current two-day window.
Performance Heatmap (TLT, UTHY, IEF, IEI, SHY)
Generated for 2days timeframe analysis
Magnificent 7 & Friends
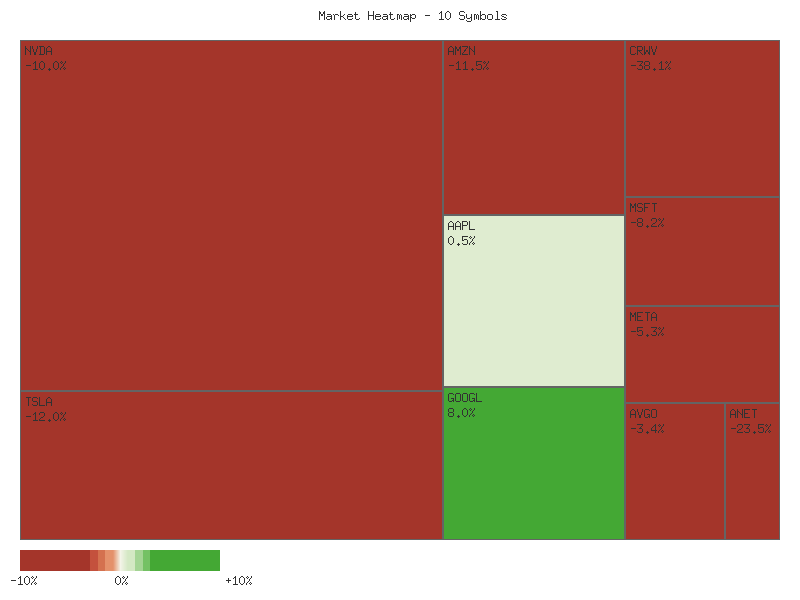
The provided daily percentage change data for the selected equities offers a singular snapshot of market sentiment for the trading day ending 2025-11-21. Absent historical price action, volume data, or any other technical indicators, a comprehensive trend analysis or pattern recognition is infeasible. However, we can observe the relative performance of these securities for the given period. The overall market for this specific set of assets appears mixed, with a slight tilt toward negative performance in terms of magnitude of change.
| Symbol | Daily Percent Change |
|---|---|
| CRWV | 3.600% |
| GOOGL | 3.527% |
| AAPL | 1.892% |
| AMZN | 1.616% |
| META | 0.855% |
| NVDA | -0.974% |
| TSLA | -1.001% |
| MSFT | -1.319% |
| ANET | -1.798% |
| AVGO | -2.063% |
CRWV and GOOGL stand out as the strongest performers, posting gains of 3.600% and 3.527% respectively. These significant single-day moves likely reflect strong buying interest or positive catalysts specific to those equities on this particular day. AAPL, AMZN, and META also closed in positive territory, albeit with more modest gains, suggesting a degree of underlying demand. While these positive movements are notable, a single day’s performance is insufficient to establish a clear bullish trend or a change in existing trends. It is a discrete data point that, in isolation, cannot reliably forecast future price action; a reversal in the next session is roughly an even chance without further context.
Conversely, AVGO and ANET experienced the most substantial declines, registering losses of -2.063% and -1.798%. These movements likely indicate concentrated selling pressure during the session. MSFT, TSLA, and NVDA also closed lower, reinforcing a bearish sentiment for these particular stocks on the day. While these declines suggest short-term weakness, without volume analysis or a historical price series, it is difficult to determine if these are significant bearish reversals, minor pullbacks within an uptrend, or continued depreciation within a downtrend. A continuation of selling pressure is a possibility, but a bounce-back is also plausible, especially if these declines are attributed to profit-taking.
Given the inherent limitations of a single data point for each equity, the conclusions drawn are inherently preliminary. These daily percentage changes represent a snapshot of relative strength and weakness for a specific trading session. For rigorous technical analysis, including trend identification, support/resistance levels, chart pattern recognition, and indicator analysis (e.g., moving averages, RSI, MACD), extensive historical price and volume data would be indispensable. Without such data, any projection of future price action carries significant uncertainty, and traders should treat these figures as purely observational for the specified period.
Good morning, traders. Our technical review of the market data for November 20th and 21st, 2025, reveals a bifurcated market sentiment among the observed assets. The first day, November 20th, largely presented significant selling pressure across many names, characterized by large red candlesticks often closing near their daily lows on notable volume. This initial broad-market weakness set a bearish tone. However, the subsequent day saw a divergence, with some assets continuing their downward trajectory while others exhibited signs of potential short-term stabilization or reversal.
A significant cohort of stocks, including TSLA, MSFT, NVDA, AVGO, and ANET, displayed a continuation of bearish momentum over the two-day period. TSLA and MSFT both printed two consecutive red candles, with prices trending lower and closing near daily lows. NVDA, AVGO, and ANET showed particularly robust selling pressure, marked by deep red candles on November 20th followed by further declines on November 21st. For NVDA and AVGO, the second day’s closing price was below the first day’s low, signaling an intensifying downtrend, with volume either maintaining high levels or increasing, which reinforces the bearish conviction. ANET notably experienced a significant increase in volume on its second down day, pushing to new lows, indicating a high likelihood of continued downward pressure for these particular symbols in the immediate term.
Conversely, a distinct group of assets demonstrated patterns indicative of potential short-term reversals or strong stabilization efforts. AAPL, META, GOOGL, and AMZN all experienced strong selling on November 20th, similar to their peers. However, on November 21st, each of these symbols formed a green candlestick, recovering a significant portion, or in some cases, more than half, of the previous day’s decline. META and AMZN, in particular, formed what appears to be bullish piercing patterns, where the second day’s open was below the first day’s close, but the close was well within the body of the previous bearish candle. GOOGL’s rebound was also strong, characterized by a notable gap-up open from its prior close and a substantial increase in volume on the upward move. This increase in volume accompanying the price recovery suggests a likely absorption of selling pressure and a potential shift in short-term sentiment, making continued consolidation or minor upward corrections likely for these stocks.
The remaining symbol, CRWV, presents a more ambiguous outlook. Following a very strong bearish candle on November 20th, November 21st produced a green candle that managed to close above its open but still significantly below the prior day’s open. The volume accompanying this modest rebound was slightly lower than the prior day’s selling volume. This price action suggests a roughly even chance for either a temporary pause and minor rebound within an ongoing downtrend, or a retest of the strong support implied by the lower shadow of the November 21st candle. Without further data, a strong bullish reversal appears unlikely given the preceding aggressive sell-off and diminished volume on the recovery. Overall, the market’s immediate trajectory appears to be bifurcated, with significant downside pressure likely to persist in several key names, while others may experience a period of recovery or consolidation.
Performance Heatmap (TSLA, MSFT, AAPL, META, NVDA, AVGO, GOOGL, AMZN, CRWV, ANET)
Generated for 2days timeframe analysis
S&P 500 Sector Breadth
| Symbol | Daily Percent Change |
| :----- | :------------------- |
| XLB | 2.273% |
| XLV | 2.167% |
| XLY | 1.999% |
| XLC | 1.709% |
| XLRE | 1.338% |
| XLI | 1.245% |
| XLP | 1.103% |
| XLF | 1.095% |
| XLE | 0.642% |
| XLK | 0.389% |
| XLU | 0.114% |
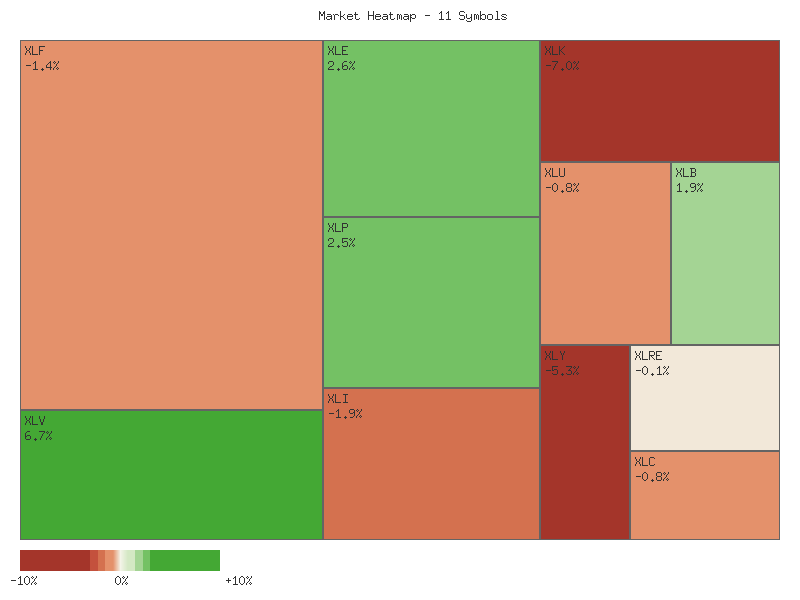
An analysis of the provided market data for the S&P 500 sectors reveals a broadly positive trading session. The market breadth is exceptionally strong, as all eleven observed symbols (XLP, XLRE, XLI, XLU, XLV, XLY, XLF, XLB, XLE, XLC, XLK) recorded positive daily percentage changes. This translates to 11 advancing symbols and 0 declining symbols, a condition that suggests robust upward momentum across the market segment under review.
Reviewing the performance across offensive and defensive sectors, all four defensive sectors (XLU, XLP, XLV, XLRE) experienced advances, with XLV (Healthcare) exhibiting particularly strong performance at +2.167%. Similarly, all seven offensive sectors (XLK, XLY, XLF, XLI, XLB, XLE, XLC) also closed positively, led by XLB (Materials) at +2.273% and XLY (Consumer Discretionary) at +1.999%. The universal positive movement across both offensive and defensive categories makes it unlikely that a distinct rotation *between* these groups is occurring. Instead, the data primarily indicates a broad-based market rally where all sectors are participating in the upside.
The overall market sentiment, based solely on this technical data, appears strongly positive. The significant advances in key offensive sectors like Materials (XLB) and Consumer Discretionary (XLY) suggest a fair probability of increasing risk appetite among investors. However, the robust performance of a typically defensive sector such as Healthcare (XLV) simultaneously indicates that investors are not entirely abandoning areas of perceived stability. An alternative scenario could involve a concentrated rally in only a few sectors, but the data does not support this; rather, it portrays a highly unified positive movement.
Given the uniform positive performance across all observed sectors, the technical picture suggests a market environment characterized by widespread bullishness. There is a strong probability that this broad advance reflects a generalized optimism rather than a sector-specific theme. Investors are likely engaging across the spectrum of the market, which could imply a period of broad accumulation rather than a focused shift in capital flows between offensive and defensive positions.
Analysis of the two-day price action across eleven SPDR sector ETFs reveals a market environment characterized by initial broad-based selling pressure on November 20th, followed by a mixed and somewhat tentative rebound on November 21st. The initial session on November 20th was marked by significant bearish candlesticks in a majority of sectors, including Technology (XLK), Industrials (XLI), Health Care (XLV), Consumer Discretionary (XLY), Financials (XLF), Materials (XLB), Energy (XLE), Communication Services (XLC), Real Estate (XLRE), and Utilities (XLU). Consumer Staples (XLP) was a notable outlier, exhibiting bullish price action on the first day. This widespread decline suggests that market participants likely engaged in risk-off behavior or profit-taking across many segments to start the period.
On November 21st, several sectors demonstrated patterns indicative of potential bullish reversals or continuation. Consumer Staples (XLP) advanced for a second consecutive day with increasing volume, suggesting a likely continuation of its upward momentum. Health Care (XLV) formed a compelling bullish engulfing pattern with rising volume, indicating a high likelihood of a near-term bullish reversal. Similarly, Materials (XLB) also printed a bullish engulfing pattern, although with slightly decreased volume on the second day, suggesting a moderate likelihood of upward price movement. Real Estate (XLRE) and Communication Services (XLC) both closed higher on the second day with increased volume, signaling a likely bullish continuation for these sectors.
Conversely, other sectors exhibited more ambiguous or weaker rebound signals. Technology (XLK) and Industrials (XLI), both experienced substantial declines on November 20th, followed by comparatively small bullish candles on November 21st. The volume accompanying these rebounds was lower than the preceding bearish day, suggesting a limited conviction from buyers; it is roughly an even chance that these sectors could see renewed selling pressure or continued consolidation. Financials (XLF) formed a piercing pattern with high volume, which typically indicates a moderate likelihood of a bullish reversal. However, the second day’s high remained below the first day’s open, implying that overhead resistance may cap immediate upside. Consumer Discretionary (XLY) also showed a bullish close after a sharp decline, but with noticeably decreased volume, making its reversal signal less convincing. Energy (XLE) and Utilities (XLU) showed minor bullish closes, but their overall price action on November 21st did not strongly negate the prior day’s bearish sentiment, making a clear directional bias unlikely from this limited data.
Given the disparate price action, the immediate market outlook, based solely on this two-day data, appears bifurcated. Sectors like Health Care, Consumer Staples, Materials, Real Estate, and Communication Services are likely to exhibit relative strength in the very near term. However, the subdued or weakly supported rebounds in Technology, Industrials, and Consumer Discretionary suggest that broader market conviction for a sustained upward move may be lacking. An alternative scenario would be that the market undergoes further consolidation in the more heavily weighted growth sectors, or that the bearish momentum from November 20th could reassert itself, particularly if the initial rebound attempts fail to attract stronger buying interest. Traders should observe subsequent price action for confirmation of these short-term trends and potential re-engagement of selling pressure in the weaker sectors.
Performance Heatmap (XLP, XLRE, XLI, XLU, XLV, XLY, XLF, XLB, XLE, XLC, XLK)
Generated for 2days timeframe analysis
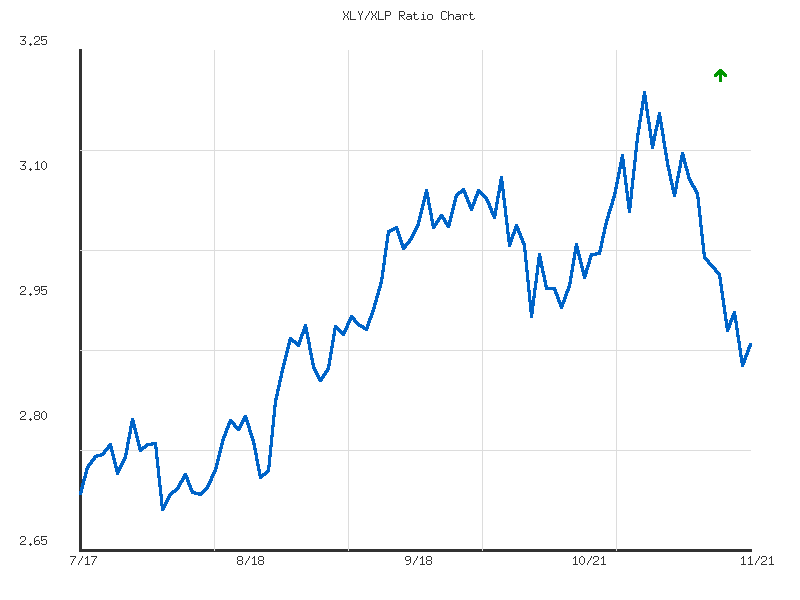
XLY vs XLP
The XLY/XLP ratio has exhibited a clear downtrend over the observed seven-day period. Starting at 3.0005 on November 13th, the ratio has consistently trended lower, closing at 2.8945 on November 21st. This downward movement suggests a short-term shift in market preference away from the Discretionary sector (XLY) and towards the Staples sector (XLP). The initial decline was relatively steep, moving from 3.0005 to 2.9120 by November 18th, representing a significant portion of the total observed drop within the first half of the period. This pattern is often interpreted as a rotation out of riskier, growth-oriented sectors into more defensive ones, especially within a short timeframe.
The total decline for the seven days amounts to approximately 3.53%, categorized as a “moderate” downward trend. This moderate strength indicates that while the downtrend is discernible, it is not yet an extreme, capitulatory move. The ratio’s value currently sits near its seven-day low of 2.8691, achieved on November 20th. This proximity to the recent low suggests that the bearish momentum in the ratio is likely to persist in the immediate term, unless a significant catalyst for a reversal emerges. We assess that the probability of the ratio continuing its downtrend in the very near future is higher than a sharp, sustained rebound, given the established negative directional momentum.
The ratio’s average over this period was 2.9398. The current ratio of 2.8945 is notably below this average, reinforcing the perception of short-term underperformance by XLY relative to XLP. The high for the period was 3.0005, and the low was 2.8691. The current position at 2.8945 is approximately 19.35% above the absolute low for the observation window. This indicates that while the ratio is currently trading near its lows, there has been a slight bounce from the lowest point on November 20th, which could represent minor profit-taking or short-term support. However, this small recovery is currently insufficient to alter the overarching downward trajectory.
The volatility metric for this period is quite low at 0.0022. Low volatility within a trend often suggests a relatively orderly move without extreme price swings, which can lend credence to the trend’s sustainability. Considering the moderate downward trend and low volatility, a continuation of XLY’s underperformance against XLP is likely in the short term. An alternative scenario would involve the ratio finding support near its current levels or previous lows around 2.8691, potentially forming a short-term base. A reversal to an upward trend would probably require the ratio to break back above its average of 2.9398, a development we assess as unlikely in the immediate few days, given the current technical posture. The current data strongly suggests defensive positioning is favored.
Market Commentary: XLY/XLP Ratio (Consumer Discretionary vs. Consumer Staples) - 90-Day Outlook
Over the past 90 days, the ratio of XLY (Consumer Discretionary) to XLP (Consumer Staples) has exhibited an overall upward trend, moving from approximately 2.71 in mid-July to its current level of 2.89. The provided data indicates a “moderate” upward trend with a 6.6% change over the period. This suggests that for a significant portion of the observation window, Consumer Discretionary has outperformed Consumer Staples, reflecting a likely shift in investor sentiment towards growth and away from defensive positions. The average ratio during this period was 2.9309, with a clear peak observed on November 3rd at 3.1994, marking the 90-day high.
However, the recent price action indicates a notable shift in short-term momentum. Following the high reached on November 3rd, the XLY/XLP ratio has experienced a sharp and persistent decline, pulling back to 2.8945 by November 21st. This represents a significant reversal from its peak, suggesting a rapid unwind of earlier strength. The current ratio stands below its 90-day average, indicating that recent performance has been weaker than the overall trend. This sharp retracement suggests that the upward momentum has, at least temporarily, dissipated, and short-term bearish pressure is likely dominant. The volatility, measured at 0.0183, while not exceptionally high, has likely picked up during this recent decline.
From a technical perspective, the current ratio of 2.8945 is situated near a previous support zone observed in late August and early September, where the ratio consolidated before its significant push higher. A retest of this level as support is currently underway. A sustained bounce from this area would suggest that the recent decline is merely a significant correction within the broader 90-day uptrend, making a retest of the average ratio (2.9309) or the psychologically important 3.00 level a roughly even chance. However, the overhead resistance at the 3.00-3.05 area, formed during October and November, is likely to be a formidable barrier if a rebound materializes.
Considering alternative scenarios, if the current support zone around 2.89 fails to hold, a further move lower is highly likely. The next significant support levels would be around 2.75-2.80, which acted as consolidation areas in late July and early August. A decisive break below these levels could signal a potential breakdown of the entire 90-day uptrend and would increase the likelihood of targeting the 90-day low of 2.6957. Traders should monitor price action around the 2.89 support closely; a clear reversal pattern or a breakdown below this level will provide critical clues regarding the ratio’s intermediate-term direction.
Ratio Analysis: XLY/XLP
Generated for 90days timeframe analysis
Equity Breadth
The market breadth indicators for the S&P 500 over the past seven days exhibit a period of substantial deterioration followed by a notable rebound. The percentage of S&P 500 members trading above their 50-day moving average (SPXA50R) and their 200-day moving average (SPXA200R) both commenced the period in a declining phase, suggesting a weakening participation in the underlying index. This weakening trend persisted for a majority of the observed timeframe, culminating in a low point on November 20th, 2025, before a distinct recovery on the final day, November 21st, 2025. This pattern suggests a potential short-term shift in market dynamics, though the prior weakness remains a significant contextual factor.
Examining the SPXA50R, the indicator began at 44% on November 13th, 2025, and experienced a consistent and steep decline over the subsequent six trading days, reaching a low of 29.6% on November 20th. This sharp contraction in the number of S&P 500 constituents above their 50-day moving average signals a pronounced and widespread short-term selling pressure or consolidation across a significant portion of the index. Such a decline in short-term breadth is often indicative of increasing vulnerability in the broader market. However, the final trading day, November 21st, witnessed a substantial recovery to 41.2%, representing a gain of approximately 11.6 percentage points. This rebound strongly suggests an abatement of the immediate selling pressure and a potential renewal of short-term positive momentum. We judge it likely that this rebound signifies a short-term relief rally or the initiation of a minor bullish phase.
Concurrently, the SPXA200R, a measure of longer-term breadth, mirrored the general trend of its shorter-term counterpart, albeit with a less severe percentage drop. Starting at 53.4% on November 13th, 2025, the indicator trended downwards to 42.6% by November 20th, indicating that an increasing number of S&P 500 components fell below their 200-day moving average. While the decline was not as precipitous as the SPXA50R, it still reflects a material erosion of longer-term technical health, with a significant portion of S&P 500 stocks no longer above their long-term average by the low point. On November 21st, this indicator also showed a firm recovery, rising to 48.6%. This bounce, while significant, did not reclaim the 50% threshold, suggesting that while immediate longer-term selling pressure eased, a roughly even chance exists for the market to continue struggling with its intermediate-to-long-term technical posture.
The parallel movements of both breadth indicators underscore a period of broad market weakness that recently found a floor and rebounded. The sharp decline in SPXA50R followed by a robust recovery suggests that the short-term downtrend may have been exhausted, at least temporarily. However, the SPXA200R’s inability to reclaim the 50% level indicates that while the short-term trend has improved, the longer-term market structure remains somewhat compromised, with a plurality of stocks still below their 200-day moving average. It is likely that the market is experiencing a technical bounce following oversold conditions in the short term. We assess a roughly even chance that this rebound represents a durable shift in sentiment versus a temporary corrective move within a broader weak phase, particularly given that the 200-day breadth remains below the critical 50% mark. Further data is required to confirm whether this recent strength is sustainable or merely a dead cat bounce; however, the immediate technical picture appears to have improved.
SPY Daily
The price action of SPY over the past 90 days indicates an established uptrend, with both the 50-day and 200-day Exponential Moving Averages (EMAs) trending upwards and the 50-day EMA consistently above the 200-day EMA. However, the last seven days have witnessed a significant shift in momentum. From 2025-11-14 to 2025-11-20, SPY experienced a notable decline, culminating in a sharp sell-off on 2025-11-20, closing at .52 with exceptionally high volume of 154.77 million shares. This large bearish candle suggests strong conviction from sellers. The most recent trading day, 2025-11-21, saw SPY open lower at .97 but rebound to close at .04, forming a candle with a long lower shadow and a higher close than its open, also accompanied by high volume (116.22 million shares). This suggests buyers stepped in aggressively at lower price levels, potentially signaling short-term exhaustion of selling pressure.
The moving averages confirm the long-term bullish bias, as the EMA_50 (currently .43) remains well above the EMA_200 (currently .24). This “golden cross” configuration, where the shorter-term EMA is above the longer-term EMA, typically signifies a robust uptrend. Nevertheless, the price has recently broken below the EMA_50 on 2025-11-17 and has remained beneath it, indicating a weakening of the short-term trend. The EMA_50 is now likely to act as immediate resistance. While the overall long-term trend remains positive, the recent penetration of the EMA_50 introduces a degree of short-term caution.
Momentum, as measured by the 14-day Relative Strength Index (RSI), moved sharply from a neutral-to-bearish reading of 48.17 on 2025-11-14 to an oversold level of 35.10 on 2025-11-20. This plunge into oversold territory coincided directly with the pronounced price drop and indicates a significant increase in bearish momentum. The subsequent bounce in price on 2025-11-21 caused the RSI to recover to 41.50. This rebound from oversold conditions is a technical indicator that selling pressure may have temporarily subsided, but the RSI value still resides below 50, indicating that bears maintain some control of the short-term momentum.
Key technical levels for SPY suggest immediate resistance is likely near the EMA_50 at approximately .43. The high of .55 on 2025-11-21 nearly tested this level, reinforcing its importance. Further resistance could be found around the level, which had previously served as support earlier in November. On the downside, immediate support is probable around the - zone, derived from the lows established on 2025-11-20 and 2025-11-21. Should this level be decisively broken, more substantial support is likely to emerge around the rising EMA_200, currently situated near .24.
For a bullish case to develop, SPY would likely need to demonstrate sustained price action above the EMA_50 (.43). A conclusive close above this level, ideally supported by increasing volume, would indicate renewed buying interest and a potential resumption of the short-term uptrend. A subsequent move past previous resistance around , and then the October highs near , would further solidify the bullish outlook, suggesting the recent decline was merely a healthy correction within a broader uptrend. The strong buying response observed on 2025-11-21, manifesting as a hammer-like candle, makes a near-term bounce a plausible development.
Conversely, a bearish case would gain momentum if SPY fails to reclaim the EMA_50 and subsequently breaks below the crucial - support zone. A confirmed breach of this level, particularly on elevated volume, would suggest the selling pressure is reasserting itself and would make a decline towards the robust EMA_200 support at .24 highly probable. If the EMA_200 also fails to hold, it would indicate a significant deterioration of the overall trend, shifting the long-term outlook to bearish and opening the door for further downside toward earlier support levels.
A neutral case appears roughly even in the immediate term, with SPY potentially consolidating within a range bounded by the - support and the EMA_50 resistance around . This scenario would reflect ongoing indecision following the recent volatility. Technically, sentiment drivers contributing to this neutral stance include the recent relief bounce from oversold RSI conditions, counterbalanced by the persistent overhead resistance from the EMA_50 and the significant selling volume observed on 2025-11-20. The high volume on both the sharp decline and subsequent bounce suggests a battle between buyers and sellers where neither side has yet established dominant control, making a sideways trading pattern a probable outcome.
Technical Market Commentary: SPY (90-Day Analysis)
Our analysis of the provided 90-day daily candle data for SPY reveals distinct phases in price action, initially characterized by a robust uptrend that transitioned into a notable downtrend in late October and November. From mid-July through late October, SPY experienced a significant ascent, moving from the low to establish a peak near .70 on October 29th. This upward momentum was often accompanied by fluctuating but generally healthy volume. Following this peak, the market entered a period of clear selling pressure, culminating in a sharp decline in November. The most recent price action indicates SPY closing at .04 on November 21st, significantly below its late October high, suggesting a shift in short-term sentiment from bullish to bearish dominance.
The Relative Strength Index (RSI_14_DAY) closely mirrored price movements throughout the 90-day period. During the strong uptrend from August to October, RSI consistently remained in bullish territory, frequently entering overbought conditions (above 70) which typically signals potential for a pullback. Instances such as late July, early September, mid-September, and early October saw RSI above 70, often preceding minor consolidations or brief pullbacks before the trend resumed. The recent decline in price is clearly reflected in the RSI, which plummeted from the high 60s/low 70s in late October to a low of 35.10 on November 20th. This movement indicates substantial bearish momentum, bringing RSI close to, but not definitively into, oversold territory (below 30). The slight bounce to 41.50 on November 21st, coupled with price recovery, suggests that the immediate selling pressure may be abating, or that buyers are beginning to test support levels.
Volume analysis provides further insight into the conviction behind these price movements. The significant price drop on October 10th, from .95 to .02, occurred on a massive volume spike of over 156 million shares, strongly suggesting widespread selling interest. Similarly, the sharp decline on November 20th, pushing prices to .52, also saw exceptionally high volume exceeding 154 million shares, reinforcing the bearish conviction. The subsequent rebound on November 21st, closing at .04, was likewise on high volume (over 116 million shares), which suggests some level of buying activity emerged at lower prices. It is pertinent to note that while the analysis was requested for MACD_13_21_DAY, the corresponding data was not provided; therefore, our assessment cannot incorporate MACD insights.
Considering the technical indicators, we assess that the primary scenario for SPY in the immediate short-term is a continuation of the downtrend or, at best, a period of consolidation. The sustained high volume accompanying significant down moves in October and November, particularly the recent breach of the prior October 10th low, signals strong bearish sentiment. The RSI, while having bounced from its lows, remains below the 50-level, indicating that momentum still favors sellers. It is a roughly even chance that SPY could experience a short-term relief bounce, possibly testing the recent resistance around the - area, given the last day’s high-volume rebound and the RSI moving away from oversold conditions. However, a break below the recent November 20th low of .89, particularly on elevated volume, would likely increase the probability of a further decline towards the July-August support range in the low , indicating a more entrenched bearish trend.