Daily Market Technical Analysis
The market exhibited a pervasive bearish reversal on November 20th, characterized by widespread declines across all major indices and S&P 500 sectors on exceptionally high volume. Growth and small-cap segments significantly underperformed, with Technology and Consumer Discretionary sectors showing pronounced bearish engulfing patterns. The VIX “fear index” surged to overbought levels, confirming strong upward volatility momentum and sustained investor apprehension. Relative strength ratios for QQQ/SPY, IWM/SPY, and XLY/XLP are in established downtrends, indicating likely continued underperformance of growth and small-cap sectors. This broad technical deterioration, supported by deteriorating market breadth indicators, makes further downside price action highly likely across equities in the near term. A significant immediate rebound, given the current signals, appears unlikely.
Market Indices
Technical analysis of the provided market data indicates a widespread decline across several key market capitalization segments. The following table summarizes the daily percentage change for each symbol, sorted in descending order:
| Symbol | Daily Percent Change |
|---|---|
| OEF | -1.506% |
| SPY | -1.527% |
| MDY | -1.590% |
| IJR | -1.744% |
| IWM | -1.850% |
| QQQ | -2.352% |
The market breadth for the observed period is unambiguously negative. All six represented exchange-traded funds (ETFs) — covering large-cap (SPY, OEF), mid-cap (MDY), small-cap (IJR, IWM), and technology-heavy (QQQ) segments — registered daily percentage declines. This means there were zero advancing symbols against six declining symbols, strongly suggesting pervasive selling pressure across the broader market rather than localized weakness in a specific sector or market cap. Such unanimous negative breadth is a likely indicator of a significant risk-off sentiment during the analyzed period.
Further examination of the magnitude of these declines reveals a relative underperformance in growth and smaller capitalization segments. The Invesco QQQ Trust (QQQ), representing the Nasdaq 100, experienced the most substantial daily drop at -2.352%, indicating that technology and growth-oriented stocks were arguably hit hardest. Following QQQ, the small-cap Russell 2000 ETFs, IWM and IJR, also demonstrated significant weakness with declines of -1.850% and -1.744% respectively. These movements suggest that while the decline was broad, segments often perceived as higher beta or more sensitive to risk sentiment may have incurred greater losses.
Conversely, the S&P 500 (SPY) and S&P 100 (OEF) exhibited comparatively milder, though still notable, declines of -1.527% and -1.506% respectively. While these represent substantial daily moves lower, they are marginally less severe than the losses seen in QQQ and the small-cap indices. The collective movement of all major market proxies in a negative direction, coupled with the varied degrees of decline across market segments, points to a likely broad-based negative reaction in the market. Without additional historical data or volume analysis, it is difficult to ascertain if this represents an isolated event or the commencement of a more sustained trend; however, the technical picture for this specific period is one of clear and widespread deceleration.
Here is a technical analysis of the provided market data:
The past two trading days, November 19th and 20th, 2025, present a significant and broad-based bearish reversal across major US equity market ETFs: SPY, QQQ, IWM, IJR, MDY, and OEF. While November 19th featured mixed price action, with some indices posting modest gains and others slight declines, November 20th marked a dramatic shift. All tracked ETFs initiated the day with notable price gaps higher, but these initial advances were decisively rejected, leading to sharp, sustained declines throughout the session. This uniform pattern across market capitalizations—from mega-cap OEF to small-cap IJR—signals a pervasive negative change in market dynamics and the widespread emergence of selling pressure.
On November 20th, each ETF displayed a consistent and highly bearish candle formation. Following a significant gap-up open, prices briefly ascended to establish a daily high before an aggressive sell-off took hold. The resulting candles are characterized by a long, dark body extending from the open, concluding near the day’s low. Crucially, every ETF closed below the low established on November 19th. This robust price action, uniformly observed, acts as a powerful technical signal resembling a ‘shooting star’ or a large bearish outside bar, signifying a failed rally and decisive re-establishment of seller control. The substantial increase in trading volume on November 20th for all ETFs, notably SPY (from 84.5M to 154.7M) and QQQ (from 67M to 111.7M), further reinforces the conviction behind this widespread selling pressure.
Considering this broad and high-volume bearish reversal, it is likely that further downward price action will characterize the immediate trading sessions. The collective failure of all tracked indices to sustain initial bullish momentum after a significant gap up suggests an exhaustion of buying interest at higher levels, followed by aggressive profit-taking or new short-selling. The decisive close below the prior day’s low across the board confirms a breakdown of immediate support levels. While a temporary bounce from deeply oversold conditions is not impossible, given the force and breadth of this selling, a significant immediate rebound without further consolidation or a clear bullish reversal pattern appears unlikely. The previously established highs of November 20th, which saw strong rejection, now serve as immediate resistance. The immediate technical picture, based solely on these two days of data, strongly favors the continuation of observed selling momentum.
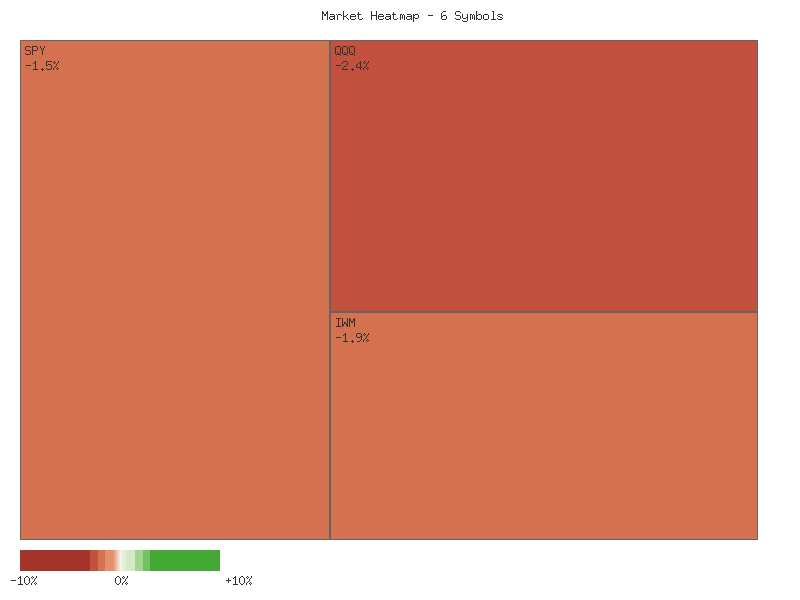
Performance Heatmap (SPY, QQQ, IWM, IJR, MDY, OEF)
Generated for 2days timeframe analysis
SPY Technical Analysis: Nov 20, 2025
The SPDR S&P 500 ETF (SPY) has demonstrated a generally upward trend over the majority of the 90-day period observed, exhibiting a pattern of higher highs and higher lows through late October. However, recent price action indicates a material shift in market dynamics. The period from late October through November 20th reveals a significant downturn, culminating in a sharp decline on the final day of the provided data. The closing price of 652.52 on November 20th was accompanied by a wide-range bearish candle on exceptionally high volume, totaling 154.77 million shares. This substantial increase in selling pressure on a downward price move suggests significant bearish conviction and a notable change from the preceding upward trajectory. The magnitude of this volume accompanying the decline makes it unlikely that this is merely a minor correction.
The 14-day Relative Strength Index (RSI) has consistently signaled shifts in momentum throughout the review period. During strong upward price phases, such as in late July, mid-September, and late October, RSI frequently entered overbought territory (above 70). Each instance was subsequently followed by a period of price consolidation or pullback, indicating that bullish momentum tended to exhaust near these levels. Conversely, the RSI retreated during corrective phases. The most recent RSI readings are particularly noteworthy: a decline from 69.71 on October 29th to 35.10 on November 20th. Although a brief bounce occurred, the RSI again registered 35.10 on November 20th, confirming that bearish momentum remains robust. This level is considered strongly oversold, suggesting that price has experienced significant downward pressure in a relatively short period.
The sharp price decline on November 20th, occurring on the highest volume observed within the 90-day data set, strongly reinforces the bearish conviction evident in price action. While RSI is deeply oversold at 35.10, such extreme readings often precede at least a short-term technical rebound as selling pressure momentarily abates. Therefore, there is roughly an even chance that SPY could experience a relief bounce in the immediate future. However, given the sustained downtrend from late October highs and the decisive breakdown confirmed by the high-volume selling on November 20th, any such bounce is likely to encounter considerable overhead resistance. A failure to sustain any rebound, especially if accompanied by diminishing volume, would reinforce the prevailing bearish sentiment. Conversely, a strong rally on increasing volume, pushing the RSI back above the 50-level, would be required to challenge the current bearish outlook. Based on the provided technical data, the combination of falling prices, elevated selling volume, and deeply oversold RSI indicates a high probability of continued short-term volatility.
SPY Price & Indicators (RSI_14_DAY, MACD_13_21_DAY)
Technical Analysis of QQQ (July 16, 2025 - November 20, 2025)
QQQ’s price action over the past 90 days indicates a dynamic shift from an initial bullish trend to a recent pronounced bearish phase. From mid-July to early August, QQQ demonstrated a notable uptrend, climbing from approximately to nearly . During this period, the 14-day Relative Strength Index (RSI) consistently registered in overbought territory, often above 70, peaking at 73.11 on July 28. This suggests strong buying interest and momentum. However, this ascent was followed by a sharp two-day decline on July 31 and August 1, accompanied by a significant increase in trading volume (64.6M and 69.4M shares respectively) and a precipitous drop in the RSI to 48.26. This swift reversal, confirmed by elevated volume, likely represented a period of profit-taking or short-term distribution, temporarily alleviating the overbought conditions.
Following the early August dip, QQQ found support and resumed an upward trajectory, establishing new highs through late September and early October, eventually reaching above . The RSI frequently returned to overbought levels during this rally, notably between September 18-22 and October 1-8, peaking at 75.35 on September 22. This further corroborated the robust bullish momentum. A significant interruption occurred on October 10 with a sharp price decline, marked by a large bearish candle and the highest trading volume up to that point in the dataset (94.4 million shares). This high-volume sell-off triggered a substantial drop in the RSI to 45.42, indicating a sudden and considerable shift in short-term sentiment, strongly suggesting significant selling pressure entered the market.
Despite the pronounced October 10th sell-off, QQQ mounted a recovery into late October, achieving a new all-time high of approximately on October 29. The RSI again reflected overbought conditions just prior to this peak, reaching 71.73. However, this peak proved unsustainable, giving way to a definitive and sustained downtrend throughout November. The price has consistently registered lower highs and lower lows, breaking below several potential support levels identified by prior consolidations. Crucially, the selling pressure during November has been consistently robust, with trading volumes frequently exceeding 60-70 million shares and culminating in the highest volume candle of the entire period on November 20 (111.7 million shares) coinciding with a sharp decline. This persistent high volume on down days strongly indicates continued distribution and reinforces the bearish conviction.
Currently, the 14-day RSI, which signaled overbought conditions at the late October peak, has undergone a rapid and sustained decline, reaching 35.35 on November 20. While this value does not yet indicate classic oversold conditions (typically below 30), the speed and magnitude of its decline, coupled with the price action, likely suggest that bearish momentum is firmly in control. The exceptionally high volume on the most recent bearish candle (November 20) provides further technical confirmation of strong selling pressure. Based on the confluence of consistent lower prices, increasing volume on down moves, and a rapidly falling RSI, a continuation of the current downtrend or a period of consolidation at lower price levels appears probable in the immediate term. An alternative scenario might involve a short-term oversold bounce if the RSI continues its descent into the sub-30 range; however, there is currently no technical indication of such a bounce, and significant resistance would likely exist at prior support levels. It is important to note that the requested MACD data was not provided in the dataset, thus precluding its inclusion in this analysis.
QQQ Price & Indicators (RSI_14_DAY, MACD_13_21_DAY)
Technical Analysis of IWM (Russell 2000 ETF) - 90-Day Outlook
This analysis of the iShares Russell 2000 ETF (IWM) focuses exclusively on the provided 90-day price action, 14-day Relative Strength Index (RSI), and considers the absence of MACD data. The period under review spans from mid-July to late November 2025.
Over the 90-day period, IWM exhibited a multi-phase price action. From mid-July through early August, IWM primarily traded within a consolidation range between approximately and , with the 14-day RSI remaining largely neutral, dipping briefly into oversold territory around 41.36 on August 1st, coinciding with a price low. Subsequently, a robust uptrend emerged from mid-August, propelling IWM from roughly to peak at .77 by mid-October. This bullish phase was consistently supported by the RSI, which frequently entered overbought conditions (e.g., 67.43 on August 22nd, 71.23 on September 18th, 68.07 on October 6th), confirming strong upward momentum. Notably, a sharp price decline on October 10th (from .885 to .79), accompanied by the highest volume seen in the early part of the data series, resulted in a significant drop in RSI to 44.97, suggesting a temporary exhaustion of buying pressure, though the recovery was swift.
The momentum shifted distinctly in late October, marking the beginning of a pronounced downtrend. From a high near on October 27th, IWM has experienced a consistent decline, trading as low as .14 by November 20th. This downward movement is characterized by lower highs and lower lows, which is a classic technical signature of a bearish trend. The volume data during this recent decline period is particularly noteworthy; trading volume on November 13th, 14th, 17th, 18th, 19th, and especially on November 20th (93,836,248 shares), was significantly elevated, often reaching some of the highest levels observed in the entire 90-day window. This increased selling volume during a downtrend suggests that selling pressure is significant and conviction behind the bearish move is likely strong.
As of the last data point on November 20th, the 14-day RSI stands at 32.63, indicating that IWM is approaching oversold conditions, having declined steadily from 58.76 on October 27th. While an oversold RSI could suggest that a short-term bounce or consolidation is a roughly even chance, the persistent heavy selling volume on recent down days, particularly the capitulation-like volume on November 20th, increases the likelihood of continued near-term downside or at least a period of further consolidation before a sustainable recovery effort. The current close (.14) is also near the low of the day (.90), reinforcing the immediate bearish sentiment. Alternative scenarios include a minor dead cat bounce, which is plausible given the RSI’s current level, but such a rebound would likely be met with resistance from recently established lower highs.
It is important to note that the requested MACD (13, 21-day) data was not provided. The absence of this key momentum and trend-following indicator limits the completeness of this technical analysis, as MACD crossovers, divergence signals, and its relationship to the zero line would offer additional critical insights into the strength, direction, and potential duration of the current trend. Without MACD, the assessment of underlying momentum is less robust than it would otherwise be. Based solely on the available price and RSI data, the immediate outlook for IWM is bearish, with a retest of previous significant support levels, potentially in the - range or even lower towards the August lows, being a likely scenario.
IWM Price & Indicators (RSI_14_DAY, MACD_13_21_DAY)
VIX Fear Index
The VIX has exhibited a distinct bullish trend over the observed seven-day period. Starting at 17.48 on November 12th, the index has systematically progressed to a close of 26.41 on November 20th. This advance was initiated by a strong bullish engulfing candle on November 13th, propelling the VIX above 20.00. Subsequently, the price action generally formed higher lows and higher highs, suggesting sustained buying pressure.
Amidst this upward trajectory, there were observable instances of resistance. On November 14th, the VIX encountered rejection near the 23.00 level, forming a bearish candle with a long upper wick. Similarly, on November 17th and 19th, despite closing higher or showing intraday strength, prominent upper wicks indicated a degree of selling pressure or profit-taking at elevated levels. However, these pullbacks or rejections proved temporary, as the underlying bullish momentum typically reasserted itself, pushing prices to new highs within the observed window.
The most recent trading day, November 20th, delivered a particularly strong bullish signal. Despite gapping down significantly at the open from the previous day’s close, the VIX staged a powerful intraday rally, eventually closing near its daily high of 28.27 at 26.41. This substantial rebound from initial weakness, combined with an 11.62% daily percentage change, points to considerable demand and a decisive shift in sentiment during the session. The close marks the highest point in this seven-day series, reinforcing the strength of the current uptrend.
Considering the pronounced bullish close and the strong daily percentage gain on November 20th, continued upward pressure on the VIX is likely in the immediate term. The robust intraday reversal from a gap-down open suggests that buyers are aggressively stepping in. However, given the rapid ascent and previous instances of minor resistance (as indicated by upper wicks), a period of consolidation or a minor pullback to test newly established support levels is a roughly even chance. A sharp reversal that significantly undermines the current uptrend immediately following such a strong bullish candle is unlikely. The absence of volume data, however, limits the ability to confirm the conviction behind these price movements, adding a degree of uncertainty to the strength of potential continuation or reversal patterns.
Here is a technical analysis of the VIX, RSI_14_DAY, and MACD_13_21_DAY based solely on the provided data for the past 90 days.
The VIX data for the past 90 days indicates a pronounced shift in market volatility dynamics, particularly in the most recent period. From mid-July to early October, the VIX largely traded within a range, typically fluctuating between the mid-14s and high-17s, punctuated by occasional sharp but brief spikes into the 20-22 range (e.g., August 1st at 20.38, October 10th at 21.66). These earlier spikes were generally followed by a relatively swift return to lower volatility levels, suggesting transient periods of market uncertainty. However, the data from late October through November exhibits a more sustained upward momentum. The VIX has seen a series of higher lows and higher highs, culminating in a recent close of 26.41 on November 20th, with an intraday high reaching 28.27. This represents a significant increase in observed market volatility compared to the preceding months and suggests growing investor apprehension.
Accompanying the VIX price action, the 14-day Relative Strength Index (RSI) provides further insight into momentum. During earlier VIX spikes, such as on August 1st and October 10th, the RSI quickly moved into overbought territory (above 70, reaching 65.38 and 73.09 respectively), then rapidly retreated. This pattern previously indicated that VIX’s upward moves, though sharp, lacked sustained buying pressure. In contrast, the current period shows a different behavior. The RSI began to ascend steadily from late October, moving from the mid-40s into the 50s and 60s throughout November. By November 18th, the RSI registered 69.58, and on November 20th, it climbed to 71.67. This sustained entry into overbought territory, coupled with the consistent upward trend in VIX, suggests that the current volatility surge has stronger underlying momentum than previous instances.
Given the observed patterns, it is likely that the VIX could experience continued upward pressure in the near term. The VIX closing at 26.41, combined with the RSI firmly in overbought territory at 71.67, strongly indicates a robust short-term uptrend. While an RSI above 70 typically signals an overbought condition and can precede a price correction or consolidation, the persistent nature of this VIX advance, as evidenced by the series of increasing closes in November, lessens the probability of an immediate, sharp reversal. Historically, when VIX sustains an overbought RSI alongside rising price, it can signal an extended period of heightened market uncertainty rather than just a fleeting spike.
Considering alternative scenarios, there is a roughly even chance that the VIX could either consolidate around current elevated levels or experience a minor pullback due to the extended overbought condition indicated by the RSI. However, the current momentum makes a significant and immediate return to sub-20 levels unlikely without a clear catalyst for reduced market uncertainty. Traders should be aware that the bullish trend in VIX, supported by sustained momentum from the RSI, suggests that market sentiment remains cautious or fearful. It is important to note that analysis of the MACD_13_21_DAY indicator could not be performed as the relevant data was not provided; therefore, this assessment is based solely on VIX price action and RSI, which are generally aligned in their current indications.
VIX Price & Indicators (RSI_14_DAY, MACD_13_21_DAY)
Tech Sector Analysis
The provided 14-day data for the RATIO:QQQ/SPY clearly indicates a persistent downtrend in the relative performance of the NASDAQ-100 (QQQ) against the broader S&P 500 (SPY). Beginning the period on November 3rd with a ratio of approximately 0.9250, the ratio has systematically declined, closing at its lowest point of 0.8976 on November 20th. This represents a relative underperformance for QQQ by nearly 3% over the observed two-week span. This consistent downward trajectory strongly suggests that the S&P 500 has been outperforming the technology-heavy NASDAQ-100, indicating a likely rotation out of or decreased interest in the sectors heavily weighted within QQQ.
Analyzing the microstructure of this downtrend, we observe a pattern of lower highs and lower lows, which is a classic characteristic of bearish price action. Despite the clear direction, the data classifies the trend strength as “weak” with relatively low volatility. This implies that while QQQ is underperforming, the selling pressure relative to SPY has been gradual rather than aggressive. There were instances of minor relative strength bounces, for example, from November 7th to November 10th and briefly from November 18th to November 19th. However, these proved to be temporary consolidations, with the ratio ultimately resuming its decline to establish new lows. The present ratio of 0.8976, being the lowest recorded in this dataset, underscores that the prevailing short-term bearish relative momentum for QQQ remains intact.
Considering the established trend and current technical posture, it is likely that QQQ will continue to underperform SPY in the immediate short-term, particularly if the 0.8976 level proves to be a weak support. The low volatility suggests that any potential reversal in relative strength would likely develop gradually rather than abruptly. An alternative scenario would involve the ratio finding a floor around its current low, consolidating, and potentially forming a base for a bounce in relative performance. However, based solely on the provided technical data, there is no robust evidence to suggest such a reversal is imminent. A sustained move and close above the minor resistance observed near 0.9050 would be required to suggest a roughly even chance of a short-term shift in the relative performance dynamics. Until such a development, the path of least resistance for the RATIO:QQQ/SPY appears to be downwards.
Here is a technical analysis of the QQQ/SPY ratio over the past 90 days, based solely on the provided data.
The QQQ/SPY ratio, reflecting the relative performance of the technology-heavy Nasdaq 100 (QQQ) against the broader S&P 500 (SPY), has exhibited notable volatility and distinct directional phases over the past 90 days, from mid-July to mid-November. Initially, from mid-July through early September, the ratio generally indicated relative weakness or consolidation for QQQ. This period saw the ratio predominantly hover below the 0.90 mark, with a significant low recorded at approximately 0.8834 on September 2nd. This established a critical support level where QQQ’s underperformance relative to SPY was most pronounced. Subsequently, a strong reversal emerged, initiating a clear uptrend through September and October. This phase indicated a surge in relative strength for QQQ, with the ratio breaking above 0.90 and steadily climbing to its 90-day peak of 0.9250 on November 3rd. This sustained outperformance suggested a prevailing bullish sentiment favoring growth-oriented sectors during that two-month span.
However, the positive momentum for QQQ relative to SPY definitively concluded following the November 3rd peak. The subsequent data reveals a sharp and sustained reversal, with the ratio entering a pronounced downtrend over the last few weeks. The QQQ/SPY ratio has consistently declined, breaking below several previously established support levels, including the 0.92 and 0.91 thresholds. As of the last observed data point on November 20th, the ratio stands at 0.8975. This current level places it below the 90-day average ratio of 0.9003 and closer to the period’s low than its high, strongly suggesting a return to relative weakness for QQQ compared to SPY. The rapidity of this recent decline indicates a considerable unwinding of the prior outperformance, implying a shift in market preference away from QQQ’s constituents in the short term.
From a technical perspective, the 0.92-0.925 zone now appears to be a robust overhead resistance level, marking the recent peak. On the downside, the 0.883-0.888 region, which served as a significant support floor in late August and early September, is likely to be a critical test should the current decline persist. The present ratio of 0.8975 finds itself attempting to hold above an intermediate support formed by previous consolidation areas around 0.89-0.90. Given the strong recent downward momentum, it is probable that the ratio will continue to test lower support levels. A sustained break below the current level of 0.8975 would likely target the 0.888-0.890 area, with a retest of the 0.8834 low being a tangible possibility if bearish sentiment for QQQ relative to SPY prevails. Conversely, an alternative scenario would involve the ratio finding support around the current 0.8975 area or the 0.888-0.890 zone. A successful defense of these levels, followed by a breakout above the 0.90 mark, would suggest stabilization and could lead to a re-evaluation of relative strength. However, overcoming the recent established resistance levels, particularly near 0.91-0.92, appears unlikely in the immediate future without a significant shift in market dynamics. The overall pattern suggests continued caution regarding QQQ’s relative outperformance.
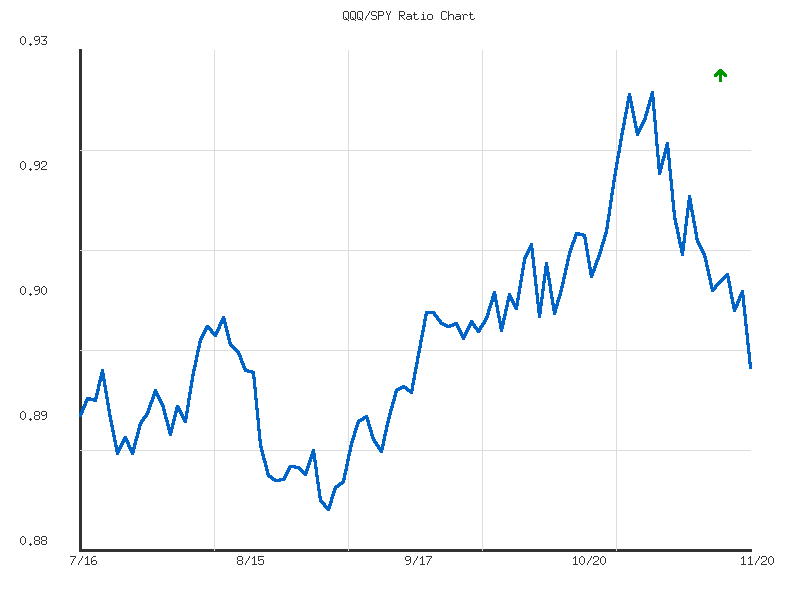
Ratio Analysis: QQQ/SPY
Generated for 90days timeframe analysis
IWM vs. SPY
The IWM/SPY ratio has exhibited a discernible downward trend over the past 14 days, indicating a period where the Russell 2000 has underperformed the S&P 500. The provided trend analysis confirms a ‘down’ direction, although categorized as ‘weak’ in strength. This suggests a gradual, rather than precipitous, erosion of relative performance. The ratio has moved from a high of approximately 0.36118 on November 5th to its current value of 0.35116 on November 20th, marking a -2.22% change over the observation period. This continuous erosion implies that, for the period analyzed, larger capitalization stocks have garnered stronger relative momentum compared to smaller capitalization counterparts.
Examination of the daily data points reveals a consistent pattern of lower highs and lower lows in the ratio after the initial peak. Specifically, the ratio declined to a 14-day low of 0.34969 on November 17th, from which it has seen only minor fluctuations, settling just above this level. The current ratio of 0.35116 is notably below the 14-day average of 0.35580, and its relative position at approximately 12.7% above the lowest point in the observation window suggests that the current bearish momentum for the ratio is unlikely to abate immediately. The volatility of the ratio, recorded at a very low 0.000012237, implies that the decline has been rather orderly and not characterized by sharp, erratic movements, which often lends credence to the established trend.
Given the ‘weak’ trend strength, there is a roughly even chance that the pace of underperformance may moderate in the very short term, possibly leading to a period of consolidation around the current levels. However, a significant reversal in the ratio is unlikely unless it firmly reclaims levels above its recent average of 0.35580. A sustained move below the 14-day low of 0.34969 would probably signify a continuation of IWM’s underperformance relative to SPY with increased conviction, whereas a breach above the average ratio might suggest a temporary stabilization or a potential shift in relative strength dynamics. Without further data beyond the 14-day window, predicting the duration or ultimate extent of this relative trend remains speculative, but the current data strongly favors continued, albeit weak, underperformance of IWM against SPY.
Technical Analysis: IWM/SPY Relative Strength Ratio (90-Day View)
The IWM/SPY relative strength ratio, representing the performance of small-cap stocks (IWM) against large-cap stocks (SPY), has exhibited a complex, yet ultimately constrained, pattern over the past 90 days. While the overall statistical trend summary indicates a “sideways” direction with “weak” strength and a slight negative change of -0.82% for the entire period, the underlying price action reveals distinct phases. Initially, from mid-July to early August, the ratio experienced a noticeable decline from approximately 0.354 to a low around 0.345, signaling a brief period of small-cap underperformance. This was followed by a robust rally from early August, where IWM significantly outperformed SPY, pushing the ratio higher to peak near 0.376 by October 15. This rally represented a clear and sustained shift in market leadership towards smaller capitalization companies during that intermediate period.
However, this period of small-cap outperformance proved to be finite, as the ratio has subsequently entered a significant downtrend since the October 15 peak. The 0.376 level has clearly acted as a formidable resistance, initiating a decisive reversal. Over the past five weeks, the IWM/SPY ratio has consistently registered lower highs and lower lows, indicating renewed and sustained relative weakness for small-caps. The current ratio, at approximately 0.351, is positioned considerably below its 90-day average of 0.3597 and resides near the lower end of its historical range, with a relative position of 0.178. This persistent downward momentum from the mid-October high renders it highly likely that IWM will continue to underperform SPY in the immediate short-term. The recent breakdown below the 0.357-0.358 area, which served as a minor support and previous resistance, further reinforces this bearish technical outlook.
Considering the current downward momentum, the ratio is approaching critical historical support levels. The prior 90-day low, established around 0.345-0.346 in early August, is a key area of interest. It is likely that this level will be tested if the prevailing relative weakness persists. A sustained rebound from this historical support could signal a temporary stabilization or a pause in the underperformance trend. However, a decisive penetration and close below the 0.345 mark would likely indicate a more entrenched period of small-cap underperformance, potentially paving the way for the ratio to seek new lows beyond the observed 90-day data set. An alternative scenario, though currently unlikely given the prevailing short-term trend, would be a significant reversal from current levels, perhaps driven by a short-term oversold condition. In such an event, the ratio might attempt to retest the recently breached 0.357-0.358 resistance zone.
In summary, the technical posture of the IWM/SPY ratio, based exclusively on the provided 90-day data, is indicative of continued bearish relative strength for small-cap equities in the near term. The strong rejection from the 0.376 resistance level and the subsequent five-week downtrend are compelling technical signals. While the broader 90-day period shows an overall sideways movement, the current trajectory is clearly defined by underperformance. The ratio’s current proximity to its 90-day low and its position significantly below the average ratio reinforce this perspective. It is highly likely that the ratio will either continue its descent towards the 0.345-0.346 support area or consolidate around current levels before another potential move lower. A sustained shift back towards IWM outperformance, requiring a break above the 0.358 resistance, appears unlikely without a significant change in the observed momentum. Traders should closely monitor the 0.345-0.346 region for potential support or a decisive breakdown.
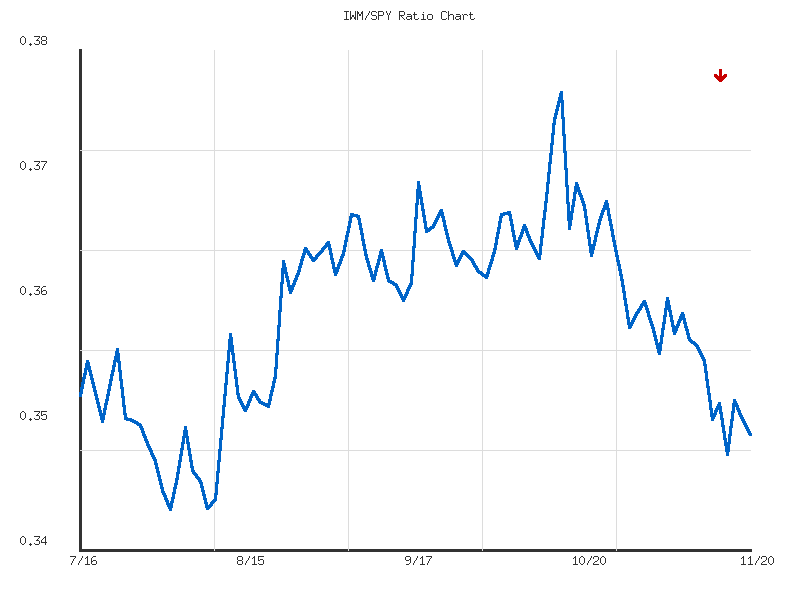
Ratio Analysis: IWM/SPY
Generated for 90days timeframe analysis
Commodities
Below is a technical analysis of the provided market data for the specified commodity-related exchange-traded products.
| Symbol | Daily Percent Change |
|---|---|
| GLD | -0.015% |
| UGA | -0.725% |
| CORN | -0.759% |
| DBC | -0.917% |
| USO | -1.016% |
| CPER | -1.340% |
| SLV | -1.413% |
| UNG | -1.971% |
The market breadth for the examined instruments indicates a definitively negative sentiment for the day. Out of eight symbols, zero advanced, and all eight declined. This breadth, reflecting 0% advancing versus 100% declining, suggests that selling pressure was broadly pervasive across this specific basket of commodity-related assets. We judge it likely that this widespread decline reflects a general aversion to these asset classes during the reporting period. The complete absence of positive performance in any of the tracked instruments signals a significant lack of buying interest, making a bullish reversal for the group in the immediate short-term unlikely based solely on this single day’s action.
Observing the magnitude of the declines, GLD exhibited remarkable relative strength, declining by only -0.015%. This minimal decrease suggests that gold maintained its value considerably better than its peers, likely indicating a defensive posture or flight to perceived safety within the commodity complex, or at least a far weaker selling impetus. In contrast, UNG, representing natural gas, suffered the most substantial loss at -1.971%, positioning it as the weakest performer. Silver (SLV) and Copper (CPER) also experienced notable declines of -1.413% and -1.340% respectively, suggesting that industrial and precious metals beyond gold faced significant downward pressure.
Given the uniform decline across all tracked symbols, we assess it likely that an overarching factor or sentiment influenced these commodity-related markets negatively. While the data does not allow for deeper causal analysis, the pattern itself implies a consolidated bearish trend for this single observation period. Looking forward, continued broad-based weakness across these diverse commodity segments would probably reinforce this bearish sentiment. However, a single day’s data offers limited predictive power, and it is also plausible that this represents an isolated day of profit-taking or sector rotation, with a roughly even chance of a rebound or continued weakness in the next observable period if prior trends were not aligned with this negative momentum.
CMT Market Commentary: Two-Day Commodity ETF Technical Review
This technical analysis reviews the two most recent trading sessions for a selection of key commodity exchange-traded funds (ETFs): SLV, GLD, CORN, CPER, USO, DBC, UGA, and UNG. The immediate market action reveals a predominantly bearish sentiment, with several assets exhibiting strong downside reversal patterns, while others display continued, albeit sometimes nuanced, selling pressure. All observations are based strictly on the provided candlestick and volume data for the specified two-day period, utilizing rigorous technical analysis principles.
A striking pattern of bearish reversal emerged in UNG (Natural Gas), CPER (Copper), and USO (Crude Oil) over the past two sessions. Each of these ETFs completed a bearish engulfing pattern on the second day. For UNG, the second day’s open was significantly lower than the previous close, followed by a close below the first day’s low, signaling robust selling pressure, compounded by increased volume. Similarly, CPER and USO also formed pronounced bearish engulfing candles, with the second day’s decline occurring on notably increased trading volume, which typically reinforces the conviction behind the reversal. Based on these patterns, further downside momentum for UNG, CPER, and USO is likely in the immediate term.
Sustained bearish pressure was also evident in SLV (Silver), CORN (Corn), and UGA (Gasoline). SLV recorded two consecutive bearish candles with lower closes, suggesting a continuation of a downward trend. Although both days presented relatively long lower wicks, indicative of some intraday buying interest, prices ultimately failed to hold. CORN similarly showed two bearish candles closing near their lows, with the second day’s decline accompanied by an increase in volume, reinforcing the bearish outlook. For UGA, two consecutive bearish candles also closed near their lows, indicating persistent selling. However, the trading volume decreased on the second bearish day for UGA, which might imply a roughly even chance of deceleration in the selling force, though continued downward pressure remains likely.
The outlook for GLD (Gold) and DBC (Broad Commodities) presents a more nuanced picture. GLD’s first day closed significantly lower after testing intraday highs, but featured a long lower wick. The second day saw a small-bodied bearish candle, closing only marginally below the first day’s close, and on slightly reduced volume. This pattern suggests indecision after initial selling, indicating a roughly even chance of either a retest of the Day 2 low or a period of consolidation. For DBC, two consecutive bearish candles resulted in lower closes; however, the second day’s decline occurred on significantly reduced volume. This volume contraction on DBC suggests that while selling pressure persists, its intensity may be diminishing, leading to a roughly even chance of consolidation or a minor bounce before a likely continued, albeit potentially slower, decline.
In summary, the immediate technical landscape across these commodity ETFs points toward a dominant bearish bias. The clear bearish engulfing patterns in UNG, CPER, and USO render further declines likely. While SLV, CORN, and UGA also face likely continued downward pressure, the nuanced volume trends in UGA and DBC, coupled with GLD’s indecisive price action, suggest that some assets may encounter periods of consolidation or decelerated selling momentum. Traders should likely anticipate continued weakness in most of these commodity sectors, with specific attention to potential support levels for those exhibiting early signs of waning selling conviction.
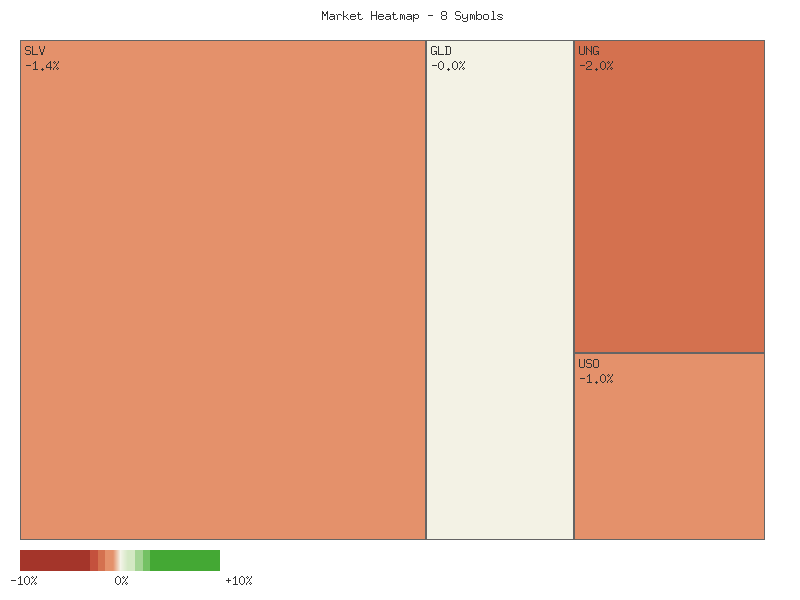
Performance Heatmap (SLV, GLD, CORN, CPER, USO, DBC, UGA, UNG)
Generated for 2days timeframe analysis
Fellow traders, let’s conduct a rigorous technical analysis of the SLV (iShares Silver Trust) based on the provided 90-day candle and 14-day Relative Strength Index (RSI) data.
The provided 90-day data for SLV illustrates a predominant uptrend, initiated from a late July low of approximately .10. Price experienced a strong ascent, culminating in a peak near .40 on October 15. This significant rally was followed by a substantial correction, wherein SLV declined by approximately 14% to a low around .70 by October 27. Subsequently, early November witnessed a renewed bullish push, propelling SLV back to a secondary high of .345 on November 12, effectively retesting the previous peak resistance. However, the latest available data through November 20 shows SLV pulling back from this November high, closing at .7935. This recent downward movement, spanning several trading sessions, suggests an increase in selling pressure following the failed retest of the .40 level.
The 14-day Relative Strength Index (RSI) generally confirmed the price movements. During the robust uptrend from late August through mid-October, RSI consistently registered in overbought territory, frequently exceeding 70 and reaching a peak of approximately 84.32 on October 13. While reflecting strong momentum, these elevated readings also implied an increased probability of an impending price correction, which ensued from October 17, pushing RSI down to a low of approximately 46.51. The subsequent November rally saw RSI return towards overbought levels, reaching approximately 69.08 on November 12. However, the current RSI reading of approximately 54.57 on November 20 indicates a cooling of momentum, residing in a neutral zone. Volume analysis further aids this interpretation; strong rallies in late August, September, and early October were typically supported by increasing volume, suggesting conviction. Conversely, notable price declines, such as on October 9 and 17, were also accompanied by significant volume spikes, indicating substantial selling pressure entering the market during these corrective phases. The recent pullback from November 12 has shown some elevated volume on down days, yet it does not consistently reflect the extreme selling seen in prior major corrections, which might imply a more orderly profit-taking phase.
Analysis of the price structure identifies the .30-.40 region as a critical resistance zone, marked by the clear reversals on October 15 and November 12. The inability to decisively breach this level on two occasions reinforces its significance as a formidable ceiling. Conversely, the .70-.40 area, specifically the October 27 low, appears to serve as a robust support level that successfully contained the prior major correction. Intermediate support is also observed around .30-.80. Given SLV’s current retreat from the key .30-.40 resistance and the normalized RSI, a continuation of the minor corrective phase is likely in the immediate term. There is a roughly even chance that SLV could test the .30-.80 support zone before a potential rebound. An alternative, albeit less likely near-term scenario, would be a swift and forceful breach of the .40 resistance, which would require a significant shift in buying pressure. Conversely, a definitive break below the .70-.40 support would indicate a more substantial bearish shift or a deeper market correction, which currently appears unlikely without stronger confirming technical signals. It is important to note that the absence of MACD data limits a comprehensive momentum and trend strength evaluation.
SLV Price & Indicators (RSI_14_DAY, MACD_13_21_DAY)
Here is a technical analysis of GLD based solely on the provided 90-day candle and RSI (14-day) data:
GLD’s price action over the last 90 days appears to have undergone a significant structural change. From late July, GLD exhibited a protracted and robust uptrend, advancing steadily from approximately to a peak near by mid-October. This upward movement was characterized by generally increasing prices on higher volume days and supported by the Relative Strength Index (RSI), which consistently indicated strong momentum throughout the rally. The current phase, however, suggests a shift, with GLD presently trading around .92, well off its recent high, marking a substantial retracement from its peak.
The initial bullish phase, particularly from late August, saw GLD climb from the low , gaining significant traction as it broke through resistance levels. This rally intensified into September and early October, with several large green candles accompanied by elevated trading volumes, such as on 2025-09-02 and 2025-10-08, underscoring strong buying conviction. However, the period from mid-October witnessed a pronounced reversal. A massive price drop on 2025-10-21, concurrent with one of the highest volumes in the entire 90-day period (over 53 million shares), strongly suggests aggressive selling pressure entering the market and a likely shift in trend direction. Subsequent attempts to recover encountered resistance, while the - area appears to have provided some support during this correctional phase.
Concurrently, the 14-day RSI painted a clear picture of momentum. During GLD’s ascent from late August to mid-October, the RSI consistently registered in overbought territory, frequently exceeding 75 and peaking above 87 on 2025-10-20. This sustained high RSI reading confirmed the strength and persistence of the uptrend. However, the sharp price correction from mid-October led to an equally precipitous decline in the RSI, falling from overbought levels to the low 50s and even touching 47.37 on 2025-11-04. This rapid unwinding of momentum indicated a significant reduction in buying pressure and an increase in selling force. The current RSI reading of 53.55 (as of 2025-11-20) suggests that momentum is largely neutral, hovering near the centerline, and not showing immediate signs of either strong bullish or bearish conviction.
In synthesis, the robust uptrend that propelled GLD higher for several months has likely concluded for the near-term. The severe correction from the mid-October peak, accompanied by substantial volume on down days, strongly indicates a significant shift in market dynamics. GLD is currently attempting to consolidate within a range. It is likely that GLD will continue to consolidate between the established support near and a more immediate resistance level around -. A sustained breach above , supported by increasing volume and a rising RSI back towards overbought conditions, would be required to suggest a resumption of the prior uptrend. Conversely, a retest of the support level is a roughly even chance in the immediate future, especially if current buying interest, as evidenced by recent moderate volumes, wanes further. A decisive breakdown below would increase the probability of further downside, with potential support levels around the - region, based on earlier price consolidation in September. It is important to note that the absence of MACD data from the provided set limits a more comprehensive assessment of trend strength and potential crossovers that could offer additional directional cues.
GLD Price & Indicators (RSI_14_DAY, MACD_13_21_DAY)
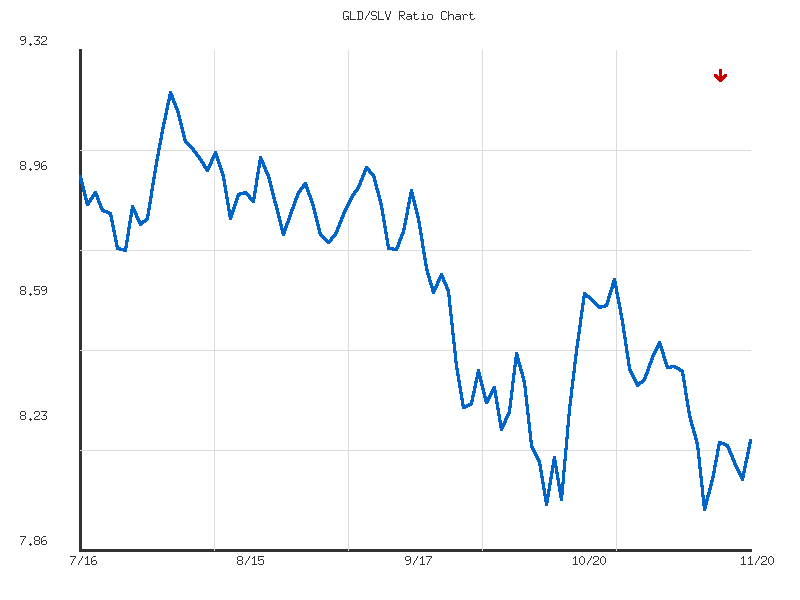
Gold/Silver Ratio
The GLD/SLV ratio has exhibited a weak downward trend over the past 14 trading days, declining by approximately 2.88% from its early-period highs. The ratio began the observation period around 8.42, reaching its peak at 8.473 on November 4th. This initial movement suggested a brief period of gold outperforming silver. Subsequently, the ratio initiated a decline, indicating a shift where silver (SLV) began to show stronger relative performance compared to gold (GLD). The average ratio for this two-week span stands at 8.237, with the current ratio of 8.187 resting marginally below this average, reinforcing the recent shift in relative strength.
The downtrend found a temporary floor at 7.985 on November 12th, which represents the lowest point observed within this 14-day window. Following this low, the ratio experienced a modest rebound, closing the period at 8.187. This rebound from the low suggests a possible, though not definitive, exhaustion of immediate selling pressure on the ratio. The ratio’s current position, indicated by a relative position of 0.413 within its range, confirms it is closer to the recent low than the high. The overall volatility during this short period is low at 0.0224, implying that the observed trend, while downward, has not been characterized by significant price swings.
Considering the weak downward trend, a continuation of silver’s modest outperformance against gold is roughly an even chance. However, the recent bounce from the 7.985 low introduces an alternative scenario where this level could function as short-term support. A sustained move by the ratio above the 14-day average of 8.237 would make a reversal to a weak upward trend more likely, suggesting gold might begin to regain some relative strength against silver. Conversely, a decisive break below the 7.985 support level would make further weakness in the ratio, signifying continued silver outperformance, likely. The weak strength of the observed trend suggests that any immediate directional move, whether continuation or reversal, would likely lack significant momentum.
Technical Analysis: GLD/SLV Ratio (90 Days)
The GLD/SLV ratio has exhibited a clear and sustained downtrend over the past 90 days, indicating a period where silver (SLV) has moderately outperformed gold (GLD). Starting from a ratio near 8.95 in mid-July 2025, the ratio initially saw a brief ascent, peaking at 9.202 on August 1st. Subsequently, the trend shifted decisively downwards, with the ratio experiencing an overall decline of approximately 8.61% to its current level of 8.187. This persistent downward trajectory suggests a rotation of capital favoring silver or relatively stronger price appreciation in silver compared to gold during this period. The moderate strength of this downtrend implies a consistent, rather than precipitous, shift in relative valuations.
Following its peak in early August, the GLD/SLV ratio initiated a prolonged descent. It broke below an observable support area around 8.8-8.9 during late August and early September, signaling increasing bearish momentum. This breakdown led to a subsequent test of lower levels, establishing a new 90-day low of 7.985 on October 13th. This trough represents a significant technical support level within the observed period. The subsequent recovery from this low has been contained, suggesting that while the immediate selling pressure eased, the underlying bearish sentiment for the ratio has largely persisted. The current ratio of 8.187 remains significantly below the 90-day average of 8.629, further reinforcing the prevailing downtrend.
In the more recent sessions, specifically from late October through mid-November, the GLD/SLV ratio has traded within a consolidated range, primarily fluctuating between roughly 8.1 and 8.6. The repeated inability of the ratio to sustain a move above 8.5, particularly after the rebound from the 7.985 low, suggests that this level is acting as a robust resistance point. The volatility of 0.10259 indicates that fluctuations within this range are a normal characteristic of the ratio’s price action. Given the current ratio’s position closer to the 90-day low (relative position of 0.1657) and the established moderate downtrend, it is likely that SLV will continue its outperformance relative to GLD in the immediate short term.
Considering alternative scenarios, a reversal of the current trend would require the GLD/SLV ratio to establish a solid base above the 8.0 level and then convincingly break and sustain above the recent resistance area of 8.4-8.5. For a more significant trend shift, reclaiming levels above the 90-day average of 8.629 would be necessary. However, based solely on the provided data, such a reversal appears unlikely in the short-term, given the prevailing trend direction and strength. Conversely, a decisive break below the 7.985 low would highly likely accelerate the existing downtrend, signaling a more pronounced outperformance of silver. Traders should monitor this critical support level closely, as its breach would represent a key technical inflection point.
Ratio Analysis: GLD/SLV
Generated for 90days timeframe analysis
Bonds
Our technical assessment of the provided market data for the fixed-income instruments TLT, UTHY, IEF, IEI, and SHY for the single day observed indicates a broadly positive sentiment within this specific segment. All five instruments registered positive daily percentage changes. The observed performance for the period is summarized as follows:
| Symbol | Daily Percent Change |
|---|---|
| TLT | 0.382% |
| IEF | 0.243% |
| IEI | 0.176% |
| UTHY | 0.095% |
| SHY | 0.078% |
This pattern suggests that fixed-income assets were generally bid higher during the period, with varying degrees of strength across different durations.
From a relative strength perspective, TLT (iShares 20+ Year Treasury Bond ETF) emerged as the strongest performer, with a daily gain of approximately 0.382%. This outperformance by longer-duration bonds might suggest a market preference for longer-dated maturities on this specific day. IEF (iShares 7-10 Year Treasury Bond ETF) also exhibited notable strength, securing the second-highest gain at roughly 0.243%. The substantial difference in performance between TLT and the shortest-duration SHY (iShares 1-3 Year Treasury Bond ETF) at 0.078% is noteworthy. This differential performance, if sustained over multiple periods, would typically imply an environment where interest rate expectations are stabilizing or declining, favoring longer-duration assets. However, based on a single data point, we assess that further observation is required to confirm such a directional bias.
Conversely, SHY and UTHY (Treasury Ultra Long Bond ETF) exhibited the weakest positive performance among the group. While still positive, their more subdued gains of approximately 0.078% and 0.095% respectively, position them as relative underperformers on this particular trading day. It is critical to emphasize the extreme limitations of basing any conclusions on a single day’s worth of data. Traditional technical analysis relies on patterns formed over time, incorporating elements like trend lines, support/resistance levels, volume, and various indicators, none of which are available here. Therefore, we assess that this single snapshot provides very limited predictive power concerning future price movements or the establishment of any discernible trend. The observed relative performance is merely a point-in-time observation.
Considering alternative scenarios, it is roughly an even chance that the observed relative performance may not persist into subsequent trading periods. A single day’s movement could easily be an isolated event driven by idiosyncratic factors rather than the inception of a new trend or a significant shift in market sentiment towards specific bond durations. Without historical context, such as prior daily closes, opening prices, trading volumes, or volatility measures, forming robust technical judgments is impossible. We further assess that attributing any broader market implications or forming actionable trading strategies based solely on these limited data points would be highly speculative. Future analysis would require a much more extensive dataset to apply conventional technical methodologies and identify potential patterns or shifts in market behavior. The current data merely confirms a positive close for these fixed-income instruments on the specified day, with TLT showing the strongest immediate momentum among the observed group.
CMT Technical Commentary: Bond ETF Complex (TLT, UTHY, IEF, IEI, SHY)
Our two-day technical review of the bond ETF complex, encompassing SHY, TLT, UTHY, IEF, and IEI, suggests a notable shift in market sentiment from initial indecision or weakness to a broadly positive close on the most recent trading day. The aggregate price action across all instruments indicates that buyers gained control towards the period’s end. We observe higher closing prices on the second day, suggesting a potential near-term bullish bias. The very short observation window, however, limits long-term directional conviction, requiring a closer examination of individual patterns and accompanying volume to gauge the strength and sustainability of this shift.
Focusing on the longer-duration bond ETFs, TLT (20+ Year) and UTHY (10-20 Year), we observe particularly strong bullish price action. TLT initially presented a bearish candle on Day 1 with a close near its low, suggesting selling pressure. However, Day 2 delivered a robust bullish candle, characterized by an open above Day 1’s close and a significant rally to close well above Day 1’s open, effectively recovering and surpassing prior losses. This upward move was accompanied by a substantial increase in volume, rising from approximately 24.6 million shares to 32.4 million shares, which we assess as a likely indicator of strong buying conviction. Similarly, UTHY exhibited a strong reversal; following a bearish Day 1 candle, Day 2 showed a bullish candle closing at its daily high, on an impressive volume surge from 3,986 to 17,981 shares. This significant increase in participation on the bullish leg suggests that a continuation of this upward momentum for TLT and UTHY is probable in the immediate term.
The mid- to short-duration segment, comprising IEI (3-7 Year) and SHY (1-3 Year), also exhibited positive price action. Both displayed bullish candles on Day 2, achieving higher highs, higher lows, and higher closes than Day 1, supported by modest increases in volume. This consistent upward trajectory for IEI and SHY makes a continued modest upward bias likely. However, IEF (7-10 Year) presented a clear bullish candle on Day 2, closing significantly higher, but notably on reduced volume. While the higher close indicates immediate bullish control, the decreasing volume on rising price introduces an element of uncertainty. We assess there is a roughly even chance that IEF’s rally might face consolidation or meet resistance, rather than forcefully continue, especially if volume does not expand with further price increases.
In summary, the technical data for these bond ETFs over the past two days points to a predominant bullish sentiment gaining traction. Longer-duration assets, TLT and UTHY, appear to be leading this charge with pronounced bullish reversals backed by strong volume, making further upward movement likely in the very near term. Mid- to shorter-duration instruments, IEI and SHY, also show constructive patterns, albeit with less explosive momentum. The key divergence for traders to monitor lies with IEF, where Day 2’s positive price action lacked volume confirmation. Should this volume divergence persist, it could signal a weakening of the underlying buying pressure for IEF, making its continued ascent less probable compared to its long-duration counterparts. Overall, the preponderance of evidence suggests a likely continuation of the upward momentum, though the intensity may vary across durations.
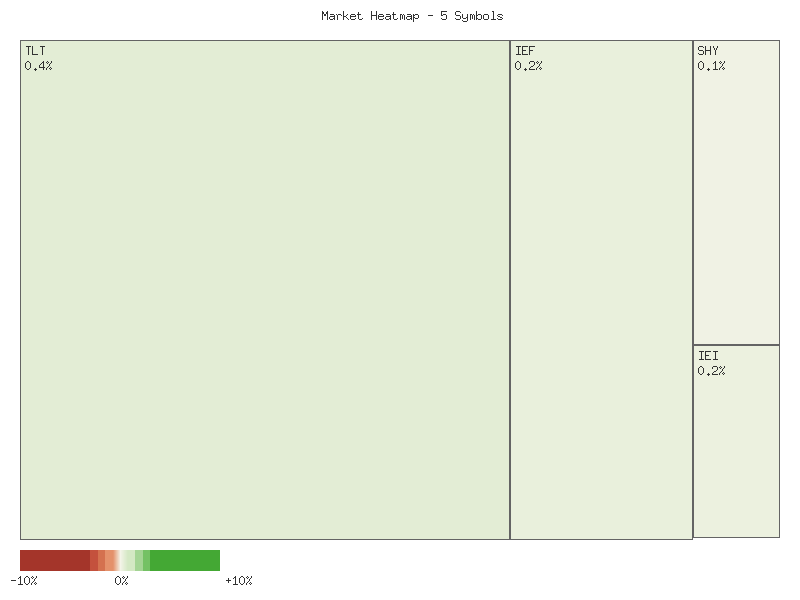
Performance Heatmap (TLT, UTHY, IEF, IEI, SHY)
Generated for 2days timeframe analysis
Magnificent 7 & Friends
| Symbol | Daily Percent Change |
|---|---|
| META | -0.187% |
| AAPL | -0.797% |
| GOOGL | -1.148% |
| MSFT | -1.784% |
| AVGO | -2.079% |
| TSLA | -2.214% |
| AMZN | -2.488% |
| NVDA | -3.152% |
| ANET | -4.203% |
| CRWV | -7.651% |
The provided daily percentage change data across the selected equities for the observed single session strongly suggests a prevailing bearish sentiment. Every symbol recorded a negative daily return, indicating a widespread downward pressure within this specific subset of the market. We assess it is highly likely that this broad negativity reflects a general risk-off environment or a collective market correction during this particular trading period. No individual symbol demonstrated positive momentum, which would typically be a sign of isolated strength against a broader trend.
Examining the relative performance, CRWV and ANET exhibited the most significant declines, with CRWV depreciating by 7.651% and ANET by 4.203%. We judge it likely that these substantial pullbacks are indicative of particular selling pressure unique to these names, possibly reflecting specific company news or sector-specific weaknesses not discernible from this data alone. Such large single-day movements often precede either continued volatility or a re-evaluation of valuation, though this single data point offers insufficient evidence to project a sustained trend.
Conversely, META and AAPL demonstrated relative resilience within this broadly negative landscape, posting the smallest daily losses at -0.187% and -0.797%, respectively. While still negative, their comparatively minor declines suggest a higher degree of demand or less aggressive selling pressure relative to their peers for this session. We assess it is plausible that these symbols are perceived as having stronger underlying fundamentals or technical support, though establishing this as a consistent pattern would require analysis over a longer timeframe and with additional technical indicators.
It is crucial to note that this analysis is based on a single day’s data. We assess it as highly unlikely that a definitive trend reversal or sustained market direction can be reliably inferred from such limited information. The observed movements could represent a minor retracement within a larger bullish trend, a consolidation phase, or indeed the initial phase of a new bearish trajectory. Therefore, we judge it a roughly even chance that these daily changes are either a temporary anomaly or the early indication of shifting sentiment. Further technical data, including volume, price action over multiple days, and key indicator readings, would be necessary to form a more robust and higher-confidence estimative judgment on future price action.
Market Commentary: Technical Analysis of Select Equities (Nov 19-20, 2025)
Analysis of the provided two-day market data, spanning November 19th and 20th, 2025, reveals a prevailing shift towards bearish sentiment across a significant portion of the observed instruments. The heatmap’s visual implication of widespread declines is strongly supported by detailed candlestick analysis. On November 20th, most of the analyzed stocks exhibited patterns indicative of strong selling pressure, frequently opening higher before reversing sharply to close near their daily lows.
A dominant technical pattern emerging is the bearish engulfing or a strong bearish reversal, often accompanied by increased trading volume, which lends significant conviction to the observed price action. NVDA, AVGO, CRWV, ANET, TSLA, and AMZN all displayed robust bearish engulfing patterns on November 20th. For instance, NVDA and AVGO, after gapping up and reaching new highs, experienced sharp reversals to close well below their prior day’s close, with notably higher volume. This pattern is highly likely to signal a continuation of selling pressure in the immediate term for these specific equities.
Similarly, MSFT, AAPL, and GOOGL also formed distinct bearish reversal patterns. MSFT and AAPL closed below their previous day’s closing prices after initial upward movements, with MSFT also achieving a bearish engulfing. GOOGL, despite an initial gap up and rally, also closed significantly lower, engulfing the prior day’s candle. While the volume increase was less dramatic for GOOGL compared to NVDA or AVGO, the overall price action for these three stocks strongly suggests that downward momentum has gained control, making further declines likely.
META presented a somewhat divergent pattern from the broadly bearish trend. Although the stock gapped up and saw its highest price on November 20th, it ultimately reversed to close lower than its opening price and below the previous day’s close. However, its closing price remained above the low of November 19th, preventing a full bearish engulfing. Furthermore, the selling on META occurred on decreased volume. This suggests a bearish bias, but the signal is less conclusive, indicating a roughly even chance of continued selling versus a short-term consolidation or rebound compared to the other aggressively sold names.
Based on the pervasive and high-conviction bearish signals observed across the majority of these major components, a short-term continuation of downward price action is highly likely for the broader group. The widespread nature of these bearish engulfing and reversal patterns, particularly those with significant volume expansion like NVDA, AVGO, CRWV, ANET, and TSLA, indicates a shift in market control to sellers. Alternative scenarios include these moves representing an exhaustion gap or a temporary profit-taking pullback within an unobserved longer-term uptrend. However, relying strictly on the provided two-day data, the technical landscape has turned bearish, making further declines the most probable near-term outcome.
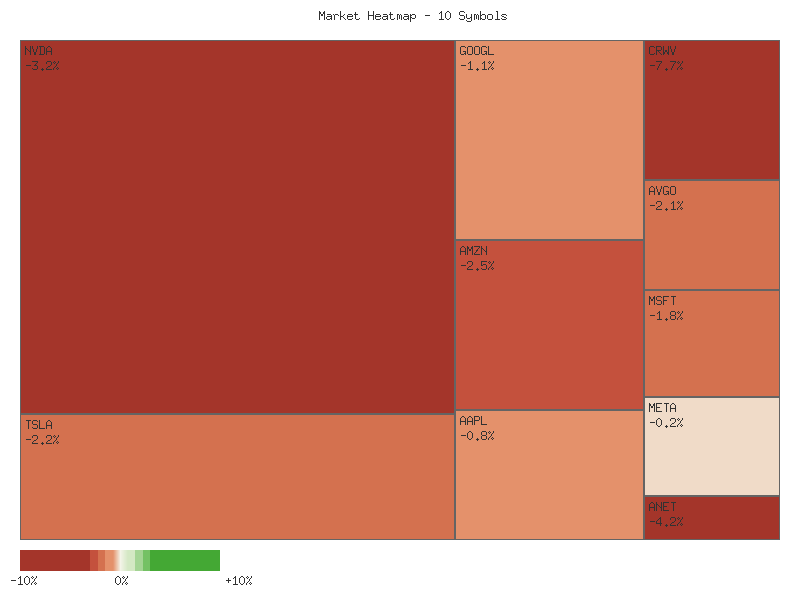
Performance Heatmap (TSLA, MSFT, AAPL, META, NVDA, AVGO, GOOGL, AMZN, CRWV, ANET)
Generated for 2days timeframe analysis
S&P 500 Sector Breadth
The market data for the S&P 500 sectors on the observed day presents a decidedly bearish picture, with market breadth heavily skewed towards declines. Out of the eleven sectors analyzed, a substantial majority of ten symbols exhibited negative daily percentage changes, while only one symbol, XLP (Consumer Staples), advanced. This overwhelmingly negative breadth is highly indicative of broad-based selling pressure across the equity market.
The following matrix details the daily percentage changes for each sector, sorted in descending order:
| Symbol | Daily Percent Change |
|---|---|
| XLP | 0.725% |
| XLRE | -0.370% |
| XLU | -0.492% |
| XLV | -0.617% |
| XLF | -0.873% |
| XLC | -1.061% |
| XLE | -1.146% |
| XLB | -1.499% |
| XLY | -1.506% |
| XLI | -1.696% |
| XLK | -3.128% |
Examination of sector performance reveals that the sole advancing sector, XLP, is classified as defensive. Conversely, the deepest declines were observed in predominantly offensive sectors, with XLK (Technology) experiencing the most significant drop at -3.128%, followed by XLI (Industrials) at -1.696% and XLY (Consumer Discretionary) at -1.506%. All six offensive sectors (XLK, XLY, XLF, XLI, XLB, XLE) declined, with the unclassified XLC also falling. While three out of the four defensive sectors (XLRE, XLU, XLV) also ended the day lower, their declines were generally less severe compared to the leading offensive sectors.
The observed market action points to a likely environment of pervasive risk aversion rather than a clear rotation into defensive sectors. Although XLP, a defensive sector, was the only one to register a gain, the concurrent declines in the majority of other defensive sectors suggest broad market weakness. The significant underperformance of key offensive sectors, particularly XLK, is highly indicative of investors reducing exposure to growth-oriented areas. This pattern suggests that overall market sentiment is overwhelmingly bearish, with a low probability of a ‘risk-on’ environment prevailing given the current technical landscape.
As a Chartered Market Technician with over 15 years of experience, my analysis of the provided two-day market data across eleven S&P sectors suggests a pronounced shift towards bearish sentiment, particularly evident in the most recent trading session. A significant majority of sectors displayed strong downside reversals, characterized by sharp declines from open to close, supported by notable increases in trading volume. This widespread selling pressure, especially in prominent sectors like Technology and Financials, indicates that bearish forces have gained considerable traction. The collective pattern implies an elevated short-term downside risk for most of these Exchange Traded Funds (ETFs), likely challenging any prior upward momentum.
Several sectors presented robust technical indications of strong bearish reversals. Technology (XLK) displayed a pronounced bearish engulfing pattern on Day 2, opening higher before plummeting to close near its daily low, accompanied by more than double the prior day’s volume. Similarly, Industrials (XLI), Consumer Discretionary (XLY), Financials (XLF), and Materials (XLB) all experienced dramatic sell-offs on Day 2. These sectors often gapped up or moved higher initially before reversing sharply to close well below Day 1’s prices, consistently on substantially increased volume. These patterns, signifying strong bearish conviction, suggest that further price depreciation is likely in the immediate future, with the elevated volume reinforcing the reversal’s strength.
Beyond the strong reversals, other sectors also contributed to the negative outlook. Communication Services (XLC) recorded a large bearish candle on Day 2 with increased volume, largely engulfing the prior day’s price action. Energy (XLE) registered a bearish reversal from a higher open, closing below Day 1’s close on comparable volume, consistent with a ‘shooting star’ pattern often indicative of a potential top. Health Care (XLV), Utilities (XLU), and Real Estate (XLRE) showed continued downside pressure, closing near their two-day lows, often on increased volume. These patterns suggest that the path of least resistance for these sectors is probably to the downside, at least in the short term. In stark contrast, Consumer Staples (XLP) was the sole bullish outlier, closing higher on Day 2 with increased volume, suggesting potential flight-to-safety flows amid broad market weakness. This signal for XLP carries moderate conviction due to the limited data.
Based purely on the technical data, the overwhelming evidence points to an increased probability of further downside for most analyzed sectors. The prevalence of strong bearish engulfing patterns, shooting stars, and sustained declines, all frequently supported by higher volume, indicates a significant shift in market control to sellers. While a swift rebound (an alternative scenario) cannot be entirely ruled out if Day 2’s heavy selling represented a short-term “shake-out,” such a broad bullish reversal appears unlikely without fresh catalysts in subsequent sessions. Therefore, the immediate outlook is weighted towards continued bearish pressure for the majority of these ETFs, making further price declines more likely than not.
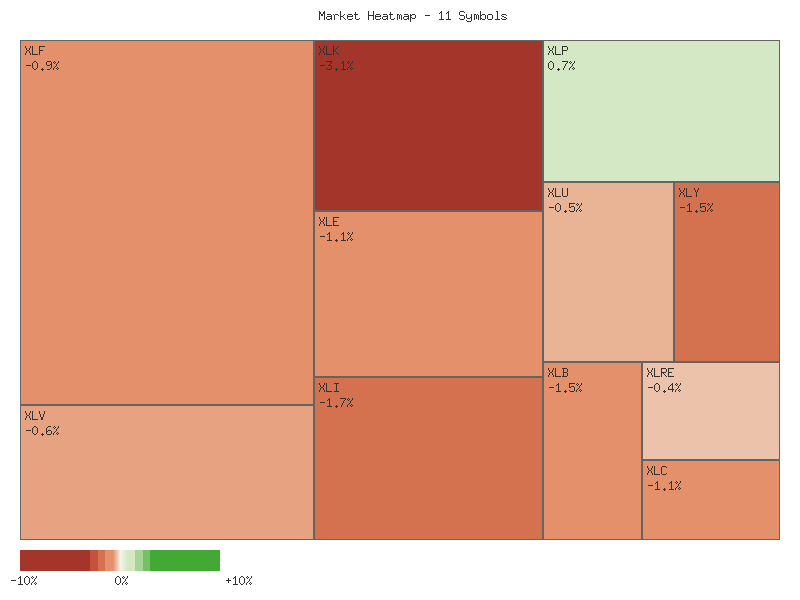
Performance Heatmap (XLP, XLRE, XLI, XLU, XLV, XLY, XLF, XLB, XLE, XLC, XLK)
Generated for 2days timeframe analysis
XLY vs XLP
The XLY/XLP ratio has exhibited a clear downward trend over the observed seven-day period, declining approximately 6.76% from its initial high of 3.077 on November 12th to its low of 2.869 on November 20th. This movement is categorized as a moderate decline in strength, establishing a bearish short-term bias for consumer discretionary (XLY) relative to consumer staples (XLP). The ratio closed at its lowest point within this seven-day window, which suggests persistent underperformance by XLY relative to XLP is currently underway.
Throughout the period, the ratio demonstrated a consistent series of lower highs and lower lows, with only one brief counter-trend rally occurring on November 19th. This single upward movement, from 2.912 to 2.934, was short-lived and failed to recover a substantial portion of prior losses, as evidenced by the subsequent decline to a new low. This pattern of a brief bounce followed by a decisive move to a new low strongly indicates that bearish momentum remains dominant. We judge it likely that the momentum is still firmly to the downside given the closing price at the absolute lowest level of the observed sample.
Considering the observed price action, the ratio’s decline to a new low of 2.869 on the final day of data suggests a continuation of the downtrend is likely in the immediate future. The current position at the low end of its seven-day range (relative position 0) reinforces this interpretation, indicating that the pressure on XLY relative to XLP is at its peak within this specific dataset. However, after a sharp move lower, a short-term rebound or period of consolidation around current levels is a plausible alternative scenario; we assess this possibility as roughly even given the limited number of data points to establish clear support levels. Nevertheless, based purely on the provided technical data, we anticipate further relative weakness in XLY compared to XLP.
XLY/XLP Ratio: 90-Day Technical Outlook
The XLY/XLP ratio, representing the relative strength of the Consumer Discretionary sector (XLY) against the Consumer Staples sector (XLP), has exhibited a moderate upward trend over the past 90 days. Commencing at approximately 2.73 in mid-July, the ratio concluded the period near 2.87, registering a 5.04% increase. During this timeframe, the ratio experienced a peak of 3.1994 on November 3rd and a low of 2.6957 on August 1st. This sustained upward bias for much of the period suggests a prevailing preference for the growth-oriented Consumer Discretionary sector. The average ratio over these 90 days stands at 2.9291, providing a historical midpoint for context.
Despite the overarching upward trend, the more recent price action, particularly since early November, signals a significant short-term reversal. Following the peak at 3.1994 on November 3rd, the XLY/XLP ratio has experienced a substantial decline, with its current reading of 2.8690 as of November 20th. This notable retraction from the 90-day high places the ratio below its 90-day average, indicating a short-term weakening in the relative performance of XLY. The current relative position of 0.3441 suggests the ratio is presently closer to its 90-day low than its high, underscoring the recent bearish momentum.
Considering the pronounced downward momentum from the peak, a continued short-term decline toward the 2.80-2.85 support band is likely. These levels previously acted as consolidation zones or points of support in late July and mid-August. A breach below this region would increase the likelihood of the ratio retesting the lower boundary of its 90-day range, potentially towards the 2.70-2.73 area. Conversely, a sustained move back above the 2.90 level, and subsequently the 90-day average of 2.9291, would likely indicate a stabilization of the current decline. Should this stabilization occur, a renewed attempt towards the November 3rd peak would become a roughly even chance in the medium term, though a swift return to that extreme remains unlikely without further consolidation.
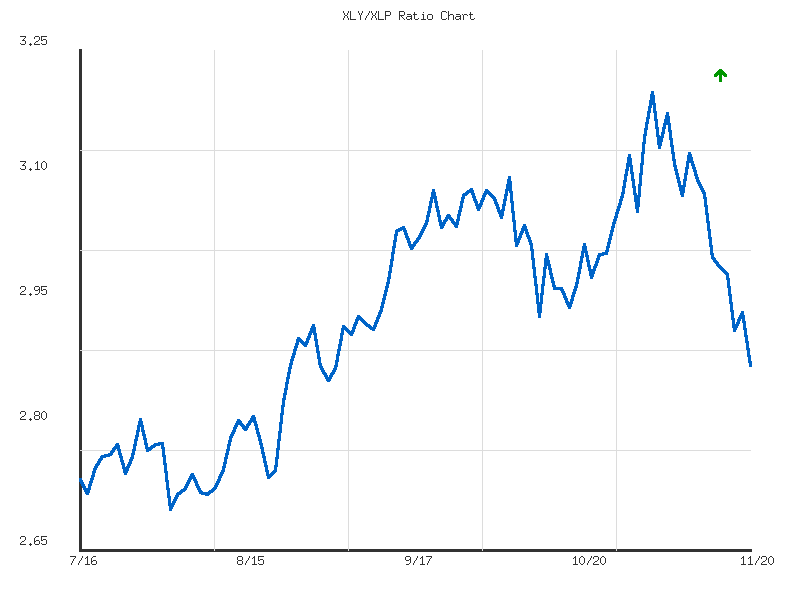
Ratio Analysis: XLY/XLP
Generated for 90days timeframe analysis
Equity Breadth
The provided seven-day market data for the S&P 500 breadth indicators, SPXA50R and SPXA200R, suggests a notable and widespread deterioration in underlying market strength. Both the percentage of S&P 500 members trading above their 50-day moving average (SPXA50R) and their 200-day moving average (SPXA200R) have exhibited a consistent downward trend. This collective weakening in market participation across a significant portion of the S&P 500 components typically indicates a broad-based loss of bullish momentum and increasing downside pressure on the index itself.
Analysis of the SPXA50R data reveals a sharp decline, commencing at 51.4% on 2025-11-12 and plummeting to 29.6% by 2025-11-20. This significant reduction of approximately 42% in the number of stocks above their short-to-medium term average within a single week is a strong technical signal. The indicator’s swift descent from a level suggesting broader intermediate strength to decisively below 30% implies a market experiencing a strong bearish impulse. While a reading below 30% often points to oversold conditions that could precede a short-term rebound, the speed of this decline suggests the bearish momentum is currently dominant. Further declines would be indicative of increasing selling pressure.
Similarly, the SPXA200R data presents a clear negative trajectory, falling from 56.8% on 2025-11-12 to 42.6% on 2025-11-20. This sustained deterioration, though less volatile than SPXA50R, holds significant long-term implications. The indicator, which gauges the percentage of stocks above their long-term average, crossed below the critical 50% threshold on 2025-11-17. This technical event indicates that a majority of S&P 500 components are now trading below their 200-day moving average, signaling a structural weakening of the broader market’s long-term uptrend. The consistent decline implies fewer companies are maintaining robust long-term technical health, which is a bearish signal for the health of the overall market.
The concurrent and consistent decline across both SPXA50R and SPXA200R presents a compelling picture of a market facing pervasive technical challenges. It is likely that the S&P 500 index is under significant downside pressure, reflecting this broad deterioration in breadth. While the deeply oversold reading in SPXA50R could eventually lead to a counter-trend bounce, a sustained reversal appears unlikely in the near term given the deteriorating long-term breadth indicated by SPXA200R. An alternative scenario, where a near-term bounce occurs, would require a rapid and sustained upward reversal in SPXA50R, ideally coupled with stabilization in SPXA200R. However, based solely on the provided data, the prevailing trend points towards sustained technical weakness, suggesting further downside pressure remains a distinct possibility.
SPY Daily
The most recent trading day (2025-11-20) for SPY exhibits a significant bearish candle, opening near the previous day’s close but sharply declining to close at 652.52. This substantial downward movement was accompanied by exceptionally high volume, nearly doubling the previous day’s, suggesting robust selling pressure. Over the past seven trading days, SPY has shown a clear deceleration of its prior upward momentum. Price action largely displayed lower highs and lower lows within this short-term window, culminating in today’s sharp drop. This overall decline over the last seven days indicates that short-term momentum has transitioned from neutral to distinctly bearish.
The 50-day Exponential Moving Average (EMA_50) is currently at 665.69, with the price closing significantly below it. This implies the short-term trend has broken below a key dynamic support level, signaling weakening momentum. Furthermore, the EMA_50 itself has begun a slight downward trajectory, which could reinforce negative sentiment in the near term. Conversely, the 200-day Exponential Moving Average (EMA_200) continues to ascend, resting at 625.91, and remains well below the current price. This indicates that the long-term trend remains fundamentally bullish, suggesting the current price action represents a significant test of this broader upward trend rather than a complete reversal of the longer-term outlook. The 14-day Relative Strength Index (RSI_14) dropped sharply from 41.68 to 35.10 on the last trading day, plunging it into the lower bound of its typical range and approaching oversold territory. This level indicates substantial recent selling pressure and could precede a technical bounce, although it does not guarantee one.
Immediate resistance is likely to be encountered near the 2025-11-19 close of 662.64, and more significantly at the EMA_50 around 665.69. The opening price of 672.93 on 2025-11-20, followed by a sharp decline, also creates a resistance zone that would require notable bullish pressure to overcome. Conversely, immediate support appears to be around the 2025-10-10 low of 653.02, which the most recent close of 652.52 has just marginally broken. The next critical support level, based on longer-term trend analysis, is the 200-day EMA at approximately 625.91.
Considering future price action: a bullish case would involve a bounce from the current low RSI level, particularly if the price can quickly reclaim the 653.02 level. A strong reversal candlestick pattern with increased volume could signal a move back towards the EMA_50 as resistance; however, this scenario is currently unlikely given the prevailing bearish momentum. A bearish case suggests further downside is highly likely given the decisive break below recent support at 653.02, coupled with exceptionally high selling volume. The next target for bears would plausibly be the 200-day EMA at 625.91. A sustained close below 651.89 with continued heavy volume would further confirm this bearish outlook. A neutral case, indicating a period of consolidation around the current 652 level to form a base before a clearer directional move, has a roughly even chance. This could occur if buyers step in to defend current price levels, preventing immediate further declines but lacking the conviction for a strong rebound.
From a technical perspective, the sharply increased volume accompanying the recent price decline, particularly on 2025-11-20, strongly suggests that fear and capitulation among short-term holders were the dominant sentiment drivers. The rapid drop in RSI reflects an accelerating shift in market psychology towards pessimism. The break below the 50-day EMA, a commonly watched short-term trend indicator, likely amplified bearish sentiment as many trend-following strategies would have triggered sell signals. While the upward-sloping 200-day EMA still underpins a longer-term bullish structure, suggesting a psychological floor for some investors, short-term negative sentiment currently appears to override this broader outlook.
SPY Technical Analysis: Nov 20, 2025
The SPDR S&P 500 ETF (SPY) has demonstrated a generally upward trend over the majority of the 90-day period observed, exhibiting a pattern of higher highs and higher lows through late October. However, recent price action indicates a material shift in market dynamics. The period from late October through November 20th reveals a significant downturn, culminating in a sharp decline on the final day of the provided data. The closing price of 652.52 on November 20th was accompanied by a wide-range bearish candle on exceptionally high volume, totaling 154.77 million shares. This substantial increase in selling pressure on a downward price move suggests significant bearish conviction and a notable change from the preceding upward trajectory. The magnitude of this volume accompanying the decline makes it unlikely that this is merely a minor correction.
The 14-day Relative Strength Index (RSI) has consistently signaled shifts in momentum throughout the review period. During strong upward price phases, such as in late July, mid-September, and late October, RSI frequently entered overbought territory (above 70). Each instance was subsequently followed by a period of price consolidation or pullback, indicating that bullish momentum tended to exhaust near these levels. Conversely, the RSI retreated during corrective phases. The most recent RSI readings are particularly noteworthy: a decline from 69.71 on October 29th to 35.10 on November 20th. Although a brief bounce occurred, the RSI again registered 35.10 on November 20th, confirming that bearish momentum remains robust. This level is considered strongly oversold, suggesting that price has experienced significant downward pressure in a relatively short period.
The sharp price decline on November 20th, occurring on the highest volume observed within the 90-day data set, strongly reinforces the bearish conviction evident in price action. While RSI is deeply oversold at 35.10, such extreme readings often precede at least a short-term technical rebound as selling pressure momentarily abates. Therefore, there is roughly an even chance that SPY could experience a relief bounce in the immediate future. However, given the sustained downtrend from late October highs and the decisive breakdown confirmed by the high-volume selling on November 20th, any such bounce is likely to encounter considerable overhead resistance. A failure to sustain any rebound, especially if accompanied by diminishing volume, would reinforce the prevailing bearish sentiment. Conversely, a strong rally on increasing volume, pushing the RSI back above the 50-level, would be required to challenge the current bearish outlook. Based on the provided technical data, the combination of falling prices, elevated selling volume, and deeply oversold RSI indicates a high probability of continued short-term volatility.