Daily Market Technical Analysis
The broader market exhibits a complex technical posture, with large-cap indices showing gains but tempered by declining volume, while small-caps are largely underperforming or consolidating. SPY and QQQ face likely near-term downward pressure, although QQQ’s oversold RSI suggests a roughly even chance of a relief bounce or consolidation. Concurrently, the VIX remains elevated, indicating likely continued market uncertainty. Commodity markets are bifurcated, with natural gas and copper showing bullish momentum, yet oil and broad commodities likely facing further downside. Within equities, GOOGL, NVDA, and AVGO show strong bullish signals, contrasted by likely continued weakness in MSFT and META. Market breadth indicators are deteriorating, suggesting fewer stocks are participating in upward moves, making further overall market weakness more probable than an immediate rebound. This fragmentation necessitates selective monitoring for specific sector and security trends.
Market Indices
Here is an analysis of the provided daily percentage change data:
| Symbol | Daily Percent Change |
|---|---|
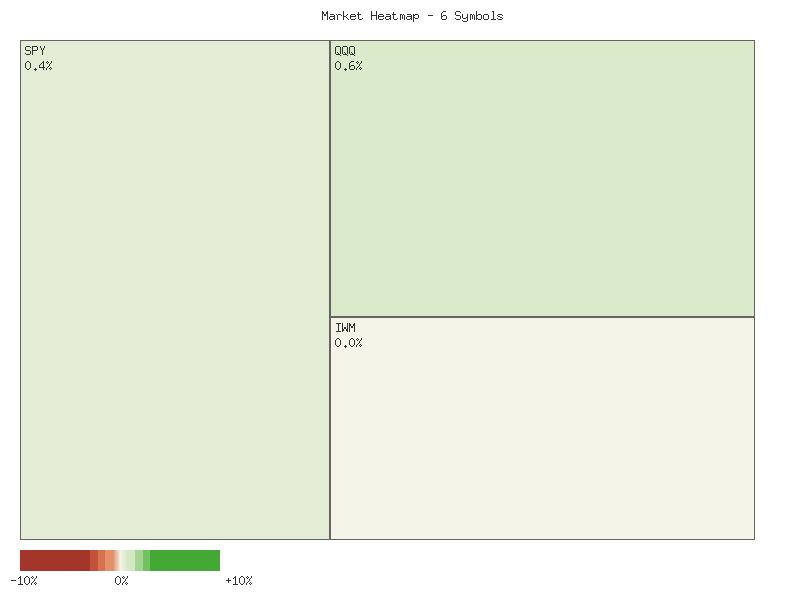
| QQQ | 0.5886% |
| OEF | 0.5163% |
| SPY | 0.3802% |
| MDY | 0.1594% |
| IWM | 0.0000% |
| IJR | -0.0876% |
The market data for the observed indices reveals a predominantly positive sentiment for the day, with four out of six symbols showing gains. QQQ, representing the NASDAQ 100, led the advance with a 0.5886% increase, closely followed by OEF (S&P 100) and SPY (S&P 500). MDY (S&P MidCap 400) also registered a modest gain. This pattern suggests a constructive, albeit not overwhelmingly strong, trading session for a significant portion of the broad market.
Analyzing market breadth, we observe four advancing symbols, one declining symbol, and one symbol remaining unchanged. This suggests a moderately positive breadth, indicating that the gains were not entirely concentrated in a single area, yet not universally distributed across all observed market segments. The participation of mid-caps (MDY) in the advance alongside large-cap indices (QQQ, OEF, SPY) provides a broader, though not complete, confirmation of upward movement.
A notable divergence in performance is evident between large-cap and small-cap indices. QQQ and OEF, representing larger-cap, often growth-oriented, segments, demonstrated the strongest daily performance. Conversely, IJR (S&P SmallCap 600) experienced a decline of -0.0876%, while IWM (Russell 2000), another small-cap proxy, remained unchanged. This suggests that while overall market sentiment may be positive, the underlying strength is likely concentrated in larger capitalization assets, with small-cap segments currently lagging.
Based on this technical data, we assess that the market maintains a moderately positive bias, driven primarily by strength in larger-cap indices. It is likely that continued outperformance by large-cap segments while small-caps exhibit weakness or stagnation could indicate a narrowing market leadership, a pattern that occasionally precedes periods of market consolidation or sector rotation. Alternatively, a future scenario where IJR and IWM reverse course and participate robustly in positive daily changes would signal a broadening of market participation, which would be a more favorable technical development for sustained upward momentum.
Here is a technical analysis of the provided market data for the specified ETFs:
The two-day period under review presents a nuanced picture across the monitored exchange-traded funds (ETFs), with some segments showing a rebound while others suggest a potential loss of momentum. Initially, the broader market, represented by SPY, QQQ, and OEF, exhibited mixed to slightly bearish price action on the first day, often closing near the mid-point or lower half of their daily ranges with relatively high volume. However, the second day generally observed a move higher, with these larger-cap ETFs closing above their previous day’s closes. This could likely be interpreted as a short-term bullish continuation or a recovery from the prior day’s price discovery. Nonetheless, it is notable that the trading volume on the second day for most of these ETFs (SPY, QQQ, OEF) saw a noticeable decline, which might temper the bullish conviction and suggests that the upward movement could face challenges if buying pressure does not resume with stronger volume.
Delving into the larger-cap segment, SPY and QQQ both recorded higher highs, higher lows, and higher closes on the second day, successfully eclipsing their prior day’s closing prices. This pattern typically signals short-term strength. OEF also demonstrated a similar bullish reversal on the second day, closing significantly above its prior day’s weak close. The price action suggests that immediate selling pressure has likely receded for these bellwether indices. However, the decreasing volume for all three on the second day indicates that while prices moved up, the underlying participation might be waning. This divergence between rising prices and declining volume often precedes periods of indecision or potential reversals, making further sustained upside momentum appear less certain in the immediate term.
Conversely, the mid-cap and small-cap segments presented a more varied technical landscape. MDY, representing mid-caps, displayed consistent bullishness, with its second-day candle showing a higher high, higher low, and higher close, following a strong prior day. This suggests robust short-term momentum for mid-cap equities, and a continuation of this strength is likely if current patterns persist. In contrast, the small-cap segment, particularly IWM, showed signs of consolidation or indecision on the second day. After a strong bullish candle on the first day, IWM printed an identical closing price on the second day despite experiencing a higher high and lower low. Coupled with a significant drop in volume, this “doji-like” close strongly suggests a pause in the prior upward momentum, and a roughly even chance of either a continued breakout or a short-term pullback in the very near future.
IJR, another small-cap proxy, exhibited potential short-term weakness. While it recorded a higher high and higher low on the second day, its closing price was marginally below that of the previous day, which could form part of a bearish engulfing pattern depending on the candle bodies or at least indicates a failure to maintain upward momentum. The decline in volume on the second day further supports the interpretation of diminishing buying interest. Thus, it is moderately likely that IJR could face immediate downward pressure or further consolidation, indicating a divergence from the more positive price action observed in the mid-cap and some large-cap peers. Traders would likely want to monitor the next session closely for confirmation of this potential short-term reversal in IJR.
Performance Heatmap (SPY, QQQ, IWM, IJR, MDY, OEF)
Generated for 2days timeframe analysis
Technical Analysis: SPY (90-Day View)
Over the past 90 days, the SPY ETF has exhibited a generally ascending price trend from mid-July into late October, followed by a notable retracement in November. From a price point near in mid-July, SPY demonstrated consistent upward momentum, making a series of higher highs and higher lows, culminating in a peak near in late October. This bullish phase was characterized by fairly consistent daily gains and, at times, robust volume during upward moves. However, the market’s behavior has shifted in November, with a discernible downward correction taking hold.
The recent price action, particularly from late October through mid-November, suggests a shift in short-term momentum. Following its peak around , SPY has pulled back significantly, reaching a low of .86 on November 18th. This decline has been accompanied by heightened volume during several down days, notably on October 10th (156M shares, price drop from .95 to .02) and November 18th (108M shares, price dropping from .07 to .13), indicating a higher conviction among sellers. The volume accompanying the minor rebound on November 19th (84M shares, closing at .64) was lower than the previous day’s selling volume, suggesting that buying conviction may not yet be robust enough to reverse the recent downtrend. A key support level appears to be forming around the - region, which roughly corresponds to the October 10th low. Failure to hold this level would likely expose lower support around the early August levels closer to -.
The 14-day Relative Strength Index (RSI) largely corroborated the price action throughout the period. During the strong uptrend from July to October, RSI frequently entered overbought territory (above 70), signaling strong bullish momentum, such as in late July, mid-September, and early October. These overbought readings were typically followed by brief periods of consolidation or minor pullbacks before the uptrend resumed. More recently, as SPY entered its November correction, the RSI has retreated sharply, falling from comfortable mid-60s readings to near-oversold levels (approaching 30). On November 18th, the RSI reached 39.05, which is its lowest point since the early August pullback (47.66) and the mid-October decline (41.81). A slight bounce in RSI to 41.68 on November 19th indicates some relief but remains well below the neutral 50-level, suggesting that downside momentum remains prevalent. No clear bullish divergence between price and RSI is currently apparent, which would otherwise signal a higher likelihood of an immediate reversal.
Based on the current data, it is likely that SPY will continue to experience downward pressure in the very near term, challenging the established support zone around -. The recent price decline on elevated volume and the RSI’s position below 50, albeit attempting to rebound from near-oversold territory, collectively point to continued bearish sentiment. An alternative scenario, with a roughly even chance, involves SPY consolidating around the current - level for a few days, possibly forming a base before attempting a more significant recovery. However, a sustained bounce would require a more decisive break above prior resistance levels and a confirmed shift in momentum, which is not yet indicated by the RSI. Notably, the MACD indicator data was not provided for this analysis, which would typically offer additional insight into trend strength and potential reversals. Its absence limits the comprehensiveness of our momentum assessment.
SPY Price & Indicators (RSI_14_DAY, MACD_13_21_DAY)
Market Commentary: QQQ Technical Outlook
Over the past 90 trading days, the Invescence QQQ Trust (QQQ) has experienced a notable period of strong upward momentum, punctuated by several sharp corrections, as indicated by both price action and the 14-day Relative Strength Index (RSI). Initially, QQQ demonstrated robust bullish sentiment from mid-July through late September, establishing a clear uptrend with price advancing from the mid- to above . During this phase, the RSI frequently entered overbought territory (above 70), confirming strong buying pressure and momentum. For instance, in late July, the RSI peaked at 73.11, coinciding with new price highs, and again in late September, it reached 75.35 on September 22, signaling extended upside participation.
A significant shift in market dynamics became evident around mid-October. Following a continuous rally that saw the QQQ reach a new high of .44 on October 8, a substantial bearish candlestick appeared on October 10, with price plummeting to .5 on exceptionally high volume (94.4 million shares). Concurrently, the 14-day RSI experienced a steep decline from 69.27 to 45.42, a strong bearish momentum signal indicating a rapid capitulation of buyers. While the QQQ subsequently rallied to achieve new all-time highs of .77 by October 29, with the RSI again pushing into overbought conditions at 71.73, this ascent was quickly followed by another pronounced reversal.
The period from late October to mid-November is characterized by a definitive downtrend. From its peak on October 29, QQQ steadily declined, with multiple large red candles signifying persistent selling pressure. The associated 14-day RSI mirrored this price action, falling sharply from overbought levels, eventually reaching 39.53 on November 18. This penetration below the 40 threshold places QQQ in oversold territory, signaling that the recent decline may be exhaustive in the short term. The elevated volume during this descent, particularly on November 18 (79.3 million shares), further confirms the intensity of the selling.
Considering the recent data, QQQ’s immediate technical posture appears challenged. The 14-day RSI dipping into oversold territory on November 18, followed by a minor rebound to 42.27 on November 19, suggests a roughly even chance of a short-term relief bounce or consolidation phase. However, a significant reversal is unlikely without further confirmation from price action, such as a strong bullish engulfing candle or a break above recent resistance levels. It is plausible that QQQ could attempt to test the recent low of .34 (November 18 intra-day low) or potentially consolidate around the current - area. Should buying momentum fail to materialize swiftly, a further move lower towards the next potential support around the - level, last seen following the October 10 plunge, would become increasingly likely. Traders should closely monitor the RSI’s ability to climb back above 50 and for any signs of reduced selling volume for indications of a sustainable upward shift.
QQQ Price & Indicators (RSI_14_DAY, MACD_13_21_DAY)
IWM Technical Outlook: November 2025
The IWM (Russell 2000 ETF) has exhibited distinct trending behavior over the past 90 days, transitioning from a robust uptrend to a notable downtrend. The period commenced with the IWM consolidating around the - range in mid-July before experiencing a sharp decline to a low of .92 by August 1st. Subsequently, a strong rally materialized throughout August and September, characterized by higher highs and higher lows. This bullish momentum propelled the IWM to a significant peak of .84 on September 18th. A brief correction followed, but the price managed to establish a marginally higher peak at .33 on October 15th, indicating a continuation of underlying buying interest, albeit with signs of exhaustion. However, from this mid-October high, the IWM entered a demonstrable downtrend, marked by a pattern of lower highs and lower lows, which has persisted to the most recent data point.
Analysis of the 14-day Relative Strength Index (RSI) corroborates these price movements. During the bullish phase from early August to mid-September, the RSI consistently maintained above its 50-level, confirming strong upward momentum. The indicator frequently approached or entered the traditionally overbought territory (above 70), notably peaking at 71.23 on September 18th, precisely coinciding with the initial price high. This overbought reading signaled a likely exhaustion point for the prevalent uptrend. Following the mid-October high, the RSI decisively broke below the 50-level on October 10th (44.97) and has largely remained there, indicating a sustained shift to bearish momentum.
Currently, the price action and RSI suggest a continuation of the recent downward trajectory. The IWM is presently trading around the - range, having broken below several intermediate support levels that were established during the August-September rally. Volume spikes on recent down days, such as November 13th and 17th, further lend credence to the bearish conviction. The 14-day RSI is positioned in the mid-to-high 30s (36.06-37.30 on the latest data), reflecting significant selling pressure. While not yet in classically oversold territory (below 30), this level strongly indicates that downside momentum is prevailing and selling pressure remains prominent.
Given the current technical posture, it is highly likely that IWM will continue to face downward pressure in the immediate future, with the recent highs around and now acting as formidable resistance. A re-test of the August 1st low of .92 appears probable should the current bearish momentum intensify, especially if the RSI breaks below 30. Conversely, a short-term counter-trend bounce from current levels, potentially toward the area, remains a roughly even chance due to the RSI nearing oversold conditions, which often precedes at least temporary relief rallies. However, without a significant shift in the price action and momentum indicators, any such bounce is unlikely to signal a reversal of the current bearish trend. It is pertinent to note that the MACD indicator data was not provided for this analysis, limiting the scope of comprehensive momentum assessment.
IWM Price & Indicators (RSI_14_DAY, MACD_13_21_DAY)
VIX Fear Index
The VIX experienced a notable surge in volatility over the past seven trading days, shifting from a relatively subdued range to significantly elevated levels. Commencing on November 11th with a close around 17.25, the index saw a period of consolidation before a material upward acceleration. A prominent bullish candle on November 13th, closing at 20.37, decisively broke the prior stability and initiated a new upward trajectory. This move suggests an increased perception of market risk among participants, evident solely in the price action. The subsequent day saw a minor pullback, but the overall market sentiment, as inferred from price, remained one of increasing volatility.
Following the initial surge, the VIX demonstrated robust upward momentum, particularly evident from November 17th through November 18th. These two consecutive trading sessions produced strong bullish candles, characterized by higher opens, higher highs, and higher closes. On November 18th, the VIX reached a high of 25.84 and closed at 24.41, marking the apex of the observable upward trend within this dataset. This sustained climb indicates a period of heightened market uncertainty or fear, with participants actively bidding up implied volatility. The consistent creation of higher highs and higher lows through November 18th strongly suggested the trend was firmly established.
The trading session on November 19th presents a notable shift in the VIX’s behavior, potentially signaling a short-term reversal or at least a significant pause in the recent uptrend. The VIX opened higher but failed to sustain its gains, ultimately forming a bearish candle that closed at 23.66, a 3.07% decrease from the prior day’s close. Crucially, the day’s high of 24.79 was lower than the previous day’s high of 25.84, which often suggests a weakening of buying pressure at higher levels. Additionally, the intraday low of 21.93 indicates a substantial decline from the opening price and prior close, underscoring pronounced selling pressure during the session.
Given the strong uptrend preceding the November 19th bearish candle, there are alternative scenarios to consider. While the recent price action suggests a loss of upward momentum and a likely short-term pullback, it is not definitively a trend reversal. There is a roughly even chance that this could be merely profit-taking or a temporary pause before another attempt to push higher, especially if the VIX finds support around the 22.00-22.50 range. Conversely, if the VIX breaks below the November 19th low of 21.93, it would likely confirm increased selling pressure, and a short-term downtrend could be established, aiming towards the prior support area around 20.00-20.50. The absence of volume data limits the ability to confirm the conviction behind these price movements.
VIX Technical Analysis: 90-Day Outlook
The VIX has exhibited a notable shift in its price action over the past 90 days, transitioning from a predominantly subdued trading range in July and August to an escalating trend of heightened volatility from late October into mid-November. Initially, the VIX fluctuated primarily between 14 and 17, with occasional spikes, such as the rise to 20.38 on August 1st and 19.38 on September 2nd, which were typically short-lived and followed by retracements. This earlier period was characterized by rallies being sold, indicating underlying resistance to sustained upward moves. However, the market structure has notably changed in the more recent data, suggesting a material increase in implied volatility.
Since late October, the VIX has demonstrated a strong upward acceleration, breaking decisively above previous resistance levels that had capped earlier rallies. The index moved from a low of 15.62 on October 27th to a high of 25.84 on November 18th, closing most recently at 23.66 on November 19th. This sustained rally, marked by higher lows and higher highs, suggests that market participants are currently pricing in a higher degree of uncertainty compared to the preceding months. The resilience shown in maintaining these elevated levels indicates that the upward momentum is robust, making a continuation of heightened volatility likely in the short term.
Analysis of the 14-day Relative Strength Index (RSI) provides further context to the VIX’s movements. A notable bearish divergence was observed between October 10th and October 17th. On October 10th, the VIX peaked at 21.66 with an RSI reading of approximately 73.09, signaling an overbought condition. While the VIX then reached a higher price high of 28.99 on October 17th, its corresponding RSI was lower at approximately 63.72. This bearish divergence was a likely precursor to the subsequent pullback in the VIX from its elevated levels, as it suggested waning momentum despite the price making a new high. Currently, the RSI stands at 66.14, which is elevated but not yet in the overbought territory (above 70), implying that there might be further room for the VIX to advance before encountering significant momentum exhaustion.
Given the recent robust price action and the current RSI reading, a continuation of elevated VIX levels appears likely. The VIX establishing sustained support above the 20 level would reinforce expectations for continued market turbulence. However, a material decline in the VIX that results in sustained closes below 20, especially if accompanied by the RSI falling below the 50 neutral threshold, would suggest a roughly even chance of the VIX reverting to its earlier, lower trading ranges. Traders should monitor these key price and momentum levels for any shifts in market sentiment. It is important to note that the requested MACD (13, 21-day) indicator data was not provided; therefore, this analysis cannot incorporate insights from that specific momentum oscillator, which might otherwise offer additional perspective on trend strength and potential reversals.
VIX Price & Indicators (RSI_14_DAY, MACD_13_21_DAY)
Tech Sector Analysis
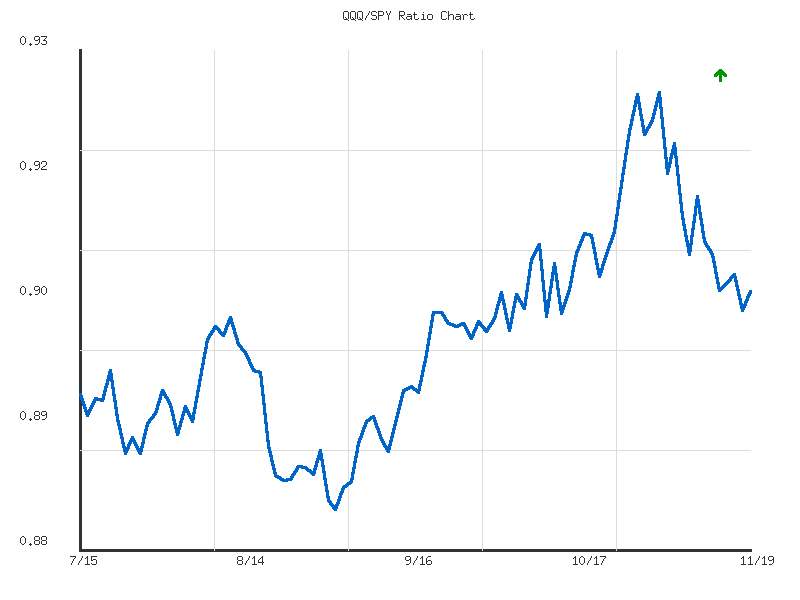
The relative performance of the NASDAQ-100 (QQQ) against the S&P 500 (SPY) over the past 14 days displays a clear, albeit weak, downward trend. The QQQ/SPY ratio initiated the period near 0.9223 and reached a high of 0.9250 on November 3rd before consistently declining. The overall trend, as provided, is “down” with “weak” strength, indicating that the technology-heavy QQQ has been underperforming the broader SPY index during this observation window. This persistent decline suggests a period where market participants have likely favored components of the S&P 500 over those heavily weighted in the NASDAQ-100.
The ratio reached its 14-day low of 0.9033 on November 18th, showing a significant relative weakness from its earlier peak. However, the subsequent trading day (November 19th) saw a marginal rebound, with the ratio closing at 0.9051. This slight recovery from the absolute low of the period could indicate an area of tentative support establishing itself around the 0.903 to 0.905 range. While the overall trend remains negative, the minor bounce on the last data point suggests that a further immediate decline in relative performance below this level is likely to encounter some resistance or at least a deceleration in the rate of underperformance.
Considering the data, the consistent decline in the QQQ/SPY ratio probably reflects a modest rotation in market leadership. Investors might be shifting capital away from the growth-oriented tech sector, which dominates QQQ, towards other segments of the broader market represented in SPY. An alternative scenario exists where, despite the observed downtrend, the “weak” strength and the bounce from the 14-day low suggest that the relative underperformance might be stabilizing. It is a roughly even chance that the ratio could consolidate within its recent range before making a more decisive move, either to reverse the relative underperformance or to break lower. A clear break and sustained trading below 0.9033 would likely signal an acceleration of QQQ’s relative weakness.
Here is a technical analysis of the QQQ/SPY ratio over the provided 90-day period.
The QQQ/SPY ratio has exhibited a weak upward trend over the observed 90-day period, as indicated by the reported trend direction and strength. Starting from a low point near 0.8834 in early September, the ratio has generally advanced, reaching a peak near 0.9250 in early November. The overall change of approximately 1.15% throughout this period suggests a gradual increase in the relative strength of QQQ against SPY, rather than a sharp shift in market leadership. The low volatility (approximately 0.0001) observed during this timeframe indicates relatively stable, albeit slow, price action without significant intraday or interday swings. This lack of high volatility implies that sudden, dramatic shifts in the QQQ/SPY dynamic are generally improbable in the near term, based solely on this historical data.
Analysis of the ratio’s price action reveals several discernible technical levels. A significant support zone appears to have formed around the 0.883-0.889 range, notably tested in late August and early September, where the ratio reversed its downward trajectory after touching its 90-day low. As the ratio ascended through September and early October, it encountered initial resistance and consolidated primarily around the 0.895-0.900 area. Following a breakout in late October, the ratio established a new resistance level near 0.9250 in early November, which currently stands as its 90-day high. The current ratio of 0.9051 sits just above the prior September-October consolidation high, suggesting this level could now serve as immediate support.
The period from early September to early November displayed a clear upward trajectory, with QQQ demonstrating increasing outperformance relative to SPY. However, since reaching its peak of 0.9250 on November 3rd, the ratio has experienced a notable pullback, retracing approximately 2.15% to its current level of 0.9051 on November 19th. This retracement has brought the ratio back down to the upper bound of its September-October trading range. While this pullback could be interpreted as a healthy consolidation after an extended run, its magnitude suggests a diminishing immediate upside momentum for QQQ relative to SPY. There is roughly an even chance that this current level near 0.905 will hold as support.
Considering the recent price action and the established technical levels, two primary scenarios appear probable. First, if the current level of 0.9051 acts as robust support—bolstered by its prior role as resistance during the September-October consolidation—a resumption of the weak upward trend is likely. In this scenario, a retest of the 0.910-0.915 area and subsequently the 0.9250 high becomes probable in the coming days or weeks. However, should the 0.9051 level fail to hold, a further retracement to the lower support zone around 0.895-0.900 is likely. A sustained break below 0.895 would indicate a more significant shift, making a test of the broader 0.883-0.889 support highly likely, which would suggest a loss of QQQ’s relative strength and potentially signal a period of underperformance. Given the “weak” trend strength and low volatility, rapid significant advancements or declines are generally improbable without a material change in these observed technical characteristics.
Ratio Analysis: QQQ/SPY
Generated for 90days timeframe analysis
IWM vs. SPY
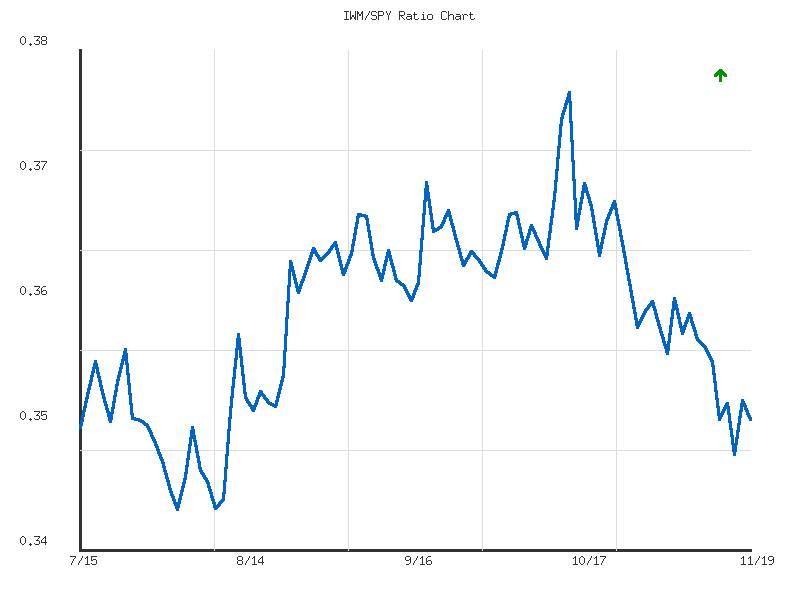
The relative performance of IWM to SPY over the past 14 days indicates a likely period of underperformance for small-cap equities relative to large-cap, technology-heavy names. The IWM/SPY ratio has exhibited a clear downward trend, declining by approximately 2.41% from its starting point on October 31st to the most recent data point on November 19th. This suggests that capital allocation during this period has favored the larger, more established companies within the S&P 500, a characteristic often observed during periods of risk aversion or flight to quality, though this analysis is strictly limited to the provided ratio data.
Examining the range, the ratio reached its peak at 0.3611 on November 5th, subsequent to an initial slight increase from the period’s beginning. Following this peak, the ratio experienced a sustained decline, establishing a low of 0.3496 on November 17th. The current ratio of 0.3523 on November 19th places it relatively closer to its 14-day low, specifically at 22.8% of the range from the low to the high. This positioning suggests that the recent momentum is predominantly bearish for IWM relative to SPY, although the “weak” strength of the trend implies a moderate degree of conviction in this movement.
While the overall trend is definitively downward, the “weak” strength indicator, alongside relatively low volatility (0.00001213), suggests that the decline has been gradual rather than precipitous. This pattern often implies a steady reallocation rather than a panic sell-off. The minor bounce observed from the low on November 17th to the close on November 18th, before a slight dip on November 19th, might represent a roughly even chance of short-term stabilization or simply a retest of overhead resistance from the prevailing downtrend. It is unlikely to signify a robust reversal without further data indicating sustained upward momentum in the ratio.
Given the current data, further underperformance of IWM against SPY appears likely in the immediate term, assuming the current trend persists. However, the weak strength of this trend also introduces the possibility that any shift in market sentiment, not discernible from this data, could lead to a stabilization or modest reversal in the ratio with a roughly even chance. Traders would be prudent to monitor for any sustained break above the recent average ratio of 0.3565 as an initial indication of a potential shift in relative strength favoring IWM, though such a development is currently unlikely based on the provided 14-day data.
CMT Technical Analysis: IWM/SPY Ratio (90-Day View)
The IWM/SPY ratio, a measure of the relative performance between the Russell 2000 (IWM) and the S&P 500 (SPY), has displayed a weak, sideways trend over the past 90 days. The data indicates the ratio operated within a defined range, establishing a significant low of approximately 0.3456 on August 1st and reaching its peak at roughly 0.3763 on October 15th. The minimal overall change of approximately 0.17% across the entire period corroborates the weak directional strength, suggesting a general equilibrium or lack of sustained leadership from either small-cap or large-cap segments throughout this timeframe. The volatility metric for this period is notably low, further emphasizing the lack of aggressive directional momentum in the relative performance.
However, a closer examination of the recent price action reveals a distinct shift from the broader sideways pattern. Following the October 15th high of 0.3763, the IWM/SPY ratio has experienced a sustained decline, currently settling at 0.3523. This pullback is significant, moving the ratio well below its 90-day average of 0.3597. Furthermore, the current ratio sits in the lower portion of its historical range, specifically at the 21.63rd percentile, as indicated by the relative position data. This recent trajectory strongly suggests a period of renewed large-cap outperformance relative to small-caps since mid-October, signaling a potential shift in short-term market leadership.
The current ratio of 0.3523 is testing a critical technical juncture. Historical data shows that the range between approximately 0.3515 and 0.3525 has acted as both support and resistance at various points within the 90-day window, notably serving as support in late July and early August. This convergence of prior price action suggests that the current level is likely to be a significant battleground for relative strength. Should this support zone hold, a rebound towards the average ratio of 0.3597 is a roughly even chance, implying a potential stabilization or even a minor rotation back into small-caps. Conversely, a decisive breach below this level would render further declines more probable, with the August 1st low of 0.3456 serving as the next identifiable support target.
Considering alternative scenarios, if the current support level holds and a sustained bounce materializes, especially if driven by a strengthening IWM relative to SPY, it would indicate that the recent downtrend might be a temporary retracement within the larger sideways channel. In such an event, a move back towards the 0.360-0.365 resistance region observed throughout September and early October becomes probable. Conversely, a failure to hold the 0.3515-0.3525 zone, particularly on increasing relative volume (not provided but contextually relevant for a technical breakout), would likely invalidate the sideways thesis and suggest a developing bearish trend for small-cap relative strength, indicating that large-cap outperformance is improbable to reverse in the near term. The overall “weak” strength of the trend makes sudden, decisive shifts less likely without a clear catalyst from internal relative price action.
Ratio Analysis: IWM/SPY
Generated for 90days timeframe analysis
Commodities
Here is an analysis of the provided market data, adhering strictly to technical analysis principles and ICD-203 estimative language guidelines.
| Symbol | Daily Percent Change |
|---|---|
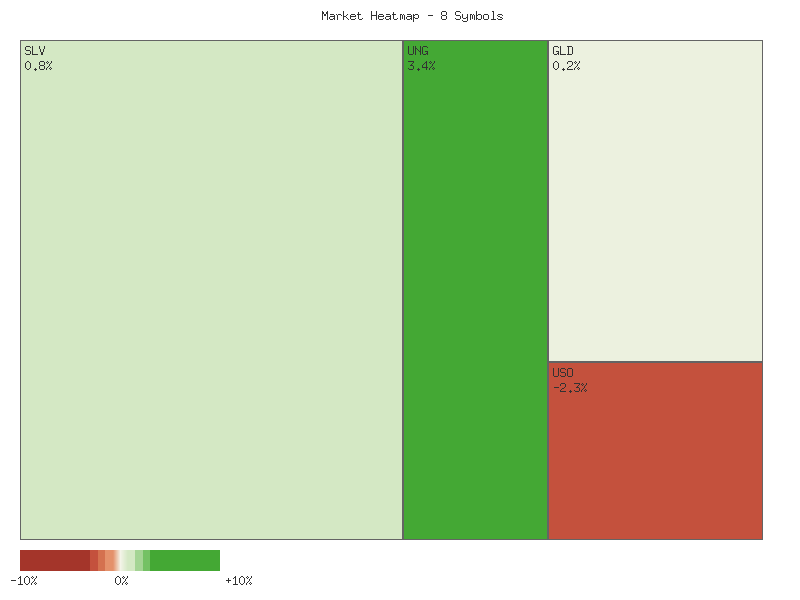
| UNG | 3.445% |
| CPER | 1.193% |
| SLV | 0.803% |
| GLD | 0.174% |
| DBC | -0.973% |
| CORN | -1.581% |
| USO | -2.261% |
| UGA | -3.367% |
Analysis of the provided daily percentage change data across these eight commodity-linked instruments reveals a mixed market sentiment for the period. The market breadth for this specific basket of symbols is precisely balanced, with four advancing symbols and four declining symbols. This even distribution suggests a roughly even chance of identifying a clear directional bias for the composite group based solely on this single day’s activity. The dispersion in performance, ranging from UNG’s robust 3.445% gain to UGA’s significant 3.367% decline, indicates substantial idiosyncratic movement within different commodity sectors rather than a uniform market shift.
Examining the advancing symbols, UNG (natural gas) demonstrated notable strength, leading the group with a substantial gain. CPER (copper) and SLV (silver) also posted positive, albeit more modest, advances. GLD (gold) registered a minor gain, indicating a slight positive bias for precious metals within this cohort. The relative strength observed in these symbols, particularly UNG, might suggest a concentrated flow of capital into specific areas of the commodity market, potentially driven by factors unique to those sectors.
Conversely, the declining symbols experienced varying degrees of weakness. UGA (gasoline) recorded the most significant decline, closely followed by USO (oil). CORN and DBC (broad commodities) also saw negative performance, with DBC showing a more contained retreat compared to the energy and agricultural components. The weakness in these energy and agricultural ETFs suggests potential selling pressure or a lack of buying interest in these specific areas for the given trading session.
Given the perfectly balanced market breadth of four advancers and four decliners, drawing a conclusive overall market sentiment for this entire basket is certainly not possible from this single day’s data. The wide range between the strongest and weakest performers (a spread of approximately 6.8%) indicates a highly fragmented market environment among these commodities. While some sectors show signs of strength, others exhibit clear weakness, implying that any broad market generalization would be unsupported. Future sessions would be necessary to establish if these individual performances represent the beginning of trends or merely isolated daily fluctuations.
Market Commentary: Short-Term Technical Outlook for Key Commodity ETFs
Analysis of the provided two-day market data for selected commodity-linked ETFs reveals a divergence in short-term technical outlooks. With only two data points per instrument, identified patterns are nascent and should be interpreted with caution. However, distinct short-term directional biases emerge, ranging from strong bullish continuation to clear bearish reversals. Volume data, where significant, adds conviction to these price structures. Our assessment focuses exclusively on immediate price and volume action to identify probable next moves.
Several instruments exhibited notably bullish technical action. UNG, the Natural Gas Fund, presents a strong bullish continuation pattern, marked by two consecutive green candles and a significant gap up on the second day. Daily closes near highs indicate sustained buying pressure. While volume decreased on the second day, the aggressive price action suggests a high probability of continued upward momentum. Similarly, CPER, the Copper ETF, demonstrated a bullish reversal, gapping up significantly on day two after a bearish day one close. Its strong bullish close effectively negated prior weakness, and this “piercing line” type of action implies a likely shift in short-term sentiment towards the upside, despite decreased volume.
The precious metals ETFs, SLV (Silver) and GLD (Gold), provided mixed signals, suggesting a roughly even chance of continued bullish momentum or a period of consolidation. Both gapped up on the second day, closing higher than the preceding day. However, this initial bullishness was tempered by relatively long upper shadows on the second day’s candles. These shadows indicate that while buyers were active at the open, higher prices met significant selling pressure, preventing closes near the day’s highs. Increased volume for both suggests active participation from both sides, contributing to this indecision. Consequently, the immediate directional bias for SLV and GLD appears uncertain, with a strong likelihood of further volatility or range-bound trading.
In contrast, several ETFs displayed bearish technical patterns. CORN exhibited clear bearish continuation, with a gap down on the second day followed by a strong bearish candle closing near its low, indicating prevailing selling pressure and a high probability of further declines. More strikingly, USO (Oil), DBC (Broad Commodities), and UGA (Gasoline) all demonstrated bearish reversal patterns. USO’s strong bullish first day was significantly overshadowed by a bearish gap down and a large bearish candle on the second day, suggesting a ‘dark cloud cover’ or bearish engulfing variant. DBC and UGA both formed bearish engulfing patterns, completely enveloping their bullish first day with larger bearish candles. This bearish engulfing was accompanied by a notable increase in volume for both, lending strong conviction to the downward reversal. These patterns suggest a high probability of further downward price action for these instruments.
In summary, the two-day data presents a bifurcated market. UNG and CPER appear technically poised for further upside; conversely, CORN, USO, DBC, and UGA show strong indications of downside continuation or reversal. Precious metals, SLV and GLD, reflect a battle between bullish opening strength and subsequent selling pressure, leading to an uncertain near-term outlook. Given the extremely limited timeframe, these technical signals require close monitoring for confirmation or invalidation. Traders are advised to exercise prudence and manage risk effectively.
Performance Heatmap (SLV, GLD, CORN, CPER, USO, DBC, UGA, UNG)
Generated for 2days timeframe analysis
Technical Analysis of SLV (90-Day)
SLV’s price action over the last 90 days reveals a significant uptrend followed by a period of correction and subsequent rebound attempts, marked by increasing volatility. From mid-July to late August, SLV initially saw some bullish momentum with prices peaking near .72, accompanied by the 14-day Relative Strength Index (RSI) entering overbought territory at 70.45 on July 22. This strength was short-lived, as prices sharply declined into late July, and the RSI retreated significantly, bottoming out in the mid-40s by month-end, indicating a loss of momentum. August largely comprised a period of consolidation, with a gradual upward drift that set the foundation for a more pronounced rally.
The period from late August through mid-October was characterized by a robust and sustained uptrend. SLV experienced a powerful breakout, making a series of higher highs and higher lows, with prices climbing from the mid- to a peak around .41 on October 15. This strong ascent was largely supported by increased trading volume on upward movements, suggesting strong buying interest. Concurrently, the 14-day RSI consistently remained in overbought conditions for an extended duration, frequently exceeding 70 and peaking at an extreme 84.32 on October 13. While sustained overbought readings can indicate a strong trend, such extreme levels do increase the likelihood of an impending correction or consolidation phase due to stretched momentum.
A significant shift in momentum occurred from mid-October into early November. SLV underwent a sharp and rapid correction from its peak, plummeting towards the low-. This decline was accompanied by notably high trading volumes on down days, particularly on October 17 and October 21, indicating substantial selling pressure. The 14-day RSI reflected this reversal, falling steeply from its extreme overbought state to levels in the mid-50s and even approaching oversold territory around 46.51 on October 27, effectively normalizing momentum after the prolonged bullish run. The price action thereafter suggested a period of increased uncertainty and volatility as SLV attempted to find a stable footing.
More recently, SLV mounted a strong rebound in early November, particularly from November 10 to November 12, regaining a significant portion of the prior decline and reaching levels near the mid-October peak. This renewed upward movement was again accompanied by increased volume, lending some credibility to the rally. However, this rebound quickly encountered resistance, leading to a sharp two-day pullback on November 13-14 and subsequent consolidation. The RSI mirrored this action, surging back toward overbought levels (69.08 on November 12) but failing to sustain them, retreating into the mid-50s by November 17 before a slight recovery.
As of the latest data point, SLV is observed to be consolidating, with the RSI currently around 57.9, indicating neutral to slightly bullish momentum. The previous peak around .40 from mid-October and the recent November 12 high of .345 are likely to act as significant overhead resistance. A sustained break above these levels, ideally with expanding volume and a renewed surge in RSI into overbought territory, would likely signal a continuation of the broader uptrend. Conversely, a failure to break above resistance, followed by a decline below recent support in the mid- to low- range, particularly if accompanied by increased volume and RSI falling into oversold conditions, would likely indicate further downside and a potential retest of the October lows. Given the recent volatility and the RSI’s position, there appears to be a roughly even chance of either a continued consolidation leading to a retest of resistance or a breakdown towards lower support levels in the immediate term.
SLV Price & Indicators (RSI_14_DAY, MACD_13_21_DAY)
GLD Technical Analysis: Navigating a Post-Peak Environment
The GLD exchange-traded fund has experienced a dynamic period over the last 90 days, characterized by a robust uptrend from late August through mid-October, culminating in a significant top, followed by a sharp reversal and subsequent consolidation. From a technical perspective, the price action and momentum indicators provide a relatively clear narrative, suggesting a shift in market sentiment from aggressive buying to a more balanced or even cautious posture.
During the period spanning from late August to mid-October, GLD exhibited a strong and sustained bullish trend. The price ascended from approximately to an ultimate peak above . This upward trajectory was marked by consistent higher highs and higher lows, often supported by increasing volume on up-days, signaling strong conviction among buyers. Complementing this price action, the 14-day Relative Strength Index (RSI) consistently registered in overbought territory (above 70). This indicator progressively intensified, reaching extreme readings above 80, ultimately peaking at an exceptionally high 87.33 on October 20th, indicative of an overextended market and increased risk of a pullback.
The market top and subsequent reversal were pronounced, occurring between October 17th and October 21st. On October 17th, GLD printed a candle with a notable upper wick, suggesting initial selling pressure near the high of .28, albeit closing higher. However, the critical bearish confirmation arrived on October 21st, when GLD experienced a substantial price decline from its prior close of .15 to .24, accompanied by very high volume exceeding 53 million shares. This powerful downward move, immediately following the RSI’s peak at 87.33, is a strong technical signal of a shift in momentum. The rapid fall in RSI to approximately 60 on October 21st further corroborated the loss of upward strength.
Following this significant reversal, GLD entered a period of retracement and consolidation. The price subsequently fell below key short-term support levels, and the 14-day RSI declined further, moving below the neutral 50-level on October 28th, which typically indicates bearish momentum has gained control. While GLD has attempted to stabilize and has seen the RSI recover slightly to 53.61 by November 19th, suggesting a roughly even chance of either continued consolidation or a modest recovery in the immediate term, it remains well off its October highs. The current technical posture indicates that the substantial resistance level established around - will likely pose a significant challenge to any renewed bullish attempts. A test of the approximate - area, which served as a temporary floor in early November, is a plausible alternative scenario should current minor support around fail to hold.
GLD Price & Indicators (RSI_14_DAY, MACD_13_21_DAY)
Gold/Silver Ratio
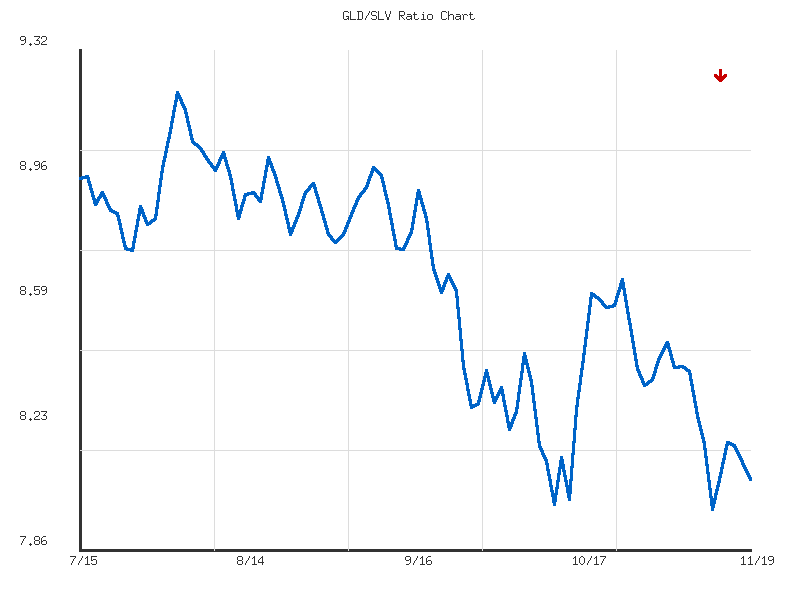
The GLD/SLV ratio has exhibited a moderate downward trend over the observed 14-day period, declining approximately 3.49% from its initial levels. The ratio peaked at roughly 8.47 on November 4th, 2025, before commencing a decline that established a short-term low near 7.99 on November 12th, 2025. The current ratio of 8.07 sits near the lower bound of this recent trading range, indicating that Silver (SLV) has generally outperformed Gold (GLD) over this timeframe.
Following the 14-day low, the ratio experienced a modest upward bounce, reaching approximately 8.18 on November 14th, 2025. However, this recovery proved temporary, with the ratio subsequently retreating to its current level of 8.07. This recent price action suggests that while the strong downward impetus may have briefly abated, the underlying relative strength of SLV against GLD has not fundamentally reversed. The observed volatility of 0.023 indicates a relatively stable, albeit moderately declining, trend rather than erratic or significant swings.
Given the established moderate downward trend and the current ratio’s proximity to its 14-day low, it is likely that Silver will continue to exhibit relative strength against Gold in the immediate future, potentially challenging or falling below the 7.99 support level. An alternative scenario suggests a roughly even chance that the ratio could consolidate around the 8.00-8.07 area, potentially finding temporary support after the recent decline. A more significant reversal to the upside, challenging the upper bound of the 14-day range at 8.47, appears unlikely without a substantial shift in the relative performance dynamics of GLD and SLV, which is not currently indicated by the provided data.
GLD/SLV Ratio Analysis: Moderate Downtrend Persists at Key Support
The GLD/SLV ratio has exhibited a clear and moderate downtrend over the observed 90-day period, commencing from mid-July 2025 and continuing through mid-November 2025. This consistent decline in the ratio technically implies that silver (SLV) has generally outperformed gold (GLD) on a relative basis during this timeframe. The ratio initiated the period around 8.95, reached a peak near 9.20 on August 1st, and has since steadily depreciated by approximately 9.83% to its current value of 8.07 as of November 19th. This sustained technical preference for silver over gold is a significant takeaway from the provided data. The moderate strength of this downtrend suggests a structured rather than impulsive decline, characterized by lower highs and lower lows.
The 90-day trading range for the GLD/SLV ratio is defined by a high of 9.20 observed in early August and a critical low of 7.98 recorded on November 12th. The current ratio of 8.07 is situated very close to this lower extreme, indicating that substantial downside momentum has prevailed over the analysis period. The ratio’s relative position at just 7.16% above its 90-day low underscores the severity of the recent decline. Following the establishment of this new 90-day low at 7.98, the ratio experienced a brief rebound to approximately 8.18 before retracing slightly to its current level. This price action suggests that the 7.98-8.00 zone is presently providing immediate technical support, having been tested and held, albeit precariously, for a few trading sessions. The subsequent inability to sustain the rebound above 8.18 suggests that overhead resistance remains formidable.
Considering the established moderate downtrend and the current positioning near multi-month lows, the GLD/SLV ratio is likely to continue its downward trajectory. A definitive breach below the 7.98 support level would corroborate this technical assessment and could indicate further declines, potentially leading to new lower extremes, as no apparent support levels are immediately visible below this point within the provided 90-day data. Alternatively, there is a roughly even chance that the 7.98-8.00 area could solidify as a short-term base, potentially leading to a more sustained rebound towards previous minor resistance levels around 8.15-8.25. However, without additional technical confirmations such as higher lows or a clear break above recent swing highs, a significant reversal of the prevailing downtrend is currently judged as unlikely. Traders should monitor the 7.98 level closely for signs of either a breakdown or a more robust consolidation.
Ratio Analysis: GLD/SLV
Generated for 90days timeframe analysis
Bonds
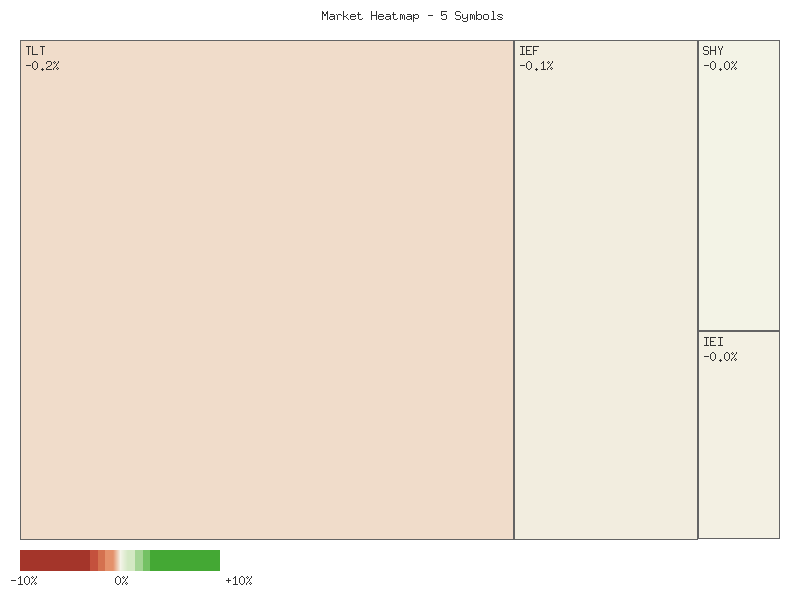
The daily performance of the selected fixed income instruments presents a predominantly negative picture for the session, with only one outlier demonstrating positive momentum. The following matrix summarizes the daily percentage changes, sorted in descending order:
| Symbol | Daily Percent Change |
|---|---|
| UTHY | 0.143% |
| SHY | -0.006% |
| IEI | -0.029% |
| IEF | -0.052% |
| TLT | -0.180% |
Observing the individual performance, UTHY notably registered a positive daily change of 0.143%, distinguishing itself from the broader fixed income spectrum analyzed. This isolated positive movement in UTHY suggests relative strength in this specific instrument for the session. However, based on a single data point, it is unlikely to infer a sustained bullish trend, as the session’s gain could represent mere intra-day volatility or a temporary repositioning. There is a roughly even chance that UTHY’s positive performance might continue into the next session, but a reversion to the mean or a shift to negative territory remains a significant possibility without further confirming data.
Conversely, TLT, representing longer-duration bonds, experienced the most substantial decline, falling by 0.180%. This significant negative movement, compared to its peers, suggests notable weakness within the longer end of the yield curve for the analyzed period. The magnitude of this drop makes it probable that negative sentiment concentrated on longer durations during this session. An alternative scenario is that this decline is an isolated event, with a moderate probability of a quick bounce-back if market participants view it as an oversold condition. However, continued downside pressure for TLT is likely if the underlying technical conditions that drove this move persist.
The short to intermediate-term bond ETFs—SHY, IEI, and IEF—all concluded the session with marginal negative changes of -0.006%, -0.029%, and -0.052%, respectively. These minor declines indicate a general, albeit slight, cautious or bearish sentiment across these durations. The negligible percentage changes imply that these instruments are near price equilibrium, and it is highly unlikely that these small movements alone signify the start of a pronounced trend. There is a roughly even chance that these instruments will oscillate around their current levels, with a low likelihood of a significant breakout or breakdown without additional market catalysts or volume confirmation.
In summary, the provided single-day data indicates a mixed performance with a lean towards negative, characterized by UTHY’s relative outperformance and TLT’s notable underperformance. While UTHY exhibited some strength, its sustainability is unlikely to be confirmed by just one day’s data. Similarly, TLT’s weakness, while significant, requires further observation to validate as a developing trend. The minor declines in SHY, IEI, and IEF are unlikely to be indicative of strong directional conviction. Technical analysts would require additional price and volume data over several sessions to identify meaningful trends, establish support/resistance levels, or confirm any pattern formations.
Greetings to all market participants. This technical analysis provides a concise overview of the recent price action for several key Treasury bond ETFs and one inverse Treasury ETF, based solely on the provided two days of candlestick and volume data. Our focus is on identifying immediate-term trends and potential turning points within the fixed-income landscape.
The market data for the past two trading sessions reveals a broad bearish bias across several duration segments of the US Treasury market, with distinct nuances in momentum and conviction. This general directional alignment, particularly among the core bond ETFs (TLT, IEF, IEI), suggests underlying market sentiment is predominantly favoring lower bond prices, which inherently corresponds to rising bond yields.
Examining the longer and intermediate duration Treasury ETFs, TLT (iShares 20+ Year Treasury Bond ETF) experienced two consecutive red candles, with the closing price on the second day below the first day’s close and open. This indicates significant selling pressure. However, volume decreased notably on the second day, moving from over 31 million to 24 million shares. While a continued downtrend in TLT is likely in the immediate term, the reduced volume could imply a lessening of selling intensity, suggesting that a short-term consolidation or minor rebound is a plausible alternative scenario before further directional commitment. In contrast, IEF (iShares 7-10 Year Treasury Bond ETF) also recorded two consecutive red candles, with Day 2 closing below Day 1’s close. Critically, volume for IEF increased substantially on the second down day, from 8.5 million to 12.3 million shares. This increase in selling volume concurrent with price decline lends robust confirmation to the bearish momentum. A continued decline in IEF is highly likely in the immediate term, presenting a stronger bearish signal than TLT.
Moving to the mid and shorter duration segments, IEI (iShares 3-7 Year Treasury Bond ETF) followed a similar pattern to TLT and IEF, displaying two consecutive red candles and lower closes. However, its volume slightly decreased on the second day (from 1.97 million to 1.87 million shares), similar to TLT but less pronounced. This indicates prevailing bearish sentiment, and a continued downtrend for IEI is likely, but the slight volume reduction implies a marginally weaker conviction compared to IEF. The SHY (iShares 1-3 Year Treasury Bond ETF), representing the shortest duration, exhibits notably different price action. Both days formed very small red candles, with closes almost identical and within a very tight range. Volume also slightly decreased. This suggests a period of pronounced indecision and consolidation rather than a clear directional trend. A continuation of range-bound trading for SHY is a roughly even chance, with a marginal downward bias due to the presence of two red candles being likely to persist within this tight range for the immediate future.
The UTHY (Ultrashort Treasury ETF - 20+ year), which typically moves inversely to long-term Treasury bond prices, also offers corroborating evidence. Over the two-day period, UTHY displayed a small white candle on the second day, closing higher than the previous day’s close. This upward movement, while marginal and on significantly reduced volume (6,834 to 3,986 shares), aligns directionally with the bearish signals observed in TLT, IEF, and IEI. Its price action is consistent with a market environment where bond yields are rising. Given the broader bearish trend in bond prices, a continued upward trajectory for UTHY, indicative of rising yields, is likely. However, the markedly low and decreasing volume raises questions about the sustainability of any strong directional move in UTHY itself without further conviction.
In summary, the prevailing technical evidence points to a bearish environment for intermediate and long-duration Treasury bonds as represented by IEF, IEI, and TLT. IEF presents the clearest bearish continuation signal due to increasing volume on its decline. While TLT and IEI show similar directional weakness, their decreasing volume on the second day introduces a plausible alternative scenario of near-term selling exhaustion or consolidation. SHY, representing the shortest duration, remains largely indecisive, suggesting stability or a very minor drift within a tight range. The inverse nature of UTHY reinforces the expectation of rising yields, despite its own low-volume price action.
Performance Heatmap (TLT, UTHY, IEF, IEI, SHY)
Generated for 2days timeframe analysis
Magnificent 7 & Friends
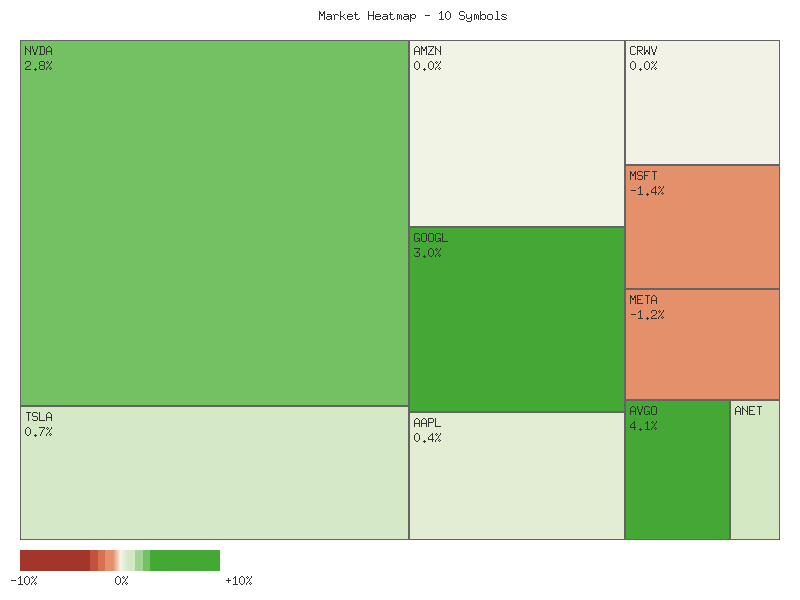
Market Commentary: Single-Day Performance Snapshot
| Symbol | Daily Percent Change |
|---|---|
| AVGO | 4.091% |
| GOOGL | 3.001% |
| NVDA | 2.845% |
| ANET | 1.098% |
| TSLA | 0.683% |
| AAPL | 0.408% |
| AMZN | 0.049% |
| CRWV | 0.033% |
| META | -1.233% |
| MSFT | -1.351% |
An analysis of the provided single-day percentage change data for the ten specified equities suggests a somewhat bifurcated performance within this cohort. A majority of the assets, specifically eight out of ten, recorded positive daily gains, which might indicate a generally positive sentiment for these particular stocks during the observed period. However, the magnitude of these gains varied significantly, ranging from minimal fractional increases to notable upticks exceeding 4%. The presence of two significant decliners at the bottom of the list introduces a counterpoint to the broadly positive tenor.
Broadcom (AVGO) demonstrated the strongest performance, advancing by 4.091%, which is a substantially higher percentage change compared to its peers within this dataset. Following closely were Alphabet (GOOGL) with a 3.001% gain and NVIDIA (NVDA) with a 2.845% increase. This strong showing from these three technology-related companies suggests that a segment of the market may be demonstrating a higher degree of conviction in these specific names. Based solely on this one-day data, it is likely that these assets experienced notable buying pressure, perhaps indicating relative strength or specific catalysts not detailed in the provided metrics.
Conversely, Microsoft (MSFT) and Meta Platforms (META) were the sole decliners, posting losses of -1.351% and -1.233% respectively. This relatively synchronized negative performance at the lower end of the spectrum is notable. While a single day’s movement does not establish a trend, it is a roughly even chance that these declines are attributable to either profit-taking after previous gains or potential shifts in short-term sentiment specific to these companies. Without additional data such as volume or prior price action, it is difficult to ascertain the underlying technical impetus for these movements; however, their positions at the bottom of the list indicate a clear short-term underperformance relative to their peers.
The remaining positive performers—Arista Networks (ANET), Tesla (TSLA), Apple (AAPL), Amazon (AMZN), and CrowdStrike Holdings (CRWV)—exhibited more moderate gains. ANET’s 1.098% gain stands out in this mid-tier, while TSLA, AAPL, AMZN, and CRWV saw increases below 1%, with AMZN and CRWV showing very marginal upticks. The minor changes in these securities make it unlikely that significant directional conviction was present for this single day. It is a roughly even chance that these assets traded largely sideways, with neither strong buying nor selling pressure dominating the session, suggesting a period of consolidation or indecision compared to the more pronounced moves seen in AVGO, GOOGL, NVDA, MSFT, and META.
Greetings fellow traders,
The past two trading days present a nuanced picture across the selected equities, with a notable divergence in individual stock performance rather than a cohesive market trend. Rigorous analysis of the provided candlestick data reveals varied technical postures among these instruments.
GOOGL stands out with a strong bullish engulfing pattern observed on the second day. This was characterized by a significant white candle that fully absorbed the prior day’s bearish price action and closed at a new high, supported by a substantial increase in volume (from 47.8M to 65.6M). This confluence of decisive price action and robust volume makes it highly likely that GOOGL will experience continued short-term upward pressure. Similarly, NVDA and AVGO demonstrated robust bullish reversals. NVDA formed a large white candle on the second day, reclaiming the prior day’s losses and extending higher, albeit on slightly reduced volume. AVGO also executed a strong bullish reversal, with its second-day closing significantly higher and erasing the prior day’s decline, again with a minor volume decrease. For both NVDA and AVGO, we estimate that continued upward movement is likely, supported by the decisive price action, though the moderate decline in volume on the upward move for these two warrants observation for confirmation of persistent buying strength.
A segment of the analyzed stocks exhibited patterns suggesting potential short-term reversals or periods of consolidation following initial dips. TSLA saw a bullish reversal on its second day, closing higher than its previous day’s close and forming a white candle, accompanied by a modest decrease in volume. This indicates a likely attempt to regain upward momentum, but the reduced volume on the bullish day suggests that conviction behind this move may not be robust, thus a roughly even chance exists for either continued ascent or a return to consolidation. ANET also showed a minor bullish rebound on the second day, closing higher after an initial dip, but this occurred on significantly lower volume, making sustained upside unlikely without a notable increase in buying interest. CRWV concluded its two-day period with minimal net change, forming a tight range on the second day with significantly decreased volume, indicating market indecision. For CRWV, a roughly even chance exists for a breakout in either direction as market participants await a stronger catalyst.
Conversely, certain equities are displaying signs of continued or emerging weakness. MSFT recorded two consecutive bearish days, with the second day closing lower than the first and posting a lower high and lower low, though with reduced selling volume. This pattern suggests that continued near-term weakness is likely for MSFT, although the declining volume could also precede a relief bounce if selling pressure diminishes further. META, after an initial positive day, formed a dark cloud cover pattern on its second day, with a lower close and lower high on decreased volume, suggesting a shift in momentum to the downside. It is likely that META will experience further selling pressure. AMZN demonstrated persistent indecision. After a bearish first day, the second day presented a small-bodied candle with marginal upward closing movement, lower highs, and lower lows, accompanied by declining volume. This price action suggests a roughly even chance of either a continuation of the prior downward pressure or a search for support around current levels.
Considering the aggregate data, the market, as represented by these ten instruments, appears to be characterized by divergence rather than a uniform trend over the two-day period. While some major names like GOOGL and NVDA exhibit strong bullish conviction, others such as MSFT and META show clear signs of weakness. Volume trends are mixed; increased volume on bullish moves for some (GOOGL) offers higher conviction, while decreased volume on bullish moves (AAPL, TSLA, ANET) or bearish moves (MSFT, META) introduces uncertainty regarding the sustainability of respective price actions. We estimate that the market is currently in a phase where stock-specific technical levels and underlying dynamics are likely dictating individual trajectories more than broad market sentiment. An alternative scenario to sustained individual trends is that these divergent movements might converge towards a more uniform direction if a broader market catalyst emerges, but based strictly on the provided two-day data, this outcome is unlikely. Traders should monitor volume trends for confirmation of any developing directional biases, as the current data suggests fragmented momentum.
Performance Heatmap (TSLA, MSFT, AAPL, META, NVDA, AVGO, GOOGL, AMZN, CRWV, ANET)
Generated for 2days timeframe analysis
S&P 500 Sector Breadth
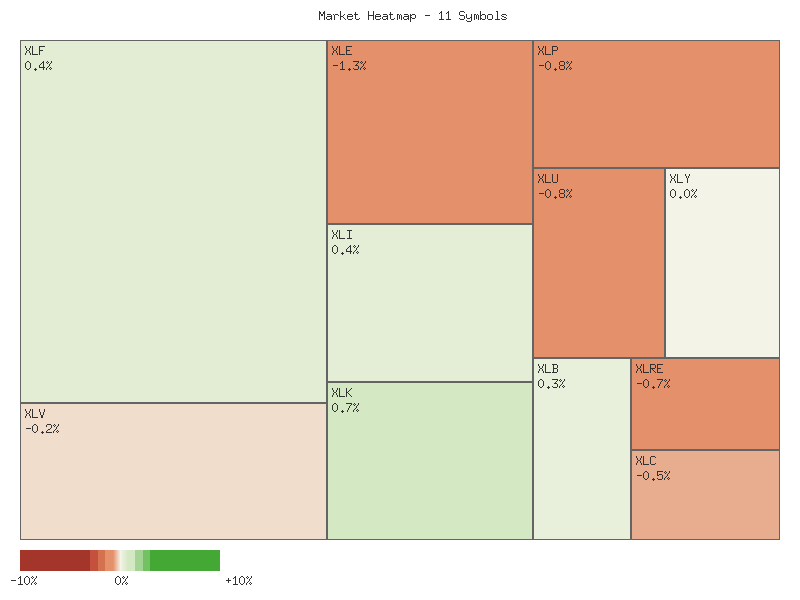
The daily performance of the eleven S&P 500 sectors indicates a moderately divergent market breadth. Based on the provided data, five sectors registered advances, while six sectors recorded declines for the day. This suggests a slightly negative market breadth, implying that a majority of the analyzed components experienced downward price action. The overall picture, however, warrants a deeper look into the nature of these movements.
Here is a sorted breakdown of the daily percentage change for each sector:
| Symbol | Daily Percent Change |
|---|---|
| XLK | 0.7458% |
| XLF | 0.4089% |
| XLI | 0.3537% |
| XLB | 0.2631% |
| XLY | 0.0004% |
| XLV | -0.1704% |
| XLC | -0.5367% |
| XLRE | -0.7471% |
| XLP | -0.7523% |
| XLU | -0.8239% |
| XLE | -1.2742% |
A granular examination of the sector performance reveals notable patterns. Among the offensive sectors, XLK (Technology), XLF (Financials), XLI (Industrials), XLB (Materials), and XLY (Consumer Discretionary) all advanced, with XLK leading the gains. Conversely, XLC (Communication Services) and XLE (Energy) experienced declines, with XLE being the weakest performer overall. Across the defensive sectors, a consistent trend emerges: XLV (Health Care), XLRE (Real Estate), XLP (Consumer Staples), and XLU (Utilities) all recorded negative daily changes. Notably, XLU exhibited the second-largest decline, following XLE.
Considering the relative performance, it is likely that market participants are exhibiting a risk-on posture. The consistent decline across all defensive sectors strongly suggests capital rotation out of perceived safe-haven assets. Concurrently, the advancement of a majority of offensive sectors (5 out of 7) supports this inclination, indicating a preference for growth-oriented segments of the market. However, the slightly negative market breadth, primarily driven by the broad weakness in defensive sectors and the notable declines in XLC and XLE, suggests that the enthusiasm for risk is not entirely universal across all offensive categories. There is a roughly even chance that this points to a selective risk-on environment rather than a broad-based surge, with certain offensive sectors facing sector-specific headwinds, or perhaps a portion of capital exiting some cyclical areas to concentrate into others.
Market Commentary: SPDR Sector ETF 2-Day Technical Outlook (November 18-19, 2025)
The short-term technical landscape for key SPDR sector ETFs over the past two trading days presents a mixed picture, with a slight tilt towards bearish momentum or indecision across a majority of sectors. Several defensive and cyclical sectors exhibit patterns that likely suggest continued downward pressure or reversals from previous gains. Specifically, Consumer Staples (XLP), Real Estate (XLRE), and Utilities (XLU) all display strong bearish signals. XLP formed a bearish engulfing pattern on the second day, closing lower than its open after a smaller bullish day, and XLRE also showed a clear bearish engulfing pattern on increased volume. XLU recorded two consecutive strong bearish candles, with the second day making a lower low and closing near its session low on relatively consistent volume. These patterns, particularly the engulfing formations and sustained selling in XLU, likely indicate that bearish momentum may continue in the immediate future for these traditionally defensive sectors.
Further weakness appears evident in several cyclical and growth-oriented sectors. Communication Services (XLC) observed a notable bearish reversal on the second day; after opening higher, it sold off significantly to close well below its open and prior day’s close, despite hitting a higher high, with volume nearly halved. This pattern likely indicates a loss of bullish conviction. Similarly, Energy (XLE) charted a bearish engulfing pattern on increased volume following a strong bullish first day, suggesting a likely bearish reversal. Consumer Discretionary (XLY) presented a nuanced bearish signal; after a strong bearish Day 1, Day 2 opened higher but ultimately sold off to close near the prior day’s close, making a new lower low and experiencing significantly reduced volume. This price action, resembling a gravestone doji on Day 2 following a prior bearish candle, points to a likely continuation of bearish sentiment as the attempted rally was not sustained.
Conversely, some sectors showed relative resilience or outright bullish reversals. Technology (XLK) offered a significant bullish engulfing pattern on the second day, with price action reversing a prior bearish day to close notably higher and creating a new higher high, albeit on slightly reduced volume. This pattern likely indicates a bullish reversal and potential for upward continuation. Financials (XLF) showed two consecutive small bullish candles, with the second day closing marginally higher, though with declining volume, suggesting a slight bullish bias but with waning momentum. Industrials (XLI) also ended with a minor bullish candle on Day 2, closing higher than Day 1, but with reduced volume and small body candles, indicating a roughly even chance of minor bullish continuation or consolidation. Materials (XLB) exhibited a similar pattern of minor bullishness with reduced volume, making a higher close on Day 2.
Healthcare (XLV) stands out with a mixed signal; a strong bullish candle on Day 1 was followed by a smaller, bearish candle on Day 2, which remained within the range of the first day’s body. Volume decreased on the second day. This “bearish harami” pattern presents a roughly even chance of either a minor correction before potential bullish continuation or an early sign of a reversal, requiring further confirmation. Overall, the preponderance of bearish reversal or continuation patterns, particularly in defensive sectors and key cyclical areas like Energy and Communication Services, suggests that the market may experience general downside pressure in the very short term. However, the strong bullish reversal in Technology presents an alternative scenario where momentum could shift if the tech sector’s gains expand, potentially offsetting weakness elsewhere. Traders should monitor volume trends and subsequent price action closely for confirmation of these short-term indications.
Performance Heatmap (XLP, XLRE, XLI, XLU, XLV, XLY, XLF, XLB, XLE, XLC, XLK)
Generated for 2days timeframe analysis
XLY vs XLP
The XLY/XLP ratio exhibited a clear, moderate downward trend over the observed seven-day period, declining by approximately 5.19%. This pattern indicates a consistent underperformance of the Consumer Discretionary sector (XLY) relative to the Consumer Staples sector (XLP) during this timeframe. The average ratio for the period was 2.998, with the current ratio of 2.934 residing at the lower end of the observed range, near the recorded low of 2.911. The sustained decline in this ratio is indicative of a market environment where investors are likely shifting capital towards more defensive sectors, suggesting a general reduction in risk appetite.
Analyzing the daily price action reveals a consistent depreciation from the initial high of 3.094 on November 11th, reaching a trough of 2.911 on November 18th. The ratio then experienced a marginal rebound to 2.934 on November 19th. This slight recovery on the final day, following a new low for the period, presents a roughly even chance of being a brief technical bounce within a prevailing downtrend or a nascent attempt to establish a short-term support level. However, given the moderate strength of the preceding downtrend and the limited magnitude of this rebound, a reversal of the established trend is unlikely to be confirmed with just this single data point.
Considering the established moderate downward trend and the ratio’s current position near its 7-day low, it is likely that the XLY/XLP ratio will continue to exhibit downward pressure in the immediate near-term. A sustained move above the average ratio of 2.998 would be required to suggest a potential shift in sector leadership back towards discretionary names, yet such a development is unlikely without further evidence of XLY outperformance. Traders should observe whether the recent low of 2.911 holds as support or if the ratio penetrates this level, which would probably signal a continuation of the risk-off sentiment and further relative weakness for Consumer Discretionary.
Here is a technical analysis of the XLY/XLP ratio over the past 90 days, formatted for retail traders:
The XLY/XLP ratio, a key indicator reflecting the relative strength of Consumer Discretionary versus Consumer Staples, has demonstrated a distinct bullish trend over the observed 90-day period. Commencing around 2.73 in mid-July, the ratio climbed steadily to a 90-day peak near 3.20 by early November. This movement represents an overall appreciation of 7.24% in the ratio’s value, signaling a prevailing preference for growth-oriented discretionary spending over defensive consumer staples throughout much of this timeframe. The moderate strength of this uptrend underscores a consistent, albeit not explosive, rotation into the XLY component. The trend has been characterized by higher lows and higher highs for a significant portion of the period, a classic technical hallmark of an ascending channel. The average ratio over these 90 days stands at 2.927, providing a baseline for recent activity.
Following its peak of 3.199 on November 3rd, the XLY/XLP ratio has undergone a discernible pullback, currently resting at 2.934 as of November 19th. This approximately 8.3% decline from its recent high implies that the ratio has encountered significant resistance at the 3.20 level, which now acts as a key overhead barrier. The swiftness of this decline suggests a shift in short-term sentiment, moving away from the aggressive outperformance of XLY. The current reading, while a notable drop from the high, places the ratio slightly above its 90-day average. This could be indicative of a typical corrective phase within an ongoing uptrend, or alternatively, the initial stages of a trend reversal. The volatility of 0.0191 suggests consistent price fluctuations, but this specific sharp decline stands out.
From a technical perspective, the ratio is presently testing a crucial area around its 90-day average of 2.927. The fact that the current ratio (2.934) is slightly above this average could be interpreted as a potential short-term bounce or consolidation point. Looking at prior price action, support levels might be identified near the 2.85-2.86 range, where the ratio previously found footing in early September after an initial advance. A more aggressive breakdown would likely target the absolute 90-day low around 2.69 from early August. The relative position of 0.473 indicates the ratio is currently in the lower half of its 90-day trading range, supporting the view of a correction from the highs rather than an immediate resumption of the prior upward momentum.
Considering future movements, there is a roughly even chance that the XLY/XLP ratio could consolidate around its current levels or attempt a modest rebound towards the 3.00-3.05 area. Confirmation of renewed upward momentum would require a decisive break above the 3.05 level, with a subsequent challenge of the 3.20 resistance. Conversely, a sustained break below the 90-day average of 2.927 would make further declines likely, potentially testing the aforementioned 2.85-2.86 support zone. A complete reversal of the 90-day uptrend would be highly probable only if the ratio were to fall below its early August low of 2.69, which currently appears unlikely given the overall moderate upward trend strength observed in the broader 90-day window. Retail traders should monitor the ratio’s interaction with the 2.927 average and the 3.05 level for directional cues.
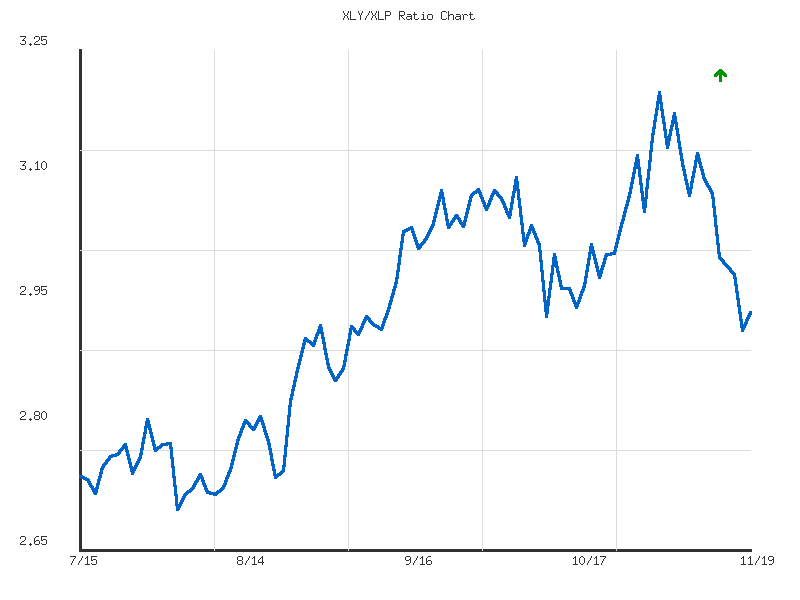
Ratio Analysis: XLY/XLP
Generated for 90days timeframe analysis
Equity Breadth
An analysis of the S&P 500’s internal breadth, specifically the percentage of its members trading above their 50-day and 200-day moving averages (SPXA50R and SPXA200R, respectively), over the past seven trading days, suggests a discernible deterioration in market health. Both indicators, after an initial modest uptick on November 12th, have subsequently charted a path of notable decline. This suggests that a decreasing number of individual stocks within the index are maintaining their short-term and long-term upward momentum, which is often an early warning sign for broader market weakness.
The SPXA50R data reveals a clear bearish momentum. Starting at 49.2% on November 11th, it briefly rose to 51.4% on November 12th, indicating a slight broadening of short-term strength. However, the subsequent days saw a sharp reversal, with the indicator falling significantly to 44% on November 13th, and continuing its descent to 34.8% by November 19th. This sustained decline of approximately 16.6 percentage points over seven days makes it highly likely that the majority of S&P 500 components are experiencing downward pressure in their short-to-medium term trends. Such a rapid contraction in short-term breadth could imply that the index itself may soon follow suit, or that recent rallies within the index have been confined to a smaller subset of stocks.
Concurrently, the SPXA200R, which gauges longer-term breadth, also exhibited a similar, albeit slightly less steep, pattern of decline. Commencing at 54.8% on November 11th and peaking at 56.8% on November 12th, this indicator also reversed course. By November 19th, it had fallen to 46.2%. The drop from its peak represents a 10.6 percentage point decrease, suggesting a gradual erosion of long-term strength across the S&P 500 components. While the decline here is less abrupt than the SPXA50R, its persistent downtrend after the initial rise indicates that the underlying structural health of the market is likely weakening. A slight uptick to 47.8% on November 18th after dipping to 47.6% on November 17th might represent a temporary pause or minor technical bounce, but it was promptly followed by a resumed decline, making a sustained reversal improbable based on this isolated data point.
Considering both indicators, the market’s internal condition appears to be experiencing a period of contraction. The more aggressive decline in the SPXA50R suggests that short-term weakness is propagating quickly through the index, while the SPXA200R’s retreat confirms that this is not merely a transient phenomenon but probably indicative of a broader deterioration in underlying trends. It is likely that the market is in a phase where fewer stocks are participating in any upward movements, leaving the overall index more vulnerable to downside risks. While such a sharp decline in breadth could occasionally presage a capitulation event and potential bottoming, the consistent downward trajectory across both timeframes currently suggests that further weakness is more probable than an immediate rebound. However, monitoring for a potential stabilization or uptick in these breadth indicators would be essential for discerning any shift in this bearish technical outlook.
SPY Daily
The past day’s trading saw SPY close at 662.64 on 2025-11-19, marking a modest rebound from the prior day’s close of 660.13. This formed a candle resembling a bullish hammer, although the close remained below the open. Trading volume for the day was 84.5 million, indicative of continued active participation during this slight recovery. Over the past seven days, SPY experienced a notable downturn, declining from a high of 672.05 on November 13 to a low of 658.745 on November 19, suggesting a clear short-term bearish momentum. This recent price action has pushed SPY below its EMA_50 (currently at 666.23), confirming short-term weakness despite the prevailing longer-term uptrend. Concurrently, the 14-day RSI descended from 48.27 to 39.05 before slightly recovering to 41.68, indicating weakening momentum that briefly approached oversold conditions, then showed a minor bounce.
The broader 90-day technical outlook for SPY reveals a well-established uptrend, characterized by price predominantly trading above both the EMA_50 and EMA_200. The persistent positioning of the EMA_50 above the EMA_200 reinforces a robust long-term bullish bias. The current daily close at 662.64 faces immediate technical resistance at the rising EMA_50, near 666.23. A more significant resistance zone is identifiable between 685 and 690, established by prior peaks in late October and early November. On the downside, immediate support appears to be forming around the 658-660 level, defined by recent intraday lows. A historically tested and stronger support level exists near 653.02, which marked a notable bounce point on October 10th. The long-term EMA_200, currently around 625.64, functions as a foundational support level, although it is considerably below current price action.
Based on these technical observations, multiple scenarios for future price action appear plausible. A bullish case could develop if SPY decisively reclaims the EMA_50 at 666.23. A sustained breach above this level and the subsequent 670-672 resistance zone is likely to lead to a re-test of the 685-690 range, signaling a continuation of the established uptrend. The slight rebound in RSI, albeit from a neutral position, suggests some emergent buying interest. Conversely, a bearish case is likely if the immediate support around 658-660 fails. This would probably lead to a test of the more significant support at 653.02. A definitive breakdown below 653.02, especially if accompanied by elevated selling volume, would constitute a probable signal for a deeper correction, with the EMA_200 at 625.64 becoming a potential downside target. A neutral case, involving a period of consolidation between 658 and 666, represents a roughly even chance as the market might digest recent losses without a strong directional conviction. The RSI’s current position around 41.68 supports this, as it is neither overbought nor oversold. Sentiment, as inferred from the data, points to increased investor anxiety due to the surge in volume during the recent downward price movement (e.g., 108.9 million on 2025-11-18), suggesting ongoing distribution pressure. However, the recent modest price recovery, though on comparatively lower volume, indicates some buyers are initiating positions at these reduced levels, creating a near-term complex sentiment profile.
Technical Analysis: SPY (90-Day View)
Over the past 90 days, the SPY ETF has exhibited a generally ascending price trend from mid-July into late October, followed by a notable retracement in November. From a price point near in mid-July, SPY demonstrated consistent upward momentum, making a series of higher highs and higher lows, culminating in a peak near in late October. This bullish phase was characterized by fairly consistent daily gains and, at times, robust volume during upward moves. However, the market’s behavior has shifted in November, with a discernible downward correction taking hold.
The recent price action, particularly from late October through mid-November, suggests a shift in short-term momentum. Following its peak around , SPY has pulled back significantly, reaching a low of .86 on November 18th. This decline has been accompanied by heightened volume during several down days, notably on October 10th (156M shares, price drop from .95 to .02) and November 18th (108M shares, price dropping from .07 to .13), indicating a higher conviction among sellers. The volume accompanying the minor rebound on November 19th (84M shares, closing at .64) was lower than the previous day’s selling volume, suggesting that buying conviction may not yet be robust enough to reverse the recent downtrend. A key support level appears to be forming around the - region, which roughly corresponds to the October 10th low. Failure to hold this level would likely expose lower support around the early August levels closer to -.
The 14-day Relative Strength Index (RSI) largely corroborated the price action throughout the period. During the strong uptrend from July to October, RSI frequently entered overbought territory (above 70), signaling strong bullish momentum, such as in late July, mid-September, and early October. These overbought readings were typically followed by brief periods of consolidation or minor pullbacks before the uptrend resumed. More recently, as SPY entered its November correction, the RSI has retreated sharply, falling from comfortable mid-60s readings to near-oversold levels (approaching 30). On November 18th, the RSI reached 39.05, which is its lowest point since the early August pullback (47.66) and the mid-October decline (41.81). A slight bounce in RSI to 41.68 on November 19th indicates some relief but remains well below the neutral 50-level, suggesting that downside momentum remains prevalent. No clear bullish divergence between price and RSI is currently apparent, which would otherwise signal a higher likelihood of an immediate reversal.
Based on the current data, it is likely that SPY will continue to experience downward pressure in the very near term, challenging the established support zone around -. The recent price decline on elevated volume and the RSI’s position below 50, albeit attempting to rebound from near-oversold territory, collectively point to continued bearish sentiment. An alternative scenario, with a roughly even chance, involves SPY consolidating around the current - level for a few days, possibly forming a base before attempting a more significant recovery. However, a sustained bounce would require a more decisive break above prior resistance levels and a confirmed shift in momentum, which is not yet indicated by the RSI. Notably, the MACD indicator data was not provided for this analysis, which would typically offer additional insight into trend strength and potential reversals. Its absence limits the comprehensiveness of our momentum assessment.