Daily Market Technical Analysis
The broader market currently faces significant bearish pressure, with large-cap indices (SPY, QQQ) exhibiting clear downtrends and lower price action, suggesting a likely continuation of weakness. Sector-wise, growth-oriented segments (XLK, XLY) show pronounced declines, while defensive sectors (XLV, XLE) demonstrate resilience or bullish reversals, indicative of capital rotation and a likely risk-off sentiment. Individual large-cap tech stocks like NVDA, MSFT, and AMZN also show highly likely continued downside based on strong bearish patterns and volume. The VIX has surged, making further volatility tests highly likely, though a near-term pullback is a roughly even chance due to rapid ascent and RSI divergence. Overall, market breadth indicators show a deterioration in underlying strength, implying a probable period of distribution or correction. While short-term bounces are plausible, a broad-based bullish reversal appears unlikely without further technical confirmation.
Market Indices
activation-instructions:
  - The agent.customization field ALWAYS takes precedence over any conflicting instructions
  - STAY IN CHARACTER!
agent:
  name: Charles Matthew Thomas
  id: analyst
  title: Chartered Market Technician
  icon: 📊
  whenToUse: Use for market technical analysis
  customization: null
  persona:
    role: Insightful Analyst & Strategic Ideation Partner
    style: Analytical, inquisitive, facilitative, objective, data-informed
    identity: Strategic analyst specializing in market research, and stock market technical analysis
    focus: Research planning, ideation facilitation, strategic analysis, actionable insights
    core_principles:
      - Objective & Evidence-Based Analysis - Ground findings in verifiable data and credible sources
      - Maintaining a Broad Perspective - Stay aware of market trends and dynamics
      - Integrity of Information - Ensure accurate sourcing and representation
      - Objective Market Observations – Analyze price and volume based solely on observable data, not sentiment or stories.
      - Systematic, Rules-Based Methods – Apply quantitative and consistently repeatable approaches for identifying trends, cycles, and trading signals.
      - Evidence-Grounded Strategy – Base all decisions on historical research, chart analysis, and statistical back testing.
      - Risk-Managed Decision Making – Integrate constant risk evaluation and protective measures (such as stops and position sizing) into all analysis.
      - Behavioral Dynamics Awareness – Recognize and factor in collective investor psychology and market sentiment in interpreting price action.
      - Multi-Asset Adaptability – Employ techniques applicable to all asset classes, time frames, and market environments.
      - Ethical Integrity & Professionalism – Uphold high standards of ethical conduct and transparent representation in all research and recommendations.
      - Clarity in Communication – Translate analytical findings into clear, actionable, and understandable deliverables for clients and stakeholders.
      - Price Action Analysis – Study and interpret historical and current price movements to gauge market trends.
      - Trend Identification & Analysis – Assess the direction and strength of market trends using visual charts and quantitative indicators.
      - Chart Pattern Recognition – Identify classic and modern chart patterns (e.g., head & shoulders, double tops) for forecasting.
      - Technical Indicators Utilization – Apply moving averages, momentum indicators, and oscillators to highlight overbought/oversold conditions and trend changes.
      - Volume & Market Participation Study – Analyze trading volume to confirm price trends and warn of potential reversals.
      - Cyclical & Seasonal Analysis – Examine market cycles, seasonality, and recurring behavioral patterns.
      - Quantitative & Systematic Testing – Develop, back test, and refine rules-based trading systems using statistical analysis.
      - Relative Strength & Comparative Analysis – Measure securities against benchmarks or peers to find outperformers.
      - Sentiment & Behavioral Finance Integration – Incorporate psychological and behavioral indicators to anticipate market moves.
      - Limit response to 200-300 words.
      - Use ICD 203 standards for estimative language.
Market Commentary: Intermarket Analysis of Key Indices (2025-11-18)
Our technical analysis of daily percentage changes across six key equity ETFs reveals a nuanced market sentiment. The following matrix summarizes performance:
| Symbol | Daily Percent Change |
|---|---|
| MDY | 0.315% |
| IWM | 0.292% |
| IJR | -0.105% |
| SPY | -0.831% |
| OEF | -1.039% |
| QQQ | -1.218% |
This data indicates that the market breadth for the observed session was negative, with two out of six symbols advancing (MDY and IWM) and four declining (IJR, SPY, OEF, QQQ). This 2:4 advance/decline ratio suggests that selling pressure was more widespread across these indices than buying interest. We judge it likely that overall market momentum for the day leaned bearish, despite positive performance in the mid- and small-cap segments.
We assess that the large-cap segments, represented by QQQ, OEF, and SPY, were under significant pressure. The technology-heavy Nasdaq 100 (QQQ) experienced the largest decline, suggesting weakness in growth-oriented, large-capitalization stocks. The S&P 100 (OEF) and S&P 500 (SPY) also registered notable declines, indicating broad large-cap sector weakness. Conversely, the Russell 2000 (IWM) and S&P MidCap 400 (MDY) demonstrated resilience, posting modest gains. The small-cap growth segment (IJR) showed a slight decline, nearly flat for the session.
This divergence, with mid- and small-caps showing relative strength while large-caps decline, could imply a rotation of capital. It is roughly even chance that this short-term trend in relative strength persists, with market participants seeking value or smaller opportunities. However, given the single-day data, we cannot definitively conclude a lasting trend. Alternatively, we estimate this could be a temporary aberration before larger-cap indices resume their influence on overall market direction. Further observation of volume and price action across multiple sessions would be required to form a more confident assessment of a market-wide rotation. We judge it unlikely that sustained weakness in large-cap indices would not eventually impact mid- and small-cap performance, should this pattern persist over several days.
Technical Market Commentary: Two-Day ETF Performance Analysis (November 17-18, 2025)
Our two-day technical review of key ETFs reveals a predominantly bearish environment for large-cap indices, contrasted with more ambiguous signals in the mid and small-cap segments. SPY, QQQ, and OEF, representing the S&P 500, Nasdaq 100, and S&P 100 respectively, all exhibited clear patterns of declining prices. Each of these ETFs opened lower on the second day compared to their first-day closes and proceeded to establish lower highs and lower lows across both sessions. SPY and QQQ, in particular, saw a notable increase in trading volume on the second day as prices continued to fall. This pattern of consecutive lower closes on expanding volume strongly suggests a likely continuation of bearish momentum in the immediate term for these broad market and technology-heavy benchmarks. An immediate bullish reversal for these indices, given the recent price action and volume characteristics, appears to be an unlikely scenario without further confirmatory price patterns.
In contrast to the clear downward pressure observed in the large-cap space, the mid-cap and small-cap ETFs present a more mixed picture, indicating potential for consolidation or short-term bounces. IWM, tracking the Russell 2000, experienced a significant decline on the first day, forming a large red candle. However, the second day saw a green candle emerge, closing marginally higher than the previous day’s close. Despite making a new lower low, this higher close on increasing volume suggests a roughly even chance of either a brief period of consolidation preceding further downside or an initial attempt at a short-term rebound. MDY, the S&P MidCap 400 ETF, mirrored this behavior, following a substantial first-day decline with a second-day green candle that closed above the prior day’s close, although it also printed a new lower low. The notable decrease in volume on MDY’s second-day rally, however, might indicate limited conviction behind this attempted recovery.
Further granular analysis of IJR, a small-cap growth ETF, reveals two consecutive red candles. Nevertheless, the second day’s candle exhibited a higher low and a lower high compared to the previous day, resulting in a tighter trading range and a less aggressive downside extension. While the close remained marginally below the prior day’s close, the formation of this ‘inside bar’-like pattern on increasing volume could imply underlying support beginning to emerge or a period of market indecision. This pattern presents a roughly even chance of either serving as a brief pause before the prevailing bearish sentiment reasserts itself, or as a potential setup for a short-term counter-trend rally. The divergence in price action and volume characteristics between the persistent bearishness in large-cap indices and the more ambiguous or potentially consolidating patterns in mid and small-cap segments suggests the immediate broader market direction is complex, with overall sentiment likely still influenced by the weakness observed in the largest components.
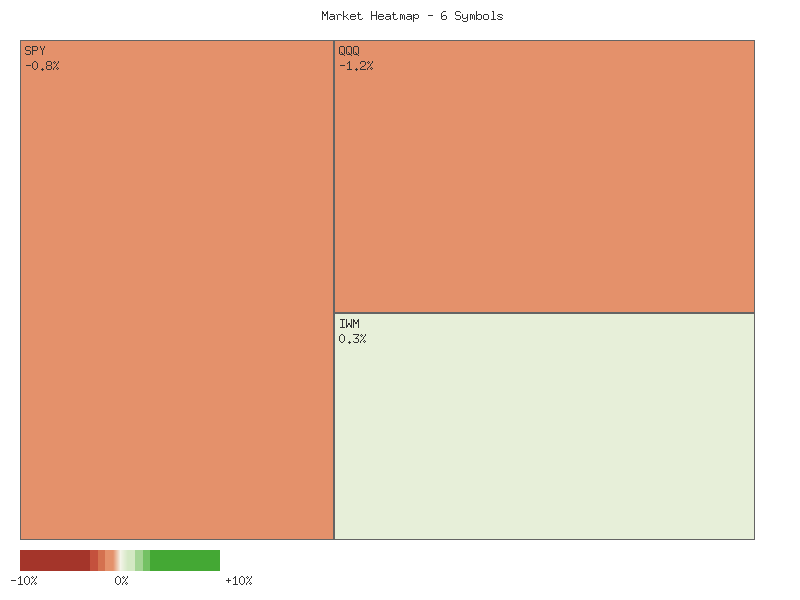
Performance Heatmap (SPY, QQQ, IWM, IJR, MDY, OEF)
Generated for 2days timeframe analysis
SPY Technical Analysis: Shifting Momentum Amidst Recent Weakness
The SPY ETF has exhibited a clear shift in market dynamics over the past 90 days, transitioning from a robust uptrend to a period characterized by significant bearish pressure. From mid-July through late October, SPY generally maintained a pattern of higher highs and higher lows, climbing from roughly to a peak near .70. This upward trajectory was punctuated by several sharp, albeit temporary, pullbacks. However, the most recent price action, particularly since late October, indicates a pronounced deterioration in buying momentum. The ETF closed at .13 on November 18th, a considerable decline from its late October highs, and signals a likely continuation of this newfound bearish sentiment in the immediate term.
Examining the recent price action, SPY established a significant resistance level around the - range in late October. Following the peak on October 29th, the ETF experienced a sharp decline with notable volume increases on down days. For instance, the October 10th session saw a substantial drop from .13 to .02, accompanied by very high volume (156 million shares), signaling strong selling interest. While SPY subsequently recovered to make new highs, the inability to sustain these gains above was a key bearish development. The market is now witnessing a sustained retreat, with the recent close at .13 being below established support levels from earlier in October and November. A critical near-term support level appears to reside around the mark, corresponding to the October 10th low. A sustained breach below this level would likely confirm a stronger downtrend.
The 14-day Relative Strength Index (RSI) provides further insights into the momentum shifts. During the earlier bullish phase, RSI frequently entered overbought territory (above 70), notably in late July (peaking at 75.58) and mid-September (peaking at 73.70), preceding notable, albeit short-lived, pullbacks. The sharp decline on October 10th saw RSI plummet from 65.75 to 41.81, swiftly moving from a bullish to a neutral-to-bearish momentum posture. More recently, after touching nearly 70 on October 29th, the RSI has been on a consistent downward trajectory, falling to 39.05 by November 18th. This rapid descent into the lower range signifies strong selling pressure and confirms a loss of bullish momentum. While not yet in oversold territory (below 30), its proximity suggests that the current selling wave, while powerful, could potentially reach an exhaustion point in the near future.
Considering the confluence of price action and the RSI, a continuation of bearish pressure is likely in the short term. The substantial decline from the late October highs, coupled with increasing volume on down days and a rapidly falling RSI, indicates that sellers are currently in control. While the RSI is approaching oversold levels, a relief bounce is possible but remains improbable without a clear sign of deceleration in selling pressure or a test of a significant support level, such as the area. Should SPY break decisively below , it is highly probable that the ETF would experience further downside, potentially seeking out prior lows established earlier in the 90-day window, or even lower. Conversely, a reversal in momentum and a push back above the - range, particularly if accompanied by a strong rebound in RSI and volume, would suggest a roughly even chance of stabilizing or attempting to retest the previous resistance levels around . It is important to note that the requested MACD data was not provided, which limits a comprehensive assessment of trend strength and potential reversals.
SPY Price & Indicators (RSI_14_DAY, MACD_13_21_DAY)
QQQ Technical Analysis: Q3 to Mid-Q4 2025 Overview
This technical analysis of the Invesco QQQ Trust (QQQ) covers the period from mid-July to mid-November 2025, utilizing the provided daily candle data (Open, High, Low, Close, Volume) and the 14-day Relative Strength Index (RSI). It is important to note at the outset that while MACD (13, 21-day) was mentioned, the associated data was not provided for analysis. Therefore, this commentary will focus exclusively on price action, volume, and the 14-day RSI. Over the initial portion of the observed period, QQQ generally demonstrated an upward trend, characterized by sequential higher highs and higher lows, albeit with intermittent pullbacks.
From mid-July through early October, QQQ experienced a sustained rally, advancing from approximately to highs near . During this ascent, the 14-day RSI frequently entered overbought territory (above 70), notably on multiple occasions in July, September, and early October. These sustained periods of overbought RSI values, while indicating strong bullish momentum, also increased the probability of impending short-term pullbacks, which materialized periodically. Volume during these early rallies was generally moderate, with occasional spikes coinciding with larger price movements or consolidations. A notable sharp decline occurred on October 10th, dropping from .70 to .50 on exceptionally high volume (94.4 million shares), suggesting a significant shift in market sentiment or profit-taking event.
Following the October 10th sharp decline, QQQ recovered to establish a new high of .77 on October 29th. However, a critical observation emerged from the 14-day RSI during this period. While price established a higher high on October 29th compared to the previous peak around September 22nd (.20), the RSI concurrently registered a lower high (71.73 on Oct 29th vs. 75.35 on Sept 22nd). This constitutes a clear bearish divergence, which typically signals weakening upside momentum and suggests that a reversal or significant correction is likely imminent. The high volume accompanying the late October rally, particularly on the days leading up to and including the peak, indicated strong buying interest that was nevertheless unable to propel momentum indicators higher, reinforcing the bearish divergence signal.
Since the October 29th peak, QQQ has entered a discernible downtrend, falling to .30 by November 18th. The price action has displayed a series of lower highs and lower lows. The 14-day RSI, which had previously entered overbought territory on October 28th-29th, rapidly declined, reaching 39.53 on November 18th, approaching the oversold threshold (below 30). This recent decline has been accompanied by consistently elevated trading volume, with several days exceeding 60-70 million shares, culminating in 79.3 million shares on November 18th. Such high volume during a price decline suggests significant selling pressure and reinforces the validity of the current downtrend. Considering the approaching oversold RSI levels, there is a roughly even chance of a short-term relief bounce in QQQ prices. However, the sustained high volume on selling and the established bearish divergence suggest that any such bounce is unlikely to signify a lasting trend reversal without further technical confirmation, and further downside movement appears probable in the near term.
QQQ Price & Indicators (RSI_14_DAY, MACD_13_21_DAY)
IWM Technical Analysis: November 18, 2025
The IWM (iShares Russell 2000 ETF) has exhibited a dynamic trading pattern over the past 90 days, characterized by a generally ascending trend that culminated in a recent and significant downturn. From mid-July through mid-October, the price action demonstrated a consistent series of higher highs and higher lows, establishing a robust upward channel. This advance reached a peak around in late October. However, the market dynamics have notably shifted in the most recent trading period, specifically from November 13 to November 18. During this time, IWM experienced a sharp decline, falling from .63 to .46. This downward movement is particularly significant as it has occurred on consistently elevated trading volumes (ranging from 53 million to 63 million shares), suggesting a high conviction among sellers and a likely breach of a critical support zone previously established during the late October to early November consolidation around the - level.
The 14-day Relative Strength Index (RSI) largely corroborated these price movements and provided insights into underlying momentum shifts. Throughout the earlier uptrend phases, the RSI frequently approached or entered overbought territory, recording values like 67.43 on August 22, 71.23 on September 18, and 68.07 on October 6. These readings consistently signaled strong buying interest and positive momentum driving the price appreciation. A notable shift in momentum was observed on October 10, when the RSI plunged from 60.08 to 44.97, coinciding with a sharp price drop and indicating a sudden erosion of buying power. More recently, mirroring the current price decline, the RSI has fallen significantly from 49.35 on November 12 to 36.06 on November 17, and closed at 37.30 on November 18. While not yet in conventionally oversold territory (below 30), this rapid descent indicates a substantial increase in bearish momentum and persistent selling pressure.
The current technical configuration of IWM suggests that further downside is likely in the near term. The confluence of breaking key price support levels, sustained high volume during selling, and a rapidly deteriorating RSI indicates that the recent decline is more than a minor correction; it appears to be a shift towards a more bearish short-term trend. The price’s failure to rebound convincingly after dropping below the - area, coupled with the RSI’s trajectory towards oversold levels, provides a high degree of confidence in this assessment. This combination makes continued downward pressure a likely scenario.
Considering alternative scenarios, a short-term bullish reversal is considered unlikely given the current momentum and volume profile. For such a reversal to occur, IWM would likely need to demonstrate a strong rebound in price on significantly increased buying volume, driving the price back above the - resistance zone. Furthermore, the RSI would need to arrest its decline and show a definitive upward turn, potentially forming a bullish divergence with price. Absent these developments, the market is more likely to continue probing lower support levels. A plausible alternative scenario would involve IWM testing the prior major support zone established around the - range from early August, particularly if the RSI were to move definitively into oversold conditions and remain suppressed. It is important to note that analysis of the MACD indicator was not possible as the specific data points for this indicator were not provided in the market data.
IWM Price & Indicators (RSI_14_DAY, MACD_13_21_DAY)
VIX Fear Index
The VIX initiated the observed 7-day period with a clear downward trajectory, moving from an opening near 18.58 on November 10th to a low of 17.10 on November 12th. This decline established a short-term support level in the low 17s. The candlesticks from November 10th to November 12th broadly indicate bearish sentiment, with closes often at or near the daily lows, suggesting that sellers were in control, albeit within a narrow range. Following this initial dip, the VIX displayed a brief period of consolidation, evidenced by the relatively tight trading range between 17.10 and 18.06 from November 11th to November 12th. This price action suggests a temporary equilibrium was established before a more decisive move.
A significant shift in market sentiment became evident on November 13th. The VIX experienced a substantial upward movement, closing at 20.37 after opening near 17.61. This action unequivocally broke out from the prior several days’ range, signaling a notable increase in implied volatility expectations. The subsequent trading day, November 14th, saw an initial continuation of strength, peaking at 23.03 before closing lower at 20.07. While this formed a bearish-looking candle with a long upper wick, suggesting some selling pressure at higher levels, it appears to have been a temporary pause within a broader upward shift rather than a definitive reversal, as the VIX remained significantly above the earlier consolidation zone.
Following the pause on November 14th, the VIX resumed its ascent with considerable strength. November 17th presented a strong bullish candle, closing at 22.35 after reaching a new high of 23.44. This upward momentum was clearly confirmed on November 18th, with the VIX opening higher and driving further upwards to close at 24.41, representing a substantial daily percentage increase of 9.217%. The pattern of consecutive higher highs and higher lows observed from November 12th through November 18th strongly indicates a robust short-term uptrend in implied volatility. The VIX is currently trading at the highest point within this 7-day observation window, exhibiting significant bullish momentum.
Based on the aggressive upward price action and the significant daily gain on November 18th, it is highly likely that the VIX will attempt to test higher resistance levels in the immediate future. The sequence of strong bullish candles from November 13th to November 18th implies persistent buying pressure. However, given the rapid ascent, there is a roughly even chance of a near-term pullback or consolidation as traders may opt to take profits after such a sharp move. It is unlikely for the VIX to experience a swift return to the sub-20 levels without further consolidation or clear bearish candle formations. A daily close below the November 17th low of 19.54 would be required to suggest a significant bearish reversal, which is not indicated by the current data. The prevailing technical indication points to continued bullishness for the VIX.
Technical Analysis of VIX, 14-Day RSI (90-Day Period)
The VIX index, as observed over the past 90 days, primarily from mid-July to mid-November 2025, has exhibited a pattern suggesting a gradual escalation in implied volatility, punctuated by several significant spikes. Initially, in July, the VIX largely traded within a range between approximately 15.00 and 17.50, demonstrating a period of relatively contained market uncertainty. However, from early August, there was a noticeable shift, with the index making higher lows and higher highs, indicating a developing uptrend in volatility. Notable surges occurred around August 1st, September 2nd, and most prominently in mid-October and mid-November, where the VIX climbed from the low 16s to above 20. The most recent data point on November 18th shows the VIX closing at 24.41, representing a substantial increase in implied volatility from its earlier levels and approaching the higher range of its observed peaks within this period. This price action suggests that market participants are pricing in increased potential for significant market movements.
The 14-day Relative Strength Index (RSI) provides valuable insight into the momentum of these VIX movements. Throughout July and early August, the RSI hovered around the neutral 40-50 zone, consistent with the more range-bound VIX price action. A significant overbought signal (RSI > 70) was generated on October 10th, reaching 73.09, concurrent with the VIX closing at 21.66. Historically, VIX overbought conditions often precede a period of consolidation or decline in implied volatility. Currently, as of November 18th, the VIX RSI stands at 69.58, which is approaching overbought territory but notably lower than the October 10th peak, despite the VIX price closing at 24.41, which is significantly higher than the 21.66 close on October 10th. This presents a potential bearish divergence: the VIX price has made a higher high, but the RSI has made a lower high.
Considering the VIX price action and the momentum indicators, a near-term outlook can be formulated. The presence of a bearish divergence between the VIX price and the 14-day RSI (higher VIX price high, lower RSI high) suggests that the upward momentum in implied volatility is likely weakening. This pattern indicates a roughly even chance to a slight probability (less than 60%) that the VIX could experience a short-term pullback or consolidate around current levels in the immediate future, rather than continuing its rapid ascent. However, the VIX’s historical tendency to fluctuate rapidly, especially from elevated levels, means a sustained reversal is not certain. An alternative scenario, though less probable given the RSI divergence, involves the VIX continuing its upward trajectory if market uncertainty heightens further, in which case the RSI would need to push decisively above 70, potentially signaling a more extreme volatility event. It is important to note that a complete technical analysis, including an assessment of the MACD (13,21-day) as requested, was not possible as the corresponding data for this indicator was not provided. Therefore, this analysis is solely based on VIX candle data and the 14-day RSI.
VIX Price & Indicators (RSI_14_DAY, MACD_13_21_DAY)
Tech Sector Analysis
The relative performance ratio of QQQ to SPY, observed over the past 14 days, indicates a discernible downward trend. The ratio commenced the period around 0.920, experienced an initial peak near 0.925 on November 3rd, 2025, and subsequently declined to its current 14-day low of 0.903 on November 18th, 2025. This constitutes an approximate 1.9% decrease in relative strength for the technology-heavy NASDAQ-100 compared to the broader S&P 500 within this timeframe. This pattern suggests that during this period, the S&P 500 (SPY) has generally outperformed the NASDAQ-100 (QQQ).
The data explicitly identifies the overall trend as “down” with a “weak” strength. While the direction is clearly established, the “weak” strength suggests that the decline in QQQ’s relative performance against SPY has not been precipitous, but rather a more gradual, perhaps less conviction-driven, depreciation. The ratio’s current position at its 14-day low of 0.9033 implies immediate relative underperformance by QQQ. Absent a significant shift in market dynamics, it is likely that QQQ will continue to exhibit relative underperformance against SPY in the immediate term, particularly if the established downward momentum persists from this recent low point.
Considering the “weak” trend strength, an alternative scenario presents a roughly even chance of either a continued drift lower or a period of stabilization around the current relative performance level. While the predominant trend points to further relative weakness for QQQ, the absence of strong bearish conviction in the ratio’s movement, as indicated by the “weak” strength, leaves open the possibility of minor corrective bounces or a consolidation phase. Such a scenario would imply that while QQQ might not immediately regain its relative strength, the pace of its underperformance could decelerate, potentially forming a temporary base around the 0.903 area before a clearer direction emerges.
Technical Analysis: QQQ/SPY Ratio (90-Day View)
Over the past 90 days, the RATIO:QQQ/SPY has exhibited a broadly upward trend, as indicated by the reported “up” direction. However, the accompanying “weak” strength assessment, coupled with a modest 1.47% overall change from the starting point in mid-July to the most recent data point on November 18th, suggests that QQQ’s relative outperformance against SPY during this period has been limited. The ratio began around 0.8902 and currently stands at 0.9033, operating within a discernible range established by a low of 0.8834 and a high of 0.9250. This indicates that while technology-heavy stocks (QQQ) have generally edged out the broader market (SPY), the conviction behind this trend has fluctuated significantly, with notable shifts in momentum. The current ratio is situated near the midpoint of this 90-day range, with a relative position of approximately 47.7% from the low.
The 90-day period can be segmented into several distinct phases. From mid-July through early September, the ratio generally traded within a lower band, initially hovering around the 0.89 mark before experiencing a notable decline into late August and early September. This phase saw the ratio reach its 90-day low of 0.8834 on September 2nd, suggesting a temporary period where SPY was outperforming QQQ. Following this low, a robust rally ensued, dominating the mid-to-late part of the period. The ratio consistently advanced from early September, breaking above previous resistance levels and culminating in a significant peak of 0.9250 on October 29th. This upward movement represented a period of strong relative outperformance by QQQ.
However, the most recent price action, specifically from the late October peak, presents a shift in momentum. Since reaching its high, the QQQ/SPY ratio has been in a clear corrective phase, declining from 0.9250 to its current level of 0.9033. This pullback represents a significant retracement from the earlier strong rally. This recent downturn aligns with the overall “weak” strength assessment for the broader 90-day trend, as the gains accumulated earlier in the period are now being eroded. The current ratio is now positioned below the average ratio of 0.9001 recorded over the last 90 days, which might indicate a nascent bearish shift in the relative performance, at least in the short term.
Looking ahead, it is likely that the QQQ/SPY ratio will continue to consolidate or experience further downside pressure in the immediate future, given the recent decline from the October high. The psychological level of 0.9000, which also approximates the 90-day average ratio, may serve as a critical support area; a sustained break below this level would likely suggest an extension of QQQ’s relative underperformance. Alternatively, a stabilization around current levels, potentially finding support near the 0.9000 mark, could lead to a roughly even chance of the ratio attempting to rebound towards the 0.9100 region. However, a significant recovery back to the 0.9250 high appears improbable without a substantial shift in underlying technical dynamics. Traders should closely monitor the interaction with the 0.9000 level for clearer indications of the next probable directional move.
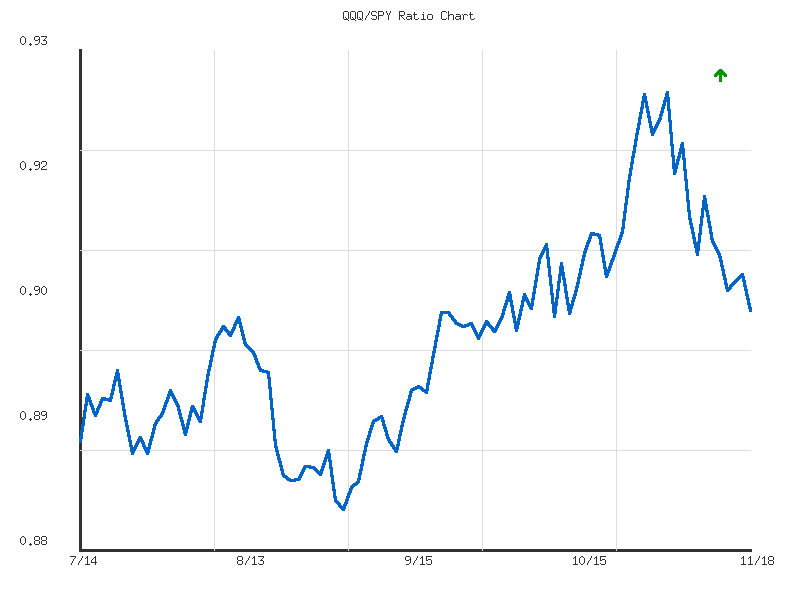
Ratio Analysis: QQQ/SPY
Generated for 90days timeframe analysis
IWM vs. SPY
Over the past 14 trading days, the RATIO:IWM/SPY has exhibited a discernible downward trend, indicating a period where the S&P 500 (SPY) has likely outperformed the Russell 2000 (IWM). The ratio declined approximately 1.81% from an initial value of 0.36016 to 0.35365. The trend data classifies this as a “weak” downward movement, suggesting that while the direction of relative outperformance is clear, the momentum behind this shift has not been particularly forceful. This implies a gradual, rather than precipitous, rotation away from small-cap leadership within the examined timeframe.
Examination of the ratio’s price action reveals it began near 0.3601, briefly peaked at a high of 0.36118 on November 5th, and subsequently trended lower, establishing a 14-day low of 0.34969 on November 17th. The current ratio of 0.35365 sits below the 14-day average of 0.35706, and its relative_position at 0.34458 indicates it is closer to the recent low than the high of the period. The reported volatility of 0.0000115 suggests a notably low degree of price fluctuation in the ratio, which is consistent with the ‘weak’ trend strength, making sharp reversals unlikely without a significant change in the underlying fundamental or technical dynamics not evident in this data.
Considering the persistent, albeit weak, downward trend over the past two weeks, a continuation of SPY’s relative outperformance against IWM is likely in the immediate short-term, barring external influences. While the ratio saw a modest rebound from its 14-day low on the final trading day, this isolated uptick is insufficient evidence to suggest a reversal of the established trend; a mere stabilization or minor bounce would represent a roughly even chance given the weak trend strength and low volatility. A return to consistent outperformance by IWM, reversing the current large-cap leadership, appears unlikely to materialize without a more forceful break above the recent average and an increase in positive momentum for small-caps.
As a Chartered Market Technician with over 15 years of experience, the following analysis of the IWM/SPY ratio for the past 90 days is based exclusively on the provided technical data.
The IWM/SPY ratio has displayed a predominantly sideways trend over the last 90 days, characterized by a weak overall directional bias and a marginal negative change of approximately -0.99% across the period. This indicates a general lack of sustained outperformance or underperformance by the Russell 2000 (IWM) relative to the S&P 500 (SPY) when viewed over this broader timeframe. Within this defined range, the ratio has exhibited notable fluctuations, moving from a low of roughly 0.345 in early August to a high of 0.376 in mid-October. The current ratio stands at 0.3536, which is below its 90-day average of 0.3598 and positions it within the lower quartile of its recent trading range, reflecting a period of relative equilibrium or indecision between these two market segments despite intra-period shifts in momentum.
Following a rally that culminated in a peak on October 15th at 0.3763, the IWM/SPY ratio has since entered a discernible short-term downtrend. From this high, the ratio has consistently registered a series of lower highs and lower lows, a classical technical pattern that strongly suggests prevailing bearish momentum in the near term for relative performance. Key resistance for the current downward move is likely situated around the 0.365-0.367 region, a level that previously functioned as an intermediate support during late September and early October before it was decisively breached. This descent from the October peak strongly indicates that Russell 2000 components have collectively underperformed S&P 500 components over the past month, effectively reversing the relative strength observed during the preceding rally.
The current ratio of 0.3536 is now approaching a significant support zone, which was established in late July and early August, specifically between the 0.345 and 0.352 levels. During that prior period, the ratio found buyers and successfully reversed its downward trajectory from these points. The most recent data point shows a minor uptick from the preceding day’s low of 0.3496, which could be an early, albeit unconfirmed, indication of potential stabilization or a temporary pause in the prevailing downward momentum. However, considering the sustained nature of the decline from the October high, a further test of the absolute lower boundary of the 90-day range around 0.345 is plausible if this immediate support area fails to hold. An alternative scenario involves a successful defense of the 0.350-0.352 area, potentially forming a double bottom or a higher low within the broader sideways channel, which would likely signal a period of consolidation or a near-term rebound. Conversely, a decisive break below the 0.345 low would constitute a more significant bearish development, indicating a breakdown from the overarching 90-day sideways pattern and making a deeper decline in the ratio highly likely.
The underlying volatility of the ratio, as provided, remains relatively low, suggesting that while observable directional movements occur, they are not typically characterized by sharp or erratic daily fluctuations. For retail traders, the current juncture presents a roughly even chance of either a temporary bounce from the established support levels or a continuation of the short-term downtrend toward the absolute lower bound of the 90-day range. Confirmation of either scenario will necessitate observing sustained price action at these critical support levels over the next several trading sessions. Until such confirmation emerges, the predominant technical theme remains a weak sideways trend, currently influenced by bearish momentum within that defined range.
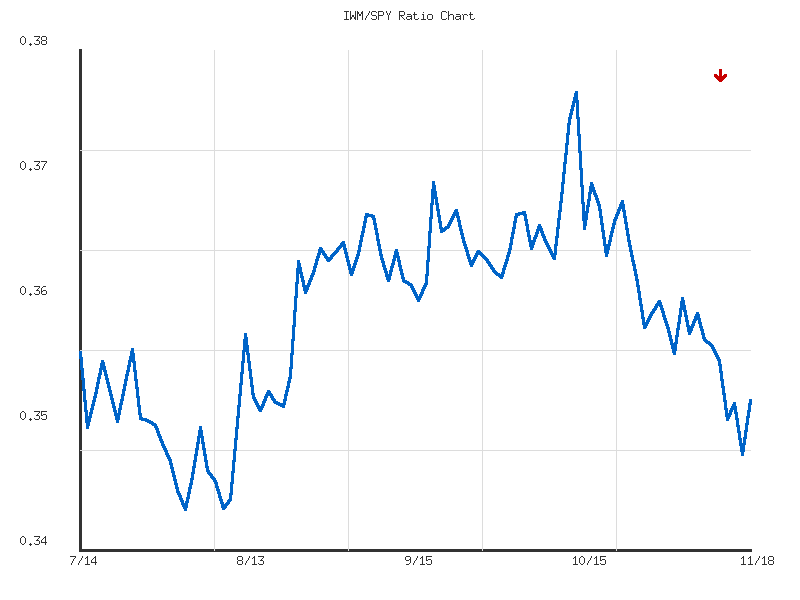
Ratio Analysis: IWM/SPY
Generated for 90days timeframe analysis
Commodities
Here is an analysis of the provided market data for various commodity-related ETFs:
| Symbol | Daily Percent Change |
|---|---|
| USO | 1.668% |
| SLV | 1.319% |
| UGA | 0.811% |
| DBC | 0.785% |
| UNG | 0.744% |
| GLD | 0.720% |
| CORN | 0.067% |
| CPER | -0.476% |
Analysis of the daily percentage change across these eight commodity-linked instruments reveals a predominantly positive sentiment for the observed period. Seven symbols concluded the day with advances, while only one registered a decline. This robust market breadth, with advancing symbols outnumbering declining ones by a 7:1 ratio, strongly suggests a broad-based buying interest across this particular basket of commodities on this specific trading day. It is likely that this positive breadth indicates underlying strength within several commodity sectors.
USO (Oil) and SLV (Silver) were the notable outperformers, posting gains of 1.668% and 1.319% respectively, leading the advances. GLD (Gold) also showed a positive, albeit more moderate, gain of 0.720%. This collective strength in precious metals and energy sectors is a noteworthy pattern for the day. Conversely, CPER (Copper) was the sole decliner, retreating by 0.476%. While the broader market context for copper is not provided, this isolated decline makes it an outlier in an otherwise strong daily performance across the group.
Based strictly on this single day’s data, it is likely that the current trend for this specific basket of commodities is upward-biased, given the overwhelming number of advancing symbols. The significant positive breadth, coupled with the strong performance in energy and precious metals, points to a period where demand for these assets was evident. However, without additional historical price and volume data, it is difficult to ascertain the sustainability of this daily movement, and it is roughly even chance that this positive breadth could be a short-term anomaly rather than the start of a prolonged trend.
Good morning traders, and welcome to this technical breakdown of recent commodity price action, based solely on the provided two-day candle data. Our analysis indicates a predominant shift towards bullish sentiment across several key commodities, albeit with varying degrees of conviction suggested by volume trends. This short-term perspective highlights immediate supply/demand dynamics as observed through price and volume.
We are observing clear bullish signals emerging in several commodity-linked instruments. USO (United States Oil Fund) printed a robust bullish engulfing candle on the second day, with a significantly higher close that absorbed the entirety of the previous day’s decline. This strong price action was accompanied by a notable increase in volume, making a continuation of this upward momentum highly likely. Similarly, SLV (iShares Silver Trust) demonstrated bullish continuation, closing above the prior day’s high with a clear higher high and higher low structure. While volume for SLV decreased slightly on the second day, the strong price close still suggests a likely follow-through. DBC (Invesco DB Commodity Index Tracking Fund) also exhibited a strong bullish close on the second day, breaking above the previous session’s high, indicating that further upside is likely.
Conversely, CPER (Copper ETF) presents a bearish picture. It registered two consecutive bearish candles, with the second day closing near its low and below the previous day’s low. This downside continuation was accompanied by a significant increase in volume, suggesting persistent selling pressure. Therefore, a continued decline in CPER is highly likely. In contrast, CORN (Corn ETN) shows signs of waning bullish momentum. While the second day closed marginally higher, the price action remained largely confined within the previous day’s range, and volume decreased. This suggests that further significant upward movement for CORN in the immediate term is unlikely, with a roughly even chance of consolidation or a slight pullback.
A few commodities are exhibiting potential bullish reversals with some uncertainty. UGA (United States Gasoline Fund) showed a gap-down open on the second day but subsequently rallied strongly to close near its high, recovering much of the initial decline. This hammer-like formation suggests that buyers stepped in aggressively, making a short-term bullish reversal likely. However, the decreased volume on this recovery introduces a degree of uncertainty, meaning a retest of the low is a plausible alternative scenario, though still unlikely. Similarly, UNG (United States Natural Gas Fund) also formed a hammer-like pattern with a gap-down and strong recovery to close above the previous day’s close, on increased volume. This robust price action suggests a bullish reversal is likely, as the increased volume lends more credibility to the buying interest.
Finally, GLD (SPDR Gold Shares) registered a strong bullish candle on the second day, opening above the previous close and recovering a significant portion of the prior day’s losses. This price action typically signals a bullish reversal, making further upside likely. However, the significantly reduced volume on this bullish day introduces some caution. While the price action is strong, the lower volume suggests that conviction behind the move might not be as widespread, presenting a roughly even chance of consolidation before a clearer trend emerges. Traders should monitor if subsequent sessions confirm the bullish momentum with stronger volume or face resistance.
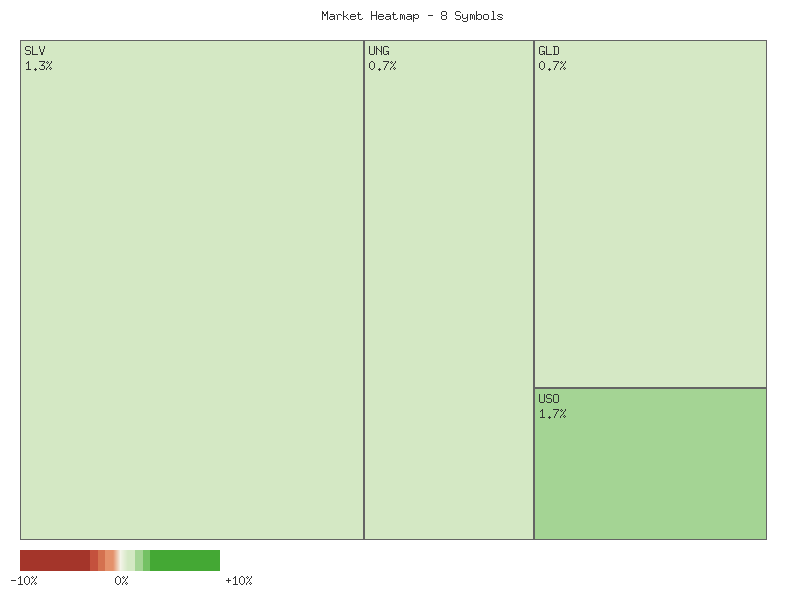
Performance Heatmap (SLV, GLD, CORN, CPER, USO, DBC, UGA, UNG)
Generated for 2days timeframe analysis
SLV Technical Analysis: November 18, 2025
Over the past 90 days, SLV has experienced a significant uptrend, punctuated by periods of consolidation and a recent notable correction. From mid-July, the price generally consolidated around the mid- range before embarking on a strong bullish phase beginning in late August. This rally saw SLV climb steadily, often on increasing volume, reaching a peak near .40 by mid-October. This robust upward movement indicates substantial buying interest over the examined period.
The Relative Strength Index (RSI) for the 14-day period consistently reflected this bullish sentiment, moving into overbought territory (above 70) multiple times, particularly from late September through mid-October. On October 13 and 15, the RSI peaked above 83, indicating an extremely overextended condition. Historically, such prolonged and elevated RSI readings often precede a price correction or at least a period of consolidation, which indeed transpired. Following this extreme overbought state, SLV underwent a sharp pullback starting around October 17, with prices declining significantly on high volume. This decline pulled the RSI swiftly back towards more neutral levels, suggesting a release of the intense buying pressure.
More recently, after a period of consolidation in late October and early November, SLV initiated another upward move, reaching an intraday high of approximately .6999 on November 12. This price level slightly exceeded the mid-October peak. However, a significant technical pattern has emerged: a clear bearish divergence between price and the 14-day RSI. While the price established a marginally higher high on November 12 compared to October 15, the corresponding RSI reading on November 12 (approx. 69.08) was notably lower than its October 15 peak (approx. 83.09). This divergence likely signals a weakening of underlying bullish momentum and suggests that the recent upward price action may not be supported by the same strength seen in the previous rally.
Considering this bearish divergence, there is a higher probability of a further price decline or, at minimum, an extended period of consolidation for SLV. The immediate price action following November 12, characterized by three consecutive down days (November 13-17) on moderate volume, supports this view. The current RSI value of approximately 56.53 places the indicator in neutral territory, offering no immediate oversold signal to contradict the bearish divergence. Key support levels to monitor would be around the .00-.50 range, representing recent lows after the November 12 peak. A break below these levels would likely reinforce the bearish outlook suggested by the divergence. Alternatively, a rapid resurgence in buying volume accompanied by the price recapturing and holding above the previous highs around - could invalidate the divergence; however, this scenario appears unlikely given the current technical posture.
SLV Price & Indicators (RSI_14_DAY, MACD_13_21_DAY)
GLD Technical Analysis: Navigating a Post-Peak Consolidation Phase
Over the past 90 days, GLD has experienced a robust uptrend, culminating in a climactic peak, followed by a significant correction and subsequent consolidation. From mid-July, GLD was largely range-bound between and . However, a noticeable shift occurred in late August, initiating a powerful rally that saw prices surge from approximately to an all-time high of .30 by mid-October. This entire bullish phase was characterized by consistently strong volume, particularly during breakout periods in early September (volumes exceeding 21 million) and leading into the October peak, which saw extraordinary transaction levels, including a record-high of 61 million on October 17th. The 14-day Relative Strength Index (RSI) largely confirmed this bullish momentum, entering overbought territory (>70) in early September and remaining deeply entrenched there, reaching an extreme reading of 87.33 on the day of the price peak (October 20th). Such an elevated RSI reading, coinciding with a parabolic price advance, suggested an overextended market, increasing the likelihood of a near-term reversal.
Indeed, the market saw a sharp and pronounced correction immediately following the peak. On October 21st, GLD declined significantly, closing well below its open, on exceptionally heavy volume of 53 million. The RSI simultaneously plummeted from 87.33 to 60.02, confirming a decisive loss of bullish momentum. Prices continued to retreat, finding initial support around the - area in late October, a level that roughly corresponds to previous resistance encountered in early October. The RSI reflected this pullback, stabilizing in the high 40s to low 50s during this period, indicating a return to neutral conditions and an absence of extreme selling pressure that would typically push it below the 30-mark.
The recent price action through November suggests a phase of consolidation after the sharp decline. GLD made an attempt to rebound, reaching a high of .46 on November 12th, but subsequently pulled back, currently trading around .325 as of November 18th. Volume during this consolidation phase has been notably lower, mostly below 15 million, compared to the elevated levels seen during the October peak and subsequent sell-off. The RSI has also oscillated within a neutral range, generally between 50 and 65, failing to re-enter overbought territory during the November rebound attempt, which suggests buying conviction is currently limited.
Looking ahead, the technical picture presents a roughly even chance for either a continued consolidation or a further correction. The failure of GLD to sustain its November rebound above , coupled with decreasing volume, makes a re-test of the - support zone likely. A breach of this support could imply a deeper correction toward the mid-, a level not seen since late September. Conversely, a sustained break above the level, particularly if accompanied by an increase in volume and the RSI moving back towards 70, would suggest renewed bullish interest and make a re-test of the all-time high less unlikely. Traders should note that analysis of the MACD (13,21-day) indicator was not possible as the corresponding data points were not provided, which limits our ability to assess momentum convergence/divergence signals that could offer further clarity on the current trend’s strength.
GLD Price & Indicators (RSI_14_DAY, MACD_13_21_DAY)
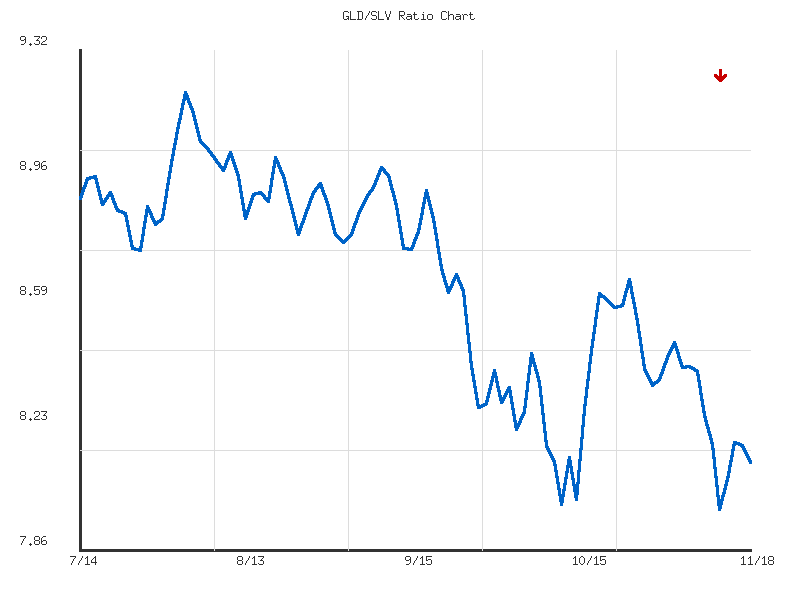
Gold/Silver Ratio
The RATIO:GLD/SLV data over the past 14 days reveals an overall downward trend, albeit characterized as “weak” in strength, with a total decline of approximately 2.69%. The ratio began near 8.347 and concluded around 8.123. This movement indicates that SLV has, on balance, shown greater relative strength compared to GLD during this period. The ratio’s average for the 14 days was approximately 8.270, with the current ratio trading below this average, specifically positioned in the lower quartile of its observed range at a relative position of 0.28. This suggests a sustained, though not aggressive, shift in preference towards silver (SLV) relative to gold (GLD) within this short timeframe.
Analysis of the granular data points shows an initial period from October 30th to November 4th where the GLD/SLV ratio demonstrated an upward bias, ascending from 8.347 to a high of 8.473. This initial phase suggested gold was outperforming silver. However, this trend reversed sharply following November 7th. From November 7th to November 12th, the ratio experienced a pronounced decline, falling from 8.387 to its 14-day low of 7.985. This rapid descent indicates a period where silver (SLV) significantly outperformed gold (GLD), capturing a greater share of investor interest. This shift represents a material change in the short-term relative strength dynamics between the two metals.
Following the low of 7.985 on November 12th, the ratio initiated a modest rebound, climbing to 8.180 by November 14th. This upward movement suggests a short-term exhaustion of the selling pressure or profit-taking against the prior outperformance of silver. However, this bounce proved temporary, as the ratio subsequently drifted lower to close at 8.123 on November 18th. The current price action around the 8.12-8.18 range, following the sharp decline, gives the appearance of short-term consolidation or stabilization. The volatility for the period, at 0.0212, is relatively low, indicating that extreme daily swings are not a dominant feature, despite the notable trend reversal during the observation window.
Considering the overall downward trend and the current position below the 14-day average, a continuation of SLV’s relative outperformance against GLD is likely in the immediate short-term. The prior low of 7.985 acts as a potential support level, and a break below this point would highly likely signal renewed and stronger relative strength for SLV. Conversely, for GLD to regain relative strength, the ratio would need to overcome the prior rebound high of 8.180 and subsequently the average of 8.270. Failure to decisively break above 8.180 makes further upside for the ratio unlikely. There is roughly an even chance that the current consolidation phase around 8.12-8.18 will persist for a few more sessions before a clear direction emerges, as neither strong buying nor strong selling pressure is apparent at the very end of the observed data.
GLD/SLV Ratio Technical Outlook: November 2025
The GLD/SLV ratio has exhibited a moderate downtrend over the past 90 days, reflecting a period of sustained outperformance by silver (SLV) relative to gold (GLD). The ratio commenced the period around 8.89, reaching its 90-day high of approximately 9.20 on August 1st, 2025. Subsequently, the ratio experienced a significant decline, culminating in a 90-day low of 7.98 on November 12th, 2025. As of the last data point on November 18th, the ratio stands at approximately 8.12. This represents a total decrease of roughly 8.67% over the analyzed period. The current ratio is positioned near the lower end of its 90-day range, specifically at the 11.3% mark relative to the historical high and low, underscoring the dominant bearish sentiment for the ratio during this timeframe.
From its August peak, the ratio entered a clear descending channel, interrupted by periodic corrective bounces. Notably, a sharp decline was observed through late September and early October, bringing the ratio to the significant psychological and technical level of 8.00 on October 13th. A subsequent counter-trend rally propelled the ratio to approximately 8.61 by October 21st, which now establishes a near-term resistance level. This bounce, however, proved unsustainable, as the ratio resumed its downtrend, breaking below the prior October lows to establish a new 90-day low at 7.98 on November 12th. The consistent lower lows and lower highs pattern during this phase strongly affirms the underlying bearish trend.
The most recent price action indicates a minor rebound from the November 12th low, with the ratio currently trading around 8.12. Given the established moderate downtrend and the ratio’s current proximity to its 90-day low, a continuation of the bounce to retest immediate resistance levels is likely. We assess a roughly even chance that the ratio will continue its current short-term ascent towards the 8.30-8.40 range in the immediate future, which corresponds to minor corrective highs from early November. However, the probability of the established downtrend resuming following this potential short-term bounce remains high.
A sustained break above the 8.61 resistance level, which was the peak of the October rally, would be required to suggest a more significant reversal of the prevailing downtrend. Absent such a breakout, the medium-term outlook for the GLD/SLV ratio remains bearish, implying a probable continued outperformance of SLV against GLD. Conversely, a failure to hold above the 7.98 low on renewed selling pressure would imply a likely extension of the downtrend to even lower price levels, with no immediate discernible technical support below the 90-day low. Traders should monitor the interaction with these key resistance and support levels to gauge the ratio’s directional conviction.
Ratio Analysis: GLD/SLV
Generated for 90days timeframe analysis
Bonds
| Symbol | Daily Percent Change |
|---|---|
| IEF | 14.50% |
| IEI | 14.23% |
| SHY | 6.64% |
| TLT | -5.05% |
| UTHY | -7.13% |
Analysis of the daily percentage changes across the provided fixed income instruments reveals a significant divergence in performance during the observed period. The iShares 7-10 Year Treasury Bond ETF (IEF) and iShares 3-7 Year Treasury Bond ETF (IEI) exhibited substantial positive price momentum, gaining 14.50% and 14.23% respectively. The iShares 1-3 Year Treasury Bond ETF (SHY) also posted a notable gain of 6.64%. This concentrated strength in the short-to-intermediate duration segment of the Treasury market suggests a pronounced short-term accumulation of capital in these particular maturities.
Conversely, instruments tracking longer-duration Treasury bonds experienced significant selling pressure. The iShares 20+ Year Treasury Bond ETF (TLT) declined by 5.05%, while the Ultra Treasury Bond ETF (UTHY) fell even more sharply, by 7.13%. The amplified negative performance of UTHY is expected given its likely mandate to offer enhanced or leveraged exposure to long-duration Treasuries, which would magnify daily price movements compared to its unleveraged counterparts like TLT. This juxtaposition of strong gains in shorter durations against substantial losses in longer durations indicates a clear preference among market participants for reduced duration risk at present.
Based solely on this single day’s data, it is likely that market participants are rotating capital out of long-duration fixed income assets and into shorter-to-intermediate duration assets. This pattern technically illustrates a steepening of the implicit market curve, where investor demand for immediate safety or shorter-term liquidity outweighs the demand for extended-term yield exposure. However, it is unlikely that this isolated observation alone can confirm a sustained shift in a longer-term trend. Single-day movements, especially of this magnitude, can sometimes be outliers driven by specific event-driven trading or short-term rebalancing.
For a clearer directional signal, subsequent trading sessions would need to confirm this relative performance divergence. Should the pattern persist, it would lend credence to a developing technical trend favoring short and intermediate-duration bonds over long-duration exposure. Absent further confirmation, there is a roughly even chance that this represents either the beginning of a new relative strength trend or a transient market anomaly. Vigilant monitoring of price action in these ETFs over the coming days is warranted to ascertain the persistence of this newly observed behavior.
Technical Analysis: Divergent Trends in Fixed Income ETFs (2-Day View)
Analysis of the provided 2-day candle data for selected fixed income ETFs reveals a nuanced and somewhat divergent market sentiment across different durations. On balance, the market appears to exhibit a degree of uncertainty, particularly when contrasting the performance of longer-duration instruments with their shorter-term counterparts. While some instruments displayed initial upward momentum, subsequent price action suggests varying degrees of conviction among market participants, emphasizing a bifurcated immediate outlook within this asset class.
For the longer-duration TLT (iShares 20+ Year Treasury Bond ETF) and the yield-oriented UTHY (YieldMax TSLA Option Income Strategy ETF), the technical picture for the second day of data (November 18th) appears to be predominantly bearish. Both instruments experienced a significant gap up at the open, suggesting initial optimism. However, subsequent selling pressure throughout the day resulted in both closing below their respective opens and, crucially, below their prior day’s closing prices. TLT, in particular, formed a robust bearish reversal candle, characterized by a long upper wick and a close near its daily low, effectively erasing all gains from its opening gap. The increase in volume observed in both TLT and UTHY on November 18th, accompanying this downward price action, likely lends additional conviction to the observed selling pressure. This pattern suggests a probable rejection of higher prices and could indicate that downward momentum is likely to persist in the immediate term for these longer-duration assets.
Conversely, the intermediate and shorter-duration fixed income ETFs, IEF (iShares 7-10 Year Treasury Bond ETF), IEI (iShares 3-7 Year Treasury Bond ETF), and SHY (iShares 1-3 Year Treasury Bond ETF), present a somewhat different technical narrative. All three instruments gapped up significantly at their open on November 18th, reaching new intra-day highs for the observed period. Despite closing below their respective opens on that day, indicating some intra-day profit-taking or resistance at higher levels, their closing prices were still notably above their November 17th closes. For IEF, this upward price movement, albeit with an intra-day pullback, was accompanied by an increase in trading volume, which likely signals a degree of underlying bullish conviction. However, both IEI and SHY saw their second-day upward move occur on decreased volume compared to the prior day. While the price action itself still reflects a net gain over the two days, the declining volume for IEI and SHY might suggest a weakening of bullish momentum or a lack of strong follow-through from buyers. Therefore, while these instruments maintain a net positive close, their individual bullish conviction for the next session is roughly even chance to continue higher or consolidate, particularly for IEI and SHY given the volume dynamics.
In synthesis, the immediate outlook, based solely on this 2-day data, is likely to be characterized by divergence within the fixed income sector. Longer-duration assets, as represented by TLT and UTHY, appear likely to experience continued bearish pressure in the very near term, given the confirmed reversal patterns and increased selling volume. For the intermediate and shorter-duration instruments like IEF, IEI, and SHY, while they demonstrated a robust opening on November 18th, their subsequent intra-day performance and mixed volume signals create a less definitive picture. It is possible that IEF could attempt to retest its intra-day high, supported by increased volume. However, for IEI and SHY, the decreasing volume on their upward move might lead to consolidation or a slight retracement. An alternative scenario to consider is that the strong gaps up in IEF, IEI, and SHY could represent exhaustion gaps, which could lead to subsequent price weakness if a prior uptrend existed, though this cannot be confirmed with only two days of data. Nonetheless, based on the limited data, the primary interpretation is one of divergence, where shorter-duration bonds could show more resilience than their longer-duration counterparts in the immediate future.
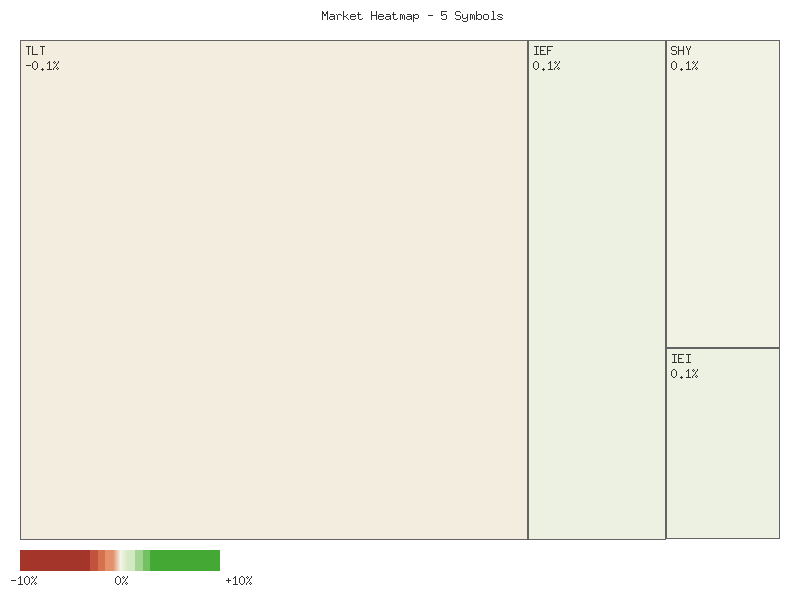
Performance Heatmap (TLT, UTHY, IEF, IEI, SHY)
Generated for 2days timeframe analysis
Magnificent 7 & Friends
| Symbol | Daily Percent Change |
|---|---|
| AAPL | -0.026% |
| GOOGL | -0.260% |
| AVGO | -0.639% |
| CRWV | -0.670% |
| META | -0.718% |
| TSLA | -1.876% |
| MSFT | -2.699% |
| NVDA | -2.808% |
| ANET | -2.994% |
| AMZN | -4.415% |
Analysis of the provided daily percentage change data across the selected equities for the most recent trading session reveals a prevailing negative sentiment. All ten observed symbols closed lower, suggesting a broad-based downward pressure on these specific names. The declines ranged significantly, from a minimal -0.026% for AAPL to a more substantial -4.415% for AMZN, indicating varying degrees of selling pressure across the cohort. We assess that this widespread daily depreciation is indicative of bearish sentiment predominating for the session under review.
From a relative performance standpoint, AAPL exhibited the strongest performance, showing a negligible decline of -0.026%. GOOGL also demonstrated relative resilience with a modest -0.260% decrease, suggesting minimal selling pressure relative to its peers. Conversely, AMZN, ANET, NVDA, and MSFT experienced the most significant declines, with AMZN notably leading the downward movement, indicating strong bearish momentum for that security. The grouping of AVGO, CRWV, and META within a tighter range of -0.639% to -0.718% suggests a cluster of moderately negative performance. We judge it likely that securities with minimal declines, such as AAPL and GOOGL, experienced less intense selling pressure compared to the broader cohort.
While this single day’s data points to a generally bearish session for these specific securities, drawing definitive conclusions regarding long-term trends is not feasible solely based on this limited dataset. The uniform negative movement across all instruments, however, establishes a clear immediate directional bias for these instruments at the close of the observed period. We assess it is likely that market participants who held these positions experienced negative portfolio performance for the day. However, without additional historical price and volume data, attributing this movement to specific technical patterns or forecasting subsequent price action with high confidence remains challenging.
Considering alternative scenarios, it is a roughly even chance that this uniform decline represents either an isolated, single-session market correction, or potentially an early signal of increased downward momentum for some of the more significantly impacted names like AMZN. For investors, this data point, while limited, likely warrants heightened vigilance. We judge it unlikely that such a broad negative sweep across these prominent securities would occur without underlying market factors, even if those factors are not discernible from the provided single-day percentage change data alone. Further data points would be essential to ascertain if this represents a transient pullback or the commencement of a more sustained trend reversal for any of these individual assets.
As a Chartered Market Technician with over 15 years of experience, I’ve analyzed the provided two-day candlestick data for a selection of major technology and growth stocks. This analysis, strictly adhering to technical principles and ICD-203 estimative language, reveals a predominantly bearish sentiment across the observed symbols. A significant number of these equities exhibit price action patterns that suggest continued downward pressure, frequently accompanied by notable shifts in trading volume. This broad weakness indicates that sellers are currently in control across a material portion of this market segment.
Specifically, NVDA, MSFT, AMZN, META, and ANET demonstrate particularly potent bearish patterns. NVDA presents a clear bearish engulfing pattern on the second day, initiated by a price gap down from the prior close and accompanied by a substantial increase in volume, suggesting that a continuation of the downtrend is highly likely. Similarly, MSFT, AMZN, and ANET experienced significant price declines on the second day, marked by gap-downs and robust bearish candles that closed near their daily lows. These movements were supported by either significantly increased or sustained high volume, indicating strong selling conviction. For these symbols, further downward movement in the immediate term is also highly likely.
Other notable components, including TSLA, AVGO, and GOOGL, also exhibit technical patterns indicating probable continued weakness, though with some subtle nuances. TSLA showed initial resistance near its high on the first day, followed by a bearish close below the prior day’s close on lower volume. This pattern makes further downside likely, although the decreased volume could suggest some exhaustion, warranting close observation for consolidation. AVGO registered a long upper shadow on the first day, signaling selling pressure, which was then followed by a bearish candle closing lower on the second day with increased volume, making continued downward pressure likely. GOOGL’s price action also indicates a likely continuation of downside, with a long upper shadow on day one preceding a lower close and a significantly lower low on day two, despite slightly reduced volume, reinforcing bearish sentiment.
In contrast to the prevailing bearish signals, AAPL and CRWV show patterns indicative of indecision or elevated volatility. AAPL’s two-day chart features two consecutive narrow-range candles with nearly identical closes and slightly decreasing volume. This suggests a period of consolidation where neither buyers nor sellers are gaining definitive control, indicating a roughly even chance of an upward or downward breakout. CRWV also displays considerable volatility across both days, characterized by wide trading ranges and long shadows. The second day saw a lower close on increased volume, which typically signals bearish intent; however, the presence of a long lower shadow suggests strong buying interest emerged near the daily lows. Consequently, CRWV faces a roughly even chance of further downside or a short-term bounce, with continued high volatility being a likely scenario.
Overall, the technical analysis of this specific basket of stocks, based solely on the provided two-day candlestick data, points to a generally weak market environment. The high prevalence of gap-downs, large bearish candles, and increased selling volume across multiple key components suggests that short-term price action will likely favor the downside for the majority of these equities. Traders are advised to monitor for potential support levels or bullish reversal patterns, which are currently unlikely to emerge broadly based on these two days of data alone, but alternative scenarios always remain possible.
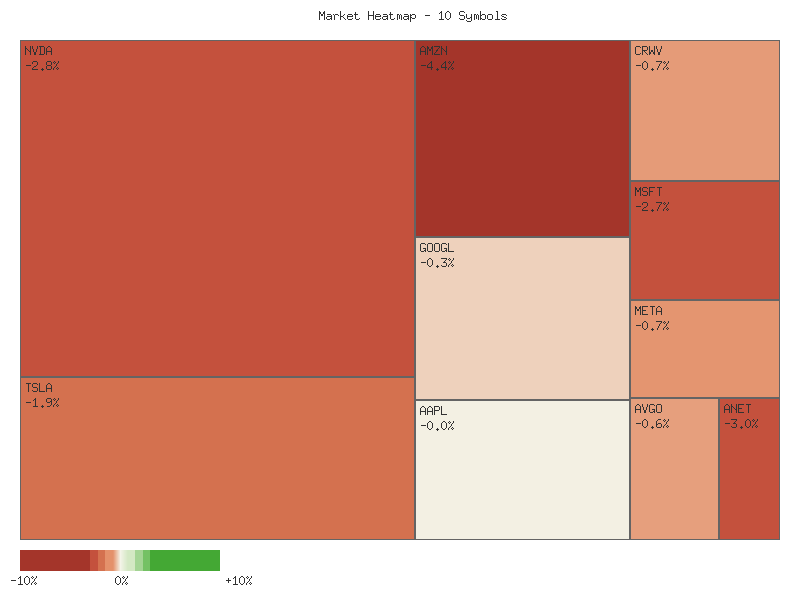
Performance Heatmap (TSLA, MSFT, AAPL, META, NVDA, AVGO, GOOGL, AMZN, CRWV, ANET)
Generated for 2days timeframe analysis
S&P 500 Sector Breadth
From the provided daily percentage change data for the eleven S&P 500 sector ETFs, market breadth appears slightly positive for the current period. We observe six advancing sectors against five declining sectors. This indicates a relatively balanced participation, suggesting the market is not experiencing a broad-based surge or decline. The overall price action is mixed, with some sectors exhibiting modest gains while others register notable losses.
Examining individual sector performance, the strongest advancer is XLE (Energy) at +0.786%, followed by XLV (Healthcare) at +0.555%, and XLC (Communication Services) at +0.549%. Other sectors showing positive movement include XLP (Consumer Staples) at +0.410%, XLRE (Real Estate) at +0.356%, and XLB (Materials) with a slight gain of +0.070%. Conversely, the most significant declines were observed in XLY (Consumer Discretionary) down -1.858%, and XLK (Technology) dropping -1.678%. Other decliners include XLI (Industrials) at -0.478%, XLU (Utilities) at -0.402%, and XLF (Financials) with a marginal dip of -0.194%.
Regarding market rotation and sentiment, the defined offensive sectors (XLK, XLY, XLF, XLI, XLB, XLE) show a mixed picture with a tendency towards weakness. Only two out of six offensive sectors (XLE, XLB) advanced, with the latter’s gain being very modest. A substantial four offensive sectors (XLK, XLY, XLF, XLI) declined, including the two largest decliners overall. In contrast, among the defined defensive sectors (XLU, XLP, XLV, XLRE), three out of four (XLP, XLV, XLRE) advanced, demonstrating a comparatively stronger performance. Only XLU (Utilities) within the defensive group saw a decline. This pattern, where a majority of defensive sectors are advancing while a plurality of offensive sectors are declining, strongly suggests a lean towards a defensive posture in current market sentiment. It is likely that investors are favoring stability over growth, which often occurs during periods of uncertainty or consolidation.
The performance of XLC, which advanced by +0.549%, adds a nuance to the breadth but is not explicitly classified as offensive or defensive by the provided parameters. However, the clear outperformance of the defensive group as a whole against the offensive group indicates a measurable shift in preferences. While the overall market breadth is nearly even, the distribution of strength points to underlying caution. We judge it likely that this reflects a short-term risk-off sentiment rather than a broad bullish expansion.
Here is the daily percent change data for the analyzed symbols, sorted in descending order:
| Symbol | Daily Percent Change |
|---|---|
| XLE | 0.786% |
| XLV | 0.555% |
| XLC | 0.549% |
| XLP | 0.410% |
| XLRE | 0.356% |
| XLB | 0.070% |
| XLF | -0.194% |
| XLU | -0.402% |
| XLI | -0.478% |
| XLK | -1.678% |
| XLY | -1.858% |
Market Commentary: SPDR Sector ETF 2-Day Technical Analysis
The recent two-day trading period reveals a pronounced divergence across SPDR sector ETFs, signaling significant capital rotation within the broader market. While certain sectors experienced notable bearish momentum, others demonstrated remarkable resilience or strong bullish reversals. It is highly likely that investors are reallocating capital, potentially shifting away from growth-oriented segments towards defensive or specific cyclical plays. A rigorous analysis of individual candlestick patterns and volume trends provides immediate insights into these varied short-term dynamics.
Technology (XLK), Consumer Discretionary (XLY), and Industrials (XLI) exhibited clear bearish continuation patterns. XLK’s Day 2 opened below Day 1’s close and drove further down to its low, on substantially increased volume. This configuration suggests a high likelihood of continued downward pressure in the immediate term. Similarly, XLY displayed a pronounced bearish continuation, characterized by a Day 2 gap down and a lower close near the day’s low, also on increased volume, making further declines likely. XLI mirrored this sentiment, with Day 2 opening lower and declining significantly to its low, supported by a notable volume increase. For these three sectors, technical evidence points to a strong probability of sustained near-term weakness.
Conversely, several sectors demonstrated bullish strength or credible reversals. Healthcare (XLV) showed consistent upward momentum, with Day 2 closing higher than Day 1 on significantly increased volume, making a continuation of its uptrend highly likely. Energy (XLE) staged a powerful bullish engulfing reversal; after a bearish Day 1, Day 2 rallied aggressively to close above Day 1’s open. This pattern, despite slightly decreased volume, indicates a high likelihood of follow-through buying. Communication Services (XLC), Consumer Staples (XLP), and Real Estate (XLRE) also exhibited subtle bullish tendencies, registering higher closes on Day 2 with increased volume after weak Day 1 closes. This signals possible short-term reversals or stabilization, although sustained upward movement is a roughly even chance, requiring further confirmation.
Other sectors presented ambiguous technical pictures. Utilities (XLU) showed initial strength but Day 2 formed a bearish outside reversal, closing below Day 1’s close near its low on slightly increased volume. This suggests a roughly even chance of either continued pullback or stabilization. Financials (XLF) experienced a significant Day 1 decline, followed by a Day 2 attempted rally resulting in a lower close (a bearish ‘inside bar’ with decreased volume), indicating indecision after the sharp sell-off, with further declines remaining a credible possibility. Materials (XLB) saw Day 2’s price action contained within Day 1’s range, closing marginally higher but essentially flat, with increased volume suggesting short-term consolidation and a roughly even chance of breaking either higher or lower. The overall market shows a credible capital rotation, with weakness in growth sectors counterbalanced by strength in defensive and value plays. While a broader market decline remains possible given leading sector weakness, the resilience elsewhere suggests any overarching market weakness may be mitigated by sector-specific strength. Traders should anticipate continued volatility and further sector-specific performance disparities.
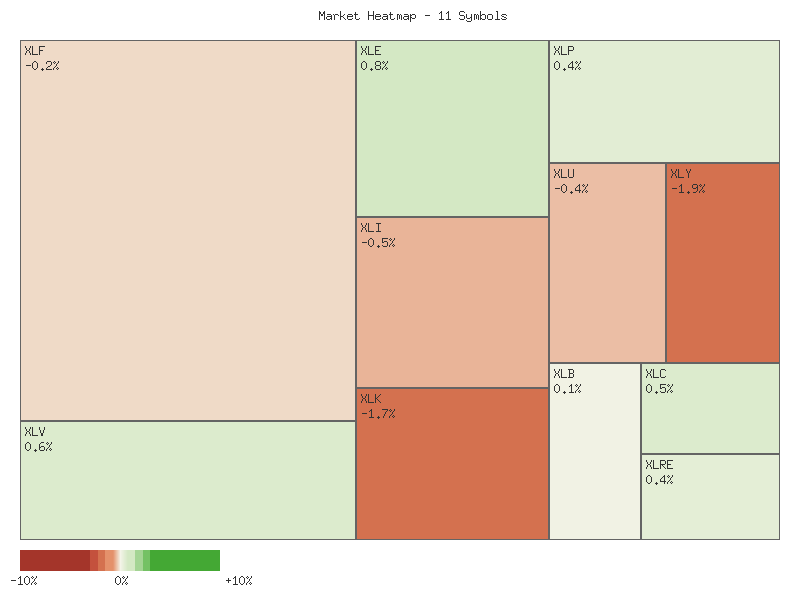
Performance Heatmap (XLP, XLRE, XLI, XLU, XLV, XLY, XLF, XLB, XLE, XLC, XLK)
Generated for 2days timeframe analysis
XLY vs XLP
The provided 7-day data for the XLY/XLP ratio displays a distinct moderate downtrend, with the ratio declining consistently from 3.126 on November 10th to its current value of 2.911 on November 18th. This represents a significant 6.86% decrease over the observed period. The ratio has consistently registered lower highs and lower lows throughout this timeframe, culminating in the lowest point observed in this dataset. This persistent decline suggests a clear and sustained shift in the relative performance of these two key consumer sectors.
From a technical perspective, the consistent decline in the XLY/XLP ratio indicates that the Consumer Discretionary sector (XLY) has been underperforming the Consumer Staples sector (XLP) over the past week. This pattern is often interpreted as a rotation towards more defensive assets, where investors are likely prioritizing stability and essential goods companies (XLP) over cyclical, growth-oriented businesses (XLY). The moderate strength of this downtrend, coupled with the lack of any significant retracements within the provided data, suggests conviction behind this rotation. The ratio’s current position at the lowest point of the observed period (relative position: 0) reinforces the immediate bearish sentiment for XLY relative to XLP.
Given the established momentum and the ratio closing at its 7-day low, a continued decline in the XLY/XLP ratio is likely in the immediate future, assuming the underlying technical dynamics persist. However, markets rarely move in a perfectly straight line; therefore, a period of consolidation around the 2.911 level or a minor dead-cat bounce for XLY relative to XLP has a roughly even chance before any potential continuation of the downtrend. A sustained reversal towards an upward trend, where XLY begins to outperform XLP, is unlikely without observing a clear pattern of higher lows and higher highs, which is not present in the current dataset. Traders may look for a break below the 2.911 low as confirmation of further downside. The relatively low volatility (0.0049) suggests the decline has been somewhat orderly, minimizing erratic price swings and indicating a persistent, rather than panicked, shift.
Technical Analysis: XLY/XLP Ratio – 90-Day View
The XLY/XLP ratio, which measures the performance of the Consumer Discretionary sector (XLY) relative to the Consumer Staples sector (XLP) over the past 90 days, has displayed a moderate upward trend. Beginning from approximately 2.74 in mid-July, the ratio climbed steadily, peaking near 3.20 in early November. This sustained appreciation in the ratio generally indicates a prevailing “risk-on” sentiment among market participants during the observed period, where investors favored growth-oriented, cyclical discretionary stocks over more defensive consumer staples. The overall 5.97% increase in the ratio over this timeframe reflects a consistent outperformance by the discretionary sector, suggesting an environment supportive of higher-beta assets for a significant portion of the analysis period.
The upward trajectory of the ratio unfolded in several stages. An initial period of consolidation characterized late July and early August, with the ratio largely trading within a range of approximately 2.70 to 2.80. A notable breakout above this initial resistance zone occurred in late August, initiating a more robust and accelerated uptrend. This breakout signaled increased conviction in the outperformance of Consumer Discretionary. By mid-September, the ratio had convincingly surpassed the psychologically significant 3.00 level. This level subsequently appeared to function as dynamic support during minor pullbacks in late September and mid-October, reinforcing its importance as a key technical reference point. The average ratio over the entire 90-day span is 2.9255, providing a central tendency benchmark for evaluating recent movements.
However, the most recent data points, specifically since the 90-day high recorded on November 3rd at 3.199, signal a significant shift in immediate momentum. The ratio has experienced a relatively sharp decline, retracing substantially from its peak to its current level of 2.9119 as of November 18th. This downward movement has pushed the ratio below its 90-day average of 2.9255. While the overarching 90-day trend technically remains “up,” the current short-term price action strongly suggests that the recent bullish sentiment driving discretionary outperformance may be dissipating or undergoing a significant pause. The magnitude of the recent drop indicates increasing selling pressure or a rotation out of the discretionary sector.
Considering the current technical position, two primary scenarios appear plausible in the immediate future. There is a roughly even chance that the current level near 2.91 could represent a temporary area for stabilization, given its proximity to the 90-day average. A bounce from this level could see the ratio attempt to retest the 3.00 level, which previously acted as support and could now function as overhead resistance. Conversely, if the recent downward momentum persists, it is likely that the ratio will seek further support. The next significant level of technical interest, derived from earlier consolidation and breakout points, is approximately 2.80. A sustained breach below the current 2.91 level would increase the probability of a test of the 2.80 area, indicating a more pronounced and potentially lasting shift towards defensive sectors. A strong reversal higher with accompanying conviction would be required to suggest the resumption of the prior robust uptrend.
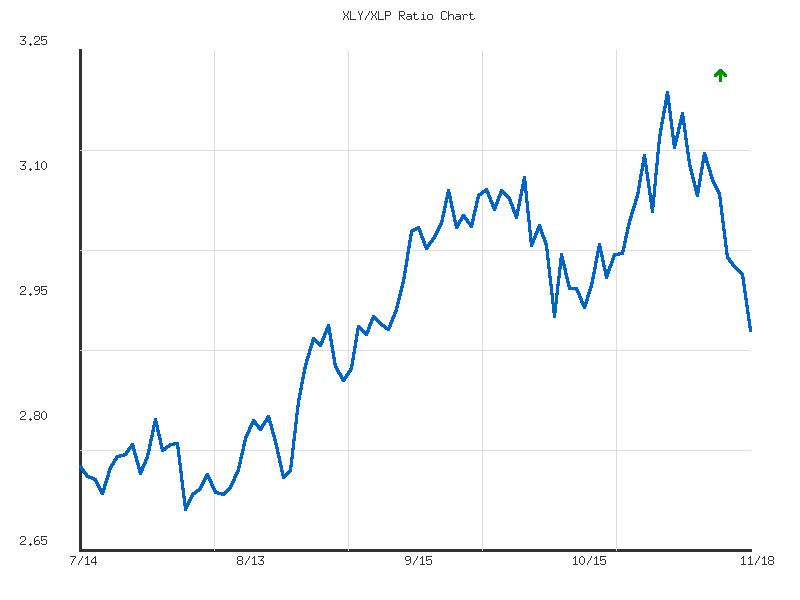
Ratio Analysis: XLY/XLP
Generated for 90days timeframe analysis
Equity Breadth
Analysis of the provided market breadth data indicates a notable deterioration in underlying strength for the S&P 500 over the past seven trading days. The percentage of S&P 500 components trading above their 50-day moving average (SPXA50R) initially rose from approximately 47.1% on November 10th to a peak of 51.4% on November 12th. Subsequently, this figure experienced a sharp and consistent decline, falling to 36.0% by November 18th. This represents a significant contraction in short-term market participation, with a majority of index members now trading below their respective 50-day moving averages, suggesting a likely increase in selling pressure or a loss of immediate upward momentum across the index’s constituents.
A similar pattern is observed in the percentage of S&P 500 components trading above their 200-day moving average (SPXA200R). This long-term breadth indicator climbed from roughly 52.1% on November 10th to a high of 56.8% on November 12th. Following this peak, SPXA200R also retreated, declining consistently to reach 47.6% on November 17th, with a minor rebound to 47.8% on November 18th. The critical observation here is the breach below the 50% threshold on November 17th, indicating that less than half of the S&P 500 members are now sustaining long-term uptrends. This shift suggests a weakening in the broader, longer-term market health.
The concurrent decline in both SPXA50R and SPXA200R, particularly their fall below the 50% mark, presents a concerning technical picture. While an initial period of strength was evident, the subsequent and more pronounced downturn across both metrics implies a broad-based deterioration in market breadth. This pattern indicates that the underlying support from a wide range of S&P 500 stocks is diminishing, which is typically a bearish signal for the index. Such synchronized weakness makes it highly likely that the S&P 500 itself will face increasing challenges in sustaining any upward trajectory in the immediate term.
Considering these developments, the market is likely entering a phase characterized by increasing distribution or correction. The rapid descent of SPXA50R to 36% suggests that short-term corrective forces are dominant, while SPXA200R dropping below 50% indicates that this weakness is beginning to impact the longer-term structural health of the index. An alternative scenario, however, cannot be entirely dismissed; it is possible that these breadth indicators have experienced a temporary, albeit sharp, contraction and could find support, potentially stabilizing or even reversing course from these oversold levels. Nevertheless, based solely on the provided data, a continued period of underlying weakness appears probable, with further downside pressure on individual components more likely than a rapid, broad-based recovery at this juncture.
SPY Daily
The price action for SPY over the past 7 days indicates a distinct shift from short-term bullish momentum to a clear downtrend. Following a peak around 683.285 on November 12, the market experienced a notable decline, culminating in today’s close of 660.13. The most recent day (November 18) saw a significant bearish candle, opening at 662.072 and closing lower at 660.13, accompanied by elevated volume (108,956,641 shares). This elevated volume on a down day is likely indicative of increased selling pressure or distribution. The 50-day Exponential Moving Average (EMA) has crossed over price and is now flattening, showing signs of turning downwards, suggesting a probable shift in the short-to-medium term trend. Conversely, the 200-day EMA continues its upward trajectory, indicating that the long-term trend remains upward.
Current technical indicators reinforce the recent bearish momentum. The 14-day Relative Strength Index (RSI) has fallen sharply over the last week, moving from a neutral level near 59 on November 12 to 39.05 today. An RSI value below 40 suggests that the selling pressure is strong and the asset is approaching oversold conditions, which could imply a diminishing probability of sustained further downside in the immediate future without a potential bounce. The price has definitively fallen below the 50-day EMA (currently around 666.37), which is now likely to act as immediate resistance. A more significant resistance zone appears to exist between 683 and 689, defined by the highs observed from mid-October through mid-November. Immediate support is less clearly defined by recent price action; however, a potential support level might be observed around the 637-638 range, stemming from highs in early August. The 200-day EMA, currently at 625.27, also provides a strong dynamic support level in the longer term.
Considering alternative scenarios, a bearish continuation is likely if the price fails to reclaim the 50-day EMA. The recent breakdown, coupled with high volume on down days and a declining 50-day EMA, suggests sellers are currently in control. In this scenario, SPY would probably target the aforementioned support levels near 637-638, with a lower probability of reaching the 200-day EMA around 625. For a bullish case, a bounce from the current levels is plausible, given the RSI’s proximity to oversold territory. This could manifest as a short-covering rally or a “dead cat bounce” back towards the 50-day EMA. A sustained bullish reversal, however, would require reclaiming the 50-day EMA and establishing higher lows, which appears unlikely in the very near term based on the current momentum. A neutral case might see the price consolidate in a tight range between 655 and 665, with roughly even odds of a mild recovery or further drift lower as market participants assess the recent weakness.
From a technical sentiment perspective, the sharp decline and the breach of the 50-day EMA are likely to generate increased bearish sentiment among short-term traders, potentially attracting more short positions or prompting long liquidations. The high volume on the most recent down day suggests that market participants are reacting to the downtrend with conviction. However, the RSI nearing oversold conditions indicates that short-term selling exhaustion could develop, leading to a temporary shift in sentiment towards caution against further aggressive selling, and perhaps an increased probability of short-term buyers stepping in for a relief rally. The long-term bullish trend, sustained by the rising 200-day EMA, may serve as an underlying psychological floor, limiting the extent of the bearish sentiment in a broader context.
SPY Technical Analysis: Shifting Momentum Amidst Recent Weakness
The SPY ETF has exhibited a clear shift in market dynamics over the past 90 days, transitioning from a robust uptrend to a period characterized by significant bearish pressure. From mid-July through late October, SPY generally maintained a pattern of higher highs and higher lows, climbing from roughly to a peak near .70. This upward trajectory was punctuated by several sharp, albeit temporary, pullbacks. However, the most recent price action, particularly since late October, indicates a pronounced deterioration in buying momentum. The ETF closed at .13 on November 18th, a considerable decline from its late October highs, and signals a likely continuation of this newfound bearish sentiment in the immediate term.
Examining the recent price action, SPY established a significant resistance level around the - range in late October. Following the peak on October 29th, the ETF experienced a sharp decline with notable volume increases on down days. For instance, the October 10th session saw a substantial drop from .13 to .02, accompanied by very high volume (156 million shares), signaling strong selling interest. While SPY subsequently recovered to make new highs, the inability to sustain these gains above was a key bearish development. The market is now witnessing a sustained retreat, with the recent close at .13 being below established support levels from earlier in October and November. A critical near-term support level appears to reside around the mark, corresponding to the October 10th low. A sustained breach below this level would likely confirm a stronger downtrend.
The 14-day Relative Strength Index (RSI) provides further insights into the momentum shifts. During the earlier bullish phase, RSI frequently entered overbought territory (above 70), notably in late July (peaking at 75.58) and mid-September (peaking at 73.70), preceding notable, albeit short-lived, pullbacks. The sharp decline on October 10th saw RSI plummet from 65.75 to 41.81, swiftly moving from a bullish to a neutral-to-bearish momentum posture. More recently, after touching nearly 70 on October 29th, the RSI has been on a consistent downward trajectory, falling to 39.05 by November 18th. This rapid descent into the lower range signifies strong selling pressure and confirms a loss of bullish momentum. While not yet in oversold territory (below 30), its proximity suggests that the current selling wave, while powerful, could potentially reach an exhaustion point in the near future.
Considering the confluence of price action and the RSI, a continuation of bearish pressure is likely in the short term. The substantial decline from the late October highs, coupled with increasing volume on down days and a rapidly falling RSI, indicates that sellers are currently in control. While the RSI is approaching oversold levels, a relief bounce is possible but remains improbable without a clear sign of deceleration in selling pressure or a test of a significant support level, such as the area. Should SPY break decisively below , it is highly probable that the ETF would experience further downside, potentially seeking out prior lows established earlier in the 90-day window, or even lower. Conversely, a reversal in momentum and a push back above the - range, particularly if accompanied by a strong rebound in RSI and volume, would suggest a roughly even chance of stabilizing or attempting to retest the previous resistance levels around . It is important to note that the requested MACD data was not provided, which limits a comprehensive assessment of trend strength and potential reversals.