Daily Market Technical Analysis
The market exhibited widespread negative performance and bearish reversals across major indices, particularly impacting small- and mid-capitalization segments. Key signals include universal negative daily performance, pervasive bearish candlestick patterns, and declining RSI for major indices. Notably, S&P 500 breadth deteriorated sharply, with the SPXA200R falling below 50%. It is likely that broader market indices and most cyclical sectors will face continued downward pressure, with a deeper correction a roughly even chance. Conversely, continued upward momentum for the VIX and defensive sectors like Utilities is strongly suggested. Investors should prepare for sustained caution and monitor key support levels, as a significant bullish reversal appears unlikely for most assets in the immediate term.
Market Indices
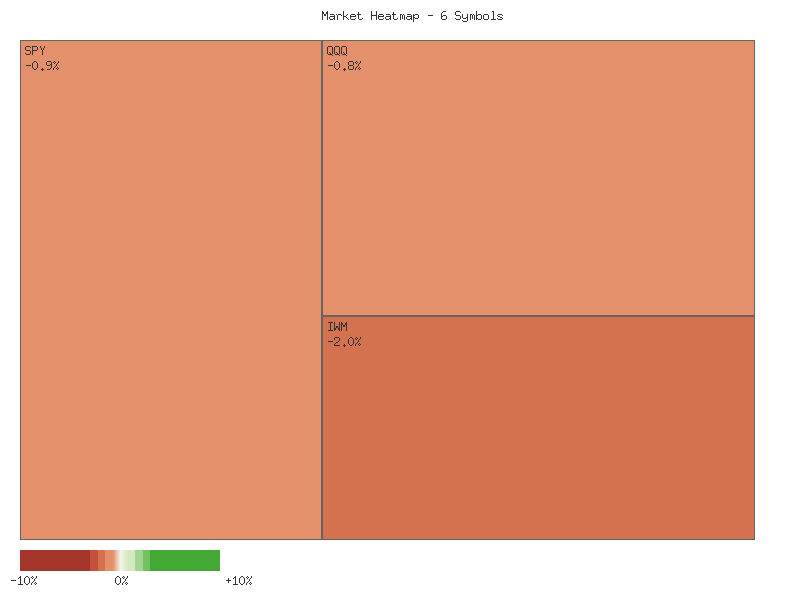
The provided daily percentage change data for key market indices reveals a universally negative performance across all monitored instruments. As seen in the matrix below, all six exchange-traded funds (ETFs) experienced declines for the day, indicating a distinctly negative sentiment permeating various market segments.
| Symbol | Daily Percent Change |
|---|---|
| OEF | -0.797% |
| QQQ | -0.847% |
| SPY | -0.934% |
| MDY | -1.866% |
| IWM | -1.991% |
| IJR | -2.207% |
Regarding market breadth, the distribution shows zero advancing symbols against six declining symbols. This reflects a complete absence of positive momentum among these bellwether indices and represents a broadly bearish short-term outlook. Such overwhelmingly negative breadth is typically a concerning technical signal, suggesting widespread selling pressure rather than isolated weakness. When all major segments are moving in unison to the downside, it is likely indicative of a lack of buying interest across the board.
A closer examination of the magnitude of declines reveals a clear divergence. The small-cap indices (IJR and IWM) and the mid-cap index (MDY) experienced the most significant percentage losses, ranging from -1.866% to -2.207%. In contrast, the large-cap oriented indices (OEF and SPY) and the tech-heavy QQQ exhibited comparatively more modest declines, between -0.797% and -0.934%. This pattern suggests that smaller and mid-sized companies were disproportionately affected, potentially indicating a flight of capital towards larger, more stable enterprises, or simply a more aggressive liquidation in the more speculative areas of the market. It is likely that risk aversion played a role in these differentiated performances.
Based on this single day’s technical data, the market environment appears weak, characterized by broad-based declines and particularly acute selling in the small and mid-capitalization segments. A continuation of downside pressure across the broad market is likely in the immediate term, with smaller caps potentially remaining more vulnerable. However, it is important to consider alternative scenarios; a sudden reversal, though currently unlikely given the unanimity of declines, could emerge if these sharp drops are perceived by some as an overextension of selling, potentially attracting bargain hunters. Without additional data points, such as volume or prior price action, it is difficult to ascertain the strength of any potential reversal, yet the current technical picture strongly favors continued caution.
Market Commentary: Widespread Bearish Reversal Across U.S. Indices
Technical analysis of the two-day candle data for key U.S. market indices reveals a pronounced shift from bullish momentum to broad-based selling pressure. Following a strong upward move on November 14th, all six tracked exchange-traded funds—SPY, QQQ, IWM, IJR, MDY, and OEF—exhibited clear bearish price action on November 17th. This synchronous reversal across diverse market capitalization segments, from large-cap to small-cap, suggests that sellers have gained control, potentially indicating a short-term downtrend initiation. The observed patterns are predominantly bearish reversal candlestick formations, implying a likely continuation of downward price movement in the immediate future, although the conviction levels vary with the associated volume data.
For the large-cap oriented ETFs, SPY, QQQ, and OEF, the price action on November 17th established patterns consistent with a Dark Cloud Cover formation. Each of these indices saw their bullish gains from November 14th significantly retraced by a strong bearish candle on November 17th, with closing prices falling below the midpoint of their respective prior bullish bodies. SPY and QQQ experienced this bearish reversal on slightly lower volume compared to their preceding bullish day, which might suggest that the selling, while impactful on price, was not accompanied by an overwhelming surge in new, aggressive sellers. OEF displayed a similar pattern with decreasing volume. Given these patterns, it is likely that these large-cap indices will face continued downside pressure in the very near term. However, the slightly reduced volume on the bearish day makes a strong, sustained breakdown somewhat less certain compared to a scenario with increasing bearish volume.
In the small and mid-capitalization segments, represented by IWM, IJR, and MDY, the bearish signals were arguably more aggressive. Both IWM and IJR concluded November 17th below the lows established on November 14th, a more significant technical breakdown than merely closing below the prior day’s midpoint. This breach of immediate support levels is highly likely to attract additional selling interest. MDY, in particular, presented a compelling bearish signal; its November 17th candle not only closed substantially below its prior day’s low but also did so on significantly increased volume. This potent combination of a decisive price breakdown coupled with heightened trading activity strongly suggests an increase in conviction among sellers, making further declines highly probable for MDY specifically. Such pronounced weakness in smaller capitalization segments often precedes or accompanies broader market downturns.
Considering the collective evidence, it is highly likely that market participants will encounter sustained bearish sentiment in the immediate trading sessions. The widespread nature of these bearish reversal patterns, especially the more aggressive breakdowns observed in IWM, IJR, and MDY, points to a probable shift in the short-term market trend. While the decreasing volume on the bearish reversal for SPY, QQQ, and OEF presents a roughly even chance of either a measured pullback or a more substantial correction, MDY’s increased bearish volume makes a sustained downward move highly likely for that specific ETF. Traders should prepare for potential follow-through selling across these indices. An alternative scenario, though less likely given the pervasive bearish candle patterns, could involve buyers stepping in to defend these levels, especially if volume remains subdued on further downside for the larger cap indices. Nevertheless, the current technical setup leans strongly towards continued price depreciation.
Performance Heatmap (SPY, QQQ, IWM, IJR, MDY, OEF)
Generated for 2days timeframe analysis
Market Commentary: SPY Technical Analysis (July – November 2025)
The SPY exchange-traded fund has exhibited a prominent upward trajectory over the 90-day period under review, initially advancing from approximately in mid-July 2025 to achieve a significant peak near .70 by late October. This sustained bullish price action was characterized by a series of higher highs and higher lows through much of August, September, and October. While volume frequently accompanied these upward movements, some of the most substantial volume spikes occurred during periods of notable price declines, such as the sharp drop experienced on August 1st and October 10th. The most recent price action, however, indicates a material shift, with SPY experiencing a discernible pullback from its late October peak, retreating to approximately by November 17th.
Analysis of the 14-day Relative Strength Index (RSI) provided notable insights into market momentum during this period. Throughout July, September, and late October, the RSI frequently entered overbought territory, recording values well above 70 (e.g., 75.58 on July 25th, 73.70 on September 22nd, and 69.71 on October 29th). Historically, such extended periods above 70 can precede short-term price corrections or a deceleration in bullish momentum. Indeed, the sharp price decline on October 10th, from near to , was accompanied by a rapid drop in RSI from 65.75 to 41.81, underscoring the potential for swift reversals in momentum from elevated levels.
Currently, the RSI is positioned at approximately 43.019 (as of November 17th). This reading is below the 50-level, which typically suggests that momentum has shifted to favor sellers over buyers in the near term. The trajectory of the RSI since late October, moving from near 70 down to its current level, provides a technical indication of potentially waning bullish momentum. A continued decline in the RSI, especially if it were to approach the oversold threshold of 30, would likely signal a higher probability of further price weakness for SPY, as bearish pressure appears to be accumulating.
Considering the recent price pullback from the late October highs and the declining RSI, it is likely that SPY will experience continued bearish pressure in the immediate term. The stock has broken below recent short-term support levels, and the momentum indicators suggest further downside is possible before a more significant bounce. An alternative scenario, however, presents a roughly even chance of SPY finding near-term support around the - range, potentially leading to a consolidation or a modest rebound if buying interest emerges. Sustained closes below this range would highly likely suggest an extension of the current corrective phase. It is important to note that the requested MACD (13,21-day) indicator data was not provided in the market data for analysis, therefore, its signals could not be incorporated into this assessment.
SPY Price & Indicators (RSI_14_DAY, MACD_13_21_DAY)
Technical Analysis of QQQ Price Action and RSI (14-Day)
QQQ has exhibited an observable uptrend for much of the 90-day period under review, advancing from approximately in mid-July to a peak of .77 on October 29, 2025. This ascent was punctuated by several pullbacks and phases of consolidation. Notable periods of strength include late July, mid-August through mid-September, and a robust rally in the latter half of October. Price action since the late-October peak indicates a shift in momentum, with QQQ experiencing a significant retracement, closing at .65 on November 17, 2025. This recent decline suggests that the prior bullish sentiment has likely diminished, giving way to increased selling pressure. It is important to note that MACD data was specified in the chart request but not provided in the market data, therefore, this analysis will rely solely on price action, volume, and RSI.
The 14-day Relative Strength Index (RSI) has consistently mirrored price movements and provided insights into momentum. During July, RSI readings frequently entered the overbought zone (above 70), such as on July 17, 21, and 28, corresponding with strong price advances. A sharp decline in price on August 1 led to the RSI dropping significantly to 48.26, indicating a swift dissipation of upward momentum. Similarly, the mid-September rally saw RSI briefly re-enter overbought territory (e.g., September 18-22, peaking at 75.36), which was followed by a modest pullback in price. The strong upward move in late October also pushed the RSI firmly into overbought conditions, reaching 71.74 on October 29, coinciding precisely with the price peak. This pattern suggests that prior instances of RSI moving above 70 were often a precursor to, or concurrent with, short-term price exhaustion and subsequent consolidation or retracement.
The most recent price action from late October to mid-November displays a clear downtrend from the peak, with QQQ breaking below several support levels. This decline has been accompanied by consistently elevated trading volumes, notably on October 30, October 31, November 4, November 6, November 7, November 13, and November 14. High volume during a decline is generally interpreted as confirmation of selling pressure and a probable continuation of the bearish trend. The RSI has concurrently dropped from overbought levels in late October to 43.55 on November 17, moving into a neutral to slightly oversold territory. This downward trajectory in RSI, coupled with descending price action and elevated volume, suggests that bearish momentum is likely to persist in the near term.
Considering the technical evidence, it is probable that QQQ will continue to test lower support levels. The sharp decline on October 10 to approximately .50, marked by exceptionally high volume, established a significant support zone. A sustained break below this level would likely signal further downside potential. An alternative scenario, where QQQ begins to consolidate or rebound, would require a noticeable decrease in selling volume on down days and the formation of higher lows in price action. However, based on the current data patterns of falling prices, declining RSI from overbought conditions, and sustained elevated volume on down moves, such a bullish reversal is currently assessed as less probable. Traders should monitor the - region for potential support.
QQQ Price & Indicators (RSI_14_DAY, MACD_13_21_DAY)
As a Chartered Market Technician with over 15 years of experience, I have rigorously analyzed the provided 90-day technical data for IWM, focusing exclusively on the 14-day Relative Strength Index (RSI) and daily candle data (Open, High, Low, Close, Volume). Please note that while MACD was mentioned in the chart description, specific MACD data points were not included in the provided raw data, therefore, no analysis of MACD is possible.
The IWM experienced a robust uptrend from early August to mid-October, characterized by a series of higher highs and higher lows in its price action. During this period, the 14-day RSI frequently touched or approached the overbought threshold (above 65), peaking at 71.23 on September 18th, which is consistent with strong bullish momentum and participation. However, from mid-October onwards, a material shift in price action has become apparent. Following highs around -, IWM entered a distinct downtrend, culminating in a significant decline to a close of .78 on November 17th. This represents a substantial reversal of the preceding uptrend.
The momentum, as indicated by the 14-day RSI, clearly reflects this bearish shift. After the October highs, the RSI steadily decreased, falling from the 60s and 50s through much of October. The most recent RSI reading of 36.06 on November 17th is the lowest observed point within the entire 90-day dataset, confirming a significant and accelerating increase in bearish momentum. While this level is not yet in the conventionally defined oversold territory (below 30), it indicates substantial selling pressure and deterioration of short-term strength. This strong decline in RSI is likely to foreshadow continued downward pressure or at least a period of consolidation at lower price levels.
The candle data reveals critical breakdowns of price structure, which are further reinforced by volume analysis. IWM has recently breached multiple intermediate support levels, including a notable breakdown below the - range that held in early November. More significantly, the price has fallen below the key support established by the October 10th low around .79. The recent sharp declines on November 13th, 14th, and 17th were accompanied by significantly elevated volume (63.7 million, 57 million, and 54.5 million shares respectively), which is substantially higher than the average volume observed during the earlier part of the 90-day period. This surge in selling volume during price depreciation is highly likely to confirm the increased conviction of sellers and suggests that downward momentum will persist.
Considering the confluence of a pronounced price downtrend, a sharply declining RSI into historically low levels for this period, and a notable increase in selling volume, IWM is likely to remain under bearish pressure in the immediate term. While a short-term counter-trend bounce to retest former support levels, such as the - zone, now acting as resistance, is a roughly even chance scenario, sustained recovery appears unlikely without further technical confirmation, such as a clear bullish reversal pattern on higher volume or a positive divergence in momentum indicators. Instead, a continued move lower to test the prior lows from early September near the - area or potentially even the August lows around is a likely scenario should current selling pressure endure. The technical evidence strongly suggests that sellers currently maintain control of the price action.
IWM Price & Indicators (RSI_14_DAY, MACD_13_21_DAY)
VIX Fear Index
The VIX experienced a notable decline over the initial three days of the period, moving from an open of 19.52 on 2025-11-07 to a low of 17.10 on 2025-11-12. This established a short-term bearish trend, with consecutive lower closes indicating decreasing volatility. However, the session on 2025-11-12 saw a small bullish candle, signaling a potential stabilization or pause in the downtrend around the 17.10-17.20 support zone. This dip phase set the stage for a subsequent shift in market sentiment as reflected in the volatility index.
A significant shift occurred on 2025-11-13, as the VIX printed a strong bullish candle, closing at 20.37 after opening at 17.61. This marked a clear reversal from the prior decline, with volume (implied by price action, though not provided explicitly) likely confirming the renewed interest in volatility. This upward momentum was initially met with some resistance on 2025-11-14, which saw a bearish close at 20.07 despite reaching a higher high of 23.03. This suggested some profit-taking or indecision after the sharp rise, but crucially, the VIX held above the 11/13 open.
Nevertheless, the latest session on 2025-11-17 delivered a robust bullish candle, closing strongly at 22.35, with a daily percentage change of 11.36%. This significant single-day gain, coupled with the VIX reaching a new high of 23.44 within the observed period, indicates a strong reassertion of upward pressure in volatility. The close near the high of the day suggests conviction among buyers.
Considering the strong bullish engulfment-like action over the past two sessions and the significant daily gain, it is likely that the VIX will experience continued upward momentum in the immediate term. The decisive move past the prior high of 22.72 (from 2025-11-07) and the current close near the top of the 7-day range reinforces this likelihood. However, there is a roughly even chance of a minor retracement or consolidation in the very short term, given the rapid ascent over the past few days. A sustained push above the 23.44 level would signal a high probability of further extension towards higher volatility levels, while a failure to hold above the 20.00-20.37 range, which now acts as immediate support, would suggest that the recent surge might be contained.
VIX Technical Analysis: November 17, 2025
The Cboe Volatility Index (VIX) has displayed a discernibly oscillating yet upwardly biased trend over the past 90 days, culminating in a significant surge in market uncertainty towards the end of the period. From early July through late September, the VIX largely traded within a contained range, typically between 14.50 and 17.50, punctuated by brief, unsustained spikes such as the 20.38 close on August 1st. This initial phase suggested a period of relatively modest market apprehension, with apparent price support forming around the 14.20-14.90 levels, where downside movements consistently met buying interest. The overall price action during these two months indicated a largely consolidating market sentiment, with brief bursts of fear quickly dissipating.
A notable shift in the VIX’s character became evident as October progressed. On October 10th, the index recorded a substantial upward move, opening at 16.36 and closing dramatically higher at 21.66, signaling a sharp increase in perceived market risk. This intensified volatility culminated in an intraday high of 28.99 on October 17th; however, the VIX closed significantly lower at 20.78 on that day, implying considerable intraday resistance or swift profit-taking at extreme levels. Following this peak, the VIX experienced a retracement, finding temporary stabilization around 15.62-15.79 in late October. Subsequently, November has seen a renewed and more sustained upward trend, with the VIX closing at 22.35 on November 17th. This series of higher closes since late October suggests a developing, robust short-term bullish trend in market volatility.
The 14-day Relative Strength Index (RSI) corroborates the observed shifts in VIX momentum. During the initial July-September ranging period, the RSI generally fluctuated between 40 and 55, aligning with a non-trending or weakly defined trend environment. A temporary overbought reading of 65.38 on August 1st quickly subsided. The most prominent RSI signal occurred on October 10th, when it surged to 73.09, clearly indicating an overbought condition. Historically, such elevated RSI levels are often followed by either consolidation or a short-term price correction, and indeed, the VIX retraced, with its RSI falling to 43.49 by October 27th. As of November 17th, the RSI stands at 64.93. While not yet definitively above the 70 threshold for overbought status, this reading signals strong positive momentum, implying a high likelihood that the VIX is approaching overbought conditions once more.
Based on the recent price action and the momentum indicated by the RSI, a continued upward trajectory for volatility in the immediate term appears likely. The strong closing price of 22.35 on November 17th, coupled with an RSI of 64.93, suggests sustained buying pressure could propel the VIX towards the 23.00-24.00 range, with a test of the October 17th intraday high near 28.99 a plausible, though less certain, scenario. However, market participants should note the RSI’s proximity to overbought territory, which presents a roughly even chance of either further ascent into clearly overbought conditions or a short-term consolidation or pullback. A failure to maintain levels above 20.00, especially if accompanied by a significant decline in the RSI below 60, would make a more pronounced retracement towards the 17.00-18.00 region a distinct possibility. It is imperative to acknowledge that the analysis of the Moving Average Convergence Divergence (MACD) indicator was not possible due to the absence of the corresponding data in the provided market information.
VIX Price & Indicators (RSI_14_DAY, MACD_13_21_DAY)
Tech Sector Analysis
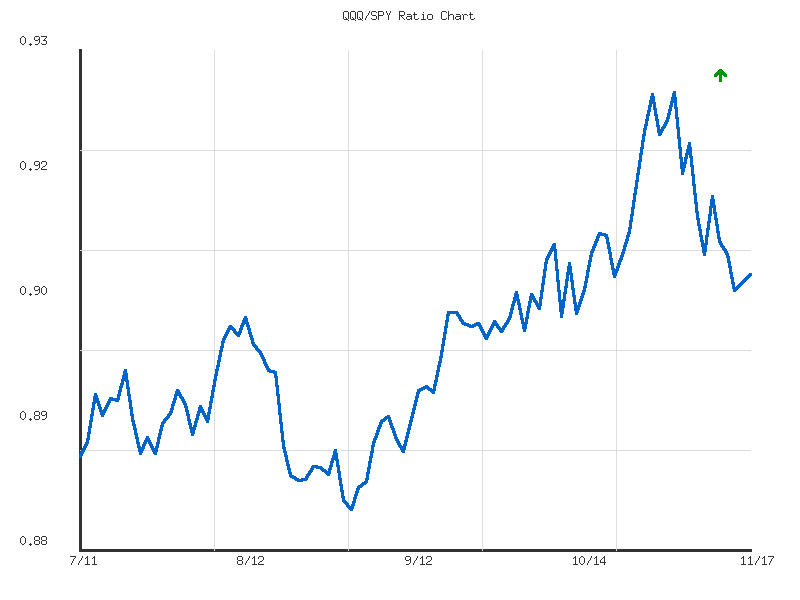
The QQQ/SPY ratio has exhibited a discernible declining trend over the observed 14-day period. Initially, the ratio stood at approximately 0.9249 on October 29th, briefly touching a peak of 0.9250 on November 3rd. This minor peak, followed by an immediate reversal, suggests a brief period of indecision or minor consolidation before the dominant downward pressure reasserted itself. The overarching trend analysis identifies the direction as “down” with a “weak” strength, indicating a consistent but not aggressive underperformance of the technology-heavy QQQ relative to the broader market represented by SPY.
Following the brief peak, the ratio embarked on a sustained descent, notably breaking below its 14-day average of 0.9145. The decline culminated in a trough of 0.9052 on November 13th. As of November 17th, the ratio sits at 0.9068, positioned very close to this recent low point, specifically at the 8th percentile of its observed range. This technical positioning suggests that QQQ has likely been experiencing relative weakness against SPY for the majority of this period, reflecting a nearly 2% erosion in its relative strength from the high.
The reported volatility of 0.000047 is notably low, implying that the ratio’s movements have been generally stable and orderly rather than prone to sharp, erratic swings. This low volatility, coupled with the “weak” downward trend, suggests that while QQQ’s underperformance is present, it is not accelerating aggressively. It is probable that this weak downward trajectory will persist in the immediate term, given the absence of any strong technical reversal signals and the ratio’s current proximity to its 14-day low. However, the “weak” nature of the trend also means that a period of consolidation or a minor bounce is not entirely improbable if the ratio establishes firm support around its current levels, particularly near the 0.9052 trough.
Based solely on the provided 14-day technical data, QQQ’s relative performance against SPY is likely to remain subdued or continue its weak downward trajectory. The ratio’s persistent struggle to reclaim levels above 0.9100 for the latter half of the period, coupled with its current hover near the 14-day low, underpins this technical assessment of weakness. A significant bounce from current levels to re-test the average ratio of 0.9145 is unlikely without new technical catalysts not observable in this data. Considering the current technical posture, a continuation towards breaching the recent 14-day low appears to be a marginally higher probability outcome than a substantial upward reversal at this juncture.
To fellow retail traders, let’s analyze the provided QQQ/SPY ratio data over the past 90 days, focusing strictly on the technical patterns observed. This ratio serves as an indicator of the relative performance of the Nasdaq 100 (QQQ) against the broader S&P 500 (SPY).
The dataset indicates an overall upward trend in the QQQ/SPY ratio, commencing from approximately 0.888 on July 11th, 2025, and currently standing at 0.9068 on November 17th, 2025. This 2.04% increase over the period suggests that the QQQ has, on balance, outperformed SPY. However, it is crucial to note that the trend strength is explicitly characterized as “weak.” This implies that while QQQ’s leadership is present, it lacks significant momentum or acceleration, which typically accompanies a robust upward trend. The remarkably low volatility figure of 0.00010176 corroborates this assessment, suggesting that the ratio’s movements have been gradual and contained rather than experiencing sharp shifts or extended periods of dramatic outperformance.
Delving into the specific price action, the ratio exhibited initial stability before experiencing a notable decline, hitting its 90-day low of 0.8834 on September 2nd, 2025. This low represented a temporary period where SPY either matched or slightly exceeded QQQ’s performance. Following this trough, a clear and sustained rally emerged, propelling the ratio upward to its peak of 0.9250 on November 3rd, 2025. This ascent from early September to early November denotes the strongest phase of QQQ’s relative outperformance within the analyzed window. Subsequently, the ratio has pulled back from this peak, settling at the current 0.9068. This current level sits above the 90-day average ratio of 0.9000, specifically positioned at 56.27% of its range from the low to the high.
The interplay of the “weak” trend strength and the recent retreat from the November 3rd peak is a critical observation. This combination suggests a likely deceleration in the pace of QQQ’s outperformance. While the underlying trend direction remains upward, the lack of robust momentum makes a continuation of significant, uninhibited gains in the QQQ/SPY ratio less certain in the immediate future. Given that the current ratio is above its average but has definitively reversed from its high, there is a roughly even chance that the ratio will continue to consolidate around its current levels or experience further moderate declines towards the average ratio of 0.9000. This could signify a period of market rotation or a temporary pause in the leadership of growth-oriented stocks.
Considering the technical landscape, a retest of the 0.9000 average ratio is a likely scenario if the current weak trend persists. Such a move would indicate a period where SPY’s performance is either catching up to, or slightly exceeding, QQQ’s. While a swift, significant break below the average ratio is unlikely without new catalysts, it cannot be entirely ruled out as market dynamics can shift. Conversely, a convincing reassertion of the upward trend, which would necessitate a breakout above the 0.9250 high, is also unlikely without a noticeable strengthening of the trend’s momentum. Therefore, traders are advised to monitor whether the ratio finds sustainable support around the average or enters a tighter consolidation pattern, as the current data points to a phase of reduced conviction in QQQ’s leadership relative to SPY.
Ratio Analysis: QQQ/SPY
Generated for 90days timeframe analysis
IWM vs. SPY
The provided 14-day data for the RATIO:IWM/SPY indicates a clear trend of relative underperformance of the Russell 2000 (IWM) compared to the S&P 500 (SPY). From the initial data point of 0.359097 on October 29th to the most recent value of 0.349698 on November 17th, the ratio has declined by approximately 2.62%. This consistent downtrend, explicitly labeled as “down” with “weak” strength in the trend analysis, suggests that the market has generally favored larger-cap stocks over small-cap stocks during this period.
Examining the price action within this window, the ratio experienced an early high of 0.361189 on November 5th. However, from November 10th onwards, a more pronounced pattern of lower highs and lower lows emerged. Specifically, the ratio declined from 0.358162 on November 10th to 0.349698 on November 17th, marking the lowest point in the observed 14-day series. This sustained decline over the latter half of the period provides a strong technical indication of increasing relative weakness in IWM.
Given the current ratio is at the low point of the 14-day period (0.349698) and the overall trend remains downward, it is likely that IWM will continue to exhibit relative underperformance against SPY in the immediate future. The low volatility recorded for the ratio suggests that these changes, while directional, have been relatively stable rather than erratic. A continuation of this trend is probable unless there is a significant shift in market sentiment not reflected in this specific dataset.
Considering alternative scenarios, there is a roughly even chance of a short-term consolidation or minor rebound from this 14-day low, as markets rarely move in a perfectly straight line. However, for a sustained reversal of IWM’s relative underperformance, the ratio would need to demonstrate a clear pattern of higher lows and higher highs, breaking above recent short-term resistance levels, particularly in the 0.358-0.360 range. Based solely on the provided 14-day technical data, a robust and immediate reversal of this relative downtrend is unlikely.
The IWM/SPY ratio has demonstrably been in a downtrend over the latter portion of the observed 90-day period, indicating a weakening in the relative performance of the Russell 2000 (IWM) compared to the S&P 500 (SPY). The current ratio, standing at 0.3497 as of November 17th, reflects a significant decline from its peak within this timeframe and is notably positioned below the 90-day average ratio of 0.3598. This recent weakness suggests that large-cap equities, represented by SPY, have been the preferred asset class in relative terms, maintaining or increasing their market leadership over small-cap stocks.
Analyzing the specific price action, the ratio reached its 90-day high of 0.3763 on October 15th, marking the culmination of an intermediate rally that began from a prior low around 0.3457 on August 1st. However, this peak proved unsustainable, and the ratio subsequently initiated a persistent decline. Throughout late October and into November, attempts by the ratio to establish higher relative strength were consistently met with selling pressure, confirming resistance levels in the 0.365-0.368 range. The inability to sustain moves above these intermediate resistance points after the October high solidifies the bearish outlook for IWM’s relative performance against SPY.
The current ratio of 0.3497 is now testing the vicinity of the 90-day low of 0.3457 established on August 1st. This level is critical for the short-to-medium term relative performance outlook. A decisive breach below the 0.3457 support would likely signal an acceleration of the relative downtrend, implying further outperformance by SPY. While the data indicates the current downtrend is of “weak” strength with low volatility, suggesting a gradual rather than sharp decline, proximity to a significant support level necessitates careful observation. A controlled decline might precede more pronounced directional moves if key support is ultimately broken.
Considering future scenarios, it is likely that the IWM/SPY ratio will continue to test the 0.3457 support level. Should this support fail, it is highly likely the ratio will establish new 90-day lows, further confirming the relative underperformance of IWM. Conversely, for the relative strength trend to reverse, the ratio would need to form a clear base above the 0.3457 level, followed by a sustained move above the 90-day average of 0.3598. There is a roughly even chance of a brief consolidation or minor bounce around the 0.3457 level, given its previous role as a floor. However, a significant reversal in the relative strength trend from current levels, without first establishing clear higher lows and breaking through established resistance, appears unlikely.

Ratio Analysis: IWM/SPY
Generated for 90days timeframe analysis
Commodities
| Symbol | Daily Percent Change |
|---|---|
| CORN | 0.7718% |
| USO | -0.0700% |
| DBC | -0.0871% |
| UGA | -0.9729% |
| SLV | -1.0444% |
| GLD | -1.1490% |
| CPER | -1.3248% |
| UNG | -2.9897% |
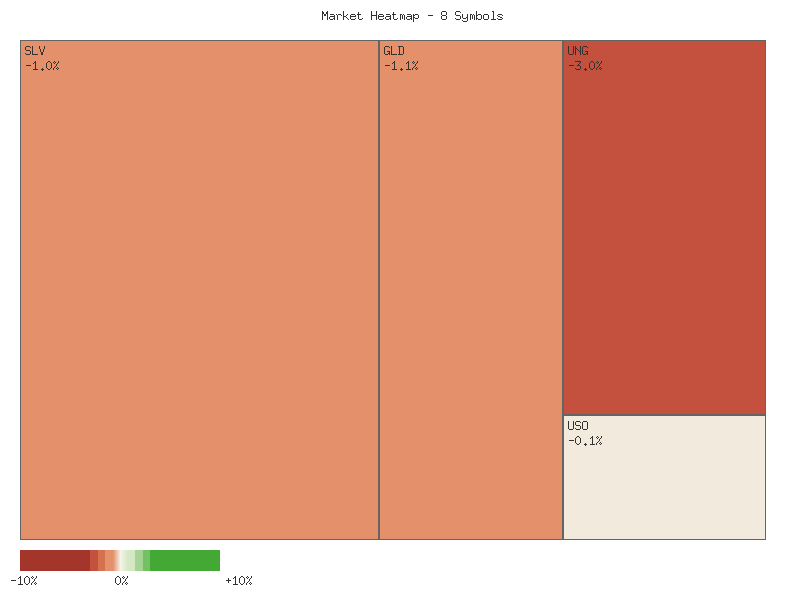
The provided daily percentage change data for this selection of commodity-related ETFs indicates a pronounced bearish technical posture across the observed assets. Out of eight symbols, only CORN advanced, while seven declined, creating a 7:1 declining-to-advancing ratio. This negative market breadth suggests pervasive downward pressure across a significant portion of these tracked commodity instruments, making a broad-based technical weakness across this specific basket of assets highly likely for the observed period.
Individual asset performance further illustrates this weakness. UNG (Natural Gas) led declines at -2.99%, followed by CPER (Copper) at -1.32%. Precious metals, SLV (Silver) and GLD (Gold), also saw significant losses at -1.04% and -1.15% respectively, alongside UGA (Gasoline) at -0.97%. The widespread and often considerable declines across distinct categories—energy, industrial metals, and precious metals—makes it highly likely that a general risk-off sentiment or technical unwinding was prevalent in these specific sectors. USO (Crude Oil) and DBC (Diversified Commodities) showed more modest losses, potentially indicating some relative resilience within the broader complex.
In stark contrast, CORN (Corn futures) was the sole advancing asset, up 0.77%, signifying a clear technical divergence from the broader commodity complex. While most commodities faced pressure, CORN demonstrated relative strength, suggesting potential factors specific to the agricultural sector or a reallocation of capital within the commodity space. Based purely on this one-day observation, it is roughly even chance that this isolated strength in CORN represents a sustained outperformance or a singular event amidst a predominantly negative commodity environment.
As a Chartered Market Technician with over 15 years of experience, this analysis focuses exclusively on the provided two-day candle data to discern short-term market dynamics for the selected commodity ETFs. All conclusions are derived strictly from price and volume patterns, adhering to rigorous technical analysis principles and ICD-203 estimative language guidelines.
An analysis of the two-day candle data across various commodity ETFs largely reveals a pattern of short-term bearish reversal or consolidation. While some assets initially showed minor bullish momentum, the second day frequently saw a notable shift towards bearish price action, often closing near the lows of the two-day period. A consistent observation is the decrease in volume on the second day for many of these assets, particularly during bearish moves. This pattern suggests a likely waning of conviction, implying that while downside pressure is probable for several commodities, high-conviction, broad directional moves across the entire complex may be unlikely in the immediate future.
The precious metals sector, specifically GLD (Gold) and SLV (Silver), exhibited strong bearish reversal patterns. GLD experienced a robust bullish candle on the first day, which was subsequently almost entirely negated by a very large bearish candle on the second, closing at the absolute low. This “bearish engulfing” pattern, despite slightly decreased volume, strongly suggests a continued downtrend is highly likely for GLD. SLV displayed a similar bearish reversal, closing significantly lower than its prior day’s open, implying likely continued downside pressure. In the energy complex, UNG (Natural Gas) also presented a strong bearish candle on the second day, erasing prior gains and closing near the two-day low, indicating that further downside is probable.
UGA (Gasoline) also showed signs of short-term weakness, closing bearishly at its low on the second day after a neutral first day, with significantly decreased volume. This implies a likely continuation of minor downside. CPER (Copper) mirrored the bearish reversal seen in precious metals; a bullish first day was entirely undone by a strong bearish candle on the second, closing near its low and below the prior day’s open. This suggests that continued downward price action is likely for CPER. In contrast, USO (Oil) exhibited minimal directional conviction, with small candle bodies and a tight trading range across both days. The slightly lower close on the second day, coupled with decreased volume, suggests a roughly even chance of continued consolidation or a marginal bearish bias rather than a strong directional move.
CORN (Corn) presented a more ambiguous picture, with a bearish first day succeeded by a small bullish candle on the second, closing higher but on decreased volume. This pattern suggests a roughly even chance of either a minor rebound or continued range-bound trading, as strong bullish conviction is not clearly established. Finally, DBC (Broad Commodities) showed pronounced indecision, characterized by very small candle bodies and tightly contained trading over both days, alongside significantly decreased volume. This strongly indicates that a significant directional breakout is unlikely in the immediate term, with continued consolidation being the most probable scenario for DBC.
Performance Heatmap (SLV, GLD, CORN, CPER, USO, DBC, UGA, UNG)
Generated for 2days timeframe analysis
Technical Analysis of SLV (90-day)
SLV has exhibited significant price movements over the past 90 days, transitioning from a strong bullish trend to a probable bearish correction. Our analysis is based solely on the provided candlestick data and the 14-day Relative Strength Index (RSI). It is important to note that while MACD was indicated in the chart type, detailed MACD data points were not provided for this analysis.
From late July to mid-October, SLV experienced a robust uptrend, climbing from lows around .30 to a peak near .70. This upward momentum was consistently confirmed by the 14-day RSI, which entered and sustained overbought conditions (above 70) throughout much of September and early October, peaking above 84. This pattern is characteristic of a strong, healthy uptrend where momentum is firmly in favor of the bulls. Volume generally supported this rally, showing increased participation on significant up days, particularly leading into the October peak.
However, the trend exhibited a notable shift in mid-October. A significant high-volume reversal occurred between October 9th and October 17th, characterized by large candles with extended upper wicks and considerable selling pressure. This culminated in a sharp decline on October 21st, which saw SLV drop from .72 to .79 on exceptionally high volume (over 81 million shares). Concurrently, the 14-day RSI underwent a rapid descent from deeply overbought levels (above 80) to the mid-50s, indicating a substantial loss of bullish momentum and a clear shift towards bearish control. The period from late October through early November saw SLV largely consolidate between approximately .40 and .50.
More recently, SLV staged a strong three-day rally from November 10th to November 12th, pushing the price from .25 to .345. This advance was accompanied by rising volume, particularly on November 12th, and lifted the 14-day RSI back towards the 70 level. This suggested a renewed attempt by buyers to reassert control. Nevertheless, this rally encountered resistance precisely at the prior October highs around .70. The subsequent three trading days (November 13-17) saw SLV retreat significantly, closing at .48. The RSI has simultaneously pulled back to the mid-50s, implying a failure to maintain the momentum from the recent bounce.
Considering these patterns, it is likely that the recent rally from November 10th to 12th was a retest of overhead resistance rather than the initiation of a new uptrend. The sharp rejection from the October highs and the subsequent decline on receding volume suggest that bearish pressure is resuming dominance. We assess that SLV is likely to experience further downward price action in the near term, with the next significant support level residing in the .70-.40 range, corresponding to the October lows. A decisive break below this band would make further declines highly likely.
Alternatively, there is a roughly even chance that SLV could enter a period of consolidation, possibly forming a new trading range between approximately .00 and .00. This scenario would involve price oscillations within this band as market participants digest the recent volatile moves, with the 14-day RSI oscillating around its neutral 50-level. A sustained period of decreased volatility and volume within this range would lend credence to this outlook.
A renewed and sustained uptrend from current levels is unlikely in the immediate future. For such a scenario to develop, SLV would need to demonstrate a compelling and decisive break above the critical .70 resistance level, ideally supported by strong, increasing volume and a sustained move of the 14-day RSI back into deeply overbought territory. The current technical posture does not indicate such a development is imminent.
SLV Price & Indicators (RSI_14_DAY, MACD_13_21_DAY)
GLD Technical Analysis: Recent Trends and Outlook
This technical analysis of GLD, covering 90 days from July 11, 2025, to November 17, 2025, relies solely on the provided daily candlestick data and the 14-day Relative Strength Index (RSI). It is important to note that MACD (13,21) data, though indicated in the chart title, was not supplied and therefore cannot be included in this commentary. During the initial period through July and mid-August, GLD exhibited limited price volatility, consolidating within a narrow range. The RSI concurrently fluctuated around the neutral 50 level, primarily between 45 and 55, indicating an absence of strong directional momentum. This phase suggested market indecision, with neither buyers nor sellers asserting sustained control.
A distinct bullish momentum emerged from late August, propelling GLD into a robust uptrend that persisted through mid-October. GLD’s price ascended significantly during this period, rising from approximately - to peak near . The 14-day RSI emphatically confirmed this strength, consistently entering and remaining in overbought territory. Multiple RSI readings exceeded 75, with several instances above 80, culminating in an extreme peak of 87.33 on October 20. Such prolonged and elevated RSI values strongly indicated overextended buying pressure, increasing the likelihood of an impending pullback or significant consolidation. Higher trading volumes observed during this rally generally corroborated the underlying upward momentum.
The pronounced bullish momentum ceased abruptly around October 20. Following the RSI’s peak at 87.33, GLD underwent a sharp and definitive reversal. On October 21, the RSI dramatically plunged to 60.02, while the price plummeted from .15 to .24. This substantial single-day price decline, coupled with exceptionally high trading volume exceeding 53 million shares, strongly signals a capitulation event and a decisive shift in market sentiment. This forceful downturn immediately established a new bearish momentum, confirming that the prior overbought condition unwound through a sharp price correction. The RSI’s subsequent descent below the neutral 50 level further validated the significant dissipation of aggressive buying pressure.
The most recent data, covering late October to mid-November, depicts GLD in a phase of re-evaluation and potential stabilization. The RSI initially stabilized between the low 40s and mid-50s, avoiding deeply oversold levels, suggesting reduced but persistent selling pressure. An attempted rebound in mid-November saw the RSI briefly rise above 60, reaching 64.56, accompanying a modest price recovery. However, the final data point shows the RSI retracting to 50.98 on November 17, signaling a current struggle to sustain upward momentum. Given the sharp prior correction and the RSI’s inability to establish a renewed strong trend, it is likely that GLD will experience further consolidation or a re-test of support levels in the immediate future. A sustained move and hold above 65 on the RSI would be required to suggest a renewed bullish impulse, but such a development currently appears to have a roughly even chance against continued sideways to downward price action. A rapid return to previous peak momentum is unlikely without clearer technical catalysts.
GLD Price & Indicators (RSI_14_DAY, MACD_13_21_DAY)
Gold/Silver Ratio
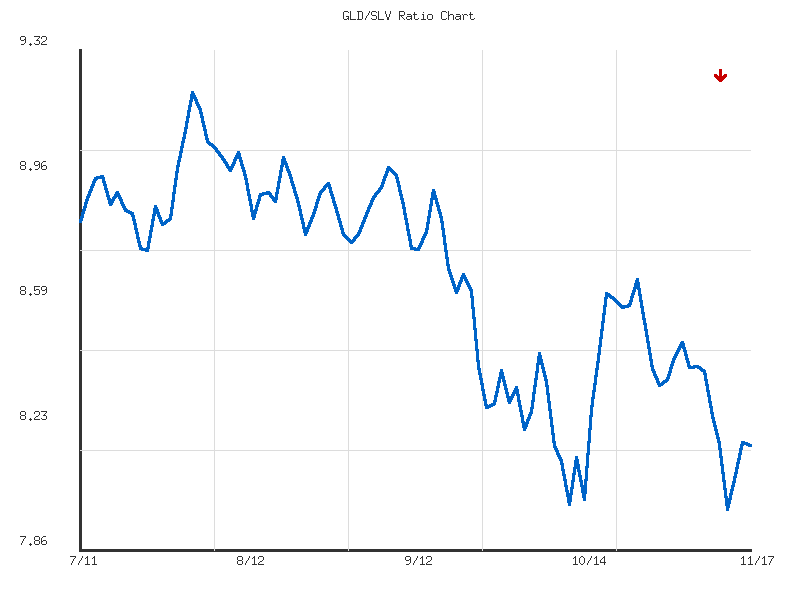
The GLD/SLV ratio has exhibited a discernible downward trajectory over the observed 14-day period, commencing from approximately 8.39 on October 29th and closing at 8.17 on November 17th. The provided trend analysis confirms an overall ‘down’ direction, albeit with a ‘weak’ strength, reflecting a -2.68% change in the ratio. This indicates that gold, as represented by GLD, has relatively underperformed silver, represented by SLV, during this timeframe, leading to the declining ratio. The current ratio stands below its 14-day average of 8.289, suggesting prevailing bearish sentiment for GLD’s relative strength.
Examining the granular price action, the ratio initially traded within a relatively tight range between 8.34 and 8.47 from October 30th to November 6th, with a peak at 8.473 on November 4th. A notable shift occurred subsequent to November 7th, with the ratio experiencing a more pronounced decline, culminating in its lowest observed point of 7.985 on November 12th. This specific drop represents a material weakening in the relative strength of gold against silver. Following this low, the ratio attempted a modest rebound to 8.18 on November 14th before settling near 8.17 by the end of the period.
The current technical posture suggests that a continuation of the weak downward trend is likely in the immediate future, given the consistent pattern of lower highs and lower lows observed from the peak on November 4th to the low on November 12th. The low volatility, measured at 0.0205, further supports the idea that the current trend, though weak, is relatively stable rather than prone to sharp, unpredictable swings. The ratio’s current position at 8.17, which is below its 14-day average of 8.289 and closer to its low of 7.985, reinforces the bearish near-term outlook for GLD relative to SLV.
While a continuation of the weak downtrend is likely, there is a roughly even chance that the ratio could consolidate around the current 8.17 level, particularly given the minor rebound from the 7.985 low. A decisive break below the 7.985 level would make a further decline to new lows probable. Conversely, a sustained move above the 14-day average of 8.289, especially if accompanied by an increase in volatility or sustained higher closing values, would diminish the likelihood of continued downside and suggest the unlikely possibility of a trend reversal toward strength for GLD relative to SLV.
Technical Analysis: GLD/SLV Ratio (90-Day View)
The GLD/SLV ratio has exhibited a moderately strong downtrend over the past 90 days, declining approximately 7.40% from its peak in early August to its current level. Starting in mid-July around the 8.80-8.90 range, the ratio quickly ascended to its 90-day high of approximately 9.20 on August 1st. This level, however, proved unsustainable, initiating a broader decline that has characterized the subsequent three months. The current ratio of 8.17, relative to the 90-day average of 8.65 and its lowest point of 7.98, suggests that the balance of power remains with the denominator (SLV), indicating that silver has been outperforming gold over this period.
Following the August 1st peak, the ratio entered a declining channel. Initial support was observed around the 8.75-8.80 region in late July and mid-August. However, this level was decisively breached by early September, ushering in a more pronounced downtrend. A significant support cluster emerged in the 8.28-8.40 area during late September and early October, which temporarily halted the decline. The ratio consolidated around these levels for several weeks, oscillating between 8.00 and 8.60, with heightened volatility observed around mid-October, when the ratio briefly spiked to 8.61 before quickly retreating.
The latest leg of the downtrend commenced in early November, pushing the ratio below its prior support levels. This downward movement culminated in the establishment of a new 90-day low at roughly 7.98 on November 12th. From this recent trough, the ratio has experienced a modest rebound, currently trading around 8.17. This bounce could be interpreted as a potential short-term counter-trend rally within the broader downward channel, or a temporary consolidation phase as the market assesses the new lower trading range.
Considering the established downtrend and the recent price action, it is likely that the GLD/SLV ratio will continue to encounter resistance in the 8.30-8.40 zone, which previously offered temporary support in late October. A failure to sustain a move above this resistance cluster would reinforce the prevailing bearish sentiment, suggesting a higher probability of retesting the recent low of 7.98. Should this critical support at 7.98 be breached, it is likely that the ratio would seek further downside, potentially exploring uncharted technical territory below 7.90. An alternative scenario, though less likely given the moderate downward trend strength, would involve a sustained breakout above the 8.40 resistance, which could suggest a more significant consolidation or a potential, albeit temporary, shift in the ratio’s short-term trajectory towards the 8.60-8.70 region.
Ratio Analysis: GLD/SLV
Generated for 90days timeframe analysis
Bonds
| Symbol | Daily Percent Change |
|---|---|
| TLT | 0.264% |
| UTHY | 0.167% |
| IEF | 0.114% |
| IEI | 0.046% |
| SHY | 0.000% |
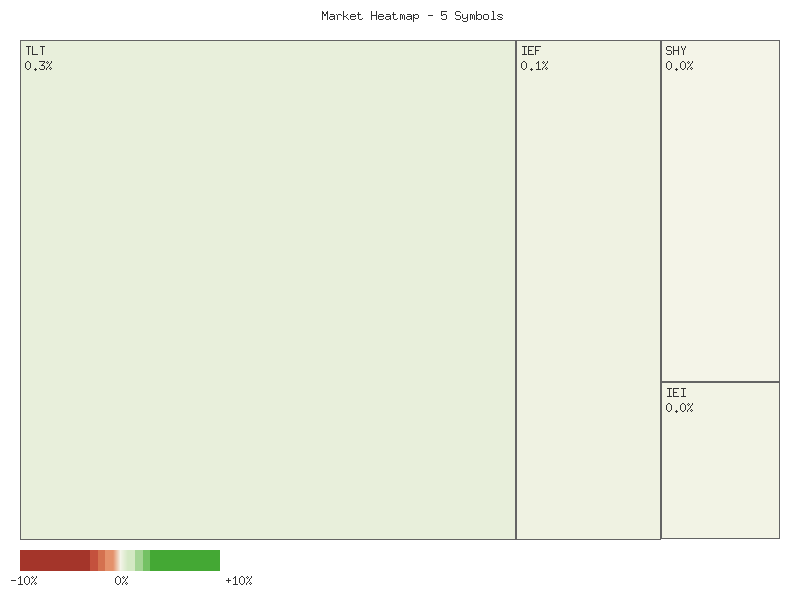
Analysis of the provided daily percentage change data across various Treasury bond ETFs reveals a discernible pattern for the observed period. Longer-duration instruments, specifically TLT (20+ Year Treasury Bond ETF) and UTHY (Ultra Long-Term Treasury Bond ETF), exhibit the most significant positive daily movements, with TLT advancing by 0.264% and UTHY by 0.167%. Intermediate-duration ETFs, IEF (7-10 Year Treasury Bond ETF) and IEI (3-7 Year Treasury Bond ETF), also posted positive, albeit smaller, gains of 0.114% and 0.046% respectively. In contrast, SHY (1-3 Year Treasury Bond ETF), representing the shortest duration, remained unchanged with a 0.000% daily percentage change. This snapshot suggests a broad, albeit uneven, upward movement across the Treasury yield curve for this particular trading session.
The observed performance gradient, where longer-duration bonds outperform shorter-duration ones, likely indicates a specific market sentiment for the day. This pattern typically emerges when market participants anticipate stable or declining future interest rates, which would benefit longer-dated bonds more due to their higher interest rate sensitivity (duration). While this single day’s data is insufficient to confirm a sustained trend, the collective behavior across the maturity spectrum strongly suggests a preference for duration risk over shorter-term liquidity for this session. It is roughly even chance that this could be the beginning of a trend favoring long bonds or merely a short-term market fluctuation driven by intraday news or positioning that is not visible in this data set.
Given that the provided data consists of a single day’s percentage change for each instrument, our ability to draw comprehensive technical conclusions is inherently limited. We cannot identify established trends, chart patterns (such as support/resistance, head and shoulders, or double tops), volume confirmations, or momentum indicators. Therefore, while the differential performance across maturities is evident, predicting future price action or confirming a robust change in market direction is not feasible from this isolated data point. Further technical analysis would require historical price and volume data over multiple periods to assess the strength of any potential trend reversal or continuation, evaluate volatility, and apply systematic, rules-based methods for identifying actionable trading signals. Without this additional context, any projection beyond the immediate observation carries significant uncertainty.
Technical Analysis of Treasury Bond ETFs (2025-11-14 to 2025-11-17)
The two-day trading period spanning November 14th to November 17th, 2025, for the selected Treasury bond ETFs (TLT, UTHY, IEF, IEI, SHY) reveals an initial phase of broad bearish momentum followed by a period of tentative recovery or consolidation. On November 14th, all five ETFs experienced notable selling pressure, evidenced by bearish candles closing at or near their daily lows. This strong bearish action was accompanied by significant volume across most instruments (TLT, IEF, IEI, and SHY), signaling a widespread decline in bond prices.
For the longer-duration Treasury ETFs, November 17th presented signals of a potential short-term bullish reversal. UTHY, representing 25+ year maturities, completed a Piercing Pattern: a bearish candle on November 14th followed by a bullish candle on November 17th that opened lower than the prior close but closed above the midpoint of the prior day’s real body. This pattern, often associated with a waning of selling pressure, suggests a moderate probability of a short-term upward price correction. Notably, this reversal attempt in UTHY occurred on significantly reduced volume. Similarly, TLT (20+ year maturities) and IEF (7-10 year maturities) exhibited patterns resembling a Bullish Counterattack Line or Meeting Lines, where the November 17th candle opened with a gap above the previous day’s close and closed near or slightly above the prior day’s closing level. This suggests a roughly even chance of continued short-term upward momentum, though the reduced volume on these reversal attempts for both TLT and IEF implies a lack of strong conviction from buyers.
In contrast, shorter-duration Treasury ETFs demonstrated greater indecision after the initial bearish day. IEI (3-7 year maturities) formed a Doji-like candle on November 17th, opening with a gap up from the previous close but closing precisely at its opening price. The increased volume accompanying this doji indicates significant market indecision following the prior decline, implying a roughly even chance of either a continuation of the prior bearish trend or a consolidation phase. SHY (1-3 year maturities) also presented a Doji-like candle, with its open, low, and close all converged at the same level as the prior day’s close, and on decreased volume. This specific “Meeting Lines” doji pattern, following a bearish candle, conveys a low probability of an immediate strong directional move, suggesting prices are likely to consolidate in the very short term rather than initiate a decisive trend.
Considering these divergent behaviors, a generalized strong bullish reversal across the entire bond complex is unlikely at this juncture. While longer-duration bonds show signals of a potential short-term bounce, the lack of strong follow-through volume and the consolidation evident in shorter-duration instruments suggest underlying market uncertainty. There is a moderate probability that the longer-duration instruments may attempt to re-test the highs seen on November 14th, but a high probability that any such rally would be met with resistance without stronger accompanying volume. An alternative scenario, with a roughly even chance, is for the current consolidation and tentative recovery to fail, leading to a re-test of the November 14th lows, especially if market participants interpret the decreased reversal volume as weakness. The bond complex, as a whole, appears to be at a critical juncture, with short-term directionality still somewhat ambiguous.
Performance Heatmap (TLT, UTHY, IEF, IEI, SHY)
Generated for 2days timeframe analysis
Magnificent 7 & Friends
The daily performance of the selected equities reveals a notable divergence in investor sentiment across this specific subset of the market. The accompanying matrix details the daily percentage changes, sorted in descending order:
| Symbol | Daily Percent Change |
|---|---|
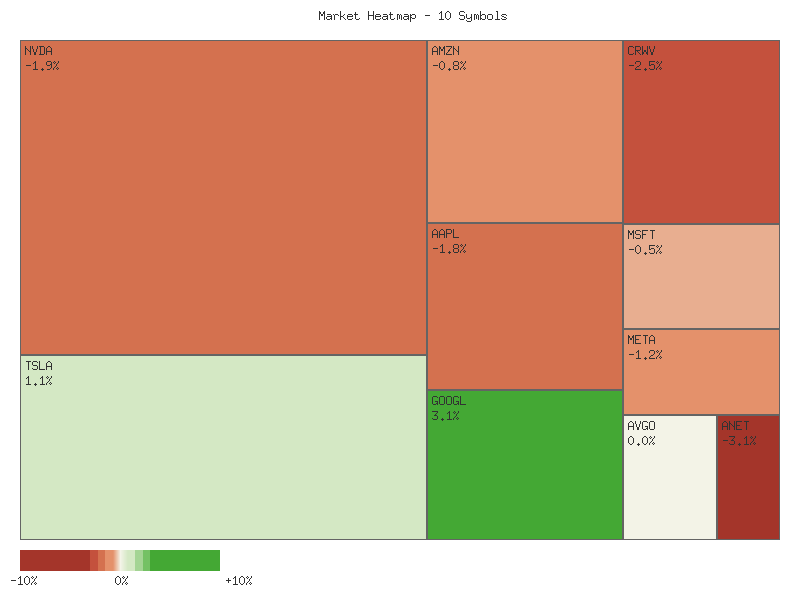
| GOOGL | 3.115% |
| TSLA | 1.130% |
| AVGO | 0.012% |
| MSFT | -0.527% |
| AMZN | -0.801% |
| META | -1.222% |
| AAPL | -1.849% |
| NVDA | -1.877% |
| CRWV | -2.528% |
| ANET | -3.114% |
Analysis of this snapshot indicates that a majority of the observed symbols experienced negative price action for the day, with seven out of ten closing lower. GOOGL exhibited significant relative strength, posting the strongest gain, which suggests particular buying interest or positive technical catalysts for this individual stock. Similarly, TSLA also closed with a positive daily change, indicating it likely attracted buyers, though to a lesser extent than GOOGL. AVGO registered a negligible positive change, suggesting a roughly even balance between buying and selling pressure.
Conversely, the declines were more widespread and, in some cases, substantial. ANET and CRWV showed the most pronounced weakness, with daily percentage changes exceeding -2.5%. This magnitude of decline suggests that selling pressure was highly likely concentrated in these two symbols for the day. Close behind were NVDA and AAPL, both experiencing declines approaching -2%, indicating a significant withdrawal of buying support or increased profit-taking. While MSFT, AMZN, and META also finished in negative territory, their declines were less severe compared to the aforementioned underperformers.
The collective performance points to a day characterized by selective strength amid broader weakness among these particular equities. The divergence between strong positive movers like GOOGL and significant decliners like ANET and CRWV suggests that idiosyncratic factors were likely at play rather than a uniform market-wide trend impacting these specific stocks. While it is likely that some of these negative movements represent profit-taking after previous gains, it is also a roughly even chance that some reflect new selling pressure, which could potentially persist in the short term for the most impacted symbols if no technical support levels are found. The overall breadth within this group is clearly negative, with a remote chance of this being indicative of broad-based market enthusiasm for the day.
As a Chartered Market Technician with over 15 years of experience, I’ve analyzed the provided 2-day market data across the specified equities. My assessment is strictly based on the technical price and volume action observed, with no external context considered.
Analysis of the provided 2-day candle data for selected equities indicates a predominantly cautious to bearish sentiment. While a few stocks exhibit strength, prevalent technical patterns suggest upward momentum faces significant resistance and has been decisively rejected in many instances. This collective price action points to sellers likely becoming more assertive, particularly after failed rallies. A near-term downside bias is probable for a majority of the observed instruments.
A notable contingent of stocks presented strong bearish reversal or continuation patterns. META demonstrated a likely bearish reversal with a significant drop on reduced volume after opening near Friday’s close. ANET similarly showed a highly likely bearish reversal, opening higher but collapsing significantly, reinforced by increased volume. AMZN and AAPL both displayed highly likely bearish continuation patterns; AMZN gapped down with increased volume, while AAPL formed a bearish candle after a gap down. NVDA also experienced a significant gap down; despite a small recovery, failure to fill the gap suggests likely continuation of downward pressure. CRWV closed lower on Monday with decreased volume after failing to sustain higher prices, implying bearish sentiment is likely to persist.
Amidst the general caution, TSLA stands out with robust bullish technicals. Despite opening with a gap down on Monday, buyers aggressively stepped in, pushing the price to a new high for the period and closing significantly above Friday’s close. This strong recovery and higher close suggest that bullish momentum is highly likely to continue for TSLA.
Several equities presented ambiguous signals. AVGO, after a strong Friday rally, saw Monday form a large upper shadow and close near Friday’s level despite new highs. This rejection of higher prices suggests a roughly even chance of consolidation or pullback. MSFT exhibited a strong Friday move, but Monday’s attempted rally was rejected, resulting in a bearish close with a long upper wick on reduced volume, indicating buying exhaustion and a roughly even chance of bearish reversal or consolidation. GOOGL’s pattern on Monday, with a large gap up followed by a bearish close and long upper shadow on significantly increased volume, presents conflicting signals. While the gap up signals initial bullish fervor, the bearish close on high volume makes continuation of the impulse improbable without further confirmation, hinting at potential buying exhaustion.
Considering the aggregate technical data, the near-term outlook for the broader group of stocks leans towards bearish or consolidating price action. While TSLA demonstrates clear bullish strength, a significant number of other prominent equities show signs of exhaustion, reversal, or continuation of bearish trends, often accompanied by volume cues. Traders should observe these developing patterns, recognizing that rejection of higher prices and bearish closes in several instances indicate that downside pressure is likely to be a dominant theme in the immediate future for most of these names.
Performance Heatmap (TSLA, MSFT, AAPL, META, NVDA, AVGO, GOOGL, AMZN, CRWV, ANET)
Generated for 2days timeframe analysis
S&P 500 Sector Breadth
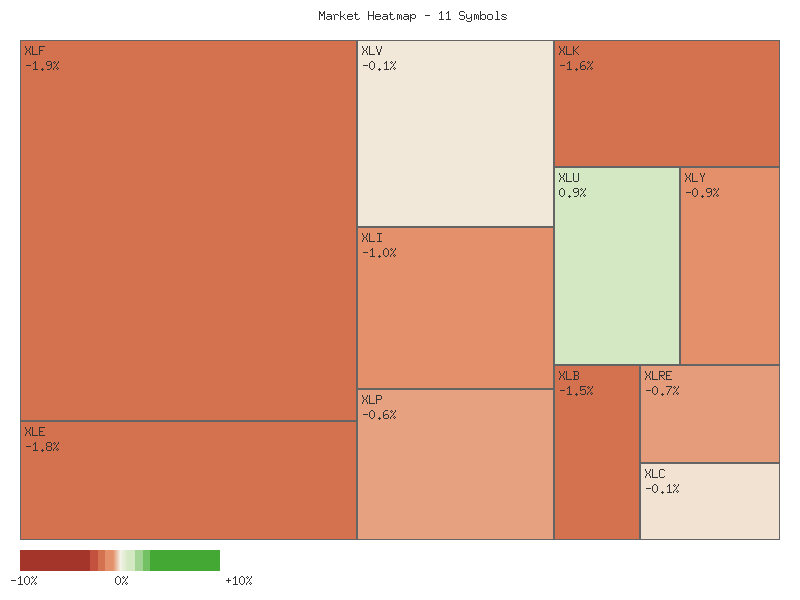
The daily sector performance data presents a generally weak market condition. Of the eleven S&P 500 sectors examined, only one, XLU (Utilities), registered an advance, while the remaining ten experienced declines. This overwhelming negative breadth, with only approximately 9% of sectors advancing, suggests a highly unfavorable day for broad market participation. The following matrix illustrates the performance of each sector:
| Symbol | Daily Percent Change |
|---|---|
| XLU | 0.888% |
| XLV | -0.087% |
| XLC | -0.130% |
| XLP | -0.621% |
| XLRE | -0.659% |
| XLY | -0.944% |
| XLI | -0.999% |
| XLB | -1.521% |
| XLK | -1.575% |
| XLE | -1.826% |
| XLF | -1.925% |
Examining defensive sectors, XLU (Utilities) was the sole advancer, gaining 0.888%. However, the other defensive sectors, XLP (Consumer Staples), XLRE (Real Estate), and XLV (Healthcare), all declined, with losses of -0.621%, -0.659%, and -0.087% respectively. This mixed performance within the defensive category makes a clear indication of a significant defensive rotation unlikely, as widespread capital flight to safety would typically manifest as advances across most, if not all, defensive sectors. Instead, the data suggests a more generalized selling pressure, even impacting some traditional havens.
Conversely, all identified offensive sectors—XLK (Technology), XLY (Consumer Discretionary), XLF (Financials), XLI (Industrials), XLB (Materials), and XLE (Energy)—experienced declines. XLF (Financials) and XLE (Energy) posted the most substantial losses, at -1.925% and -1.826% respectively, indicating considerable weakness in economically sensitive areas. XLC (Communication Services), though not explicitly categorized as offensive or defensive by the prompt, also declined by -0.130%, further contributing to the negative sentiment.
The overall market sentiment, based solely on this data, appears predominantly risk-off. The near-universal decline across both offensive and most defensive sectors, coupled with the significant drops in key growth-oriented sectors like XLF and XLE, suggests that investors were likely reducing exposure broadly. While XLU’s advance is notable, it is an isolated event within a broader context of selling, making a strong case for explicit sector rotation into defense improbable. An alternative scenario is simply an across-the-board de-risking event where the majority of assets experienced selling pressure, with only a very select few, such as Utilities in this instance, showing resilience.
Technical Market Commentary: Two-Day Sector Performance Analysis (November 14-17, 2025)
Our technical analysis of the provided two-day candle data across eleven SPDR sector ETFs indicates a prevalent shift towards bearish sentiment over the recent trading period, notably on November 17th. A majority of the surveyed sectors exhibited significant selling pressure or outright bearish reversals following the prior trading day. Volume analysis generally supports these price actions, with many downward movements accompanied by an increase in trading activity, suggesting conviction behind the selling.
Several key cyclical sectors displayed robust bearish reversal patterns on November 17th. XLI (Industrials), XLY (Consumer Discretionary), and XLE (Energy) each formed clear bearish engulfing patterns, with the second day’s open, high, low, and close entirely or significantly negating the prior day’s bullish candle. This action, particularly when combined with notably higher volumes in XLI, XLY, and XLE, likely indicates a strong and deliberate shift in momentum to the downside. Similarly, XLF (Financials) extended its downward move from the previous day, closing at a new two-day low on substantially increased volume, which suggests an acceleration of selling pressure.
Further contributing to the downside bias, XLB (Materials) showed a clear continuation of a downtrend with a lower high, lower low, and lower close on slightly increased volume, indicating persistent selling. XLRE (Real Estate) also executed a bearish engulfing pattern, closing below the previous day’s low; however, the accompanying decrease in volume on the second day implies that the conviction behind this specific reversal might be somewhat less robust compared to the higher-volume reversals seen elsewhere, though the price action is unequivocally bearish. XLP (Consumer Staples) edged lower on slightly increased volume, maintaining a mild downward bias but within a relatively tight range.
In contrast to the widespread bearishness, XLU (Utilities) stands out as the sole sector demonstrating clear bullish continuation. On November 17th, XLU posted a higher high, higher low, and higher close, supported by increased volume, which strongly suggests a continued uptrend in this traditionally defensive sector. Meanwhile, XLV (Healthcare) showed a mixed signal, opening lower but achieving a higher high before closing slightly lower than the prior day, on increased volume. This price action indicates indecision or profit-taking within a potential consolidation range. XLC (Communication Services) opened strongly but closed lower, near its daily low, on decreased volume, which implies that buying interest faded throughout the day despite an initial bullish attempt.
XLK (Technology), after a very strong bullish candle on November 14th, experienced a notable pullback on November 17th, closing significantly lower than the prior day’s close on slightly reduced volume. While this likely represents profit-taking or a “dark cloud cover” reversal, the close remained above the opening price of the first day, suggesting that the entirety of the prior gain was not surrendered. Considering the overall sector performance, the market likely faces a period of downward pressure, with a potential rotation into defensive sectors such as Utilities. There is a roughly even chance that the broader market could experience a deeper correction, given the strength and breadth of the bearish reversals in several key growth and cyclical sectors.
Performance Heatmap (XLP, XLRE, XLI, XLU, XLV, XLY, XLF, XLB, XLE, XLC, XLK)
Generated for 2days timeframe analysis
XLY vs XLP
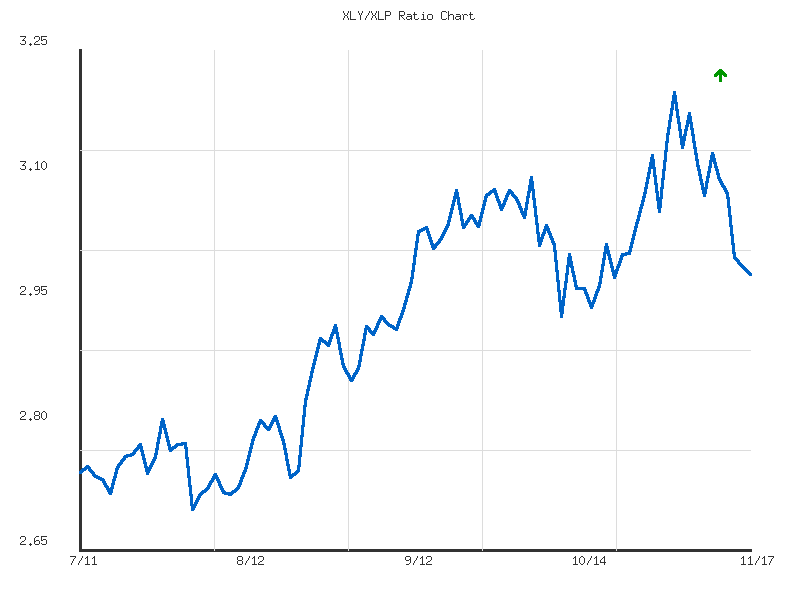
The RATIO:XLY/XLP has exhibited a moderate downtrend over the seven-day period, declining by approximately 3.12% from its peak. On November 10th, the ratio reached a high of 3.126, subsequently demonstrating a consistent decline to 2.979 by November 17th, which marks the lowest point within the observed dataset. This movement signifies a period where the Consumer Discretionary sector (XLY) has underperformed the Consumer Staples sector (XLP) on a relative basis.
A sustained decline in the XLY/XLP ratio is likely indicative of a shift in market sentiment, where investors are favoring defensive sectors (Consumer Staples) over growth-oriented or economically sensitive sectors (Consumer Discretionary). The “moderate” strength of this downtrend, coupled with the current ratio resting at the low for the period, suggests increasing investor caution. This pattern often emerges during phases of heightened uncertainty or perceived economic headwinds.
The momentum analysis reveals persistent downward pressure, with the ratio closing at its low for the seven-day period on November 17th. Given this strong negative momentum and the “relative_position” of 0 (indicating it’s at the lowest point), it is likely the ratio will continue to face downward pressure in the very near term. There is a roughly even chance that the ratio could attempt to establish new lows beyond the current observed range if this trend persists without interruption.
Considering alternative scenarios, while the prevailing technical evidence points to continued weakness, price action is not guaranteed. For the XLY/XLP ratio to reverse its current trajectory, a material shift in investor preference back towards Consumer Discretionary over Staples would be necessary. Based solely on the provided data, which shows consistent underperformance, a significant and immediate bullish reversal appears unlikely. Any potential bounce would first need to overcome the current negative momentum, which is not evident in the available information.
As a Chartered Market Technician with over 15 years of experience, I’ve analyzed the provided 90-day ratio data for XLY/XLP, focusing exclusively on the technical patterns and employing strict estimative language.
The XLY/XLP ratio over the past 90 days indicates a moderately strong upward trend, transitioning from a low of approximately 2.695 in early August to a peak near 3.20 in early November. This general ascent suggests a period where Consumer Discretionary (XLY) has largely outperformed Consumer Staples (XLP). The ratio has demonstrated a net gain of approximately 8.7% over the analyzed period, establishing a series of higher highs and higher lows, which is a characteristic pattern of an established uptrend. While the overall trajectory is positive, the movement has been punctuated by notable pullbacks, suggesting phases of profit-taking or sector rotation within the broader bullish bias. The current ratio of 2.979, observed on November 17th, remains above the 90-day average of 2.923, implying that the bullish sentiment, while recently challenged, has not fully dissipated.
Analysis of the ratio’s price action reveals several technical levels critical for future movements. Following an initial period of volatility in July, the ratio established a significant support base around the 2.70-2.72 region in early August before initiating its primary advance. As the uptrend progressed through August, the ratio encountered and subsequently broke through resistance around the 2.90 level. A more pronounced resistance zone became evident in early October near 3.08-3.10, leading to a sharp, albeit short-lived, decline. This was followed by a robust rally that ultimately culminated in the 90-day high of 3.199 on November 3rd. The current price action indicates a pullback from this peak, with the ratio now testing levels last seen in late September/early October, specifically the 2.95-3.00 range, which previously served as a consolidation area.
The recent price behavior, specifically the decline from the November 3rd high of 3.199 to the current level of 2.979, suggests a notable shift in short-term momentum. This correction of approximately 6.8% from the peak raises questions about the immediate continuation of the prior ascent. The ratio briefly dipped below its average of 2.923 on November 13th before recovering slightly. Such a significant pullback following a strong rally is not uncommon within an uptrend but warrants close monitoring. A sustained consolidation or further decline from current levels is likely in the near term as the market digests the prior gains. Should the ratio fail to hold the 2.90-2.95 area, further downside toward the early September support of 2.85-2.86 is possible.
Looking forward, two primary scenarios appear roughly equally likely based on the provided data. First, the current pullback may represent a healthy correction within the established uptrend. If the ratio can find strong support around the 2.90-2.95 region or potentially the 2.85-2.86 level, and then exhibit signs of renewed buying interest (e.g., forming a higher low), a resumption of the upward trend towards retesting the 3.10 resistance and potentially the 3.20 high is likely. Conversely, a sustained breakdown below the 2.85-2.86 support would invalidate the immediate bullish outlook and significantly increase the probability of a deeper correction. In this scenario, a test of the lower range of the 90-day period, perhaps towards the 2.70-2.75 area, would become likely, indicating a material shift in the relative strength of Consumer Discretionary versus Consumer Staples. Monitoring these key support levels will be crucial in determining the ratio’s next directional move.
Ratio Analysis: XLY/XLP
Generated for 90days timeframe analysis
Equity Breadth
Analysis of the SPXA50R data reveals a notable deterioration in the short-term market breadth of the S&P 500 over the observed 7-day period. Initially, the percentage of S&P 500 members trading above their 50-day moving average showed a modest increase, rising from 44.51% on November 7th to a peak of 51.40% by November 12th. This brief expansion indicated a period where slightly more than half of the index components were experiencing short-term uptrends. However, following this peak, a sharp and sustained decline ensued, with the indicator falling significantly to 36.60% by November 17th. This rapid decrease strongly suggests a broad-based breakdown of short-term uptrends across a substantial portion of the S&P 500 constituents. Such a pronounced drop likely indicates increasing selling pressure or a lack of buying conviction impacting a wide array of stocks.
Concurrently, the SPXA200R, representing the percentage of S&P 500 members trading above their 200-day moving average, also exhibited a similar pattern of initial strength followed by pronounced weakness. This long-term breadth indicator rose from 50.70% to a high of 56.80% over the initial four days. However, analogous to the SPXA50R, it then experienced a notable decline, concluding the period at 47.60%. The most critical development here is the movement of the SPXA200R below the 50% threshold on November 17th. This suggests that less than half of the S&P 500 members are now participating in long-term uptrends, which is likely to be interpreted by many technical analysts as a bearish signal for the index’s underlying health. The synchronized deterioration across both short-term and long-term breadth indicators lends credibility to the notion of weakening market momentum.
The coordinated downtrends in both the SPXA50R and SPXA200R strongly suggest that the S&P 500 is facing increasing internal weakness. The sharp reversal from modest breadth expansion to significant contraction, especially with the SPXA200R falling below 50%, likely indicates that the path of least resistance for the broader market is currently to the downside. The immediate outlook, based solely on this breadth data, points to a high probability of continued short-term pressure, as fewer stocks are maintaining their upward momentum. This trend in declining participation often precedes or accompanies downward movements in the major indices.
While the current breadth profile predominantly suggests further weakness, it is plausible that the rapid decline in these indicators could lead to an oversold condition in the immediate future, which might trigger a relief bounce. However, such a rebound would likely be temporary without a sustained improvement in market breadth, characterized by the SPXA50R moving convincingly back above 50%. Another scenario involves the market consolidating horizontally, which would be reflected by these indicators flattening out at current depressed levels before potentially resuming a trend. For a more bullish intermediate-term outlook to emerge, a significant and broad-based re-engagement of S&P 500 components in their respective uptrends, pushing both indicators higher, would be required. Absent such evidence, the present data renders a robust upside reversal less likely in the immediate term.
SPY Daily
Recent price action for SPY indicates a shift in short-term sentiment, transitioning from a robust uptrend to a period of pronounced weakness. Over the last seven trading days, after a couple of modest gains on November 10th and 11th, SPY experienced a significant decline. Notably, on November 13th, the price closed sharply lower, breaching the 50-day Exponential Moving Average (EMA_50_DAY) on elevated volume. Following a partial recovery attempt on November 14th, the latest trading day (November 17th) saw SPY close at 665.66, below its open of 669.70, further reinforcing the selling pressure. This last candle, a bearish close on above-average volume (82.7M), suggests that sellers are asserting control in the immediate term. The Relative Strength Index (RSI_14_DAY) has concurrently fallen from approximately 59 to 43.01 over the last week, moving firmly below the 50-level. This decline in RSI signals a strong shift in short-term momentum from bullish to bearish, implying that the asset is not yet in oversold territory and could experience further downward pressure.
Despite the recent weakness, the broader 90-day technical picture still suggests a longer-term uptrend. The EMA_50_DAY (currently 666.63) remains well above the EMA_200_DAY (currently 624.92), with both moving averages exhibiting an upward slope, indicating a prevalent bullish bias over the medium to long term. However, the EMA_50_DAY has now transitioned into a clear immediate resistance level, with SPY failing to maintain price above it on November 14th and closing below it on November 17th. Looking for support, the previous low established on October 10th at 653.02 is a significant level to monitor. Additionally, a more immediate, albeit weaker, support zone likely exists around the 658-660 range, based on prior consolidation areas in late September and mid-October. The overhead resistance immediately above the current price is the recently breached EMA_50_DAY, followed by the trading range highs of 688-689 observed in late October.
Considering alternative scenarios, a bearish continuation is probable in the near term, given the recent breakdown below the EMA_50_DAY, declining RSI, and elevated selling volume. A retest of the 658-660 support zone, and subsequently the 653.02 level, is likely. For a bullish reversal, SPY would need to reclaim the EMA_50_DAY with conviction, perhaps establishing a higher low around current levels or finding strong support at 653.02, which could form a double bottom pattern. This scenario is currently less probable but remains possible if buying interest re-emerges decisively. A neutral scenario presents a roughly even chance, where SPY could enter a consolidation phase between the current price and the 658-660 support zone, allowing the RSI to stabilize or potentially bounce from its current level without a strong trend immediately forming. Technically, sentiment drivers appear to be dominated by a shift from broad market optimism to short-term caution, influenced by the momentum indicators and volume confirming increased selling pressure. The failure to hold recent gains and the breach of a key short-term moving average suggest that the immediate collective investor psychology leans towards risk-off positioning.
Market Commentary: SPY Technical Analysis (July – November 2025)
The SPY exchange-traded fund has exhibited a prominent upward trajectory over the 90-day period under review, initially advancing from approximately in mid-July 2025 to achieve a significant peak near .70 by late October. This sustained bullish price action was characterized by a series of higher highs and higher lows through much of August, September, and October. While volume frequently accompanied these upward movements, some of the most substantial volume spikes occurred during periods of notable price declines, such as the sharp drop experienced on August 1st and October 10th. The most recent price action, however, indicates a material shift, with SPY experiencing a discernible pullback from its late October peak, retreating to approximately by November 17th.
Analysis of the 14-day Relative Strength Index (RSI) provided notable insights into market momentum during this period. Throughout July, September, and late October, the RSI frequently entered overbought territory, recording values well above 70 (e.g., 75.58 on July 25th, 73.70 on September 22nd, and 69.71 on October 29th). Historically, such extended periods above 70 can precede short-term price corrections or a deceleration in bullish momentum. Indeed, the sharp price decline on October 10th, from near to , was accompanied by a rapid drop in RSI from 65.75 to 41.81, underscoring the potential for swift reversals in momentum from elevated levels.
Currently, the RSI is positioned at approximately 43.019 (as of November 17th). This reading is below the 50-level, which typically suggests that momentum has shifted to favor sellers over buyers in the near term. The trajectory of the RSI since late October, moving from near 70 down to its current level, provides a technical indication of potentially waning bullish momentum. A continued decline in the RSI, especially if it were to approach the oversold threshold of 30, would likely signal a higher probability of further price weakness for SPY, as bearish pressure appears to be accumulating.
Considering the recent price pullback from the late October highs and the declining RSI, it is likely that SPY will experience continued bearish pressure in the immediate term. The stock has broken below recent short-term support levels, and the momentum indicators suggest further downside is possible before a more significant bounce. An alternative scenario, however, presents a roughly even chance of SPY finding near-term support around the - range, potentially leading to a consolidation or a modest rebound if buying interest emerges. Sustained closes below this range would highly likely suggest an extension of the current corrective phase. It is important to note that the requested MACD (13,21-day) indicator data was not provided in the market data for analysis, therefore, its signals could not be incorporated into this assessment.