Daily Market Technical Analysis
Market indices exhibited mixed performance, with large-cap benchmarks like SPY and QQQ showing strong intraday reversals on November 14th, though overall market breadth indicators suggest short-term internal health is deteriorating. SPY faces a roughly even chance of near-term stabilization or further correction, while QQQ and small-caps (IWM) are likely to experience continued downward pressure. In commodities, precious metals are likely to face sustained selling pressure, contrasting sharply with energy (Crude and Gasoline) which is highly likely to see further upside. Most Treasury bonds, particularly longer durations, are likely to continue price declines, though short-duration bonds show relative stability. Within the Magnificent 7, MSFT and NVDA are highly likely to see short-term bullish reversals, while AMZN and GOOGL are likely to maintain bearish pressure. Overall S&P 500 equity breadth suggests continued short-term market pressure is more probable.
Market Indices
| Symbol | Daily Percent Change |
|---|---|
| IWM | 0.308% |
| QQQ | 0.072% |
| OEF | -0.009% |
| SPY | -0.016% |
| IJR | -0.085% |
| MDY | -0.196% |
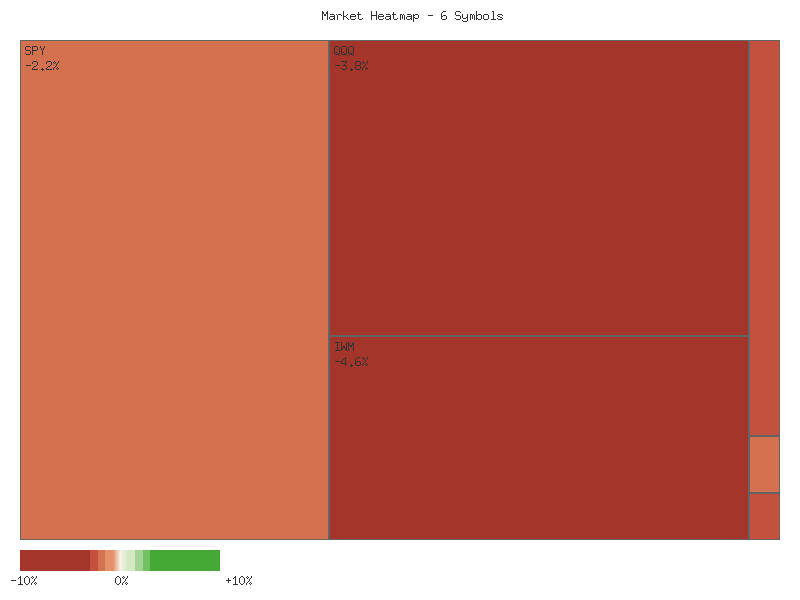
Analysis of the provided daily percentage change data reveals a market characterized by mixed performance and somewhat weak breadth. Of the six analyzed broad market ETFs, two advanced while four declined on the observed day. This configuration suggests a market exhibiting selective strength rather than a broad-based upward momentum. Specifically, small-cap (IWM) and large-cap growth/tech (QQQ) sectors posted gains, whereas other large-cap (OEF, SPY) and particularly mid-cap (MDY) and another small-cap index (IJR) experienced declines. It is likely that internal market dynamics, rather than a strong overarching trend, are dictating price action.
Examining the performance hierarchy, the Russell 2000 (IWM) emerged as the strongest performer with a notable gain of 0.308%, indicating strength within a segment of the small-cap universe. The Nasdaq 100 (QQQ) also registered a positive, albeit modest, gain of 0.072%, suggesting resilience in the technology and growth-oriented large-cap segments. Conversely, the S&P MidCap 400 (MDY) recorded the most significant decline at -0.196%, pointing to potential weakness in the mid-capitalization space. The S&P SmallCap 600 (IJR) also declined by -0.085%, creating a divergence within the small-cap segment, where IWM showed strength while IJR weakened. This divergence is noteworthy and suggests specific constituent or sector performance differences between the two small-cap indices.
The broader market indicators, represented by the S&P 100 (OEF) and the S&P 500 (SPY), experienced marginal declines of -0.009% and -0.016% respectively. The very small magnitude of these movements suggests a roughly even chance that these indices were effectively flat, implying a period of consolidation or very low volatility for the largest market capitalization segments. However, the fact that these broad indices, which typically represent the overall market, closed lower alongside two of the other four declining issues implies that the prevailing sentiment was not broadly bullish.
Given the negative breadth (4 declining symbols vs. 2 advancing symbols), it is unlikely that the observed session reflects strong underlying market demand. Instead, the market is likely experiencing a period of selective engagement, with capital flowing into specific areas like IWM and QQQ while other segments face modest selling pressure or disinterest. An alternative scenario considers that the very small declines in OEF and SPY could be statistical noise, and if combined with QQQ’s slight gain, large-cap performance was broadly neutral. However, the significant weakness in MDY and IJR, alongside the prevailing negative breadth, supports the view of a market lacking broad conviction, with a tilt towards minor downside for the broader market in the immediate term.
Market Commentary: Two-Day Technical Snapshot
The provided two-day market data across key exchange-traded funds (ETFs) – SPY, QQQ, IWM, IJR, MDY, and OEF – reveals a consistent pattern of initial bearish sentiment followed by a notable intraday reversal attempt. On November 13th, all observed indices experienced significant selling pressure, closing near their daily lows with notable red candles. This broad-based decline suggested a widespread bearish impulse, particularly pronounced in QQQ and IWM with substantial percentage drops. Volume for SPY and QQQ was high on this day, indicating strong conviction behind the downward move.
The subsequent trading day, November 14th, initiated with continued weakness as all ETFs opened considerably lower than their prior day’s closes. However, a significant reversal unfolded during this session, with each ETF rallying substantially from its intraday lows to form candles characterized by long lower shadows. This strong intraday recovery suggests a likely rejection of lower price levels and the emergence of buying interest. Specifically, QQQ closed above its previous day’s close on increased volume, forming a bullish piercing pattern or a near-engulfing signal, which is a strong indication of a potential short-term bullish shift. SPY mirrored this strength by closing effectively flat with its Day 1 close, also on increased volume. OEF demonstrated a similar recovery, closing marginally below its prior day’s close but on significantly higher volume, which typically lends credibility to the bullish bounce.
While the larger-cap and tech-heavy indices (SPY, QQQ, OEF) presented stronger potential bullish reversal signals, a degree of divergence is evident within the broader market. IWM, the Russell 2000 ETF, also closed above its Day 1 close, suggesting a bullish reversal; however, this occurred on slightly decreased volume, which introduces a minor caveat to the strength of the move. Conversely, IJR (S&P SmallCap 600) and MDY (S&P MidCap 400) closed below their respective Day 1 closing prices, despite their significant intraday rallies. Furthermore, both IJR and MDY saw decreased volume on their recovery day. This suggests that while there was an attempt to recover, the buying conviction in the mid-cap and small-cap segments was less robust than in their larger counterparts, making the sustainability of their recovery less certain.
Considering these patterns, it is likely that the market, particularly the large-cap dominated segments, will experience an attempt at consolidation or a retest of higher prices in the immediate future. The robust intraday recoveries, strong lower shadows, and higher closes (or effectively flat closes) for SPY, QQQ, and OEF, especially with supporting volume for SPY, QQQ, and OEF, point to a short-term shift in momentum. However, the weaker closing positions and declining volume for IJR and MDY imply that a comprehensive, broad-market bullish reversal with high conviction is less certain. There is roughly an even chance that these smaller-cap indices might continue to lag, potentially facing resistance or experiencing slower upward progress, which could moderate overall market enthusiasm. Traders should observe subsequent price action closely to confirm these nascent reversal patterns and assess their broader market impact.
Performance Heatmap (SPY, QQQ, IWM, IJR, MDY, OEF)
Generated for 2days timeframe analysis
SPY Technical Analysis: 90-Day Outlook and Current Momentum Assessment
Over the past 90 days, SPY has generally exhibited an upward trend, characterized by periods of strong bullish momentum punctuated by several significant, albeit short-lived, pullbacks. Price movements in July showed a robust ascent, which propelled the 14-day Relative Strength Index (RSI) into overbought territory, peaking at 75.58 on 2025-07-25. This was followed by a sharp correction in early August, with price declining and RSI dropping dramatically to 47.66 by 2025-08-01, accompanied by notably elevated volume, suggesting strong selling pressure. Subsequent periods in September and early October saw similar patterns; price rallies pushed RSI above 70, reaching 73.70 on 2025-09-22 and 71.17 on 2025-10-06. Each of these excursions into overbought conditions was closely followed by price consolidation or a pullback, validating the traditional interpretation of the RSI as a momentum oscillator identifying potential exhaustion points in the prevailing trend.
The most pronounced market event within this 90-day period occurred on 2025-10-10, when SPY experienced a significant price decline, closing at 653.02, down from 671.16 the previous day. This aggressive selling was conducted on the highest recorded volume for the period, reaching 156.6 million shares, and pushed the RSI into near-oversold territory at 41.81. This strong reaction from an overbought state (RSI was 65.75 on 2025-10-09) reinforces the indicator’s utility in signaling potential trend shifts or deep corrections. Following this sharp drop, SPY demonstrated a resilient recovery, climbing to new highs in late October, with closing values reaching approximately 687. This recovery, however, was not sustained into the current month of November.
Entering November, SPY initiated another pullback from its late October highs. The RSI, which had climbed back to nearly 70 (69.71 on 2025-10-29), quickly retreated, registering values in the high 40s to low 50s. The recent trading days, specifically 2025-11-13 and 2025-11-14, have seen significant selling volume (89.8 million and 91.5 million shares, respectively) pushing prices lower. On 2025-11-13, SPY closed significantly down at 672.05, with RSI at 48.27. The 2025-11-14 candle is particularly notable; while opening much lower at 665.38, it formed a relatively long lower wick and closed near the prior day’s close at 671.94. The RSI for this date stands at 48.179. This pattern, combined with the current RSI level hovering near the mid-point of its range but with recent downward momentum, suggests that while selling pressure remains significant, there is a moderate probability of buying interest emerging around these levels.
Our analysis suggests that SPY is currently in a phase of consolidation or minor correction after the late October peak. The RSI’s proximity to the 40-50 range, historically a level from which bounces have occurred within this dataset, indicates a roughly even chance of either a near-term stabilization or a further test of lower support. A notable possibility exists for SPY to find support around the 660-665 price range, given the buying interest observed via the lower wick on 2025-11-14 and prior price action in September and early October. However, a sustained break below the 2025-11-14 low (663.265) would likely lead to a further descent, with the 2025-10-10 low of 653.02 serving as the next critical support target. Conversely, a sustained move above the 675-680 range, accompanied by an increase in RSI, would suggest a resumption of the broader upward trend. It is important to note that MACD data was not provided for this analysis, limiting the breadth of momentum confirmation.
SPY Price & Indicators (RSI_14_DAY, MACD_13_21_DAY)
Market Commentary: QQQ Technical Analysis (90-Day View)
Over the past 90 days, the Invesco QQQ Trust (QQQ) has demonstrated a pronounced uptrend, marked by significant rallies and intermittent, yet often sharp, pullbacks. Price action indicates robust bullish momentum for much of this period, with QQQ reaching new highs on several occasions. It is crucial to note that while the analysis was requested for both RSI and MACD, the provided data exclusively includes RSI and candle information. Therefore, a comprehensive MACD analysis cannot be conducted, which limits the breadth of our momentum assessment.
The 14-day Relative Strength Index (RSI) frequently signaled overbought conditions (above 70) during periods of strong upward price movement. Instances such as July 28th (RSI 73.11), September 22nd (RSI 75.35), October 2nd (RSI 71.57), and October 29th (RSI 71.73) saw the RSI breach the 70 threshold. In nearly all these cases, the overbought readings were followed within a few days by a cooling-off period or a price pullback, suggesting that the RSI acted as a fairly reliable indicator of short-term exhaustion during this timeframe. Notably, the sharp drop in RSI on October 10th to 45.42, following an overbought reading earlier in the month, coincided with a significant price decline, underscoring the indicator’s sensitivity to momentum shifts.
The price action from late October to mid-November warrants close attention. QQQ peaked around October 29th at a close of 635.77, corresponding with an RSI reading of 71.73, signaling an overextended condition. Following this peak, QQQ entered a notable downtrend, declining to 608.81 by November 14th. This pullback was accompanied by consistently elevated trading volumes, particularly on October 30th (60.6M), October 31st (66.1M), November 6th (68.7M), November 7th (78.4M), November 13th (67.3M), and November 14th (76.8M). Sustained high volume during a price decline is often indicative of increasing selling pressure or distribution, suggesting that the bears are gaining control. The RSI concurrently descended from overbought territory, settling at 46.63 on November 14th, which is well within neutral range and not yet signaling oversold conditions.
Considering the recent bearish price action, characterized by significant declines on elevated volume, and the RSI’s descent from overbought levels into neutral territory, it is likely that QQQ will experience further downside pressure or a period of consolidation in the near term. The current RSI level suggests there is ample room for the price to fall before reaching traditional oversold levels (below 30), which might typically prompt a rebound. An alternative scenario is possible where QQQ finds immediate support and attempts a bounce; however, given the recent surge in selling volume and the absence of any compelling bullish RSI divergence, a sustained reversal to the upside appears unlikely at this juncture. Traders should probably anticipate continued volatility and monitor for signs of price stabilization or a re-entry of bullish momentum.
QQQ Price & Indicators (RSI_14_DAY, MACD_13_21_DAY)
IWM Technical Analysis: November 14, 2025
The IWM technical data over the past 90 days reveals a significant shift in market dynamics, transitioning from a robust uptrend to exhibiting clear signs of waning momentum and a potential bearish reversal. From early August, following a low around .92 on August 1st, IWM initiated a strong rally, punctuated by a notable surge in mid-August. This bullish phase culminated in a price peak of approximately .84 on September 18th, coinciding with the 14-day Relative Strength Index (RSI) reaching an overbought reading of 71.23. Such an elevated RSI reading typically signals a short-term exhaustion of buying power. Subsequent price action saw IWM push to a higher high of .33 on October 15th. However, this new price peak was not confirmed by the RSI, which registered a lower high of approximately 62.99. This distinct bearish divergence, where price makes a higher high but the oscillator makes a lower high, critically suggests a weakening of the underlying bullish momentum and often precedes a significant trend reversal.
The period following the October 15th high has been characterized by increasing selling pressure. A sharp price rejection on October 10th, marked by a substantial intraday drop on exceptionally high volume (nearly 70 million shares), pre-dated the final price high and signaled early signs of distribution. More recently, the price action from late October into November has reinforced this bearish sentiment. IWM has exhibited a consistent downward bias since October 27th, breaching multiple potential support levels. The most recent significant decline occurred on November 13th, where the price fell from .255 to .78 on exceptionally heavy volume (approximately 63.7 million shares). This high-volume breakdown strongly corroborates increasing bearish control. Concurrently, the 14-day RSI has consistently trended lower from its mid-October levels, currently resting at 41.36 as of November 14th, which is well below neutral and approaching oversold conditions, reflecting prevailing bearish sentiment.
Based on these technical patterns, we assess it is likely that IWM will continue to face downward pressure in the near term. The current price level around .51 (November 14th close) is situated significantly below the recent highs, and the strong momentum indicated by the November 13th volume spike suggests further declines are probable. We identify the August 1st low of .92 as a potential long-term support level should the bearish trend persist. Conversely, for a bullish reversal to gain traction, IWM would need to demonstrate a decisive move above the recent November 5th high of .72, accompanied by a notable increase in buying volume and a sustained recovery in the RSI. It is important to acknowledge that the requested MACD (13/21 day) indicator data was not provided; therefore, this analysis is confined solely to the available price and RSI data, limiting a full assessment of momentum confirmation.
IWM Price & Indicators (RSI_14_DAY, MACD_13_21_DAY)
VIX Fear Index
The VIX demonstrated a period of declining volatility, reaching a low of 17.10 on November 12, following several days of bearish price action. However, this trend was decisively interrupted by a strong bullish reversal. The VIX then saw a significant upward surge, with the November 13 candle closing strongly near its high at 20.37, fully recovering much of the earlier decline.
On November 14, the VIX opened higher at 21.33 and proceeded to test higher levels, reaching a peak of 23.03. However, subsequent selling pressure emerged, causing the VIX to close lower at 20.07, representing a daily percentage change of -1.47%. The resulting candle features a long upper wick, which typically suggests that sellers gained control after prices reached their intraday highs, indicating rejection at those elevated levels.
This recent price action indicates that the VIX is grappling with resistance near the 23.03 level. The strong rejection observed on November 14, marked by the long upper wick, makes a further immediate push higher less likely. A period of consolidation or a retracement from the current levels is probable in the short term, as the market digests the recent volatility surge and the failure to sustain the intraday high.
Considering alternative scenarios, should the VIX manage to overcome and sustain a break above the 23.03 level, it would likely signal a significant increase in market uncertainty and an probable acceleration in volatility. Conversely, a sustained decline below the 19.56 low of the November 14 candle would probably suggest a waning of immediate volatility concerns, as this would indicate a breakdown below a recent intraday support level. The provided volume data offers no basis for analysis.
Technical Analysis of VIX (90-Day Overview)
The VIX experienced a period of fluctuating volatility over the past 90 days, largely characterized by consolidation phases punctuated by significant upward spikes, followed by pullbacks. From early July through late September, the VIX largely traded within a range, frequently encountering resistance around the 17.00-17.50 level and finding support in the 14.00-14.50 zone. Notable upward price movements occurred in early August, peaking at 21.90, and a more substantial spike in mid-October reaching an intraday high of 28.99, although it closed considerably lower at 20.78, suggesting significant selling pressure near the high. This pattern indicates that while VIX tends to revert to lower levels after spikes, the peaks themselves are becoming more pronounced over the observation period, with the recent highs approaching or exceeding prior levels. The current price action indicates a re-energized upward momentum in the most recent trading sessions.
The 14-day Relative Strength Index (RSI) largely corroborated the price action. During the early July to late September consolidation, the RSI primarily oscillated between 40 and 60, reflecting balanced momentum without significant overbought or oversold conditions. The VIX spike on August 1st saw the RSI rise to 65.38, indicating strong buying pressure but not quite reaching traditional overbought thresholds (above 70). However, the substantial VIX spike on October 10th pushed the RSI well into overbought territory at 73.09, which predictably coincided with a subsequent VIX pullback. Importantly, the RSI has not registered any deeply oversold readings (below 30) within the observed 90-day period, with its lowest point being approximately 37 in late July, suggesting that selling pressure has not reached extreme exhaustion.
In the most recent trading days, the VIX has shown renewed upward strength. Following the October 10th spike and subsequent retreat, the VIX stabilized before initiating another ascent. On November 13th, the VIX surged from 17.61 to 20.37, continuing on November 14th with an intraday high of 23.03 before closing at 20.07. The RSI for these recent sessions registered 59.75 and 58.39, respectively. While these values reflect increasing upward momentum, they have not yet reached the extreme overbought level observed on October 10th (RSI 73.09) despite price levels nearing those previous peaks. This divergence in momentum could suggest that while the VIX is spiking, the internal strength of this current move is, for the moment, less exuberant than the October peak, indicating a roughly even chance of either a continued ascent to retest higher resistance around 22-23, or a near-term pullback should momentum wane.
It is important to note that the requested MACD (13-21 day) indicator data was not provided within the market data for analysis. Therefore, no conclusions regarding momentum crossovers or divergences from the MACD can be drawn in this assessment. All analysis is strictly based on the VIX candle data and the 14-day RSI as provided.
VIX Price & Indicators (RSI_14_DAY, MACD_13_21_DAY)
Tech Sector Analysis
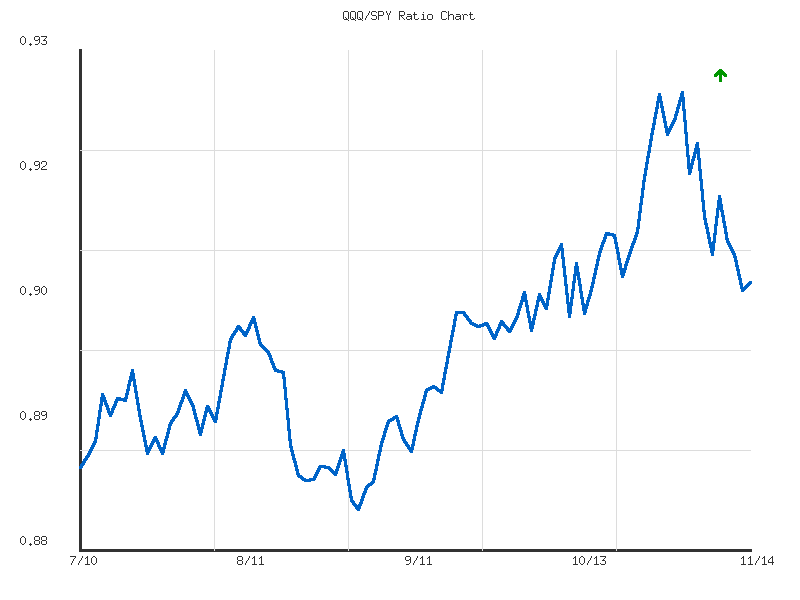
The RATIO:QQQ/SPY over the past 14 days, from October 28th to November 14th, 2025, reveals a distinct period of underperformance for the NASDAQ-100 (QQQ) relative to the broader S&P 500 (SPY). The ratio began at approximately 0.9212 and concluded at 0.9060, marking a net decline of 1.64%. This downward movement is technically characterized as a “weak” downtrend. Throughout this observation period, the ratio peaked at 0.9250 on November 3rd, while registering its lowest point at 0.9052 on November 13th.
Following its peak, the QQQ/SPY ratio has consistently trended lower, breaching its 14-day average of 0.9155. The most significant downward pressure appears to have occurred in the latter half of the period, particularly from November 6th through November 13th, where the ratio experienced a sequence of lower highs and lower lows, ultimately reaching its 14-day trough. At the most recent data point, the ratio of 0.9060 resides near the lower boundary of its observed range, indicating QQQ’s relative weakness against the S&P 500 has largely persisted over the past fortnight.
The sustained downtrend in the QQQ/SPY ratio suggests that market participants have, over this specific 14-day interval, favored the broader market represented by the S&P 500 over the technology and growth-heavy NASDAQ-100. This pattern often implies a sector rotation away from high-growth assets or a preference for more diversified or value-oriented segments within the market. Given the current ratio’s proximity to its 14-day low, we judge it is likely that QQQ’s relative underperformance against SPY will continue in the immediate term, barring the emergence of a significant catalyst to re-energize technology sector leadership. A decisive move below the 0.9052 support level would provide further technical confirmation of a continued downtrend in relative strength.
Nevertheless, the classification of this downtrend as “weak” suggests that while the direction is evident, the conviction or momentum behind this shift may not be overwhelmingly strong. There is roughly an even chance that the ratio could find short-term support around the 0.9052 level and attempt to stabilize or experience a modest bounce, especially given its current position at the lower extreme of the observed range. The notably low volatility exhibited by the ratio, quantified at 0.0000449, implies that this decline has been relatively orderly rather than sharp or impulsive, which could either precede a more substantial continuation of the trend or suggest a lack of aggressive selling pressure on QQQ relative to SPY.
QQQ/SPY Ratio Analysis: Technical Commentary (90-Day View)
The QQQ/SPY relative strength ratio, tracking QQQ’s performance against SPY over the past 90 days, has exhibited an upward trend, indicating that QQQ has generally outperformed SPY during this period. The overall change for the period stands at approximately 2.08%. However, the provided technical data assesses the strength of this upward trend as “weak.” The ratio has oscillated between a low of 0.8834 and a high of 0.9250, with the current ratio settling at 0.9060, positioning it slightly above the 90-day average of 0.8997. The relatively low volatility figure suggests that daily fluctuations in the ratio have been somewhat contained, contributing to the “weak” overall trend strength as momentum has not been consistently robust.
A closer examination of the recent price action indicates a probable short-term shift in the ratio’s trajectory. Following a peak at 0.9250 on 2025-11-03, the QQQ/SPY ratio has experienced a noticeable decline, retracting to 0.9060 by 2025-11-14. This roughly 2% pullback from the recent high signals a loss of immediate relative strength for QQQ compared to SPY. This significant retracement from the peak is consistent with the broader assessment of a “weak” upward trend strength, as the ratio has failed to sustain its highest levels, suggesting underlying pressure or profit-taking against the outperformance of QQQ.
From a technical perspective, the recent peak at 0.9250 now functions as a probable short-term resistance level for the ratio. Conversely, initial support is likely to be found around the average ratio of 0.8997. Should the current selling pressure persist, a test of the prior consolidation zone, roughly between 0.8834 (the 90-day low) and 0.890, becomes increasingly probable. This zone has historically demonstrated its capacity to act as a floor for the ratio, particularly during late August and early September. A break below the 0.8997 average would increase the probability of further short-term weakness towards these lower support levels.
Considering alternative scenarios, the current pullback could also represent a period of consolidation before a potential resumption of the upward trend. However, given the “weak” trend strength identified in the data and the extent of the recent retracement, a vigorous, immediate resumption of strong upward momentum is currently improbable without additional technical evidence of buying conviction. If the ratio were to stabilize around the 0.900-0.905 region and subsequently exhibit clear signs of an upward reversal, such as sustained higher daily closes, a retest of the 0.9250 resistance would then become more likely. For now, a roughly even chance exists for either continued short-term weakness towards the 0.890 support area or a period of lateral movement, as the market endeavors to establish its next directional bias for the QQQ/SPY relative performance. Traders are advised to monitor for price action confirmation around these identified levels.
Ratio Analysis: QQQ/SPY
Generated for 90days timeframe analysis
IWM vs. SPY
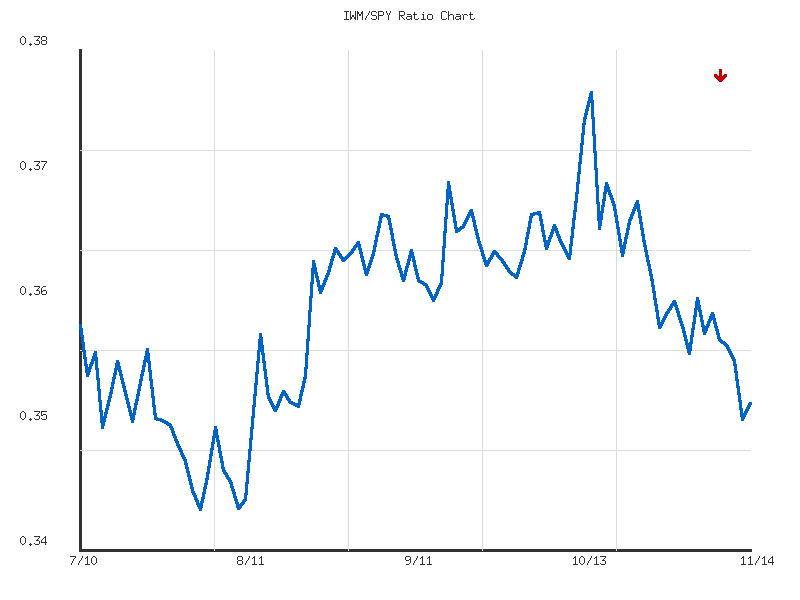
The IWM/SPY 14-day relative performance ratio indicates a discernible downtrend, with the Russell 2000 (IWM) showing underperformance against the S&P 500 (SPY) over the period spanning October 28 to November 14, 2025. The ratio commenced at approximately 0.3623 and concluded near 0.3535, marking a 2.45% decline. This sustained downward movement suggests that capital is likely rotating out of smaller-cap assets into larger-cap segments, or at least that smaller-caps are experiencing less demand relative to their larger counterparts. The volatility of this ratio over the 14 days appears minimal, suggesting a relatively orderly and persistent shift rather than erratic movements.
The overall trend strength is characterized as “weak” despite the consistent decline. This characterization probably refers to the rate of change rather than the consistency of the direction. The current ratio of 0.353469 is positioned near the lower end of its 14-day range, specifically at approximately 11.4% above the absolute low of 0.352324 observed on November 13. The fact that the ratio is closing near its multi-day low suggests continued relative weakness is more probable than not in the immediate short term, absent any contradictory technical signals.
Considering alternative scenarios, while the current data points to ongoing IWM underperformance, a slight rebound from the 14-day low is a roughly even chance given the “weak” trend strength might imply less conviction behind the selling pressure, potentially leading to consolidation rather than an accelerated decline. However, without evidence of specific reversal patterns—such as a series of higher lows or a significant surge in the ratio’s value from its trough—a sustained recovery in IWM’s relative strength against SPY in the immediate outlook is unlikely based solely on the provided data. Investors should probably anticipate the observed underperformance to persist or consolidate at current levels in the very near term.
Technical Analysis: IWM/SPY Ratio (90-Day Performance)
The IWM/SPY ratio, which measures the relative performance of the Russell 2000 (small-caps) against the S&P 500 (large-caps), has exhibited a significant shift in trend over the past 90 days. Initially, the ratio experienced a decline from 0.3592 in early July to a 90-day low of 0.3456 by August 1st. This period indicated a strong outperformance by large-cap stocks. Following this trough, the ratio staged a notable recovery and rally, culminating in a 90-day high of 0.3763 on October 15th, suggesting a temporary period of small-cap strength. However, the overarching trend identified for the entire 90-day period is described as “down” with “weak” strength, likely reflecting the net change despite interim rallies.
Since peaking on October 15th, the ratio has entered a distinct and sustained downtrend. From its high of 0.3763, the IWM/SPY ratio has consistently declined, breaking below its 90-day average of 0.3599 around early November and currently rests at 0.3534 as of November 14th. This position, residing in the lower quartile of its 90-day range (relative position 0.2538), strongly implies that large-cap stocks are once again exhibiting outperformance compared to small-cap counterparts. The momentum over the last month appears decidedly negative for the ratio, suggesting that the preference for larger capitalization equities is prevailing.
From a technical perspective, the 90-day high of 0.3763 established on October 15th now represents a significant resistance level. On the downside, potential support zones are identifiable from prior trading action. The ratio found support around the 0.350-0.352 area in late July and early August, which may offer an initial level of consolidation. A more robust support level exists at the 90-day low of 0.3456, reached on August 1st. Given the consistent downward trajectory since mid-October, a further decline in the IWM/SPY ratio is likely in the near term, potentially challenging these identified support levels. A break below the 0.350 level would imply increased bearish momentum.
Considering alternative scenarios, a meaningful reversal of this downtrend appears unlikely without a clear technical catalyst, such as a strong consolidation pattern or a convincing breach of a short-term resistance. While a short-term bounce is always possible, a sustained return to the levels seen in mid-October is unlikely to occur without a fundamental shift in the market’s preference for small-cap relative to large-cap equities. Traders should monitor the 0.350-0.352 support zone; a failure to hold this area would reinforce the expectation of continued IWM underperformance relative to SPY. Conversely, a prolonged hold and subsequent rally above the 90-day average of 0.3599 could suggest a roughly even chance of the trend neutralizing or shifting, but such a development is not currently indicated by the prevailing technical patterns.
Ratio Analysis: IWM/SPY
Generated for 90days timeframe analysis
Commodities
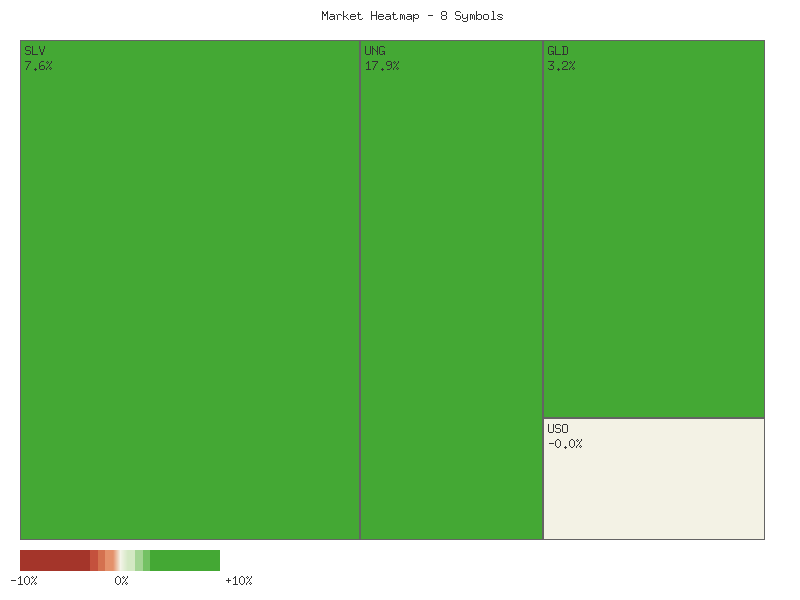
The daily performance of the selected commodity-related ETFs presents a mixed picture, suggesting a lack of broad directional conviction across the commodity complex for the observed period. The provided data reveals four advancing symbols and four declining symbols, indicating a roughly even chance of upward or downward movement for any given component within this specific basket. This 50/50 split in market breadth implies that the commodity market, as represented by these instruments, probably lacks a unifying bullish or bearish impetus on this particular day. The range of daily percentage changes, from a high of 2.424% to a low of -3.099%, further underscores the divergence in performance.
The strongest performances were observed in the energy sector components. UGA (Gasoline) led the advances with a 2.424% gain, closely followed by USO (Crude Oil) which rose by 2.103%. These movements suggest probable short-term strength within the refined and crude oil markets. Additionally, CPER (Copper) posted a modest gain of 0.240%, and DBC (a broad commodity index ETF) advanced by 0.153%. The gains in CPER might indicate slight positive sentiment for industrial metals, while DBC’s marginal rise suggests that the collective positive influences were only slightly stronger than the negative ones across a wider array of commodities for the day.
Conversely, significant weakness was observed in precious metals and specific agricultural and energy commodities. SLV (Silver) experienced the most substantial decline, falling by -3.099%, closely followed by CORN (Corn) with a -2.119% decrease. GLD (Gold) also saw a notable drop of -1.823%, and UNG (Natural Gas) declined by -1.789%. The synchronized declines in GLD and SLV strongly indicate probable weakness in the precious metals sector. The weakness in CORN suggests potential headwinds for agricultural commodities, while UNG’s decline creates a notable divergence within the energy complex, where crude and gasoline are advancing but natural gas is retreating.
Considering the entirety of the data, the market is presenting highly segmented performance. It is unlikely that these single-day movements are indicative of a broad, sustained trend in any particular direction for the entire commodity complex. The divergence, particularly within the energy sector (gasoline/crude up, natural gas down) and between industrial metals (copper up) and precious metals (gold/silver down), strongly suggests that specific factors are influencing individual commodity groups rather than a uniform market sentiment. Retail traders would probably view this as a period of selective strength and weakness, requiring a granular approach rather than a broad market stance.
Technical Analysis: Two-Day Commodity Performance Review (November 13-14, 2025)
The short-term technical landscape across a selection of commodities over the past two trading days presents a mixed but generally directional picture, indicating distinct momentum shifts within various sectors. Precious metals, represented by SLV and GLD, exhibited strong bearish conviction. SLV recorded two consecutive large red candles, with a notable price gap down on the second day. This pattern strongly suggests continued selling pressure, and it is highly likely that SLV will experience further downside in the immediate future unless a significant buying catalyst emerges. Similarly, GLD also displayed two large red candles and a substantial bearish gap. While GLD’s second day closed off its low, forming a lower wick that might hint at some intraday buying interest, the overarching two-day pattern remains decidedly bearish, making continued downward pressure likely for GLD as well. The significant gapping action in both ETFs underscores a firm bearish sentiment among market participants for the precious metals complex.
In the agricultural and industrial metals space, signals are more nuanced. CORN demonstrated a clear bearish reversal, with the second day’s large red candle effectively engulfing the prior day’s small bullish advance. This pattern, coupled with increased volume on the bearish day, suggests that downside momentum is likely to persist for CORN. Conversely, CPER, the copper ETF, showed a potential attempt at a bullish reversal following a significant decline on the first day. The second day opened lower but managed to close higher, forming a green candle with noticeably increased volume. This price action, resembling a piercing pattern, indicates that buyers are attempting to establish a floor. While the two-day decline has been stemmed, the overall trend over this short period makes continued consolidation or a modest near-term bounce roughly an even chance. However, a retest of the low seen on the second day is also a plausible alternative scenario if bullish follow-through fails to materialize.
The energy complex showed considerable divergence. USO, tracking crude oil, demonstrated robust bullish momentum. A significant gap-up on the second day, followed by a strong green candle that closed above the prior day’s open, signals considerable buying strength. This pattern makes a continuation of the upward trajectory for USO highly likely in the short term. UGA, representing gasoline, mirrored this strength, also displaying a substantial bullish gap-up and a large green candle on significantly higher volume. This very strong bullish price action suggests that UGA will likely experience further upside momentum. In contrast, UNG, the natural gas ETF, reversed course sharply. After a green candle with an upper wick indicating selling pressure on the first day, the second day witnessed a significant bearish gap down and a large red candle, closing near its lows. This strongly suggests a shift to bearish momentum, making further declines for UNG likely.
Finally, DBC, a diversified commodity ETF, exhibited a relatively neutral stance over the two-day period. After a small red candle, the second day saw a small green candle, opening above the prior close and closing barely higher. However, this modest price action was accompanied by a significant increase in volume on the second day, more than doubling the previous day’s volume. While the directional move was minimal, the surge in volume could indicate underlying accumulation or a struggle between buyers and sellers. Given the small body and high volume, DBC is roughly an even chance to either continue its sideways consolidation or experience increased volatility as either buying or selling pressure ultimately prevails. The overall commodity landscape, as seen through these ETFs, suggests a clear rotation of capital, with strong bullish conviction in crude oil and gasoline, stark bearish sentiment in precious metals, and mixed signals in other sectors.
Performance Heatmap (SLV, GLD, CORN, CPER, USO, DBC, UGA, UNG)
Generated for 2days timeframe analysis
Technical Analysis of SLV (90-Day View)
SLV’s price action over the last 90 days reveals a pronounced uptrend from early July through mid-October, followed by a significant correction and a subsequent attempt at recovery. From a low of approximately .11 in early July, the asset experienced a sustained rally, establishing a series of higher highs and higher lows. This bullish momentum peaked around .6999 on November 12th, marking a substantial advance over the period. Accompanying this ascent, volume data occasionally surged during periods of strong upward movement, notably in late August and September, suggesting strong accumulation. Intermediate support levels formed around the .00-.50 area in August, followed by a stronger base near .00-.00 in September.
The Relative Strength Index (RSI 14-day) broadly corroborated the bullish price action during the uptrend phase. RSI consistently remained above the 50-level for much of July, August, and September, signifying robust buying pressure. In late September and October, the RSI frequently entered deeply overbought territory, exceeding 70 and even touching above 80 on several occasions. While indicative of strong bullish sentiment, such extended periods in overbought conditions also suggest an increased probability of an impending pullback or consolidation. The sustained high RSI levels without a significant price correction until mid-October could be interpreted as a sign of strong trend conviction.
A notable shift occurred in mid-October. Following a high near .405 on October 15th, SLV experienced a sharp decline, with several large red candles accompanied by heavy selling volume on October 17th and 21st. This correction brought the price down to around .31 on October 21st. The RSI simultaneously retreated sharply, falling below the 50-level and touching the mid-40s on October 27th and November 4th, indicating a clear loss of bullish momentum and a potential shift towards bearish sentiment in the near term. This price action suggests that the .00-.70 region may represent a significant resistance zone, possibly forming a double top pattern with the November 12th high.
In the most recent trading days, specifically from November 12th to November 14th, SLV attempted to challenge the October highs but failed to sustain its ascent above .6999. The subsequent two-day decline, culminating in a close at .96, suggests renewed selling pressure. The RSI for these days declined from approximately 69 to 56.45, confirming the ebbing momentum. Given this recent price rejection and the retreating RSI from overbought conditions, it is likely that SLV will continue to experience short-term selling pressure. A retest of the immediate support zone around .40-.00 (from the November 10th-11th closes) is likely. Should this level fail to hold, a further pullback to the .00-.00 support area (observed in late October and early November) is roughly even chance.
Considering alternative scenarios, if SLV were to find solid support at either the .40-.00 or .00-.00 levels and then resume an upward trajectory with increasing volume, the underlying bullish trend from July could be considered intact. In this scenario, a re-attempt to break above the .00-.70 resistance would become likely in the medium term. Conversely, a decisive breakdown below the .00-.00 support on significant volume would likely signal a more substantial trend reversal, potentially targeting the prior September highs around .00-.00. However, based solely on the provided data, such a severe breakdown appears unlikely in the immediate future without further deterioration. It is important to note that the requested MACD (13-21 day) indicator data was not provided, therefore, analysis using this indicator cannot be rendered.
SLV Price & Indicators (RSI_14_DAY, MACD_13_21_DAY)
GLD Technical Analysis (90-Day View)
This technical analysis of GLD encompasses a 90-day period, utilizing daily candle data and the 14-day Relative Strength Index (RSI). It is important to note that while the analysis requested MACD data, this specific indicator was not provided in the dataset. Consequently, our commentary will be based solely on price action and RSI, adhering strictly to the available information.
Over the 90-day horizon, GLD has exhibited a discernible uptrend, particularly notable from late August through mid-October. The price escalated from approximately in late August to a peak near by October 20th. This rally was characterized by a series of higher highs and higher lows, indicative of strong bullish momentum. However, following the peak on October 20th, GLD has undergone a significant retracement, pulling back to the - range by November 14th. This recent price action indicates a shift from a strong upward trajectory to a consolidative or corrective phase. The high volume observed during the late September to mid-October rally, and then during the sharp declines in late October, suggests active participation during both bullish expansion and subsequent contraction.
The 14-day RSI confirms the observed price dynamics. During the robust uptrend from late August to mid-October, the RSI consistently registered in overbought territory, frequently exceeding 70 and even reaching into the low 80s multiple times (e.g., September 2nd, September 8th, October 1st, October 6-8th, October 20th). Such extended periods above 70 are often associated with strong, persistent trends. However, the sharp decline in price after October 20th led to a rapid correction in the RSI, falling from its peak of 87.33 on October 20th to approximately 60 by October 21st, and subsequently entering neutral territory (between 40 and 60) for much of late October and early November. The most recent RSI reading of 54.66 on November 14th suggests that the selling pressure has eased, moving it out of oversold conditions but also well below the overbought thresholds seen during the peak of the rally.
Considering both price action and RSI, a continuation of the corrective phase in the near term is probable. The price has clearly broken its steeper short-term uptrend after the October peak, and while it has found some support around the - area in late October and early November, the rally from this support has been tentative. The recent move from approximately to between November 4th and November 12th was followed by two consecutive down days, including a significant drop on November 14th. This suggests that resistance is likely encountered near the - price levels. Given the RSI is currently in neutral territory and not signaling an immediate oversold bounce, there is a roughly even chance of continued consolidation between and , or a further test of lower support levels.
An alternative scenario involves GLD re-establishing its prior bullish momentum. This would require the price to decisively break above the recent resistance levels around and sustain a move higher, with an accompanying rise in RSI back towards overbought conditions. However, based on the current data, this scenario is currently assessed as unlikely without a clear bullish candlestick pattern or a sustained move on increasing volume. Conversely, a breakdown below the - support zone would likely signal a deeper correction, with the RSI probably falling into oversold territory, indicating a higher probability of increased selling pressure.
GLD Price & Indicators (RSI_14_DAY, MACD_13_21_DAY)
Gold/Silver Ratio
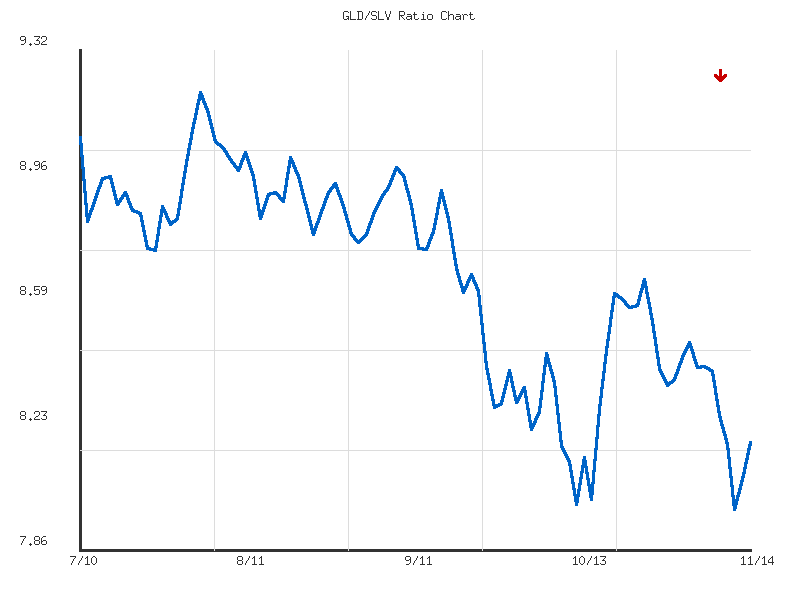
The GLD/SLV ratio has exhibited a moderate downtrend over the observed 14-day period, declining by approximately 4.14% from its initial value. This technical observation suggests that silver (SLV) has generally outperformed gold (GLD) during this specific timeframe. The ratio commenced at 8.533 on October 28th and closed at 8.180 on November 14th, consistently trading below its 14-day average of 8.315 for the latter half of the period. The relatively low volatility of 0.023 further indicates an orderly and somewhat sustained depreciation in the ratio rather than highly erratic price action.
The ratio established its peak for this period at 8.533 early on and subsequently reached its nadir at 7.985 on November 12th. The current ratio of 8.180 positions it closer to the lower end of its recent range, specifically at approximately 35.5% between the low and high. Notably, following the significant dip to the 7.985 low, we observed a subsequent bounce over the final two trading days, bringing the ratio back to 8.180. This two-day rebound represents a short-term upward movement from the immediate low.
Based on the current technical data, we assess it is likely that the moderate downtrend could persist, especially considering the current ratio’s position below its period average and closer to the range’s low. However, the recent two-day bounce from the 7.985 low introduces an element of uncertainty regarding the immediate trajectory. It is a roughly even chance that this rebound represents either a temporary correction within the broader downtrend or the nascent stages of a potential short-term reversal back towards the average. A sustained move above the 14-day average of 8.315 would be required to suggest a more significant shift in the ratio’s near-term direction, making a continued immediate decline to new lows improbable without further consolidation or a failed bounce.
Technical Analysis: GLD/SLV Ratio (90-Day View)
The GLD/SLV ratio has exhibited a clear, moderate downtrend over the observed 90-day period, commencing from July 10, 2025, through November 14, 2025. Initiating at approximately 9.07, the ratio reached its peak value of 9.20 on August 1, 2025, before embarking on a sustained decline. The current ratio of 8.18 represents a nearly 10% decrease from this high, indicating a persistent relative underperformance of Gold (GLD) against Silver (SLV) during this period. A rigorous technical analysis reveals a consistent pattern of lower highs and lower lows, a classical hallmark of a bearish trend. Subsequent rallies post-August 1 consistently failed to surpass prior peaks, and the ratio progressively established new troughs. A notable acceleration of bearish momentum occurred between September 19 and September 26, with the ratio dropping sharply from near 8.68 to approximately 8.28, confirming the strengthening downtrend below previously established support. The current ratio’s position significantly below the 90-day average of 8.66 further reinforces this bearish technical posture.
In recent trading, the ratio established its 90-day low at 7.98 on November 12, 2025, followed by a modest rebound to the current 8.18. This bounce from the absolute low presents a roughly even chance of being either a temporary retracement within the dominant downtrend or the commencement of a short-term consolidation phase around the 8.00-8.20 level. Should the prevailing downtrend resume, a retest of the 7.98 support is likely. Conversely, any upward movement will likely encounter resistance in the 8.40-8.60 region, corresponding to prior trading range highs observed during late October and early November. A decisive breakout above 8.60 would be required to suggest a probable shift in momentum; however, absent such a development, we assess that the path of least resistance for the GLD/SLV ratio is downward. It is therefore likely that the ratio will continue its pattern of bearish bias or consolidate within a lower trading range, maintaining SLV’s relative outperformance over GLD based solely on the provided technical data.
Ratio Analysis: GLD/SLV
Generated for 90days timeframe analysis
Bonds
| Symbol | Daily Percent Change |
|---|---|
| SHY | 0.012% |
| IEI | -0.067% |
| IEF | -0.171% |
| TLT | -0.576% |
| UTHY | -0.615% |
The daily percentage change data for the observed instruments indicates a general downward bias across most assets for the session. SHY, representing shorter-duration instruments, experienced a marginal gain of 0.012%. In contrast, IEI and IEF, covering intermediate durations, recorded modest declines of -0.067% and -0.171% respectively. The most significant underperformance was observed in TLT and UTHY, which both posted declines exceeding half a percent, specifically -0.576% and -0.615%. This suggests stronger selling pressure or profit-taking in longer-duration assets relative to their shorter-duration counterparts during this specific period.
Based on this single day’s data, it is unlikely that these movements alone confirm a sustained directional trend for any of the instruments. The significant disparity between the slight gain in SHY and the more substantial losses in TLT and UTHY could imply a potential shift towards shorter-duration assets or a flight to perceived safety within the fixed-income spectrum. However, this interpretation is based on limited information. It is roughly even chance that these are merely daily fluctuations within a broader range rather than the initiation of a new, persistent trend.
Considering alternative scenarios, the declines in TLT and UTHY could represent a short-term correction after prior gains, or they might be an isolated response to specific, internal market dynamics not discernible from percentage change alone. Conversely, the resilience of SHY might signal a preference for liquidity or less interest rate sensitivity among market participants on this particular day. Without additional technical indicators such as volume, trend lines, or moving averages, definitive conclusions regarding future price action are unwarranted. It is likely that traders would monitor subsequent daily performance and volume characteristics to confirm any emerging patterns or shifts in market sentiment.
Market Commentary: Treasury ETF Technical Review (November 13-14, 2025)
Observations from the two-day price action across various Treasury bond ETFs suggest a prevailing bearish sentiment across most durations, with the notable exception of the ultra-short duration SHY. The price movements indicate a broad-based selling pressure, confirmed by volume trends in several key instruments, which collectively points to a likely continuation of declining prices in the immediate term for many segments of the Treasury market.
TLT, representing long-duration Treasury bonds, exhibited clear and sustained selling pressure over the two-day period. Both trading sessions concluded at or near their daily lows, with a significant increase in volume on the second day to over 36 million shares. This pattern, characterized by consecutive bearish closes and rising participation, strongly suggests a likely continuation of the downtrend for long-term Treasuries. Concurrently, UTHY, an ETF focused on ultra-short duration bonds, displayed an equally pronounced bearish trajectory. Both its daily candles opened at their highs and closed at their lows, underscoring persistent selling pressure throughout the sessions. The volume for UTHY also saw a notable increase on the second day, which indicates a likely confirmation of this bearish momentum in the shortest end of the curve.
The mid-duration Treasury bond ETFs, IEF (7-10 year) and IEI (3-7 year), similarly concluded the two-day period with bearish price action. On the second day, both IEF and IEI opened higher than their prior closes but subsequently failed to hold those gains, closing near their daily lows and below their prior day’s closes. This indicates that price rejection occurred at higher levels, suggesting resistance has formed. Volume for both IEF and IEI decreased on the second day, which could imply slightly reduced selling intensity compared to the long-duration TLT. However, the overall price pattern for these mid-duration instruments still points to a likely continuation of downward pressure, albeit potentially less aggressive than in TLT.
In contrast to the broader Treasury market, SHY, representing 1-3 year Treasury bonds, displayed relative stability with a slight upward drift in price over the two-day period. While its trading ranges were tight, the ETF registered marginal higher closes on both days, with volumes remaining consistent. This resilience in SHY suggests that market participants may be finding relative safety or stability in the very short end of the yield curve, or that this segment is less susceptible to the bearish catalysts impacting other durations. This divergence from the general bearish trend observed across other duration segments is a notable observation.
The collective technical picture across these Treasury ETFs suggests a market environment characterized by widespread selling pressure, particularly pronounced in the long-duration (TLT) and ultra-short (UTHY) bond segments. The stability observed in SHY creates a divergence, indicating a potential shift in risk perception or specific demand for the very shortest maturities. Based on the strength of the bearish candles and supporting volume in TLT, UTHY, IEF, and IEI, a continuation of price declines in these segments is likely in the immediate future. However, the relatively low trading ranges and stable to slightly positive movement in SHY suggest a roughly even chance of either continued consolidation or a modest upward drift in that specific segment. An alternative scenario, though less likely given the current price action, would involve a short-term rebound driven by bargain hunting, particularly if upcoming trading sessions fail to breach the lows established on the second day for IEF and IEI.
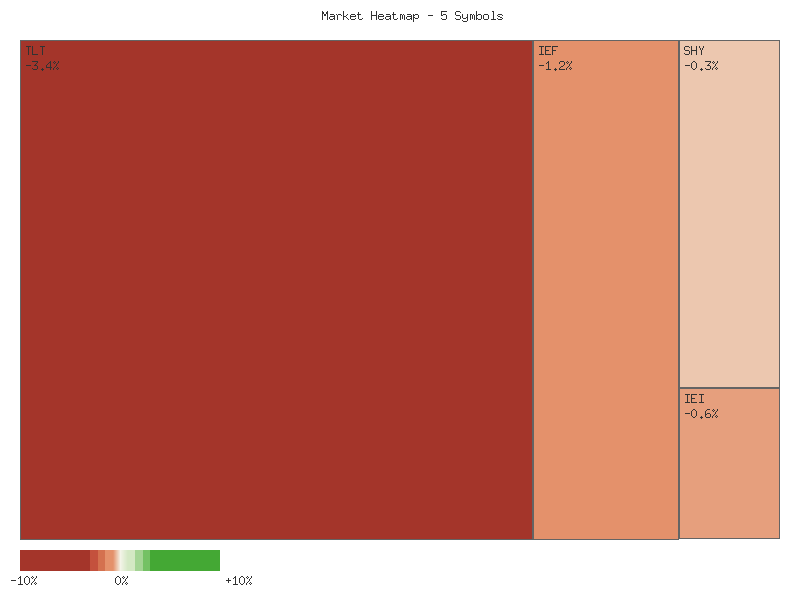
Performance Heatmap (TLT, UTHY, IEF, IEI, SHY)
Generated for 2days timeframe analysis
Magnificent 7 & Friends
| Symbol | Daily Percent Change |
|---|---|
| NVDA | 1.771% |
| MSFT | 1.369% |
| ANET | 0.833% |
| AVGO | 0.762% |
| TSLA | 0.587% |
| META | -0.071% |
| AAPL | -0.183% |
| GOOGL | -0.775% |
| AMZN | -1.179% |
| CRWV | -1.308% |
Analysis of the provided daily percentage change data reveals a mixed market sentiment among these selected equities for the day. While a slight majority (5 out of 10) closed positively, the range of performance suggests underlying divergence in immediate price action. Notably, NVDA and MSFT exhibited the strongest positive momentum, leading the group with gains of 1.771% and 1.369% respectively. ANET, AVGO, and TSLA also registered positive, albeit more modest, daily changes. We assess with moderate confidence that this clustering of positive performance in key technology and semiconductor names suggests a degree of focused buying interest in specific segments, which is often a feature of a robust, albeit selective, market.
Conversely, the negative performers ranged from marginal declines in META (-0.071%) and AAPL (-0.183%) to more significant pullbacks in GOOGL (-0.775%), AMZN (-1.179%), and CRWV (-1.308%). The sharper declines observed in AMZN and CRWV suggest these equities encountered notably stronger selling pressure or profit-taking compared to their peers. While this single day’s data does not establish a trend, the disparate performance between the top gainers and the bottom decliners indicates that capital flow was highly selective. It is roughly an even chance that these disparities reflect sector-specific news not evident in the pure price data, or simply routine intra-day fluctuations without broader implications for a longer-term trend reversal based solely on this limited information.
Considering the immediate technical implications, the leading performance by NVDA and MSFT might suggest a continuation of their short-term upward trajectory, although this assessment is based on a single data point and thus carries a low degree of confidence without confirming volume or prior price action context. For the decliners, particularly CRWV and AMZN, their daily drop might signal a slight weakening of immediate bullish sentiment or a continuation of prior bearish pressure, but again, a singular daily percentage change offers limited predictive power for broader trends. We assess it is highly unlikely that these isolated daily movements alone indicate a definitive shift in the overarching market direction for any individual stock without additional data points for trend identification, support/resistance levels, and volume analysis. Traders are encouraged to seek confirmation through multi-day price action and other technical indicators to form more robust conclusions regarding potential short-term continuation or reversal patterns.
As a Chartered Market Technician with over 15 years of experience, this analysis examines the two most recent trading days for a selection of major equities, strictly adhering to principles of price action, candlestick patterns, and volume. Designed for retail traders, this assessment provides a concise, short-term outlook based exclusively on the provided data. The market signals observed present a bifurcated landscape; some assets exhibit likely bearish continuation or consolidation, while a portion suggests probable short-term bullish reversals.
Several equities displayed either continued bearish momentum or high indecision during this period. Amazon (AMZN) and Alphabet (GOOGL) indicate likely continued bearish pressure. AMZN saw two bearish candles; Day 2 gapped down and closed lower, albeit on reduced volume. GOOGL similarly showed two bearish days, with Day 2 gapping down and closing lower on increased volume, reinforcing selling conviction. Apple (AAPL) presented two small bearish candles; Day 2 gapped down but closed marginally lower, suggesting a roughly even chance of consolidation or slight downward drift. Meta Platforms (META), after an initial bearish day, gapped down significantly on Day 2 but recovered strongly from its low to close near Day 1’s close on consistent volume, pointing to a roughly even chance of ranging or a minor upward bounce. CrowdStrike (CRWV) exhibited volatility with a strong bearish Day 1 followed by a deep gap down and a robust recovery on Day 2 on higher volume, indicating a roughly even chance of stabilization or continued high volatility.
Conversely, a significant portion of the analyzed stocks presented patterns indicative of likely short-term bullish reversals. Microsoft (MSFT) and NVIDIA (NVDA) both formed strong Bullish Engulfing patterns. Following a bearish Day 1, both gapped down on Day 2 but rallied forcefully; MSFT closed significantly above Day 1’s close on increased volume, and NVDA closed above Day 1’s open with sustained high volume, making a short-term bullish reversal highly likely. Broadcom (AVGO), Arista Networks (ANET), and Tesla (TSLA) presented Piercing Line patterns. Each followed a strong bearish Day 1 with a substantial gap down on Day 2, then a decisive recovery to close more than halfway into the prior bearish body. While Day 2 volume decreased for AVGO and ANET, and slightly for TSLA, these recoveries from deep gaps indicate a likely short-term bullish bounce for these equities; for TSLA, previous highs may act as resistance.
In conclusion, the two-day price action reflects a divided market sentiment. While AMZN and GOOGL are likely to face continued downside, and AAPL, META, and CRWV show roughly even chances of range-bound trading or minor shifts, a strong group comprising MSFT, NVDA, AVGO, ANET, and TSLA has established technical patterns suggesting a likely short-term upward bounce. It is crucial to underscore that this analysis is based on very limited data; these short-term patterns require confirmation from subsequent price action and should always be viewed within a broader market context, which is beyond this information’s scope.
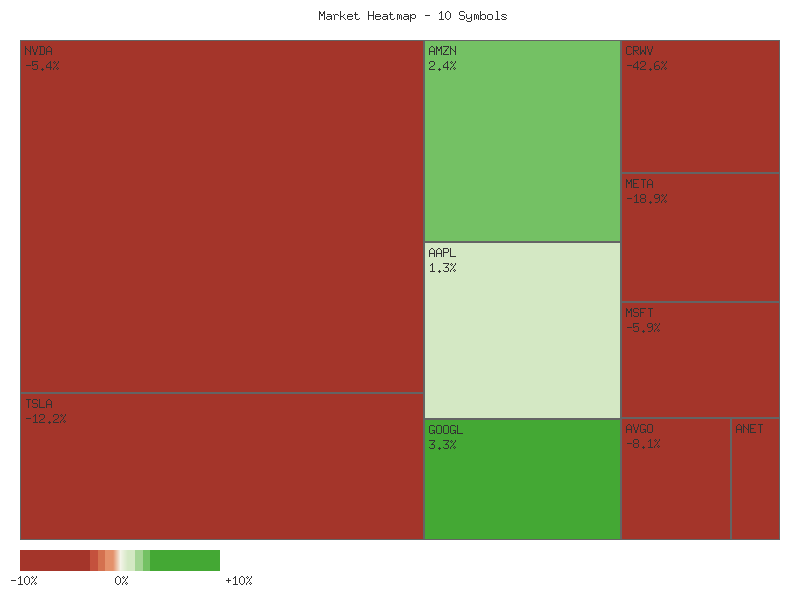
Performance Heatmap (TSLA, MSFT, AAPL, META, NVDA, AVGO, GOOGL, AMZN, CRWV, ANET)
Generated for 2days timeframe analysis
S&P 500 Sector Breadth
| Symbol | Daily Percent Change |
|---|---|
| XLE | 1.68% |
| XLK | 0.56% |
| XLRE | 0.28% |
| XLU | 0.10% |
| XLI | 0.03% |
| XLP | -0.10% |
| XLY | -0.48% |
| XLC | -0.53% |
| XLV | -0.59% |
| XLF | -0.94% |
| XLB | -0.95% |
The analysis of the daily percentage change across eleven S&P 500 sectors indicates a slightly negative market breadth for the observed period. Out of the eleven sectors, five registered gains, while six experienced declines. The most significant advance was seen in the Energy sector (XLE) at +1.68%, followed by Technology (XLK) at +0.56%. Conversely, the largest declines were observed in Materials (XLB) at -0.95% and Financials (XLF) at -0.94%. This distribution suggests a market that is not uniformly participating in either upside or downside movements, leading to an environment where idiosyncratic sector performance is prominent.
Breaking down the sectors into offensive and defensive categories reveals a mixed picture. Among the five advancing sectors, three are typically considered offensive: XLE (Energy), XLK (Technology), and XLI (Industrials). The remaining two advancing sectors, XLRE (Real Estate) and XLU (Utilities), are generally classified as defensive. On the declining side, four sectors are offensive: XLY (Consumer Discretionary), XLF (Financials), XLB (Materials), and XLC (Communication Services). The remaining two declining sectors, XLP (Consumer Staples) and XLV (Health Care), are defensive. This balance indicates that while some offensive sectors are advancing, a larger number of them are declining, pointing to a lack of broad-based strength in the growth-oriented parts of the market.
The observed sector performance does not strongly indicate a clear rotation towards either predominantly offensive or defensive leadership. While XLE, an offensive sector, showed the strongest positive movement, it is roughly an even chance that this represents broad offensive strength, given that the majority of offensive sectors declined. Conversely, the mixed performance within defensive sectors, with XLRE and XLU advancing while XLP and XLV declined, suggests a lack of uniform investor preference for safety. Overall market sentiment, based on this single day’s data, appears cautious. It is unlikely that investors are exhibiting strong conviction for aggressive growth, as evidenced by the underperformance of several offensive sectors and the slightly negative market breadth. Instead, the market seems to be navigating a period of selective sector performance rather than a clear thematic shift.
Market Commentary: Sector Divergence Amidst Mixed Signals
The past two trading days (November 13-14, 2025) have revealed a distinct divergence across major sector ETFs, with no single, overarching market trend dominating. Technical analysis of the provided candle data indicates a segmentation of market sentiment, where some sectors show clear directional conviction, while others display indecision or potential reversals. This selective capital allocation suggests that investors are differentiating opportunities, making a granular understanding of sector-specific technicals critical. Volume trends across the board offer mixed confirmation, with some bearish moves accompanied by decreasing volume, potentially hinting at waning selling pressure, while key bullish reversals were confirmed by increased activity.
A segment of the market exhibited persistent bearish momentum. Financials (XLF), Materials (XLB), Communication Services (XLC), and Consumer Discretionary (XLY) notably printed lower highs and lower lows over the two-day period, with Friday’s (Nov 14) close definitively below Thursday’s (Nov 13) close, forming bearish continuation patterns. For XLF, XLB, and XLC, this downward trajectory, though accompanied by decreasing volume on Friday, suggests that a continuation of bearish pressure is likely. While diminishing volume could foreshadow a potential short-term bounce, the dominant price action points to continued weakness. XLY also demonstrated significant bearish pressure, with Friday seeing a lower close than Thursday despite an intraday rally, indicating that bearish sentiment is likely to persist, potentially facing resistance at Thursday’s closing levels.
In stark contrast, other sectors demonstrated emerging bullish strength. The Energy (XLE) and Technology (XLK) sectors presented a distinctly positive outlook. XLE formed a strong bullish continuation pattern on Friday, opening higher and closing significantly above Thursday’s close, validated by an increase in trading volume. This robust price action, combined with rising volume, makes a further upward move in XLE highly likely. Similarly, XLK, after a substantial bearish candle on Thursday, executed a strong bullish piercing pattern on Friday. It opened significantly lower but rallied aggressively to close well above Thursday’s midpoint, with increased volume. This strong reversal following a sharp decline indicates that an upward continuation for XLK is likely in the near term, signaling a potential short-term bottom formation.
The remaining sectors displayed more ambiguous technical patterns, indicating a period of indecision. Consumer Staples (XLP), Industrials (XLI), Utilities (XLU), Healthcare (XLV), and Real Estate (XLRE) reflect this mixed sentiment. XLP showed a slight bearish bias on Friday with lower volume and a tight range, suggesting a roughly even chance of either continued mild weakness or consolidation within its recent range. XLI and XLU, after initial bearish moves on Thursday, attempted recoveries on Friday, closing above their respective Friday opens but largely contained within Thursday’s range, with declining volume. This price action suggests a roughly even chance for either a bounce or a resumption of selling pressure, necessitating further confirmation. XLV, after an initial bullish Thursday, reversed on Friday with a lower close and declining volume, creating a roughly even chance scenario for either continued pullback or a renewed upward push. XLRE exhibited very low volatility and indecisive price action on both days, with declining volume, indicating a roughly even chance of a breakout in either direction, but no clear immediate directional signal for traders.
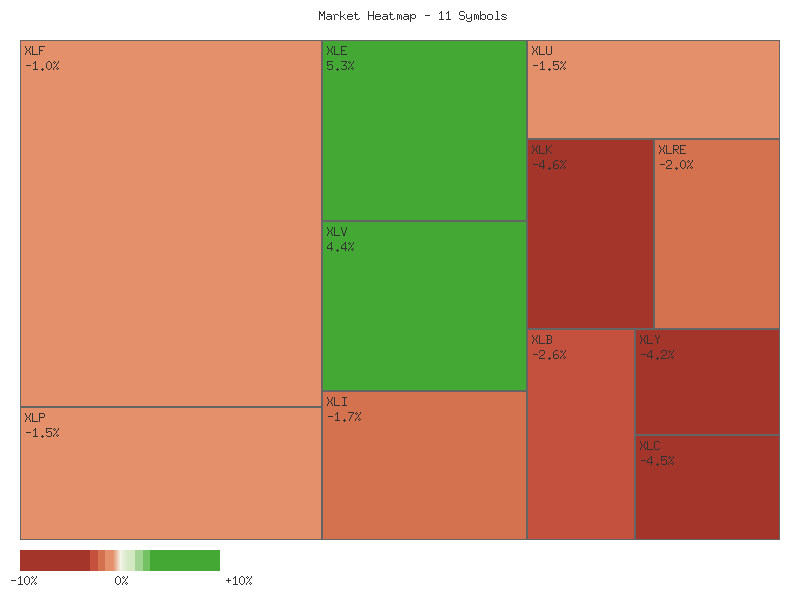
Performance Heatmap (XLP, XLRE, XLI, XLU, XLV, XLY, XLF, XLB, XLE, XLC, XLK)
Generated for 2days timeframe analysis
XLY vs XLP
The XLY/XLP ratio has exhibited a clear downward trend over the past seven days, as indicated by the reported “down” direction and “moderate” strength. From its peak of 3.1265 on November 10th, the ratio has consistently made lower highs and lower lows, culminating in a 4.02% decline to its current level of 2.9890 by November 14th. This consistent price action strongly suggests an erosion of relative strength in the Consumer Discretionary sector compared to Consumer Staples during this period. The ratio presently sits at the lowest point within the observed seven-day range, signaling a prevailing bearish sentiment for XLY relative to XLP in the immediate short term.
The sequence of daily closing ratios highlights this developing downtrend. Following an initial dip from 3.1142 to 3.0751, the ratio briefly recovered to 3.1265. However, it subsequently declined for four consecutive sessions, registering values of 3.0947, 3.0770, 3.0005, and finally 2.9890. This pattern of sustained selling pressure, resulting in the current ratio being at its 7-day low, makes a continuation of the downward momentum likely in the very short term. The average ratio over this period stands at 3.0681, significantly above the current level, further underscoring the recent weakness.
Given the established downward trend and the ratio’s current position at the lower boundary of its observed range, a further test of lower levels is likely if the prevailing selling pressure persists. However, being at the 7-day low, there is a roughly even chance of a short-term consolidation or a minor technical bounce as the ratio potentially seeks to stabilize. A significant reversal upward, reclaiming prior resistance levels, is unlikely without a material change in the underlying relative strength dynamics, which is not observable within the provided limited dataset. The moderate volatility suggests that while the trend is clear, extreme price swings have not characterized this decline, implying a more measured, albeit persistent, shift.
CMT Technical Analysis: XLY/XLP Ratio (90-Day)
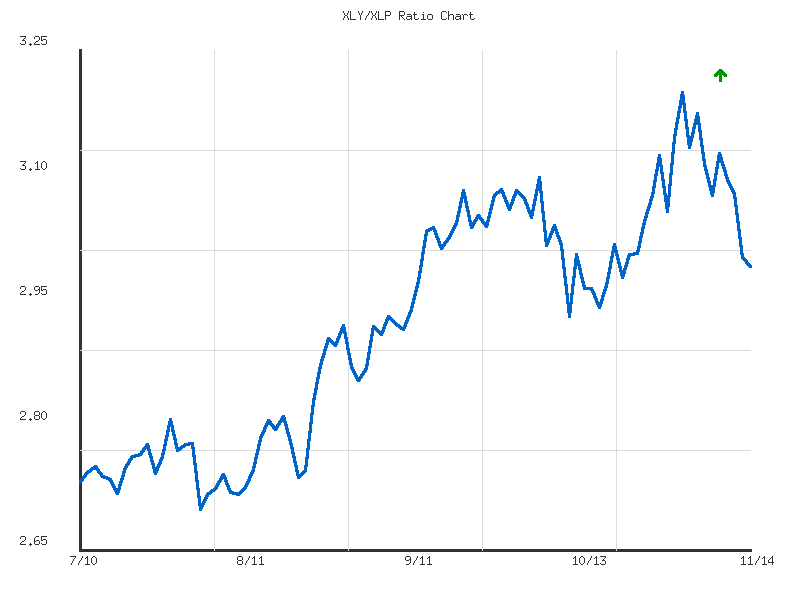
The XLY/XLP ratio, which tracks the relative performance of Consumer Discretionary to Consumer Staples, has demonstrated a moderate upward trend over the past 90 trading days, appreciating approximately 9.5%. This indicates a period where consumer discretionary sectors have moderately outperformed defensive consumer staples. The ratio began its observation period near 2.729 in mid-July and ascended to a peak of 3.199 on November 3, 2025, before experiencing a notable pullback. The overall trend direction, as explicitly provided, remains “up” with “moderate” strength, suggesting continued relative strength for XLY despite recent fluctuations.
Currently, the ratio stands at 2.989, which is above its 90-day average of 2.921. While the immediate price action since early November shows a clear decline from the recent high, the current reading sits at a relative position of 0.582 within its 90-day range, indicating it remains in the upper half of its observed performance band. This positioning suggests that the broader positive momentum is still intact, although it is currently under pressure. A historical review of the data points reveals that significant support areas might exist around the prior consolidation zone in late August and early September, which hovered around the 2.85 to 2.90 levels.
The most prominent feature in the recent data is the sharp correction from the November 3 high of 3.199 down to the current 2.989. This decline of roughly 6.57% represents a significant retracement after establishing a new peak. Such a rapid decline makes a retest of the average ratio (2.921) or potential support levels derived from earlier price congestion, such as the 2.90-2.95 range, likely. Traders will probably watch these levels closely for signs of stabilization or a potential bounce, which could confirm the sustainability of the underlying moderate uptrend.
Looking forward, two primary scenarios emerge with differing probabilities. It is likely that the current pullback represents a healthy correction within the established moderate uptrend. A rebound from current levels or the vicinity of the average ratio (2.921) that then establishes a higher low would probably lead to a renewed challenge of the 3.199 high, suggesting that XLY’s outperformance could resume. Conversely, a sustained break below the average ratio of 2.921, especially if accompanied by continued weakness, would indicate a deterioration of the relative strength. Such a breakdown would raise the probability of a deeper retracement to prior support zones around 2.85, or potentially a shift from an ‘up’ trend to a ‘sideways’ or even ‘down’ trend in relative performance.
The current juncture for the XLY/XLP ratio is critical. While the overarching moderate uptrend remains, the recent price action presents a significant test of its resilience. The next few trading sessions are likely to be instrumental in determining whether this ratio finds support and attempts to resume its upward trajectory or if the recent high marks a temporary peak, paving the way for further consolidation or a more pronounced reversal in relative strength.
Ratio Analysis: XLY/XLP
Generated for 90days timeframe analysis
Equity Breadth
An analysis of the S&P 500 member participation rates, specifically the percentage of stocks trading above their 50-day and 200-day moving averages (SPXA50R and SPXA200R), over the past seven days reveals a distinct two-phase pattern. From 2025-11-06 to 2025-11-12, both indicators exhibited a consistent upward trajectory, with SPXA50R rising from 38.92% to 51.40% and SPXA200R advancing from 48.50% to 56.80%. This expansion in market breadth likely suggested a period of strengthening internal market dynamics, where a growing number of S&P 500 constituents were participating in the short-term and long-term uptrends, reaching a peak of broad participation on 2025-11-12.
However, the subsequent two trading days, 2025-11-13 and 2025-11-14, showed a notable reversal in this trend. The SPXA50R declined sharply from its peak of 51.40% to 42.40%, indicating a rapid deterioration in the short-term technical posture of S&P 500 members. Concurrently, the SPXA200R also retreated, falling from its peak of 56.80% to 52.80% over the same period. This contraction in breadth for both measures, particularly the more pronounced decline in the 50-day average, suggests that a significant number of stocks have recently fallen below their respective moving averages, making a short-term pullback or consolidation for the broader index more likely.
The current positioning, with SPXA50R at 42.40% and SPXA200R at 52.80% on 2025-11-14, indicates that short-term market breadth has fallen below long-term breadth. This divergence, where fewer stocks are maintaining their short-term uptrends relative to those holding long-term uptrends, strongly suggests an environment of increasing short-term weakness. While the SPXA200R remains above the critical 50% threshold, implying that a majority of S&P 500 components are still in a long-term uptrend, the rapid erosion in the SPXA50R poses a notable concern for immediate market direction.
Considering these patterns, it is likely that the S&P 500 may experience continued short-term pressure or enter a phase of consolidation in the near future. An alternative scenario, though less probable given the recent two-day decline, is that this contraction merely represents a brief and healthy shake-out before the resumption of the prior bullish trend observed earlier in the week. However, the magnitude of the SPXA50R’s drop suggests that the market’s immediate internal health has deteriorated, making further short-term weakness a more probable outcome.
SPY Daily
SPY’s price action over the past 90 days indicates a sustained uptrend, with both the 50-day Exponential Moving Average (EMA) at 666.67 and the 200-day EMA at 624.51 exhibiting an upward slope. The 50-day EMA remains comfortably above the 200-day EMA, reinforcing the long-term bullish bias. However, the short-term narrative reveals a shift in momentum. Over the last seven trading days, SPY experienced a notable pullback from a peak around 683.285 on November 12, culminating in a sharp decline on November 13. The most recent trading day, November 14, saw a bullish engulfing candle form, closing at 671.94, which was slightly below the previous day’s close but represented a recovery from the day’s lows. This recovery occurred on notably elevated volume compared to earlier in the week, suggesting a potential absorption of selling pressure. The 14-day Relative Strength Index (RSI) has declined from near-overbought levels in late October to 48.18 on November 14, indicating a loss of upward momentum and a current neutral stance.
Key technical levels warrant close observation. Immediate resistance is likely situated in the 683.00-685.00 range, representing the recent high point where selling pressure previously emerged. Further resistance can be observed around the all-time high of 687.39 from October 29. On the support side, the 50-day EMA, currently at 666.67, acts as dynamic support, with the recent low of 663.265 on November 14 also serving as a short-term floor. A more robust support zone exists around 652.00-654.00, derived from a previous bounce in early October. The 200-day EMA at 624.51 remains a significant long-term support level.
For a bullish scenario to develop, it is likely that SPY needs to sustain its recent rebound and close decisively above the 675.66 level, the high of the November 14 candle, and subsequently clear the immediate resistance zone of 683.00-685.00. Should this occur with continued elevated volume, it would suggest renewed buying conviction and a likely attempt to challenge the previous highs, potentially pushing towards new resistance levels above 687.39. The RSI would also need to trend firmly back above 50 to confirm bullish momentum.
Conversely, a bearish outcome remains a roughly even chance. Despite the bullish engulfing candle on November 14, the overall downward trajectory of the past week, coupled with the sub-50 RSI, suggests persistent selling interest. A failure to hold above the 50-day EMA at 666.67, particularly if accompanied by increased selling volume, would likely lead to a test of the 652.00-654.00 support zone. A sustained break below this level is less likely but could indicate a deeper correction, potentially targeting the 200-day EMA around 624.51.
A neutral scenario, involving consolidation, is also a roughly even chance. Given the recent battle between buyers at current support and sellers at previous highs, SPY may enter a period of sideways trading. This would likely see the price oscillate within a range, perhaps bounded by the 666.67 EMA support and the 685.00 resistance. Such consolidation would allow the market to digest recent moves and for the RSI to stabilize, potentially setting the stage for a clearer directional move in the coming weeks. The underlying sentiment appears to be transitioning from aggressive bullishness to a more cautious, indecisive stance, as market participants evaluate the recent momentum shift in the context of the longer-term uptrend.
SPY Technical Analysis: 90-Day Outlook and Current Momentum Assessment
Over the past 90 days, SPY has generally exhibited an upward trend, characterized by periods of strong bullish momentum punctuated by several significant, albeit short-lived, pullbacks. Price movements in July showed a robust ascent, which propelled the 14-day Relative Strength Index (RSI) into overbought territory, peaking at 75.58 on 2025-07-25. This was followed by a sharp correction in early August, with price declining and RSI dropping dramatically to 47.66 by 2025-08-01, accompanied by notably elevated volume, suggesting strong selling pressure. Subsequent periods in September and early October saw similar patterns; price rallies pushed RSI above 70, reaching 73.70 on 2025-09-22 and 71.17 on 2025-10-06. Each of these excursions into overbought conditions was closely followed by price consolidation or a pullback, validating the traditional interpretation of the RSI as a momentum oscillator identifying potential exhaustion points in the prevailing trend.
The most pronounced market event within this 90-day period occurred on 2025-10-10, when SPY experienced a significant price decline, closing at 653.02, down from 671.16 the previous day. This aggressive selling was conducted on the highest recorded volume for the period, reaching 156.6 million shares, and pushed the RSI into near-oversold territory at 41.81. This strong reaction from an overbought state (RSI was 65.75 on 2025-10-09) reinforces the indicator’s utility in signaling potential trend shifts or deep corrections. Following this sharp drop, SPY demonstrated a resilient recovery, climbing to new highs in late October, with closing values reaching approximately 687. This recovery, however, was not sustained into the current month of November.
Entering November, SPY initiated another pullback from its late October highs. The RSI, which had climbed back to nearly 70 (69.71 on 2025-10-29), quickly retreated, registering values in the high 40s to low 50s. The recent trading days, specifically 2025-11-13 and 2025-11-14, have seen significant selling volume (89.8 million and 91.5 million shares, respectively) pushing prices lower. On 2025-11-13, SPY closed significantly down at 672.05, with RSI at 48.27. The 2025-11-14 candle is particularly notable; while opening much lower at 665.38, it formed a relatively long lower wick and closed near the prior day’s close at 671.94. The RSI for this date stands at 48.179. This pattern, combined with the current RSI level hovering near the mid-point of its range but with recent downward momentum, suggests that while selling pressure remains significant, there is a moderate probability of buying interest emerging around these levels.
Our analysis suggests that SPY is currently in a phase of consolidation or minor correction after the late October peak. The RSI’s proximity to the 40-50 range, historically a level from which bounces have occurred within this dataset, indicates a roughly even chance of either a near-term stabilization or a further test of lower support. A notable possibility exists for SPY to find support around the 660-665 price range, given the buying interest observed via the lower wick on 2025-11-14 and prior price action in September and early October. However, a sustained break below the 2025-11-14 low (663.265) would likely lead to a further descent, with the 2025-10-10 low of 653.02 serving as the next critical support target. Conversely, a sustained move above the 675-680 range, accompanied by an increase in RSI, would suggest a resumption of the broader upward trend. It is important to note that MACD data was not provided for this analysis, limiting the breadth of momentum confirmation.