Daily Market Technical Analysis
The market experienced broad-based equity weakness on November 13th, characterized by universal daily declines across major indices and most S&P 500 sectors, often with increased selling volume. Small-cap and technology-heavy indices significantly underperformed, while long-duration bonds also saw greater declines, reinforcing market risk aversion. The VIX surged, indicating heightened apprehension. Moving forward, continued downside for most major equity indices and large-cap tech is highly likely, with further pressure on long-duration bonds also likely. Silver’s outperformance against gold is likely to persist. Some individual instruments and relative strength ratios present a roughly even chance for short-term consolidation or minor bounces within the prevailing bearish environment.
Market Indices
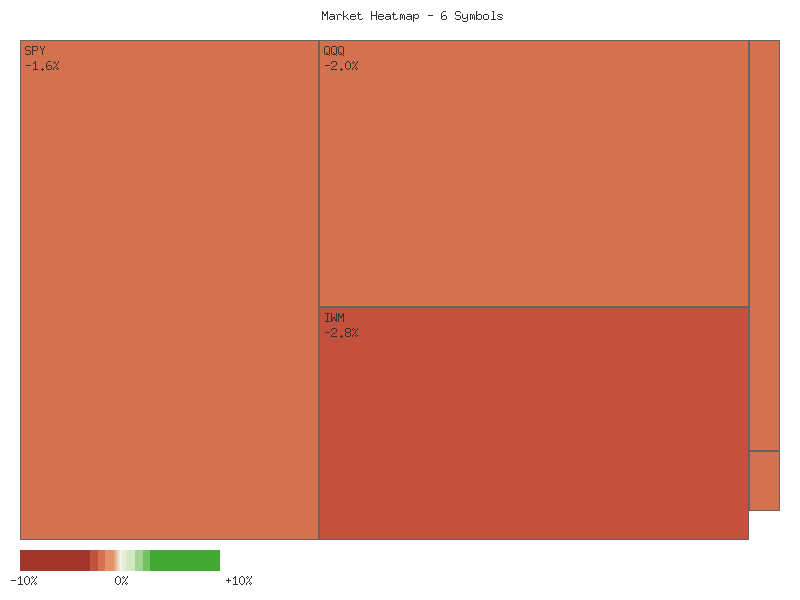
Analysis of the provided daily percentage change data for key equity indices reveals a universally negative trading session on November 13, 2025. All six tracked symbols experienced declines, indicating broad market weakness. The performance is summarized below, sorted in descending order of daily percentage change (least negative to most negative):
| Symbol | Daily Percent Change |
|---|---|
| SPY | -1.644% |
| OEF | -1.735% |
| MDY | -1.871% |
| QQQ | -2.040% |
| IJR | -2.096% |
| IWM | -2.812% |
From a market breadth perspective, the data indicates a significantly bearish environment. There were zero advancing symbols against six declining symbols, representing a 0% advance rate among these benchmark indices. This complete absence of positive performance across diverse market capitalization segments (large, mid, small) suggests that downside pressure was widespread rather than concentrated in specific sectors or cap sizes. Such a broad-based decline is often interpreted as a strong signal of pervasive selling pressure, which is likely to be a significant technical observation for market participants.
Examining the magnitude of these declines, the S&P 500 ETF (SPY) showed the least negative performance, down approximately -1.644%, followed closely by the S&P 100 ETF (OEF) at -1.735%. Conversely, small-cap indices experienced more significant pressure, with the Russell 2000 ETF (IWM) declining by roughly -2.812% and the S&P SmallCap 600 ETF (IJR) falling by approximately -2.096%. The Nasdaq 100 ETF (QQQ) also saw a notable drop of about -2.040%, suggesting technology and growth stocks were not immune to the selling. This relative weakness in smaller-cap segments and growth-oriented names (QQQ) compared to the broader large-cap indices (SPY, OEF) might indicate shifting risk appetite, where investors could be rotating away from higher-beta assets or simply engaging in widespread de-risking.
Based solely on this singular day’s data, the overwhelming negativity across all major market segments is a significant technical observation. It is likely that this broad-based selling pressure will carry some momentum into the subsequent trading sessions, suggesting a continuation of downward movement is probable in the very near term. However, it is also plausible, though less likely given the magnitude and universality of the declines, that this pronounced selling could represent an exhaustion event, potentially setting the stage for a near-term bounce. Nevertheless, the predominant technical signal from this data points to ongoing weakness, and traders would likely observe for further confirmation of trend direction from subsequent price action.
Market Commentary: Two-Day Technical Analysis of Key ETFs
The recent two-day trading period, encompassing November 12th and 13th, 2025, reveals a pronounced shift toward bearish sentiment across a broad spectrum of market-tracking ETFs: SPY, QQQ, OEF, IWM, IJR, and MDY. On November 12th, the majority of these instruments concluded with bearish candles, yet trading volume was generally moderate. The subsequent session on November 13th marked a decisive escalation in selling pressure. SPY, QQQ, and OEF, representing large-cap segments, all opened with a notable gap down from the previous day’s close. This was followed by the formation of large, full-bodied bearish candles, indicating sellers maintained control throughout the session. Critically, trading volume substantially increased on November 13th for SPY, QQQ, and OEF, accompanying the price decline and closing near their respective daily lows. Based on these converging technical indicators—gap downs, strong bearish candles, and increasing volume—it is highly likely that these major indices will experience further downside price action in the immediate future.
Analyzing the small and mid-cap segments, IWM (Russell 2000) and MDY (S&P Midcap 400) largely mirrored the negative sentiment observed in the broader market. IWM displayed a pattern almost identical to the large-cap indices, with a gap down on November 13th, a wide-range bearish candle, and a substantial increase in volume, closing at its daily low. This suggests a highly likely continuation of bearish pressure for small-cap equities. MDY, however, presented a slight divergence on November 12th, closing marginally bullish, marking the only ETF to do so. This minor strength was quickly negated on November 13th by a forceful bearish engulfing candle, opening with a gap down, closing near its low, and accompanied by a significant increase in volume. This pattern indicates a strong bearish reversal, making further downside highly likely for mid-cap exposure.
In contrast, IJR (S&P Small-Cap 600), while also experiencing a gap down and forming a wide-range bearish candle on November 13th, underwent a slight decrease in trading volume compared to November 12th. This specific volume profile, divergent from its peers where volume generally increased with selling, introduces an element of uncertainty regarding the immediate conviction of sellers at these lower levels for IJR specifically. While bearish pressure is evident, the lack of accelerating volume on the downside suggests that the intensity might not be as robust as in other segments. Therefore, for IJR, there is a roughly even chance of either a continued decline or a near-term relief bounce, even within an overarching bearish bias. However, absent new data, the collective evidence firmly points to a market environment where further price erosion is the dominant technical expectation for the majority of these analyzed instruments.
Performance Heatmap (SPY, QQQ, IWM, IJR, MDY, OEF)
Generated for 2days timeframe analysis
SPY Technical Commentary: Navigating Recent Momentum Shifts
SPY has demonstrated a clear upward trend over the provided 90-day period, commencing from approximately 624 in early July and ascending to an all-time high around 689 in late October. This robust rally, however, has been punctuated by several distinct pullbacks, indicating periods of profit-taking or shifting sentiment. Notably, a sharp decline from near 637 to 621 on August 1st was accompanied by exceptionally high volume of 140 million shares, suggesting significant selling pressure. Similarly, a more recent correction on October 10th saw SPY fall from about 673 to 653 on even higher volume of 156 million shares, underscoring the importance of these price movements being confirmed by trading activity.
Momentum, as measured by the 14-day Relative Strength Index (RSI), has frequently approached or entered overbought territory (above 70) prior to these corrective phases. For instance, in late July, the RSI surpassed 75 before the early August downturn. Again, in mid-September and early October, RSI readings above 70 foreshadowed subsequent price pullbacks. More recently, as SPY made its peak around 689 in late October, the RSI reached 69.71 but failed to convincingly sustain above 70. This pattern, where price achieves new highs but the momentum indicator either fails to reach corresponding highs or shows a decline, is frequently interpreted as a potential bearish divergence, suggesting that the underlying buying strength is diminishing.
The recent price action confirms this shift in momentum. On November 13th, SPY registered a significant decline to 672.05 on elevated volume of nearly 90 million shares, reinforcing the notion of increased selling pressure. The current RSI of 48.27, while not yet in oversold territory, is trending downward, indicating that short-term momentum has turned bearish. From a price structure perspective, the prior resistance zone around 666-668 (from late September/early October) may now function as an initial support level. A more critical support area is evident around 653, established by the high-volume bounce in mid-October. Conversely, the all-time high near 689 currently stands as significant overhead resistance.
Considering these technical indicators, it is likely that SPY will continue to test lower support levels in the near term, with a move towards the 666-668 range, and potentially the 653-660 area, being a plausible scenario. An alternative scenario suggests that if SPY quickly finds support above 666 and momentum indicators, specifically RSI, begin to turn upward from current levels, there is a roughly even chance that the longer-term bullish trend could reassert itself. However, a decisive break below the 653 support level, especially if accompanied by high volume, would make a deeper correction highly likely. It is important to note that analysis of the MACD indicator was not possible as the corresponding data was not provided.
SPY Price & Indicators (RSI_14_DAY, MACD_13_21_DAY)
QQQ Technical Analysis (90-Day Perspective)
The QQQ has experienced a robust uptrend over the past 90 days, marked by several distinct phases of strong price appreciation interspersed with sharp, high-volume pullbacks. Initially, from early July to late July, QQQ demonstrated a consistent climb, pushing the 14-day Relative Strength Index (RSI) into overbought territory, peaking near 73.11. This upward trajectory was then met with a significant, high-volume decline around August 1st, where the RSI quickly retreated to near neutral levels. A similar pattern emerged through August and September, with QQQ resuming its climb, again driving the RSI well into overbought conditions, reaching 75.35 on September 22nd. These periods of sustained gains and subsequent quick corrections illustrate a market characterized by strong buyer interest but also vulnerability to rapid profit-taking.
A critical inflection point likely occurred on October 10th, when QQQ experienced a substantial single-day decline from highs around 611.61 to a close of 589.5, accompanied by the highest volume observed in the provided dataset (94.4 million shares). This sharp price drop caused the 14-day RSI to plummet from 69.27 to 45.42, a strong indication of a sudden shift in short-term momentum from bullish to bearish. Despite this significant reversal, QQQ managed to stage another impressive rally from mid-October, pushing to new highs of 637.01 on October 29th. This subsequent ascent again propelled the RSI back into overbought territory, reaching 71.73, suggesting persistent underlying bullish strength even after a severe correction.
However, the most recent price action, spanning from October 30th to November 13th, suggests a likely short-term topping formation or a significant corrective phase. Following the October 29th peak, QQQ has experienced a pronounced decline, falling from 637.01 to 608.37 by November 13th. This downward movement has been characterized by elevated selling volume on multiple days during the decline, notably on November 4th, 6th, and 7th. The 14-day RSI has concurrently fallen sharply from its overbought reading of 71.73 to a current level of 46.33. This rapid descent from overbought to near mid-range, coupled with price weakness on increasing volume, is highly likely indicative of a significant loss of bullish momentum and increased selling pressure in the immediate term.
Considering alternative scenarios, while the current technical picture suggests a bearish bias in the near term, the QQQ has demonstrated a pattern of sharp recoveries following significant pullbacks within this 90-day window. Therefore, there remains a roughly even chance of a short-term bounce or stabilization in price, particularly if QQQ finds support around previously established consolidation areas. However, the closing price on November 13th, near the low of the day on substantial volume, suggests that selling pressure could persist, making a continuation of the downtrend likely in the immediate sessions ahead. It is important to note that the requested MACD (13, 21-day) data was not provided, which limits our ability to offer a complete assessment of momentum and potential crossovers that could further clarify the outlook.
QQQ Price & Indicators (RSI_14_DAY, MACD_13_21_DAY)
Market Commentary: IWM – November 13, 2025
IWM has exhibited a generally upward trajectory over the 90-day period observed, ascending from approximately in early July 2025 to an all-time high of .77 recorded on October 15, 2025. This progression was interspersed with two distinct corrective phases: an early August dip to around .92, followed by a robust recovery, and an early October pullback to .79, which also saw buyers step in. These rallies to successively higher peaks, following corrections, suggested underlying demand for the asset. Volume analysis indicates that significant price movements, both upward and downward, were often accompanied by elevated trading activity. Notably, the sharp decline on October 10 and the recent downturn on November 13 occurred on substantial volume, which typically lends credibility to the price action in the direction of the move. The latest data point shows IWM closing at .78 on November 13, representing a notable retreat of approximately 6.5% from its mid-October peak.
The 14-day Relative Strength Index (RSI) largely correlated with price movements throughout the observation period. In early July, the RSI residing in the upper 60s, bordering on overbought conditions, preceded a subsequent price consolidation. The August 1 price low pushed the RSI to 41.36, nearing the oversold threshold (below 30), which historically often signals a potential reversal or bounce. Indeed, a significant price rally followed this event. The RSI breached the overbought level of 70 on September 18 (71.23) as IWM reached new highs, affirming strong bullish momentum at that time. However, mirroring the recent price weakness, the RSI has been in a clear downtrend since late October. The October 10 price drop saw the RSI fall to 44.97, and the most recent reading on November 13 stands at 40.10. While not yet in the classic oversold territory, this level signifies a considerable loss of bullish momentum and increasing selling pressure.
Synthesizing the recent price action with the RSI indicator, the current technical posture for IWM appears bearish in the immediate term. The sustained price decline from the October highs, coupled with the consistent downtrend and weakening level of the 14-day RSI, suggests that upward momentum has dissipated. Given these patterns, it is likely that IWM will continue to experience selling pressure in the forthcoming trading sessions. An alternative scenario suggests a roughly even chance that IWM could encounter temporary support as it approaches prior consolidation lows, specifically around the mid-, or potentially retesting stronger support levels from August in the - range. Should the RSI approach or enter the oversold region, such price levels could attract renewed buying interest, similar to the early August rebound. However, without a clear shift in momentum indicators or a defined reversal pattern in price, the prevailing technical signals point to a greater probability of continued weakness.
IWM Price & Indicators (RSI_14_DAY, MACD_13_21_DAY)
VIX Fear Index
The VIX has displayed notable fluctuations over the past seven trading days, indicating shifting market sentiment. Initially, the index attempted to establish levels above 20.00 from November 5th to 7th, culminating in an intraday high of 22.72 on November 7th. Following this peak, the VIX experienced a short-term downtrend, declining over four consecutive trading sessions to reach a low of 17.25 on November 11th. This established a recent support area around the 17.00-17.25 range. The absence of volume data precludes any analysis regarding market participation during these price movements.
The most recent trading day, November 13th, presented a significant bullish reversal for the VIX. Opening at 17.61, the index surged to an intraday high of 21.31 before closing strongly at 20.37. This powerful daily movement is underscored by a robust 16.53% increase, as corroborated by the daily percentage change data. The candlestick for November 13th is a substantial bullish candle, closing near its high, which visually engulfs the body of the preceding day’s small bullish candle. This pattern is often interpreted as a strong signal of renewed buying pressure and a potential shift in the short-term trend towards increased volatility.
Considering the pronounced bullish candle and the significant daily percentage gain on November 13th, it is likely that the VIX will attempt to challenge higher price levels in the immediate term. The primary resistance level to monitor is the prior high of 22.72 from November 7th. There is a roughly even chance that the index may encounter some resistance or consolidation within the 21.00-21.31 range before a direct re-test of 22.72. A sustained and decisive break above the 22.72 level would likely indicate a more persistent expansion of implied market volatility.
Alternatively, should the VIX fail to maintain its upward momentum above the 21.00-21.31 area, or if it re-tests and subsequently rejects the 22.72 level similar to its action on November 7th, a short-term pullback or a period of consolidation would become likely. This could be evidenced by a bearish reversal pattern emerging after the November 13th surge, suggesting that the recent move may have been more of a short-covering rally rather than a fundamental shift in market sentiment. A rapid return to the 17.00-17.50 support zone is unlikely immediately following such a strong bullish day, but sustained weakness that challenges this critical support would significantly diminish the current bullish outlook.
VIX Technical Analysis: 90-Day Outlook (July 2025 - November 2025)
The VIX has exhibited significant volatility over the past 90 days, beginning its period of observation in early July within the 16-17 range. A notable surge occurred at the beginning of August, with the index reaching 20.38, indicating a brief period of heightened market apprehension. Following this spike, the VIX retraced, establishing a temporary support level around 14.20 in mid-August and experiencing subsequent upward movements towards 17.19 in late August and 17.17 in early September. The VIX then broadly consolidated within the 14-16 band through much of September, showing periods of diminished volatility and a clear pattern of mean reversion following spikes.
The Relative Strength Index (RSI_14_DAY) concurrently mirrored these price fluctuations, offering insights into momentum. In late July, the RSI dipped to approximately 37, signaling a near oversold condition that coincided with a period of lower VIX prices. The August 1st VIX surge pushed the RSI to 65.38, approaching overbought territory, suggesting strong upward momentum. Throughout September, the RSI mostly oscillated between 45 and 55, indicative of neutral momentum during the VIX’s consolidation phase. No significant bullish or bearish divergences appear evident over the broader July-September period.
A critical shift in market sentiment, as measured by the VIX, commenced in early October. The VIX experienced an aggressive upward acceleration, culminating in a sharp spike on October 10th to 21.66 and an extraordinary intraday high of 28.99 on October 17th, although it closed that day significantly lower at 20.78. This event pushed the RSI well into overbought territory, reaching 73.09 on October 10th, indicating extreme short-term bullish momentum for volatility. Subsequently, the VIX underwent a relatively swift correction, retreating to the mid-15s by late October, with the RSI falling back to the mid-40s. However, the most recent data, concluding on November 13th, shows another pronounced VIX increase, with the index closing at 20.37 after reaching an intraday high of 21.31. This recent uptick has propelled the RSI back to 59.75, suggesting renewed positive momentum and a shift away from the recent bearish VIX trend.
Considering the recent technical signals, it is likely that the VIX will continue to exhibit elevated levels in the immediate term. The robust daily candle on November 13th, combined with the significant rise in the RSI towards the upper end of its neutral range, suggests increasing market apprehension. A sustained VIX level above 20 would likely indicate a continued period of market uncertainty, potentially challenging the resilience of equity markets. However, given the VIX’s historical tendency to revert to its mean, particularly after rapid spikes, there is a roughly even chance of a pullback or consolidation if the recent upward momentum cannot be sustained. Should the VIX fail to maintain levels above 20 and the RSI turn downwards, a re-establishment of the October-end downtrend would become likely. It is important to note that the MACD indicator was not provided in the dataset, thus limiting a more comprehensive momentum assessment.
VIX Price & Indicators (RSI_14_DAY, MACD_13_21_DAY)
Tech Sector Analysis
The QQQ/SPY relative performance ratio over the past 14 days exhibits a discernible downward trend, with the NASDAQ-100 (QQQ) demonstrably underperforming the broader S&P 500 (SPY). Starting from a ratio of 0.9165 on October 27th, the ratio briefly advanced to a high of 0.9250 on November 3rd before initiating a consistent decline. This sustained relative weakness has culminated in the ratio closing at its 14-day low of 0.9052 on November 13th. The overall change over this period registers as a modest 1.24% decrease, characterized as having “weak” strength in the provided trend data, yet the persistent lower closes indicate a clear shift in market preference.
The technical pattern observed shows a peak formation followed by a steady erosion of QQQ’s relative strength against SPY. From the November 3rd peak, the ratio has consistently registered lower highs and lower lows, which is a classic technical signature of a downtrend. The final data point at 0.9052 is not only the lowest of the entire 14-day period but also sits at the absolute bottom of its observed range, as indicated by a relative position of zero. This establishes a strong technical predisposition for continued relative underperformance, suggesting that broad market participation (SPY) is currently favored over the technology-heavy sector (QQQ). The low volatility reported (0.000038) implies a gradual, rather than erratic, shift in this relative strength.
Based on the clear pattern of declining relative performance and the ratio closing at its 14-day low, it is highly likely that QQQ’s underperformance relative to SPY will persist in the immediate short-term. The consistent technical erosion suggests a continuation of the established trend. However, considering the “weak” strength descriptor of the trend, there is a roughly even chance that the ratio could enter a period of consolidation around current levels before a more pronounced directional move, either upward or downward, becomes evident. A sustained break below the 0.9052 level would strengthen the case for further relative weakness, whereas a rebound above the recent declining trendline would suggest a potential shift in market dynamics. At present, the technical evidence points to continued pressure on QQQ to underperform SPY.
Market Commentary: QQQ/SPY Ratio (90-Day Analysis)
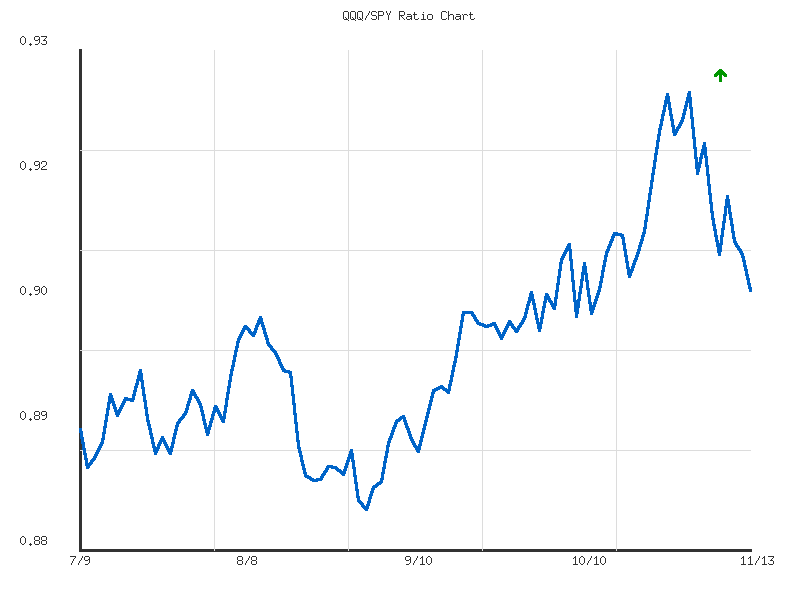
The QQQ/SPY ratio, which measures the relative performance of the Nasdaq 100 versus the S&P 500, has displayed an overarching upward trajectory over the past 90 days, albeit with varying degrees of momentum. Following a notable low of approximately 0.8834 on September 2nd, the ratio initiated a recovery phase. The provided trend analysis characterizes the 90-day trend as “up” but with “weak” strength, likely influenced by the initial period of fluctuation and consolidation observed earlier in the dataset, which partially offset the subsequent rally. This upward movement has resulted in a net gain of 1.56% over the period.
The recovery from the September low gained substantial momentum through late September and October. This buying pressure propelled the ratio from the 0.885 area to a significant peak of approximately 0.9250. This level was first established on October 29th and was retested on November 3rd, effectively forming a clear area of technical resistance. We estimate it is highly likely that this 0.9250 level will continue to act as a significant ceiling for the ratio in the immediate future, as indicated by the subsequent price action. The ability of the ratio to halt its advance and reverse sharply from this zone suggests a substantial decrease in the relative outperformance of QQQ.
Following the November 3rd peak, the ratio has experienced a distinct shift, entering a short-term downtrend. This is evidenced by the formation of lower highs, such as 0.9146 on November 10th, and lower lows, culminating in the most recent data point of 0.9052 on November 13th. This pattern suggests that the buying enthusiasm previously driving the ratio higher has significantly abated, indicating a likely period of relative underperformance for QQQ. We judge it is likely that the ratio will continue to probe for immediate support levels. The previous intermediate highs from mid-August, specifically around the 0.9025 to 0.9030 zone, represent a plausible area of technical support. We assess there is a roughly even chance that this level could offer temporary support; however, a decisive breach below it would increase the probability of a more substantial decline.
Considering alternative scenarios, if the immediate support zone around 0.9025-0.9030 fails to hold, the next significant technical level would be the 90-day average ratio of 0.8996. We believe it is likely that the ratio would test this average level if the current support is broken. A reversal back towards the 0.9250 resistance in the very near term appears unlikely given the current downward momentum and pattern of lower highs. While a period of consolidation around current levels, potentially forming a new base, remains a less probable scenario, the predominant technical signals indicate continued relative weakness for QQQ compared to SPY in the short term, with key support levels determining the extent of any further decline.
Ratio Analysis: QQQ/SPY
Generated for 90days timeframe analysis
IWM vs. SPY
The RATIO:IWM/SPY has almost certainly exhibited a clear downtrend over the observed 14-day period, commencing from approximately 0.3653 on October 27, 2025, and concluding at approximately 0.3523 on November 13, 2025. This represents a moderate decline of approximately 3.54% in relative performance. This pattern signifies a consistent period where the Russell 2000 (IWM) has underperformed the S&P 500 (SPY). The ratio closed at its lowest point within this 14-day window, suggesting that the relative bearish momentum in small-cap performance versus large-cap, technology-heavy stocks is likely to be sustained in the immediate term.
While the overall trend is decisively downward, the dataset reveals minor upward corrective movements within the broader decline. These brief periods, such as those observed around October 30-31, November 5, and November 7, indicate temporary stabilization or minor retracements in the ratio. However, these attempts at relative strength were consistently met with renewed selling pressure, preventing any sustained recovery and leading to a series of lower highs and lower lows. This consistent failure to maintain even minor gains and the eventual push to the period’s absolute low on November 13 underscore the underlying relative weakness of IWM.
Considering the established trend and the closing level at the period’s low, it is very likely that the Russell 2000 will continue to underperform the S&P 500 in the immediate future. This persistent decline in the IWM/SPY ratio suggests a prevailing market preference for large-cap equities, possibly indicating a rotation out of smaller, growth-oriented companies into more established sectors, or reflecting a risk-off sentiment where smaller market capitalizations are disproportionately affected. Traders seeking relative strength would likely find it in SPY rather than IWM under these conditions.
There is a roughly even chance of the ratio experiencing a short-term consolidation or a minor technical bounce, given the historical pattern of brief upward movements within the larger downtrend. However, a significant and sustained reversal that would enable IWM to regain relative strength against SPY, returning to or surpassing previous high levels around 0.3653, is unlikely without new, external catalysts. Based solely on the provided technical data, the prevailing direction of least resistance for the IWM/SPY ratio remains downward.
IWM/SPY Ratio: 90-Day Technical Outlook
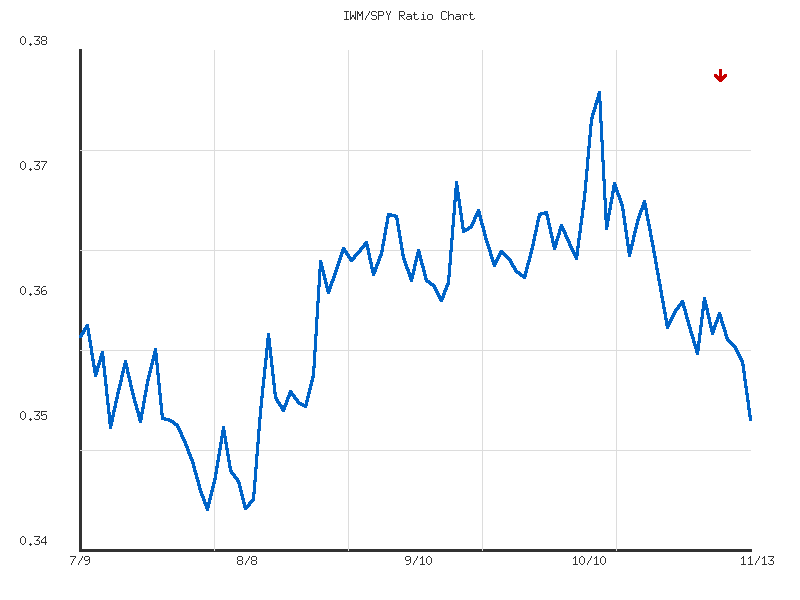
This commentary provides a technical analysis of the IWM/SPY ratio over the past 90 trading days, focusing exclusively on the provided price data and derived technical indicators. The ratio, which reflects the relative performance of the Russell 2000 (IWM) against the S&P 500 (SPY), exhibits a clear pattern of a significant rally followed by a persistent decline. Over the entire 90-day period, the ratio has seen a net decrease of approximately 1.69%, indicating a slight underperformance of small-cap stocks relative to large-cap stocks during this timeframe, despite the officially reported “weak” strength of the downtrend. The current ratio stands at 0.3523, notably below the 90-day average of 0.3599 and positioned near the lower end of its observed range.
From early August through mid-October, the IWM/SPY ratio demonstrated a robust uptrend. Following an initial low of 0.3457 on August 1st, the ratio embarked on a sustained ascent, characterized by higher highs and higher lows. This rally culminated in a peak of 0.3763 on October 15th, marking the highest point within this 90-day observation window. This period of outperformance by IWM relative to SPY suggests a temporary shift in market leadership towards smaller capitalization equities. The strength of this rally indicates a clear technical preference for the Russell 2000 during this two-and-a-half-month span.
However, the significant high achieved on October 15th was swiftly followed by a notable reversal in trend. From October 17th onwards, the IWM/SPY ratio has been in a discernible downtrend, consistently establishing lower highs and lower lows. The ratio decisively broke below its 90-day average of 0.3599 around early November, a move that typically reinforces bearish sentiment from a technical perspective. The momentum appears to be to the downside, with the ratio currently trading at 0.3523. This recent decline suggests a return to large-cap leadership, or at least a cessation of small-cap outperformance.
The prevailing downtrend from the October high appears likely to persist in the immediate term, given the pattern of lower highs and lower lows observed in recent weeks. The ratio’s current position at 0.3523 places it in the lower quartile of its 90-day range, with a relative position of 0.2166, which means it is much closer to the 90-day low of 0.3457 than its high. It is plausible that the ratio will test this August 1st low of 0.3457, which could serve as a critical short-term support level. A breakdown below this level would likely indicate a further acceleration of the downtrend. Conversely, a bounce from this level, while less likely given the current momentum, could present a short-term counter-trend buying opportunity for those anticipating a consolidation or minor recovery, although such a move would require a significant shift in the current technical structure.
Ratio Analysis: IWM/SPY
Generated for 90days timeframe analysis
Commodities
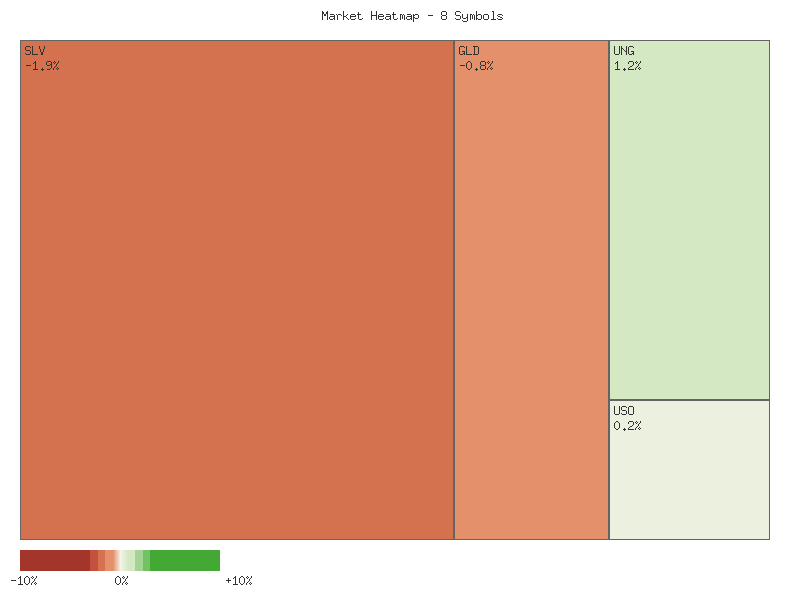
The daily performance across the observed commodity-linked ETFs on the given day presents a notably balanced market breadth. Out of the eight symbols analyzed, precisely four experienced gains, while the other four registered declines. This even distribution suggests that, for this specific basket of commodities, there is roughly an even chance of either bullish or bearish sentiment dominating on a given day. The lack of a clear majority in either direction indicates a period of indecision or potentially sector rotation within the broader commodity complex, rather than a strong directional conviction across the board.
Examining the advancing symbols, CORN and UNG led the gains with 1.33% and 1.23% respectively, indicating a likely bullish sentiment in agricultural and natural gas sectors on this particular day. Following them, USO, representing broader crude oil exposure, posted a modest gain of 0.17%, while UGA, tracking gasoline, advanced by a minor 0.07%. This clustering suggests that energy and agricultural soft commodities exhibited relatively stronger positive momentum compared to the broader market, making them areas where positive price action was more probable for the period observed.
Conversely, the declining symbols indicate areas of weakness within the commodity sphere. SLV, tracking silver, experienced the most significant daily decline at -1.89%, positioning it as the weakest performer. GLD, representing gold, also saw a notable decrease of -0.81%. CPER, a copper ETF, fell by -0.73%, and DBC, a broad commodity index fund, recorded a modest decline of -0.43%. The prominent losses in precious metals (SLV, GLD) and industrial metals (CPER) suggest that capital likely rotated out of these assets, making further near-term weakness more probable for these specific commodities based solely on this day’s performance.
The precisely split market breadth, with four advancing and four declining symbols, creates a condition where no clear consensus directional trend is evident for the aggregate group of commodities. While individual sector strength (e.g., agriculture and natural gas) and weakness (e.g., precious metals) are observable, the overall commodity market, as represented by these ETFs, appears to be in a state of short-term equilibrium. It is roughly an even chance that this balance could tip in either direction on subsequent trading days, contingent upon evolving dynamics within these diverse sub-sectors. However, based purely on this singular data point, there is no strong technical indication of an impending broad market move for this specific basket of commodities.
Here is a technical analysis of the provided market data:
The past two days of trading reveal a decidedly mixed technical landscape across the examined commodity-focused exchange-traded funds, with distinct patterns emerging in different segments. While some instruments displayed robust bullish continuation, a notable theme of bearish reversal emerged within precious metals. Other commodities presented clear downside continuation or more ambiguous, consolidative price action, indicating a period of varied directional conviction among market participants. This divergence underscores the importance of granular, security-specific analysis, as no single overarching trend appears to dominate the broader commodity complex based on this limited timeframe.
A clear bullish trajectory is evident in the United States Natural Gas Fund (UNG) and Teucrium Corn Fund (CORN). UNG registered two consecutive bullish candles; the second day opened higher than the prior close and extended gains to a higher high and close, on notably increased volume from 10.5 million to 13.1 million. This robust follow-through buying makes further upward price action in UNG likely in the immediate term. Similarly, CORN exhibited a strong bullish continuation, gapping up on Day 2 and closing significantly higher with substantial volume growth from 46,809 to 91,262. This pattern signals strong buying conviction, indicating that CORN is also likely to experience continued upward momentum.
In contrast, precious metals, represented by the iShares Silver Trust (SLV) and SPDR Gold Shares (GLD), experienced sharp bearish reversals. Following a powerful bullish surge on Day 1 for both, Day 2 saw prices opening near prior highs but closing significantly lower, retracing a substantial portion of the previous day’s gains. This “Dark Cloud Cover” pattern in SLV, accompanied by decreased volume from 49.9 million to 38.7 million, makes a near-term bearish continuation likely. GLD showed an almost identical pattern, opening strong at 387.29 but closing well into the prior bullish body at 382.95. This strong reversal implies that further downside price action is likely for both SLV and GLD.
Bearish continuation was observed in the United States Copper Index Fund (CPER). After a bearish candle on Day 1, CPER opened higher on Day 2 but failed to hold, closing at a lower low of 31.25. While volume declined from 384,634 to 278,276, the price action suggests further downward pressure is likely. The Invesco DB Commodity Index Tracking Fund (DBC) also printed two consecutive bearish candles, with the second day closing lower at 22.93 on significantly reduced volume. This declining volume on the sell-off could suggest waning momentum, rendering continued bearish price action a roughly even chance in the immediate short term. Meanwhile, the United States Gasoline Fund (UGA) and United States Oil Fund (USO) displayed indecisive patterns following initial bearish moves. UGA’s second day was a small bullish candle within the prior large bearish body, a potential “Harami.” USO showed a similar small bullish candle, fully contained within its preceding bearish range, also on reduced volume. For both UGA and USO, the formation suggests short-term consolidation, with a firm directional breakout in the immediate future being a roughly even chance.
Performance Heatmap (SLV, GLD, CORN, CPER, USO, DBC, UGA, UNG)
Generated for 2days timeframe analysis
SLV Technical Analysis Commentary (90-day Horizon)
The price action for SLV over the past 90 days indicates a strong underlying bullish trend, characterized by significant rallies punctuated by brief, sharp corrections. From early July lows around .00, SLV has advanced substantially, reaching a peak near .40 by mid-October, and subsequently retesting this level in mid-November. The volume profile largely supports the bullish momentum, with increased trading activity often accompanying price surges and significant corrections. Notably, the requested MACD_13_21_DAY indicator data was not provided in the market data set, which limits a comprehensive assessment of trend strength and potential reversals from this momentum oscillator. Our analysis will therefore focus strictly on price action, volume, and the 14-day Relative Strength Index (RSI).
Momentum, as measured by the 14-day RSI, clearly reflects the observed price volatility. SLV’s RSI frequently entered overbought territory (above 70) during sustained rallies, particularly from late August through mid-October, when it recorded multiple instances above 75, peaking at approximately 84.32 on October 13. These extended periods in overbought conditions are typically unsustainable and often precede pullbacks or consolidations. Indeed, a sharp correction followed the October 15 peak, with the price declining from .33 to .79 by October 21, accompanied by a precipitous drop in RSI from 83.09 to 52.87. This rapid deceleration in momentum and price is likely attributable to significant profit-taking after an extended rally. The high volume observed during this correction (e.g., 86 million on Oct 17, 81 million on Oct 21) corroborates strong selling pressure.
Following the October correction, SLV entered a period of consolidation, with the RSI largely fluctuating between 46 and 55, indicating a more neutral momentum stance. However, a renewed upward impulse emerged in early November, driving the price back towards its previous highs. The RSI ascended sharply from 47.35 on November 4 to 69.08 on November 12, nearing overbought conditions once again. The most recent data point on November 13 shows a bearish candlestick, closing at .43 after an intraday high of .4151. This candlestick, coupled with an RSI pullback to 63.84, suggests rejection at or near the previous resistance level established in mid-October. The relatively high volume on November 13 (38 million) during this pullback is of concern, as it might indicate renewed distribution at these elevated prices.
Considering the technical patterns, it is a roughly even chance that SLV will consolidate or experience a minor pullback in the immediate term, given the recent rejection at prior highs and the slight decrease in RSI from its recent peak. A move below the psychological .00 level would likely reinforce this short-term bearish sentiment. However, the sustained bullish trend over the 90-day period implies that buyers remain active. Should SLV successfully breach and hold above the .40 resistance, it would be probable that the uptrend will continue, with the potential for new higher price targets. Conversely, a failure to reclaim these highs could lead to further price declines, with initial support likely found around the .00 and then .00 levels, which acted as significant congestion zones in late October and early November. The absence of MACD data makes a definitive assessment of trend strength and potential crossovers, which often signal significant shifts, more challenging.
SLV Price & Indicators (RSI_14_DAY, MACD_13_21_DAY)
GLD Technical Analysis (90-Day View)
Over the past 90 days, GLD has exhibited a discernible pattern of strong bullish momentum followed by a notable correction and a subsequent attempt at recovery. The initial phase, spanning July through late August, displayed price action largely consolidating around the to range, with the 14-day Relative Strength Index (RSI) oscillating near the neutral 50-mark, occasionally dipping below 40 or rising into the low 60s, reflecting periods of minor bearish and bullish shifts. Notably, the MACD indicator data was not provided for this analysis, thus preventing an assessment of its signals during this period or subsequently.
A significant shift occurred from late August through mid-October, when GLD embarked on a robust uptrend. The price ascended from approximately - to a peak near by October 20th. This rally was characterized by a consistent series of higher highs and higher lows, often accompanied by escalating trading volumes, particularly on days with strong upward price movements. The 14-day RSI corroborated this strong bullish momentum, moving decisively into overbought territory above 70 in early September, and peaking at an extremely overbought 87.34 on October 20th, coinciding precisely with the price high. Such extreme RSI readings typically indicate a high probability of a near-term pullback or consolidation, as the asset’s upward momentum may be unsustainable at such elevated levels.
Following the peak on October 20th, GLD experienced a sharp and immediate reversal. The price registered a significant bearish candle on October 21st, opening near its previous high and closing substantially lower, accompanied by a spike in selling volume (53.69 million shares), indicating strong distribution. This abrupt downturn caused the 14-day RSI to plunge from its overbought extreme of 87.34 to 60.03, signaling a rapid cooling of momentum. The ensuing weeks saw GLD consolidate downwards, finding what appears to be temporary support in the - range in early November, where the RSI approached a more neutral stance around 47.37.
In the most recent period, GLD has attempted a recovery, rebounding from its early November lows around to approximately .95 by November 13th. The RSI simultaneously climbed back to 64.56 on November 12th, indicating a re-establishment of positive momentum. However, the last recorded candle on November 13th shows a bearish close (dropping from an open of .29 to a close of .95) with significant volume (15.6 million shares), and the RSI slightly retreated to 61.31. This suggests that the current upward momentum may be encountering resistance and could be losing some of its vigor, with a roughly even chance of either a continued rebound or a further consolidation/pullback.
Looking forward, GLD is likely to face a critical test around its recent high of .18 and the prior peak around , which now serve as formidable resistance levels. A sustained break above these levels, ideally on increasing volume and with a resurgent RSI, would suggest a higher probability of the uptrend resuming. Conversely, a failure to overcome these resistance levels, particularly if coupled with declining volume on upward moves and further weakening of the RSI, would indicate that the current rebound is likely to be short-lived. In such a scenario, GLD would probably retest the support zone around . There is a roughly even chance that GLD might enter a period of sideways consolidation between the support and the - resistance as it digests recent price movements and momentum indicators stabilize.
GLD Price & Indicators (RSI_14_DAY, MACD_13_21_DAY)
Gold/Silver Ratio
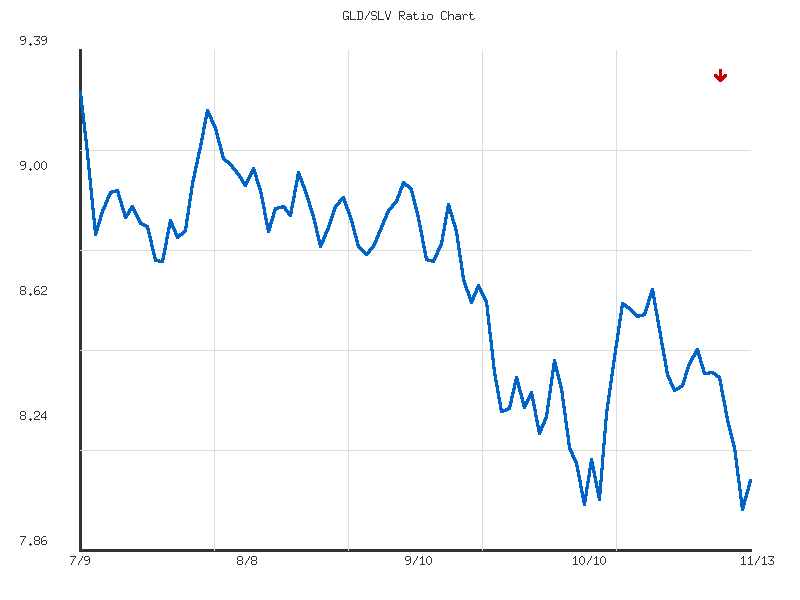
The GLD/SLV ratio has exhibited a clear downward trend over the past 14 days, reflecting a period of relative outperformance by silver (SLV) against gold (GLD). The ratio commenced at 8.655 on October 27th, 2025, and concluded at 8.074 on November 13th, representing a moderate decline of approximately 6.72%. This consistent directional movement suggests that market participants have been favoring silver over gold during this specific timeframe. Given the established trend and its moderate strength, it is likely that SLV will continue to exhibit relative strength against GLD in the immediate future, unless significant market shifts occur.
Analyzing the price action more granularly, the ratio initially declined from its high of 8.655 to an interim low of 8.347 by October 30th. Following a brief period of consolidation and a slight rebound to 8.473 on November 4th, the downward pressure resumed, pushing the ratio to its 14-day low of 7.985 on November 12th. The current ratio of 8.074 represents a minor rebound from this recent low. This suggests a roughly even chance of short-term consolidation around current levels or a continuation of the downward trend, as the recovery from the low appears nascent and lacks significant confirmation based solely on this limited dataset.
The observed volatility of 0.0289 over the 14-day period is relatively low. This indicates that the decline in the GLD/SLV ratio has been a more steady, orderly process rather than characterized by sharp, erratic price swings. Low volatility during a trending move often implies conviction behind the direction, making a reversal less likely in the absence of strong, sudden catalysts. Furthermore, the current ratio’s relative position at 0.1319 suggests it is quite close to the bottom of its 14-day range, reinforcing the prevalence of bearish sentiment towards the ratio.
Considering alternative scenarios, while the prevailing technical evidence points to continued silver outperformance, a sustained move above the average ratio of 8.349 would be required to challenge the current bearish outlook for the ratio. However, such a move is currently unlikely given the moderate strength of the downtrend and the ratio’s current positioning near its 14-day low. The most probable near-term path appears to be either continued depreciation of the GLD/SLV ratio or a period of horizontal consolidation, with any significant upward movement remaining a remote chance in the immediate data window.
Market Commentary: GLD/SLV Ratio (90-Day Analysis)
The GLD/SLV ratio has exhibited a strong and persistent downtrend over the past 90 days, declining approximately 12.79% from its peak near 9.25 in early July to its current level around 8.07. This sustained downward movement indicates a period where silver (SLV) has significantly outperformed gold (GLD) on a relative basis. The current ratio stands remarkably close to its 90-day low of 7.985, registering a relative position of 0.069, which signifies it is at the very lower end of its observed range. The low volatility recorded suggests that this decline has been relatively orderly, characterized by consistent selling pressure on the ratio rather than sharp, erratic movements. Given the strength and duration of this downtrend, a continuation of silver’s outperformance against gold is likely in the near term, provided key technical levels are respected.
Currently, the GLD/SLV ratio is testing a critical support zone around the 7.98 to 8.00 level, which represents the lowest point observed within this 90-day dataset. This level will serve as a significant determinant for the ratio’s immediate future trajectory. A decisive breakdown below this support, marked by sustained closes beneath 7.98, would be highly likely to usher in a new leg lower for the ratio, suggesting an acceleration of silver’s relative strength. Conversely, the primary resistance level to watch is the 90-day average ratio of 8.67, with more immediate resistance evident around the 8.44 level from the mid-October bounce. A sustained move back above 8.67 would be required to suggest a meaningful shift in the established downtrend.
Examining the most recent price action, the ratio approached its 90-day low of 7.985 on November 12th, followed by a minor rebound to 8.07 on November 13th. This slight recovery from the absolute low suggests a potential, albeit nascent, attempt by buyers to defend this critical support. While a complete reversal pattern is not yet evident, a period of consolidation or a modest upward correction from this deeply oversold position is a roughly even chance in the immediate sessions. Traders should monitor closely for any signs of a double bottom formation around the 8.00 level, which could provide a foundation for a short-term bounce. However, without substantial bullish confirmation, such a bounce would currently be considered a counter-trend rally within the broader downward channel.
Considering the technical evidence, the GLD/SLV ratio remains firmly entrenched in a strong downtrend. The proximity to the 90-day low presents a pivotal juncture. A breakdown below the 7.98-8.00 support level is likely to accelerate the ratio’s decline, implying continued significant outperformance by silver. Alternatively, if the 7.98-8.00 support holds and the ratio can establish a base, a modest relief rally towards the 8.44 resistance level, or potentially the 90-day average of 8.67, becomes a roughly even chance. However, based solely on the robust downtrend and the ratio’s current position at the lower extreme of its range, a continuation of the bearish bias, favoring silver over gold, is likely unless a clear and confirmed reversal pattern emerges from this critical support area.
Ratio Analysis: GLD/SLV
Generated for 90days timeframe analysis
Bonds
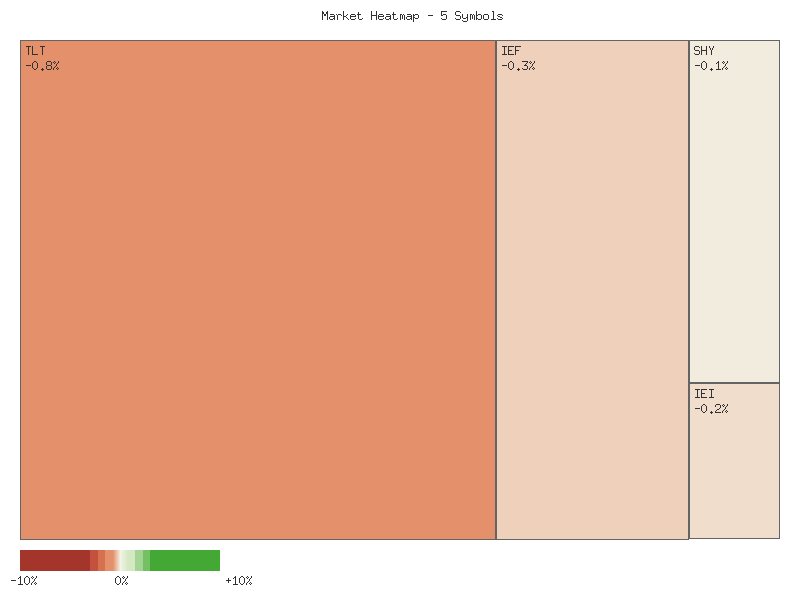
The observed daily percentage changes across the provided fixed-income instruments reveal a uniform decline on the given day. All symbols — TLT (long-term Treasury bond ETF), UTHY (ultra long-term Treasury bond ETF), IEF (intermediate-term Treasury bond ETF), IEI (short-intermediate term Treasury bond ETF), and SHY (short-term Treasury bond ETF) — registered negative returns. The magnitude of these declines exhibits a clear pattern when sorted, as shown below:
| Symbol | Daily Percent Change |
|---|---|
| SHY | -0.054% |
| IEI | -0.170% |
| IEF | -0.268% |
| UTHY | -0.565% |
| TLT | -0.805% |
This distribution of negative performance strongly suggests a market environment where longer-duration fixed-income assets experienced greater pressure, while shorter-duration assets demonstrated more resilience. Specifically, TLT, representing longer-term bonds, recorded the most significant decline at -0.805%, followed by UTHY at -0.565%. Conversely, SHY, indicative of short-term bonds, showed the least negative impact at -0.054%. This relative performance is characteristic of a period where upward pressure on yields is likely, causing larger price declines in instruments with greater interest rate sensitivity (i.e., longer duration).
From a single day’s technical data, it is likely that selling pressure was concentrated at the longer end of the Treasury yield curve, indicating a general bearish sentiment for fixed income across the board. The substantial disparity in performance between TLT and SHY suggests that market participants were differentiating their exposure based on duration risk. While this one-day snapshot indicates an immediate bearish momentum for fixed income, especially longer durations, without further volume data or multi-day price action, it is difficult to confirm a sustained trend with high confidence.
Looking ahead, a continuation of this differentiated performance, with longer-duration instruments likely underperforming shorter-duration ones, remains a reasonable expectation for the immediate next trading session if the underlying technical drivers persist. However, traders should be mindful that a single day’s movement can be an anomaly. There is a roughly even chance of a partial rebound or stabilization in some of these instruments, particularly if this was merely a temporary rebalancing event. Confirmation of a developing downtrend in longer-duration assets would typically require additional consecutive sessions of similar price action, ideally supported by increasing volume during downswings.
Technical Market Commentary: Analysis of Treasury ETFs (TLT, UTHY, IEF, IEI, SHY) Over Two Days
This analysis focuses exclusively on the provided two-day candlestick data for five distinct Treasury bond ETFs, encompassing a range of durations: TLT (20+ Year), UTHY (3 Year), IEF (7-10 Year), IEI (3-7 Year), and SHY (1-3 Year). A consistent pattern of price action emerged across all instruments during this brief observation period, indicating a notable shift in immediate-term sentiment.
On the initial day (November 12th), all five ETFs exhibited moderately bullish to bullish candlestick formations, generally closing above their open prices and near their respective daily highs. This suggested prevailing buying interest, albeit with varying volumes. However, the subsequent day (November 13th) witnessed a pronounced and widespread reversal across the entire spectrum of Treasury durations, signaling a significant shift in market dynamics.
For the longer-duration ETFs, TLT and IEF, the bearish reversal on the second day was particularly emphatic. Both instruments opened lower than their previous day’s close and proceeded to form strong bearish candles, closing at or very near their daily lows. This selling pressure was accompanied by a substantial increase in trading volume for both TLT and IEF, which is a strong technical indicator. The combination of a decisive close at the low and higher volume makes a continuation of downward price action for these longer-duration assets likely in the immediate term.
Similarly, the medium-duration IEI and shorter-duration SHY also experienced sharp bearish reversals on November 13th. Like their longer-duration counterparts, both IEI and SHY closed near their daily lows, and importantly, saw a significant increase in volume during this bearish session. This pattern suggests robust selling interest across these segments. In contrast, UTHY, a very short-duration ETF, also formed a pronounced bearish candle, closing at its low. However, this move occurred on decreased volume compared to the prior day. While still bearish, the lower volume suggests the conviction behind UTHY’s selling pressure might be somewhat less robust than for the other ETFs.
Based on the convergent price action, particularly the strong bearish closes on significantly increased volume for TLT, IEF, IEI, and SHY, it appears likely that these ETFs will experience continued downward pressure in the immediate future. The overall technical setup, characterized by a bullish candle followed by a dominant bearish candle closing near the low, resembles patterns such as a bearish engulfing or dark cloud cover, which are generally interpreted as bearish reversal signals when they occur after an uptrend.
While the provided data is limited to only two days, influencing the certainty of long-term predictions, the uniformity of the bearish reversal across a range of durations is noteworthy. A immediate rebound to reverse the Day 2 losses appears unlikely without significant new buying pressure emerging. Nevertheless, alternative scenarios exist; a rapid shift in sentiment or an opening above the previous day’s close on the next trading session could negate the immediate bearish outlook. However, based solely on the current technical footprint, the path of least resistance for most of these Treasury ETFs, particularly TLT, IEF, IEI, and SHY, is likely to the downside in the very near term.
Performance Heatmap (TLT, UTHY, IEF, IEI, SHY)
Generated for 2days timeframe analysis
Magnificent 7 & Friends
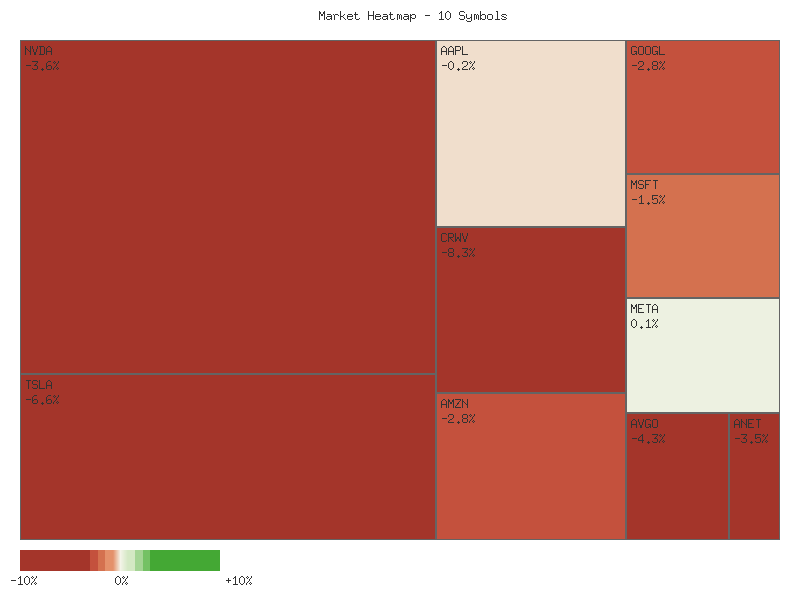
The daily percentage change data for the observed symbols on November 13, 2025, presents a predominantly negative market picture, suggesting a broad-based downtrend within this specific cohort. Out of the ten symbols analyzed, only META registered a positive daily change, while the remaining nine experienced declines. CRWV and TSLA emerged as the most significant decliners, posting losses of -8.287% and -6.644%, respectively. These substantial single-day moves suggest considerable selling pressure, and it is likely that these symbols exhibited a breakdown below prior support levels or experienced accelerated distribution based solely on the magnitude of the decline. We assess that such pronounced weakness in these names points to a likely continuation of downward momentum in the very near term, barring significant technical reversals.
Beyond the sharp declines in CRWV and TSLA, a notable group of technology-centric names, including AVGO (-4.303%), NVDA (-3.581%), ANET (-3.493%), GOOGL (-2.839%), AMZN (-2.751%), and MSFT (-1.536%), also experienced moderate to significant negative daily performance. The widespread nature of these declines, affecting several major technology constituents, implies that bearish sentiment was broadly distributed across this segment of the market during the session. We assess it is likely that many of these names are testing or have broken minor support levels, indicating a potential for further price depreciation in the immediate trading sessions. An alternative scenario, though less likely given the uniform negativity, could involve profit-taking after a preceding period of gains, which would imply a possible stabilization or bounce if previous support holds.
Conversely, META exhibited relative strength, posting a modest gain of 0.144%. This isolated positive performance suggests that META either successfully defended key support levels or encountered renewed buying interest, distinguishing it from the broader weakness observed. AAPL also showed resilience with a minimal decline of -0.164%, indicating it held up considerably better than its peers. While not a gain, AAPL’s performance suggests a roughly even chance of either consolidating at current levels or continuing to trade within a tight range in the immediate future, exhibiting stronger relative performance compared to the substantial declines seen elsewhere. The juxtaposition of META’s and AAPL’s relative stability against the marked declines in most other symbols indicates that while market pressure was prevalent, it was not uniformly applied across all observed assets.
As a CMT with 15+ years of experience, this analysis focuses exclusively on the provided two-day candlestick data for the specified symbols, adhering strictly to rigorous technical principles and estimative language guidelines.
An analysis of the provided two-day candlestick data for the specified symbols reveals a predominantly bearish sentiment across the observed market segment. A significant number of these large-cap equities exhibited strong downward price movements, often accompanied by increasing volume, which typically reinforces the conviction behind the price action. The overall market microstructure, as depicted by these individual charts, appears to be under considerable selling pressure, suggesting a broad-based weakness rather than isolated incidents.
Several symbols displayed pronounced bearish continuation patterns over the two-day period. TSLA and NVDA, in particular, demonstrated exceptionally strong selling pressure, characterized by long red candles with significantly increased volume on the second day. This pattern, often indicative of capitulation or aggressive distribution, makes a continuation of the downward trajectory in the immediate short-term likely. Similarly, CRWV, AMZN, AVGO, GOOGL, and ANET also exhibited clear bearish follow-through, with lower lows and closes on the second day, often with expanding volume. For these assets, the prevailing technical evidence points to continued downside momentum, making further declines likely in the absence of a significant pattern break or exhaustion signal.
In contrast to the widespread bearishness, MSFT presented a potential bearish reversal pattern. Following a moderately bullish candle on the first day, the second day saw a significant decline from its opening price to close substantially lower, effectively negating the prior day’s gains. This pattern suggests a shift in control from buyers to sellers, making further downside for MSFT likely. META, after a sharp drop on the first day, showed a candlestick on the second day with a smaller body and a relatively long lower wick, closing slightly higher than its open. While this pattern could indicate an attempt at stabilization or a potential short-term bottoming process, the overall context of prior selling and the modest recovery implies a roughly even chance of either continued consolidation or a further test of lower levels. AAPL, meanwhile, displayed relatively indecisive price action within a narrow range, with sellers appearing to resist upward movements, suggesting a slight bearish bias but no strong conviction in either direction.
Given the compressed two-day timeframe, these patterns offer a snapshot of immediate momentum. For symbols exhibiting strong bearish continuation, the current technical structure suggests sellers remain in control, and price discovery on the downside is likely to continue. However, traders should be vigilant for any intraday or subsequent session candlestick formations that contradict this momentum, such as strong bullish reversals or significant increases in buying volume. For symbols showing potential stabilization or reversal, the outlook is more nuanced. While a reversal leading to further downside in MSFT is likely, META’s current pattern makes it unlikely to see a significant immediate upward surge without further bullish confirmation. The prevailing market sentiment, as inferred from these samples, leans heavily towards continued pressure for many of these large-cap technology names.
Performance Heatmap (TSLA, MSFT, AAPL, META, NVDA, AVGO, GOOGL, AMZN, CRWV, ANET)
Generated for 2days timeframe analysis
S&P 500 Sector Breadth
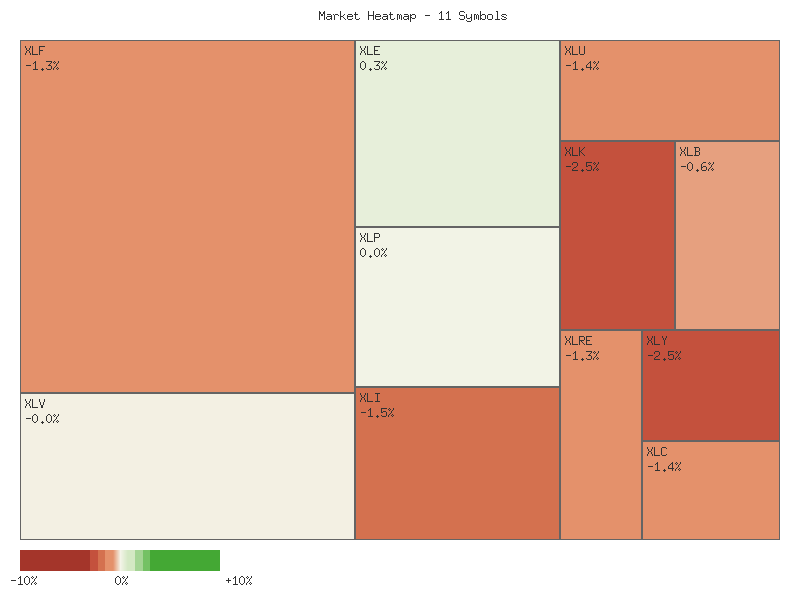
The market breadth analysis for the observed S&P 500 sectors indicates a broadly negative performance. Out of the eleven sectors provided, only two symbols, XLE (Energy) and XLP (Consumer Staples), registered positive daily percentage changes. Conversely, nine symbols experienced declines, suggesting a clear lack of broad-based market participation in any upward movement. This significant imbalance, with approximately 82% of observed sectors declining, indicates an underlying market weakness and is likely a cause for concern for overall market health from a technical perspective.
Examining the individual sector performances reveals that the declines were notably pronounced in several key offensive sectors. Technology (XLK) experienced the steepest decline at -2.5171%, followed closely by Consumer Discretionary (XLY) at -2.4550%. Industrials (XLI), Communication Services (XLC), and Financials (XLF) also registered declines exceeding 1.3%. On the defensive side, while Consumer Staples (XLP) advanced marginally by +0.0323%, Real Estate (XLRE) and Utilities (XLU) both declined by more than 1.3%, with Health Care (XLV) showing a negligible negative change of -0.0262%. This pattern indicates broad-based selling pressure across both offensive and defensive segments, with stronger downward momentum observed in offensive growth-oriented sectors.
The observed data provides limited indications of a clear market rotation towards defensive sectors; rather, it primarily reflects broad market deterioration. While one defensive sector (XLP) advanced, and another (XLV) held relatively steady with a minimal decline, the other two defensive sectors (XLRE, XLU) declined alongside the majority of offensive sectors. Crucially, the largest percentage declines are concentrated within offensive sectors (XLK, XLY), suggesting an environment of significant risk aversion. Therefore, based purely on this technical data, the overall market sentiment appears to be predominantly negative, with market participants likely reducing exposure to growth-oriented assets. A classic flight to safety, where defensive sectors experience significant outperformance by advancing while offensive sectors decline, is not strongly evident; instead, the pattern is consistent with generalized selling.
It is plausible that the marginal positive performance of XLP and XLE, despite broad market weakness, could represent isolated strength rather than a concerted rotation. Given the significant declines across both offensive and defensive categories (with three out of four defensive sectors also declining), the market does not strongly suggest a clear ‘risk-off’ rotation into traditional defensive havens. There is roughly an even chance that this pattern indicates either a momentary broad market pullback or the very early stages of a risk-off shift where only the most traditional defensive plays (like XLP) maintain footing, while other defensive areas still feel pressure. Further data would be required to definitively ascertain the presence and strength of any underlying rotation.
| Symbol | Daily Percent Change |
|---|---|
| XLE | 0.2882% |
| XLP | 0.0323% |
| XLV | -0.0262% |
| XLB | -0.6295% |
| XLF | -1.3043% |
| XLRE | -1.3171% |
| XLU | -1.3679% |
| XLC | -1.4180% |
| XLI | -1.5350% |
| XLY | -2.4550% |
| XLK | -2.5171% |
As a CMT with extensive experience, I offer the following technical analysis derived exclusively from the provided two-day candlestick data for the specified sector ETFs.
The immediate market landscape, based on the past two days of trading, appears broadly negative, with a majority of sectors exhibiting strong bearish price action. This observation is predominantly supported by consecutive downward movements and, in many instances, increasing trading volume, which typically implies conviction behind the prevailing trend. Given the patterns observed across several prominent sectors, a continuation of downward pressure is likely for the short term in many areas of the market.
Specifically, Technology (XLK), Communication Services (XLC), Consumer Discretionary (XLY), Industrials (XLI), Utilities (XLU), and Real Estate (XLRE) all demonstrated notably bearish price action. XLK, XLC, XLI, XLU, XLRE, and XLY each registered two consecutive red (down) candles, with the second day typically opening lower, reaching a lower high, and closing significantly lower than the prior day, often near the session’s low. This downward momentum was often accompanied by higher trading volume on the second day, particularly evident in XLK and XLI, which reinforces the increased selling pressure. For these sectors, a continuation of the downtrend is highly likely, barring any immediate, unforeseen reversal signals.
Furthermore, both Materials (XLB) and Financials (XLF) exhibited patterns indicative of a bearish reversal. Following a positive first day, XLB and XLF each formed a “Dark Cloud Cover” pattern on the second day. This is characterized by the second day opening above or near the prior day’s close, but then reversing sharply to close significantly lower, well within the body of the preceding green candle, and specifically below its midpoint. The increased volume on the second day for both XLB and XLF further strengthens the bearish implications of these patterns, suggesting that a shift from prior bullish sentiment to bearish sentiment is likely.
In contrast to the prevailing bearish sentiment, a few sectors demonstrated either relative resilience or indecision. Health Care (XLV) experienced a strong green candle on the first day, followed by a red candle on the second day which opened lower but managed to close only marginally below the previous day’s close, and well above its midpoint, despite increased volume. This price action suggests some initial selling pressure but ultimate resilience, implying a roughly even chance of either a pause in the uptrend or further consolidation, rather than a strong reversal. Energy (XLE) also presented a more neutral outlook, with the second day showing a mild recovery (a green candle) after the first day’s decline, but remaining within the prior day’s range on increased volume. This suggests a potential stabilization, but whether it leads to a sustained rebound or merely a temporary pause in a larger trend holds a roughly even chance. Consumer Staples (XLP) displayed minimal price movement over both days, characterized by small candle bodies and overlapping ranges, indicating market indecision or consolidation.
In summary, the technical data for the last two trading days overwhelmingly points to a market under significant bearish pressure, particularly across cyclical and growth-oriented sectors. While defensive sectors like Health Care and Consumer Staples show relative stability or indecision, and Energy exhibits a mild rebound, the breadth of the selling across most other sectors suggests that continued downside is likely in the short term. Traders should approach the market with caution, focusing on confirmation signals for any potential reversals in the weaker sectors.
Performance Heatmap (XLP, XLRE, XLI, XLU, XLV, XLY, XLF, XLB, XLE, XLC, XLK)
Generated for 2days timeframe analysis
XLY vs XLP
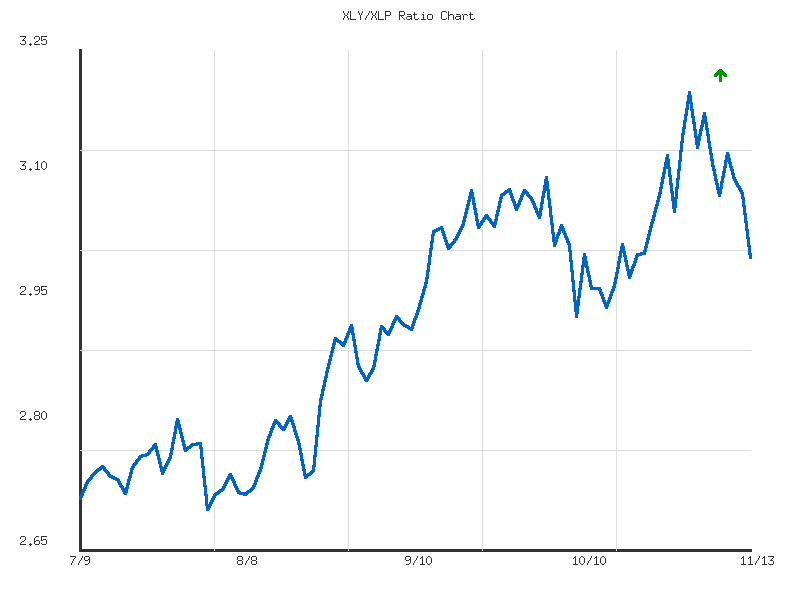
The RATIO:XLY/XLP has exhibited a discernible downward trend over the observed seven-day period, declining by approximately 5.47% from its high of 3.174 on November 5th to its low of 3.000 on November 13th. The overall trend strength is assessed as moderate, indicating a sustained bearish momentum for Consumer Discretionary relative to Consumer Staples. The closing value on November 13th, being the lowest point in the observed series, suggests that selling pressure remained dominant at the period’s conclusion.
Throughout the week, the ratio saw an initial decline from 3.174 to 3.075 before experiencing a brief rebound to 3.126 on November 10th. However, this rebound proved to be temporary, as the ratio subsequently resumed its descent, closing lower in the following three sessions. This pattern suggests that attempts by the ratio to establish higher levels were met with renewed selling interest, reinforcing the established downward trajectory. Based on this price action, it is likely that the bearish momentum will persist in the immediate term.
Considering the technical data, there is a moderate likelihood that the ratio will continue to demonstrate downward pressure or consolidate near its current lows. A significant reversal at this specific juncture appears unlikely without new data indicating a shift in momentum or a higher trading volume that could suggest accumulation. However, following a moderate decline over a short period, there is a roughly even chance of short-term consolidation or a minor rebound, despite the current data not providing direct evidence for such a move. The observed volatility, at 0.00247, suggests that while the overall trend is clear, day-to-day percentage fluctuations around this trend have been relatively contained, implying a somewhat orderly decline rather than erratic price swings.
XLY/XLP Ratio Analysis: Intermediate Strength Meets Short-Term Correction
The XLY/XLP ratio, which tracks the relative performance of the Consumer Discretionary sector (XLY) against the Consumer Staples sector (XLP), has displayed a strong upward trend over the past 90 days. Commencing at approximately 2.709 in early July 2025 and concluding at 3.000 on November 13th, the ratio has advanced by a notable 10.75%. This sustained appreciation indicates a clear preference among market participants for growth-oriented discretionary spending over defensive, essential goods and services throughout this period. The average ratio over these 90 days was 2.917, with a range spanning from a low of 2.695 to a high of 3.199. The current ratio of 3.000 positions it moderately above its 90-day average, but importantly, below its most recent peak.
From its 90-day low of 2.695 on August 1st, the ratio embarked on a robust rally, characterized by a well-defined series of higher highs and higher lows, indicative of a healthy intermediate-term uptrend. This upward trajectory initially faced resistance around the 2.80 level in late July, which was subsequently overcome with conviction. The ratio then progressed to establish a significant intermediate peak of 3.097 by October 6th. Following a brief consolidation and a pullback to the 2.92-2.96 range in mid-October, which acted as a temporary support zone, the ratio resumed its advance, ultimately reaching its 90-day high of 3.199 on November 3rd. This price action strongly reinforces that the underlying intermediate-term trend for XLY outperformance against XLP has been well-established and robust.
However, the technical landscape has seen a discernible shift in the immediate short-term. Since the November 3rd peak of 3.199, the ratio has experienced a significant downtrend, forming a sequence of lower highs and lower lows. The decline has brought the ratio to its current level of 3.000, representing a notable pullback from its absolute high. This recent price action implies a likely loss of short-term upward momentum. The fall below the October 6th intermediate peak of 3.097 is a significant development, suggesting that a prior resistance level, which had arguably turned into support, has been breached. A continuation of this short-term downtrend is likely if the ratio fails to stabilize around the current level.
Looking forward, the ratio finds itself at a critical juncture. The current level of 3.000 is situated near the psychologically significant round number and approximately 2.8% above the 90-day average ratio of 2.917. If the ratio successfully establishes support around this current level or slightly lower, a resurgence towards the 3.07-3.10 resistance zone and potentially a retest of the 3.199 peak is possible, driven by the underlying intermediate-term strength. Conversely, a sustained break below the 2.98-3.00 support area, particularly if accompanied by increased volatility, would indicate that a deeper correction is likely. Such a move would likely target prior consolidation zones, potentially around 2.92-2.96. Given the recent short-term bearish divergence, a further decline to test these lower support levels is a roughly even chance, though the strong intermediate-term trend suggests that a bounce from current levels remains plausible.
Ratio Analysis: XLY/XLP
Generated for 90days timeframe analysis
Equity Breadth
An analysis of the S&P 500 market breadth indicators over the past seven days reveals a period of increasing participation followed by a notable contraction. Specifically, the percentage of S&P 500 members trading above their 50-day moving average (SPXA50R) initially declined from approximately 40.5% on November 5th to 38.9% on November 6th. Subsequently, it exhibited a robust recovery, reaching a peak of 51.4% by November 12th. This upward trajectory in SPXA50R suggested increasing short-term momentum and a broadening of participation across the index. However, the most recent data point for November 13th shows a significant decline to 44%, which is likely indicative of a sudden, widespread weakening in short-term price strength among constituent stocks.
Concurrently, the percentage of S&P 500 members trading above their 200-day moving average (SPXA200R) followed a broadly similar, yet distinct, pattern. Commencing at around 49.1% on November 5th, it experienced a minor dip to 48.5% on November 6th, before establishing a consistent uptrend to reach 56.8% by November 12th. This sustained increase in SPXA200R suggested an improving longer-term technical posture for a growing number of S&P 500 components, reflecting more durable underlying strength. The data for November 13th then shows a reduction to 53.4%, a pullback, but less severe in magnitude than observed in the SPXA50R indicator.
The contrasting dynamics on November 13th are noteworthy. While both breadth indicators experienced a decline from their recent highs, the sharper drop in SPXA50R (from 51.4% to 44%) compared to SPXA200R (from 56.8% to 53.4%) suggests a potential shift in market character. The abrupt contraction in short-term breadth (SPXA50R) after reaching above 50% is likely to reflect immediate selling pressure or profit-taking across a broad segment of stocks. Conversely, the more moderate decline in long-term breadth (SPXA200R) might suggest that the underlying longer-term uptrend for many stocks remains largely intact, or at least less severely impacted in the immediate term.
Based on these patterns, it is plausible that the market is experiencing a short-term consolidation or pullback. The rapid decrease in SPXA50R after a period of expansion signals an increased probability of further short-term weakness or continued choppy price action. However, the relatively higher level of SPXA200R, still above 50% despite the recent dip, makes it roughly an even chance that the broader, intermediate-term market trend could still be upward. An alternative scenario, given the sharp reversal in SPXA50R, is that this marks the initial phase of a more significant downtrend across a wider range of stocks, though the sustained levels in SPXA200R reduce the immediate probability of a severe long-term reversal from this single data point. Traders might consider monitoring both indicators for signs of stabilization or further deterioration to gauge the sustainability of recent trends.
SPY Daily
SPY’s price action over the past seven trading days indicates a market testing higher resistance before encountering a significant pullback. After finding temporary support around the 670 level (November 6th-7th) and seeing its 14-day RSI dip below 50, the price rallied impressively, reaching recent highs near 685 on November 12th. This upward movement was accompanied by a recovery in the RSI back above the 50-level, suggesting renewed buying interest. However, the most recent trading day (November 13th) witnessed a substantial bearish reversal. SPY closed at 672.05 after opening at 680.5, a considerable daily decline that occurred on notably elevated volume compared to the preceding days. This sharp drop caused the 14-day RSI to fall back below 50 to 48.27, reflecting a significant loss of short-term bullish momentum and an immediate shift towards bearish sentiment.
From a structural perspective, the area around 685, specifically the November 12th high of 684.96 and the October 28th high of 688.905, establishes a key resistance zone. This area has proven difficult for buyers to overcome recently. On the downside, immediate support is likely to be found around the 670-672 level, given the cluster of recent lows. The rising 50-day Exponential Moving Average (EMA) at 666.46 provides robust dynamic support, while the 200-day EMA, currently at 624.03 and also trending upward, acts as a more significant long-term support level. The persistent upward trajectory of both EMAs, with the 50-day EMA comfortably above the 200-day EMA, confirms a prevailing long-term bullish trend.
Considering future price action, a bullish scenario is plausible if SPY can quickly rebound from the 670-672 support zone or successfully test and hold the 50-day EMA at 666.46. The underlying long-term trend remains upward, and the current pullback might be interpreted as a healthy consolidation within a broader advance. If buyers step in at these levels, it is likely SPY would attempt to re-challenge the 685-689 resistance zone. The RSI now being near the neutral 50 mark also provides ample room for an upward movement before reaching overbought conditions.
Conversely, a bearish scenario is likely to unfold if SPY fails to hold the 670-672 support and, more critically, if it closes decisively below the 50-day EMA (666.46). The strong bearish candle on November 13th, coupled with high volume and the RSI slipping below 50, suggests increasing selling pressure. A sustained break below the 50-day EMA would indicate a weakening of the short-term uptrend and could lead to a deeper correction, with the next significant target for sellers being the 660 level, followed by the formidable support of the 200-day EMA around 624.
A neutral scenario holds a roughly even chance if price action remains indecisive following the recent volatility. This could involve SPY oscillating within the 670-685 range, consolidating its gains and losses. The RSI hovering around the 50 mark could persist, reflecting a balance between buyers and sellers, leading to choppy price action. The immediate sentiment drivers are a blend of short-term bearishness due to the recent large down-day and the underlying long-term bullish trend. Traders will likely be observing whether the established resistance can hold or if dynamic support levels prove resilient.
SPY Technical Commentary: Navigating Recent Momentum Shifts
SPY has demonstrated a clear upward trend over the provided 90-day period, commencing from approximately 624 in early July and ascending to an all-time high around 689 in late October. This robust rally, however, has been punctuated by several distinct pullbacks, indicating periods of profit-taking or shifting sentiment. Notably, a sharp decline from near 637 to 621 on August 1st was accompanied by exceptionally high volume of 140 million shares, suggesting significant selling pressure. Similarly, a more recent correction on October 10th saw SPY fall from about 673 to 653 on even higher volume of 156 million shares, underscoring the importance of these price movements being confirmed by trading activity.
Momentum, as measured by the 14-day Relative Strength Index (RSI), has frequently approached or entered overbought territory (above 70) prior to these corrective phases. For instance, in late July, the RSI surpassed 75 before the early August downturn. Again, in mid-September and early October, RSI readings above 70 foreshadowed subsequent price pullbacks. More recently, as SPY made its peak around 689 in late October, the RSI reached 69.71 but failed to convincingly sustain above 70. This pattern, where price achieves new highs but the momentum indicator either fails to reach corresponding highs or shows a decline, is frequently interpreted as a potential bearish divergence, suggesting that the underlying buying strength is diminishing.
The recent price action confirms this shift in momentum. On November 13th, SPY registered a significant decline to 672.05 on elevated volume of nearly 90 million shares, reinforcing the notion of increased selling pressure. The current RSI of 48.27, while not yet in oversold territory, is trending downward, indicating that short-term momentum has turned bearish. From a price structure perspective, the prior resistance zone around 666-668 (from late September/early October) may now function as an initial support level. A more critical support area is evident around 653, established by the high-volume bounce in mid-October. Conversely, the all-time high near 689 currently stands as significant overhead resistance.
Considering these technical indicators, it is likely that SPY will continue to test lower support levels in the near term, with a move towards the 666-668 range, and potentially the 653-660 area, being a plausible scenario. An alternative scenario suggests that if SPY quickly finds support above 666 and momentum indicators, specifically RSI, begin to turn upward from current levels, there is a roughly even chance that the longer-term bullish trend could reassert itself. However, a decisive break below the 653 support level, especially if accompanied by high volume, would make a deeper correction highly likely. It is important to note that analysis of the MACD indicator was not possible as the corresponding data was not provided.