Daily Market Technical Analysis
The market presents a divergent technical picture with bearish signals for growth and small-cap segments. QQQ, IWM, and IJR show strong bearish reversal patterns, making a short-term downside correction highly likely. Conversely, mid-cap (MDY) and larger-cap (SPY) indices exhibit resilience, with SPY likely to retest recent highs. Precious metals (SLV, GLD) demonstrate robust bullish momentum, indicating highly likely continued upside, while energy components (USO, UGA) face highly likely further downward pressure. Longer-duration bonds (TLT, IEF) are likely to extend upward, whereas shorter-duration bonds (SHY, IEI) face a roughly even chance of consolidation or slight retracement. Expanding equity breadth indicators (SPXA50R, SPXA200R) suggest improving market health, making a rapid deterioration highly unlikely.
Market Indices
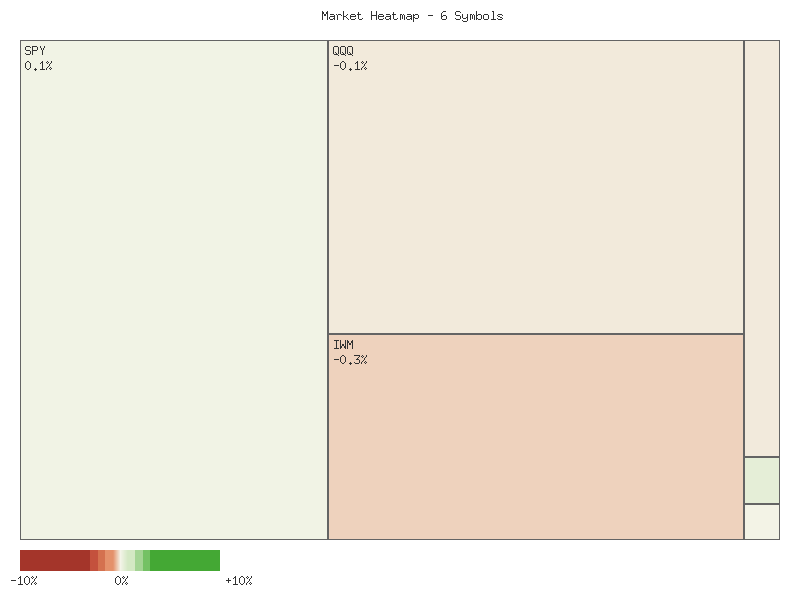
The daily performance across the selected broad market and market capitalization-specific ETFs for the current period presents a picture of notable divergence and balanced sentiment. The following matrix summarizes the daily percentage change for each symbol, sorted in descending order:
| Symbol | Daily Percent Change |
|---|---|
| MDY | 0.342% |
| SPY | 0.061% |
| OEF | 0.023% |
| IJR | -0.071% |
| QQQ | -0.076% |
| IWM | -0.256% |
Analysis of market breadth indicates a roughly even chance of indecision among these select indices. Three symbols (MDY, SPY, OEF) experienced positive daily percentage changes, while three symbols (IJR, QQQ, IWM) registered declines. This even split suggests an absence of a strong, broad-based directional movement in the overall market, as represented by these exchange-traded funds. It is unlikely that such balanced breadth would precede an immediate robust market surge or a significant downturn without further confirmation.
The performance across market capitalization segments shows some notable contrasts. The Mid-Cap 400 (MDY) demonstrated the strongest positive movement, advancing by 0.342%. This strength in the mid-cap space, juxtaposed with minor gains in the S&P 500 (SPY) and S&P 100 (OEF), suggests that larger capitalization indices experienced a comparatively subdued positive day. Conversely, Small-Cap 2000 (IWM) recorded the most significant decline, dropping by 0.256%. This divergence, where mid-caps outperform large-caps and small-caps underperform, possibly indicates a selective rotation of capital or varying levels of investor confidence across different company sizes.
Furthermore, the technology-heavy Nasdaq 100 (QQQ) and Small-Cap Growth (IJR) both experienced slight declines, with QQQ’s drop marginally exceeding that of IJR. These minor negative movements, alongside the underperformance of small-cap value (IWM), could signal a period of cautious sentiment in growth-oriented and smaller capitalization segments. While the individual percentage changes are relatively small, collectively, they paint a picture of a market day characterized by low volatility and a struggle for clear directional dominance, with a high probability of continued short-term consolidation or range-bound trading if these patterns persist.
As a Chartered Market Technician with 15+ years of experience, I’ve analyzed the provided two-day market data for SPY, QQQ, IWM, IJR, MDY, and OEF using rigorous technical analysis principles. The candlestick patterns and volume profiles indicate a mixed but predominantly cautionary outlook for the immediate short term.
The market data across the provided ETFs over the past two trading days presents a mixed picture, indicative of a potential short-term inflection point. While some indices posted marginal gains, a significant portion displayed candlestick patterns and volume profiles suggesting a loss of upward momentum or outright short-term reversals. Notably, QQQ exhibited a strong bearish reversal on day two. Following a significant gap up, price sold off from its open high to close below the prior day’s close, forming an “open-equals-high” pattern on increased volume. This strong bearish indicator makes a short-term downside correction highly likely. Similarly, IWM and IJR also showed considerable weakness, gapping higher but facing substantial selling pressure to close below prior day’s closes on increased volume. These “Dark Cloud Cover” or “Bearish Engulfing” type formations strongly suggest upward momentum in small-caps faces considerable headwinds, rendering a near-term pullback probable.
The broader market bellwether, SPY, despite a marginally higher close on day two, displayed signs of weakening bullish conviction. SPY gapped up and made a slightly higher high, but subsequent pullback resulted in a smaller body candle closing near its daily range’s middle. This pattern suggests reduced buying conviction at elevated levels, despite increased volume. OEF similarly gapped up, with its open marking the day’s high (“open-equals-high”). Despite a marginally higher close, significant intraday selling pressure, coupled with decreased volume, indicates a likely exhaustion of buying power. Sustained upward movement for both SPY and OEF in the immediate short-term is unlikely without fresh catalysts.
In contrast, the S&P MidCap 400 proxy, MDY, demonstrated notable relative strength. On day two, MDY gapped up significantly, with its open price matching its daily low (“open-equals-low”)—a pattern typically associated with strong bullish sentiment. It proceeded to make a new high and closed higher than the prior day, on increased volume. This behavior suggests mid-cap stocks are experiencing sustained buying interest, exhibiting resilience against observed selling pressure elsewhere. We assess it is likely that MDY could continue to outperform other segments in the immediate term, potentially drawing capital rotation.
Overall, the technical data points to an immediate-term market environment characterized by increasing bearish pressure, particularly in growth (QQQ) and small-cap (IWM, IJR) segments. A short-term consolidation or pullback for the broader market is probable based on these candlestick reversals and volume shifts. However, an alternative scenario where MDY’s continued strength could potentially stabilize the broader market, leading to a rotation into less extended sectors, represents a roughly even chance. Traders should closely monitor follow-through actions, especially for QQQ and IWM, to confirm bearish reversal patterns and observe if MDY’s relative strength persists.
Performance Heatmap (SPY, QQQ, IWM, IJR, MDY, OEF)
Generated for 2days timeframe analysis
SPY Technical Analysis: Nov 12, 2025
The SPY ETF has exhibited a clear intermediate-term uptrend over the past 90 days, characterized by a series of higher highs and higher lows. This upward trajectory commenced from price levels around in early July and has extended to the current trading range near . Significant upward movements were observed in late July, mid-August, and throughout September into early October. Volume analysis indicates generally active trading during both rallies and notable pullbacks, suggesting broad market participation in these price movements. Key periods of intensified volume, such as the sharp decline on August 1st and the more pronounced drop on October 10th, suggest moments of increased selling pressure within the broader bullish context, but these were typically met with subsequent buying interest leading to recovery.
Momentum analysis, as indicated by the 14-day Relative Strength Index (RSI), largely corroborates the price action. During periods of strong upward price movement, the RSI frequently entered overbought territory (above 70), notably in late July, mid-September, and early October. These instances of overextended momentum were often followed by minor price pullbacks, which brought the RSI back into more neutral ranges (between 40 and 60). For example, the significant price decline on October 10th, which saw SPY drop from approximately to , was accompanied by the RSI falling from over 70 to around 41, indicating a rapid loss of bullish momentum but not reaching oversold conditions. The RSI’s bounce from these lower levels generally corresponded with price recovery, confirming underlying demand.
In the more recent short-term, SPY achieved a peak near on October 28th, following a robust rally where the RSI again approached the overbought threshold, reaching approximately 69. Following this high, the ETF experienced a moderate pullback, with the price declining to a low of .31 on November 4th. This retracement was mirrored by the RSI, which fell to approximately 48 on November 6th and 7th, signaling a de-escalation of buying pressure and resetting momentum. Subsequently, the price has rebounded firmly, closing at .285 on November 12th, with the RSI now recovering to just under 60.
Given the observed patterns, it is likely that SPY will attempt to retest the recent high established around in the near term, supported by the recovering RSI momentum. A sustained move above this level would very likely signal a continuation of the intermediate-term uptrend toward new highs. However, a failure to decisively break above could indicate a period of consolidation or a deeper pullback. In such an alternative scenario, a retracement to the support established around - (the lows of early November) is a roughly even chance, particularly if buying volume diminishes. A breach below this support would raise the probability of a test of the level (early November’s lower trading range) or potentially the more significant support zone around the October 10th open/close levels in the - range, though this appears less likely in the immediate future without a strong catalyst.
SPY Price & Indicators (RSI_14_DAY, MACD_13_21_DAY)
QQQ Technical Analysis: Q4 2025 Outlook
This analysis focuses on the 90-day daily price action and 14-day Relative Strength Index (RSI) for QQQ, spanning from early July to mid-November 2025. It is important to note that while MACD data was requested, it was not provided in the market data for analysis, and thus our conclusions are based solely on the available price and RSI information. Over the observed period, QQQ has exhibited a robust underlying uptrend, characterized by a series of higher highs and higher lows, climbing from approximately in early July to a recent peak near in late October. Significant upward momentum was evident throughout much of this period, punctuated by notable corrections. The October 10th session stands out with a substantial price drop from .70 to .50, accompanied by a considerable increase in trading volume, suggesting strong selling pressure emerged at that point, which was subsequently absorbed.
The 14-day Relative Strength Index (RSI) has largely confirmed the prevailing bullish momentum, frequently residing in or pushing into overbought territory (above 70) during periods of strong price appreciation. For instance, in July, the RSI spent a considerable amount of time above 70, peaking near 73.11 on July 28th, shortly before a price pullback in early August. Similar overbought conditions were observed in mid-September (RSI peaked at 75.35 on September 22nd) and again in late October (RSI reached 71.73 on October 29th). These excursions above 70 were often followed by periods of price consolidation or minor pullbacks, indicating a cooling-off of buying enthusiasm rather than signaling significant trend reversals within this timeframe. The sharp decline on October 10th saw the RSI plummet from 69.27 to 45.42, underscoring the rapid shift in short-term momentum during that specific correction.
More recently, QQQ experienced another notable pullback from its October 29th high of .77, with the price descending to .69 by November 6th. This price action was mirrored by a corresponding drop in the RSI from an overbought reading of 71.73 on October 29th down to 47.97 by November 7th. This movement suggests a significant reduction in short-term buying pressure, likely facilitating a necessary re-equilibration of the market. Since November 7th, the price has seen a modest rebound, closing at .04 on November 12th, with the RSI recovering slightly to 54.55. While this bounce from near oversold territory suggests some renewed buying interest, the RSI remains in neutral territory.
Considering the established uptrend and the RSI’s current neutral positioning after a significant pullback, a retest of the recent highs around is likely in the near-to-medium term, provided the RSI can sustain its upward trajectory and cross back above 60. A successful breakout above the level would be a strong indication of continued bullish resolve and open the path for further price appreciation. However, should buying interest wane and the RSI fail to gain momentum, or if price breaks below the - zone, which acted as a support area in early November, a further retracement towards the - support zone (observed after the October 10th drop) is a roughly even chance. A sustained break below this support, especially if accompanied by elevated volume and a drop in RSI below 40, would make a deeper correction likely, potentially challenging the overall bullish trend observed in the 90-day window.
QQQ Price & Indicators (RSI_14_DAY, MACD_13_21_DAY)
IWM Technical Analysis: Navigating Recent Volatility within a Broader Uptrend
Over the past 90 days, the iShares Russell 2000 ETF (IWM) has demonstrated a pronounced bullish trend, steadily advancing from its early July levels in the low to establish significant highs above in mid-to-late October. This upward trajectory has been characterized by a series of higher highs and higher lows, reinforcing the underlying strength of the trend. Key resistance points were firmly established at .77 on October 15th and subsequently at .21 on October 27th. These price ceilings have proven to be formidable barriers, with IWM thus far unable to sustain a breakout above them. Conversely, a notable dip to .92 on August 1st acted as a critical support level, marking the base for a robust subsequent rally.
The most recent price action indicates IWM is undergoing a short-term correctional or consolidative phase following its late October peaks. From the high of .21, the ETF experienced a discernable decline, finding preliminary support around .36 on November 6th. A subsequent bounce led to a close of .63 on November 12th. The - range is likely to function as immediate support, given the recent rebound from these levels. Overhead, the - area, which previously saw selling pressure, is anticipated to serve as immediate resistance. A sustained break above this zone would then shift focus to the more substantial - resistance cluster. The appearance of a relatively small-bodied candlestick on November 12th, closing lower after opening higher, suggests a roughly even chance of continued consolidation or a slight downward bias in the very near term.
The 14-day Relative Strength Index (RSI) generally corroborated the bullish price movements throughout the analyzed period. The RSI largely remained above the 50-level, signifying bullish momentum, and on occasion, it ventured into overbought territory, such as the 71.23 reading on September 18th. These overbought conditions frequently preceded periods of consolidation or price pullbacks. During significant price corrections, the RSI dipped into the low 40s (e.g., 41.36 on August 1st, 44.97 on October 10th, and 44.93 on November 4th), indicating a temporary deceleration of buying momentum but stopping short of traditional oversold conditions (below 30). The current RSI reading of 49.35 on November 12th suggests a roughly neutral momentum, positioned just below the centerline, indicating neither strong bullish nor bearish sentiment at this moment.
Volume analysis provides a mixed yet informative perspective on recent price movements. Elevated trading volumes were observed during several notable upward surges, reinforcing the conviction behind those advances. However, equally significant volume spikes coincided with sharp downward corrections, such as on October 10th (.67M) and October 29th (.44M), which suggests strong selling pressure contributing to these declines. The trading volume on November 12th (.76M) is approximately average, offering limited conviction regarding the sustainability of the recent rebound. Considering the neutral RSI and the current price hovering near potential support, a period of continued range-bound trading, possibly between and , has a roughly even chance. A definitive break below the support, particularly if accompanied by an increase in selling volume, would make a decline towards the .56 level highly likely, potentially challenging the broader uptrend. Conversely, a decisive move above , especially with renewed buying volume, would increase the likelihood of IWM retesting the - resistance zone.
IWM Price & Indicators (RSI_14_DAY, MACD_13_21_DAY)
VIX Fear Index
The VIX experienced a period of moderate volatility followed by a discernible downward trend over the observed seven days. From an opening of 19.73 on November 4, the index initially declined, finding temporary support near the 17.31 level on November 5 before staging a strong rally on November 6, closing at 19.67. This bullish surge was met with significant selling pressure on November 7, where the VIX printed a high of 22.72 but ultimately closed lower at 19.23, forming a candlestick pattern suggestive of rejection at higher price levels.
Following the high on November 7, the VIX entered a clear downtrend. Over the subsequent three trading days (November 10-11), the index consistently registered lower closes and new lows, descending from 19.23 to 17.25. This sustained decline indicates prevailing bearish sentiment and a lack of significant buying interest to stem the fall, pushing the VIX towards levels last seen at the lower boundaries of the observation period. The consistent formation of lower lows and lower closes during this segment reinforces the established bearish trajectory.
On November 12, the VIX opened at 17.21 and quickly printed a new short-term low of 17.10. However, buying interest emerged, pushing the price higher to close at 17.48, representing a 1.33% daily gain. This price action formed a small bullish candle with a notable lower wick, suggesting that the initial selling pressure at the new low was absorbed, and demand entered the market. While this single candle pattern, resembling a hammer, typically implies a potential reversal or exhaustion of selling, the absence of volume data for the entire period significantly limits our ability to confirm the strength of this price action.
Considering the recent price action, there is a roughly even chance that the VIX may experience a temporary abatement in its downward momentum, potentially entering a period of consolidation or a short-term bounce from the 17.10-17.25 support zone. However, it is also plausible that this bullish candle represents merely a brief pause before the established downtrend resumes, particularly given the lack of robust confirmation from volume. Further price action above 18.00 would be required to suggest a more committed short-term reversal, while a break below the 17.10 low would strongly imply a continuation of the bearish trend.
As a Chartered Market Technician with over 15 years of experience, I offer the following technical analysis of the VIX index, based strictly on the provided 90 days of price and indicator data.
The VIX index has displayed a volatile yet broadly upward trajectory over the past 90 days, characterized by a pattern of sharp, short-lived spikes followed by retracements. This analysis will strictly adhere to the provided VIX price action and the 14-day Relative Strength Index (RSI). It is crucial to note that the MACD (13, 21-day) indicator, while requested in the charting instructions, was not supplied in the accompanying market data and therefore cannot be incorporated into this assessment.
Throughout the analysis period, the VIX exhibited distinct phases. Early July witnessed a decline from approximately 17.41 to a low of 14.93 by July 25. This was succeeded by a significant surge, closing at 20.38 on August 1. A subsequent retracement saw the VIX generally trend lower through August, establishing temporary support near the 14.20-14.30 level. A second major spike occurred in early September, reaching 17.17, followed by another retreat. The most pronounced volatility surge unfolded on October 10, with the VIX closing at 21.66 and recording an intra-day high of 22.44. While an intra-day high of 28.99 was observed on October 17, a substantial pullback ensued, indicating strong resistance at extreme levels. Following this, the VIX again retraced, finding support around the 15.60-16.00 range in late October. The VIX has recently shown renewed upward momentum, closing at 17.48 on November 12.
The 14-day RSI offers critical insights into momentum. During the initial VIX decline in July, the RSI remained mostly below 50, reflecting subdued upward momentum. The sharp VIX spike in early August propelled the RSI to 65.38, approaching, but not decisively crossing, overbought territory. The October 10 spike, however, saw the RSI breach the 70 threshold, reaching 73.09. This strongly suggests an overbought condition, which was promptly followed by a VIX retreat, supporting the interpretation that this level represented a temporary exhaustion of buying pressure. The subsequent VIX decline in late October correlated with the RSI dipping into the low 40s (e.g., 43.49 on October 27), signaling waning momentum. As of November 12, the RSI stands at 49.15, indicating neutral momentum, with neither buying nor selling pressure currently dominant.
Considering the VIX price action and the RSI, it is likely that the VIX continues to operate within a broadly upward-sloping channel, characterized by intermittent spikes. The recurrent pattern of sharp rallies followed by significant pullbacks, particularly after the RSI crosses into overbought territory, suggests that extreme volatility readings are unlikely to sustain for extended periods. The current VIX level of 17.48, combined with a neutral RSI, suggests a roughly even chance of either a continued modest ascent or a near-term consolidation or minor pullback. A retest of the late October support levels (15.60-16.00) is a plausible alternative scenario if downward momentum develops, especially if the RSI were to decline below 40. Conversely, a decisive break above the 19.00-20.00 resistance area would likely be accompanied by the RSI moving above 60, signaling renewed upward momentum and an increased likelihood of challenging the August and October highs.
VIX Price & Indicators (RSI_14_DAY, MACD_13_21_DAY)
Tech Sector Analysis
Over the past 14 days, the relative performance ratio of QQQ to SPY has broadly maintained a “sideways” trend, as indicated by the provided technical data. This suggests that neither the technology-heavy NASDAQ-100 nor the broader S&P 500 has established a significant and sustained directional lead during this specific period. The ratio has traded within a narrow observed range, peaking at 0.9250 on November 3rd and reaching a low of 0.9088 on November 7th, with the most recent reading at 0.9089 on November 12th. The recorded “weak” strength in this sideways trend, coupled with very low volatility (0.00003), reinforces the observation of a consolidation phase in relative performance rather than a definitive trend for either index.
While the overall 14-day trend is characterized as sideways, a closer examination of the recent data points reveals a subtle shift in momentum. From its high of 0.9250 on November 3rd, the ratio has generally trended downwards, culminating in the current reading near the lower boundary of its recent range. This implies that QQQ has likely experienced a period of relative underperformance against SPY over the latter part of this 14-day window. The -0.25% change in the ratio over the full period, combined with the current ratio being only marginally above the low, underpins this observation.
Considering the ratio’s current position near its 14-day low, there is a roughly even chance of either a continuation of the slight downward pressure or a near-term bounce back toward the average ratio of 0.9167. A decisive break and sustained trading below the 0.9088 support level would likely signal an intensification of QQQ’s relative underperformance, potentially shifting the overall technical picture from “sideways” to a more definitively negative relative trend. Conversely, a sustained advance back above the average ratio, particularly with increasing momentum, would suggest a re-establishment of relative strength for QQQ or at least a return to the midpoint of its established trading range.
Technical Analysis: QQQ/SPY Ratio (90-Day View)
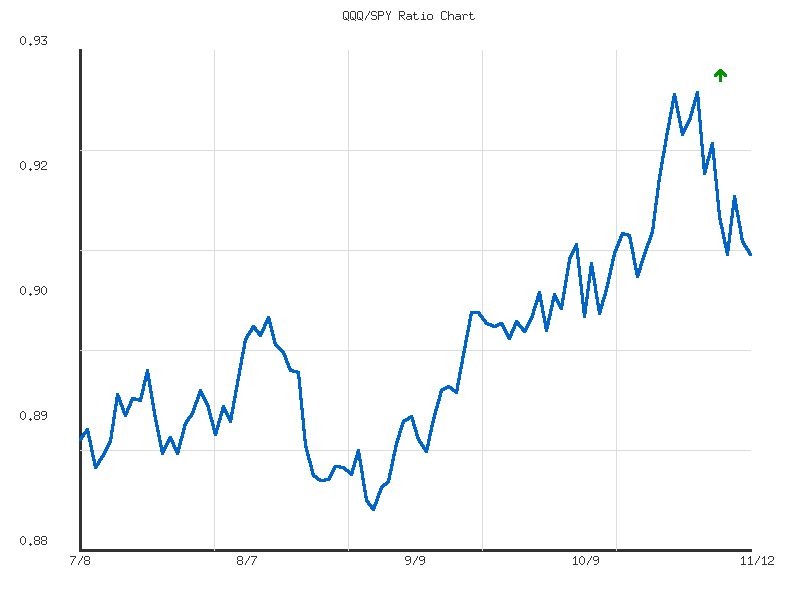
The QQQ/SPY ratio, a crucial gauge of the relative strength of growth-oriented technology stocks (QQQ) against the broader market (SPY), has demonstrated a persistent upward bias over the past 90 days. Originating near 0.890 in early July, the ratio has ascended to its current level of 0.9089 as of November 12, reflecting a 2.08% increase over the period. This consistent appreciation, despite the trend being quantitatively described as having “weak” strength, indicates QQQ’s sustained outperformance relative to SPY. The reported extremely low volatility (0.0001) suggests that this upward trend has unfolded in a relatively smooth manner, devoid of significant day-to-day erratic movements, reinforcing the observation of a gradual, consistent upward grind rather than sharp, volatile swings.
Analysis of the underlying data reveals distinct phases within this 90-day window. Initially, the ratio fluctuated around the 0.890 mark throughout July, punctuated by a brief push towards 0.897 by July 21. A subsequent corrective phase saw the ratio retreat towards the 0.886-0.890 range, which effectively established an early, albeit temporary, support level. Following this, a more pronounced rally began, propelling the ratio to a peak of 0.9025 by August 12. This level then appeared to act as a significant short-term resistance, as the ratio underwent a notable pullback, declining to its 90-day low of 0.8834 in early September. This corrective period momentarily signaled stronger relative performance from SPY before a sustained recovery for QQQ commenced, leading the ratio to reclaim and subsequently trade above the psychological 0.900 level.
The most recent period, spanning from early October to the present, has been marked by a significant acceleration in QQQ’s relative outperformance. After consolidating around the 0.900-0.903 area in late September, the ratio broke out decisively, surging to establish a new 90-day high of 0.9250 on November 3. This robust breakout underscores a period of strong demand for technology stocks relative to the broader market. However, this rapid ascent was followed by a sharp and notable pullback, with the ratio declining approximately 1.74% to its current level of 0.9089. This retracement brings the ratio back below the 0.910 threshold, placing it at a critical juncture. The prior resistance area of 0.900-0.903 now acts as an immediate and crucial support level, while the 0.9250 peak represents significant overhead resistance.
Considering the current technical setup, the QQQ/SPY ratio finds itself at a pivotal point. A continuation of the recent correctional phase is a roughly even chance if the immediate support zone around 0.900-0.903 fails to hold. A decisive breach below this critical level would make a further decline towards the 90-day average of 0.8994 and potentially even the 0.885-0.890 range highly likely, signaling a more extended period of SPY’s relative outperformance. Conversely, if the ratio finds firm support at or around its current levels, or within the 0.900-0.903 zone, a rebound and a retest of the 0.9250 high is likely. Given the overall “up” trend observed over the 90 days and the strong breakout preceding this pullback, the probability of QQQ resuming its relative outperformance after this consolidation is slightly higher than a sustained reversal, provided that key support levels remain intact.
Ratio Analysis: QQQ/SPY
Generated for 90days timeframe analysis
IWM vs. SPY
Analysis of the RATIO:IWM/SPY:14days data indicates a clear and consistent trend of underperformance by the Russell 2000 (IWM) relative to the S&P 500 (SPY) over the specified 14-day period. The ratio has experienced a moderate decline, falling approximately 3.19% from its high of 0.368298 on October 24th to its current level of 0.356556 on November 12th. Critically, the current ratio represents the lowest point observed within this 14-day dataset, suggesting sustained relative weakness for IWM against SPY. There is a high probability that SPY has been the stronger index during this period, absorbing capital more effectively than the small-cap oriented IWM.
The consistent downward pressure on the ratio, punctuated by only minor, short-lived advances, highlights a prevailing negative momentum. While the decline is characterized as “moderate” in strength, the fact that the ratio is now positioned at the absolute low of its observed range makes further immediate downward movement probable, assuming the established trend persists. The lack of a clear support level within this dataset, given the current low, suggests that any continuation of the existing dynamic would likely see the ratio continue to carve out new lows. Conversely, any sustained upward movement would require a notable shift in relative strength, which the current data does not suggest is likely in the immediate term.
Considering alternative scenarios, it is plausible that the ratio, having reached the bottom of its recent 14-day range, could experience a period of stabilization or even a minor rebound. However, given the sustained nature of the decline and the moderate trend strength, a significant reversal back towards the average ratio of 0.360346 or higher appears unlikely without new data indicating a fundamental shift in investor preference. Traders prioritizing relative strength would likely conclude that SPY exhibits superior performance based on this timeframe. A roughly even chance exists for either continued consolidation at current levels or a slight continuation of the downward trend in the very short term, pending further price action.
IWM/SPY Relative Performance Analysis: 90-Day Outlook
The IWM/SPY ratio, a key indicator of small-cap (Russell 2000) relative performance against large-cap (S&P 500) equities, has exhibited a predominantly sideways trend with weak directional strength over the past 90 trading days. This period, spanning from early July to mid-November, saw the ratio fluctuate within a defined range. The ratio marked its 90-day low at 0.3456 on August 1st and subsequently peaked at 0.3763 on October 15th. The current ratio of 0.3565 sits below the 90-day average of 0.3600, indicating that small-caps have generally underperformed large-caps in the most recent segment of this observation period.
A detailed examination of the ratio’s journey reveals distinct phases within this broader sideways consolidation. The ratio initially demonstrated a slight decline from its early July levels, finding a significant trough in early August. Following this, a notable recovery and an upward trajectory became evident through the latter half of August and September. This momentum culminated in a robust surge to the period’s high of 0.3763 in mid-October, suggesting a phase where small-cap outperformance was clearly in effect. This mid-period strength indicates broadening market participation or a risk-on shift during that specific timeframe.
However, since reaching its peak on October 15th, the IWM/SPY ratio has entered a discernible downtrend, retracting approximately 5.2% to its current level of 0.3565. This recent decline has pulled the ratio beneath its 90-day average, reinforcing the shift towards large-cap outperformance. The current valuation is situated closer to the lower end of the established 90-day range, approximately 35% above the period’s low. There is a likely scenario where the ratio continues its recent drift lower, potentially testing the previous minor pivot and support area around 0.3500-0.3520, which proved resilient in late July and early August.
An alternative scenario, holding a roughly even chance compared to continued downside in the immediate term, would involve the ratio finding support near its current levels or slightly below, followed by a mean reversion towards the average. The historical oscillation within these established boundaries over the past 90 days suggests that significant deviations often invite counter-moves, particularly given the weak overall trend strength. For a renewed period of sustained small-cap outperformance to materialize, a forceful reclamation and hold above the 0.3600 average would be requisite. Nevertheless, based solely on the observable technical data, a significant breakout above the October high appears unlikely without first undergoing further consolidation or a more pronounced re-test of the lower boundaries of its recent range.

Ratio Analysis: IWM/SPY
Generated for 90days timeframe analysis
Commodities
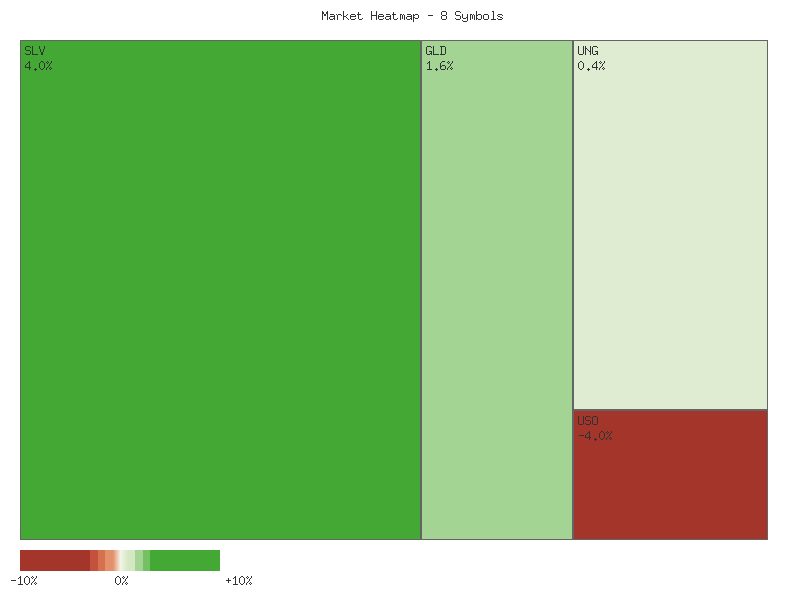
Market Performance Overview (Daily Percent Change):
| Symbol | Daily Percent Change |
|---|---|
| SLV | 4.035% |
| GLD | 1.619% |
| UNG | 0.446% |
| CPER | 0.415% |
| CORN | 0.093% |
| DBC | -1.138% |
| UGA | -2.718% |
| USO | -3.990% |
The daily percentage change data across the observed commodities reveals a highly divergent market session. Silver (SLV) and Gold (GLD) emerged as the strongest performers, registering substantial gains of 4.035% and 1.619%, respectively, indicating likely strength in precious metals. Other advancers included Natural Gas (UNG) with a 0.446% gain, Copper (CPER) at 0.415%, and Corn (CORN) with a marginal 0.093% increase. In stark contrast, the energy complex experienced significant weakness, with Crude Oil (USO) declining sharply by 3.990% and Gasoline (UGA) falling by 2.718%. The broader diversified commodities fund (DBC) also saw a notable decline of 1.138%, suggesting that the weakness in energy likely weighed heavily on its performance.
From a market breadth perspective, this specific basket of commodities displayed a somewhat mixed but leaning-positive posture. Five out of the eight symbols closed with gains (advancing symbols), while three experienced declines (declining symbols). This 5:3 advance-decline ratio, on its own, would typically suggest underlying strength. However, the magnitude of the declines in USO and UGA, representing the energy sector, is quite significant. The average decline for the three losing assets was approximately -2.615%, whereas the average gain for the five advancing assets was roughly 1.322%. This quantitative differential suggests that while more symbols advanced, the depth of the declines in the weaker sectors was considerably more pronounced than the gains in the stronger ones.
The robust upside movement observed in precious metals, specifically SLV and GLD, is a dominant technical feature from this dataset. This action is likely indicative of a shift in investor preference towards assets perceived as safe havens or inflation hedges, particularly given their magnitude relative to other commodity movements. Conversely, the substantial selling pressure evident in the energy-related ETFs (USO, UGA) points to a likely bearish sentiment within that specific sector for the observed period. It presents a roughly even chance that this divergence reflects a tactical rotation of capital, moving away from energy exposure and into precious metals, rather than a uniform market sentiment.
Considering the sharp, multi-percent declines in major energy components alongside more moderate gains in other segments, an alternative scenario warrants consideration. Despite the positive count of advancing symbols, the significant negative impact from key energy assets could potentially overshadow the cumulative positive contributions elsewhere. This could imply that a broader, equally-weighted commodity index (if one were to be constructed from these components) might experience a net negative effect due to the outsized losses in energy. Given the single day’s data, it is difficult to project long-term trends; however, the immediate technical implications suggest that a continuation of this divergence, with precious metals outperforming energy, remains a likely short-term outcome.
Technical Market Commentary: Two-Day Commodity ETF Review
Our two-day technical review of select commodity ETFs, spanning November 11th and 12th, 2025, reveals a stark divergence in market sentiment across different sectors. The energy complex exhibited notable weakness, marked by pronounced selling pressure, while precious metals demonstrated significant underlying strength with robust buying interest. Other commodity groups, including natural gas, agriculture, and industrial metals, presented more nuanced or consolidating price action, indicating a period of indecision or mild directional bias based purely on the provided candlestick and volume data.
The energy sector, represented by USO (US Oil Fund), DBC (Invesco DB Commodity Index Tracking Fund), and UGA (US Gasoline Fund), displayed pronounced bearish characteristics. USO concluded its second day with a large bearish candle, opening below the prior day’s close and nearing its session low, accompanied by notably increased volume. This pattern, indicative of a strong bearish continuation, makes it highly likely that USO will experience further downward pressure in the immediate future. Similarly, DBC presented a bearish candle on its second day, closing near its low on significantly higher volume, which strongly indicates that continued selling pressure is probable. UGA mirrored this weakness with a substantial bearish candle, opening with a gap down and closing near its low. While UGA’s volume on the bearish day was slightly lower than the prior day, the decisive price action still renders further weakness highly likely.
Conversely, precious metals, specifically SLV (iShares Silver Trust) and GLD (SPDR Gold Shares), showed robust bullish momentum. SLV delivered a powerful second-day rally, opening with a gap up and closing near its session high on dramatically increased volume. This combination of an upward gap, a strong bullish candle, and surging volume provides a high degree of conviction, making continued upward momentum highly likely for silver. GLD also exhibited a strong bullish continuation, with its second-day candle opening above the prior close and pushing significantly higher to close near its peak, supported by higher volume. This pattern suggests a high probability of sustained buying interest in gold in the near term.
The remaining commodity ETFs presented more varied technical pictures. UNG (US Natural Gas Fund) followed a strong bullish candle on the first day with a relatively small bullish inside bar on lower volume. This pattern suggests a pause or consolidation after the initial upward thrust. It is a roughly even chance that UNG will either continue to consolidate within its recent range or resume its upward trajectory, particularly if buyers can overcome the high of the initial bullish day. CORN (Teucrium Corn Fund) recorded two consecutive small bullish candles, with the second day being an inside bar on slightly increased volume. This suggests mild, albeit constrained, upward pressure. A gradual upward drift appears probable, yet a significant breakout is not clearly indicated from this two-day data.
CPER (Copper Futures ETF) displayed a mixed signal on its second day. After a weak close on the first day, CPER opened with a significant upward gap. However, it failed to maintain these gains, closing well off its highs and resulting in a candle with a long upper wick. While the initial gap suggests buying interest, the subsequent selling pressure indicates resistance or profit-taking at higher levels. Therefore, it is a roughly even chance that CPER could either attempt to continue its rally if the Day 2 high is decisively overcome, or it might retrace to fill the gap if sellers regain control. Traders should monitor for confirmation beyond this immediate two-day action to discern the prevailing sentiment.
Performance Heatmap (SLV, GLD, CORN, CPER, USO, DBC, UGA, UNG)
Generated for 2days timeframe analysis
Based on the provided 90-day technical data for SLV, a discernible upward trend has dominated recent price action, albeit with notable periods of consolidation and sharp correction. SLV initiated a robust rally from approximately .00 in early July, progressing to a peak around .40 in mid-October. This extended uptrend was frequently characterized by significant volume increases during upward price movements, which likely confirms strong underlying buying interest. However, this bullish momentum was abruptly interrupted by a sharp correction in mid-October, when SLV experienced a substantial decline from its peak, ultimately reaching a low of .40 by October 27. The volume associated with this decline was notably high, probably indicating a strong wave of selling pressure that eroded a portion of the preceding gains.
Analysis of the 14-day Relative Strength Index (RSI) reveals a consistent pattern of momentum expansion and contraction aligning with price movements. During the primary rallies from July through mid-October, the RSI repeatedly entered and often sustained itself within overbought territory (above 70), reaching an extreme high of 84.32 on October 13. This likely signaled strong, potentially unsustainable, upward momentum. The sharp mid-October price correction was directly reflected in the RSI, which plummeted from its highly overbought condition to a more neutral level, dropping to 52.87 by October 21. This rapid descent provided a significant reset in short-term momentum. In the most recent period, particularly from early November, the RSI has once again seen a swift ascent, rising from the mid-40s to 69.08 on November 12, nearing overbought conditions but not yet decisively crossing the 70 threshold. This rapid increase in RSI, coupled with rising volume, suggests strong current buying momentum.
The recent price action, culminating in SLV’s close at .345 on November 12, places the instrument squarely at a critical juncture, testing the previous mid-October resistance levels around .40. The strong bullish candle on November 12, characterized by a close near the high of the day and accompanied by increasing volume, suggests that a breakout above this resistance is a distinct possibility. However, given that this level previously represented a significant reversal point, there is a roughly even chance of either a successful breach or another rejection from this resistance. A sustained move above .40, particularly if supported by continued elevated volume, would likely confirm the continuation of the intermediate-term uptrend, with the next discernible resistance level being conjectural without further data.
Conversely, a failure to decisively break above the .40-.69 resistance zone, potentially marked by bearish candlestick formations or a sharp drop in volume, would make a near-term pullback probable. In such a scenario, initial support for SLV would likely be found in the .00-.00 range, which previously acted as an area of consolidation following the October correction. While the RSI is approaching overbought, it has not yet confirmed an extreme condition, suggesting that some upward room might remain, but prolonged gains without consolidation become increasingly improbable. It is important to acknowledge that a comprehensive MACD analysis was not possible as the data for this indicator was not provided.
SLV Price & Indicators (RSI_14_DAY, MACD_13_21_DAY)
GLD Technical Analysis: Navigating Bullish Momentum Amidst Overbought Signals
GLD has experienced a substantial uptrend over the past 90 days, beginning around the level in early July and surging to an all-time high of .30 on October 20th. This period was characterized by consistent higher highs and higher lows, with notable support established near - after a late July dip, and later around the - range during a significant pullback in late October. The strong bullish sentiment was periodically accompanied by elevated trading volumes, particularly around significant price moves such as the peak on October 20th and subsequent sharp declines, indicating active participation by market participants.
The 14-day Relative Strength Index (RSI) largely corroborated the bullish price action, frequently entering and remaining in overbought territory (above 70) for extended periods from late August through mid-October. This prolonged overbought condition, with readings as high as 87.34 on October 20th, signals robust buying pressure and strong momentum but concurrently increases the likelihood of a price correction or consolidation. The sharp decline in GLD’s price from its October 20th peak was mirrored by an equally rapid descent in the RSI, which fell from 87.34 to 48.46 by October 29th. This rapid unwinding of overbought conditions suggested a significant loss of immediate upward momentum and a shift toward a more neutral or potentially bearish short-term outlook.
Following the late October correction, GLD has demonstrated a strong recovery, with the price currently at .06 and the 14-day RSI standing at 64.56 as of November 12th. Given the established uptrend over the 90-day period and the recent rebound from support, a continuation of the upward trajectory is likely. The immediate technical challenge for GLD lies at the previous all-time high of .30. A decisive breach of this resistance level is likely to signal the resumption of the broader bullish trend, potentially paving the way for further price discovery. Conversely, a failure to overcome this level, especially if accompanied by a turn down in the RSI from its current elevated state, presents a roughly even chance of GLD retesting recent support levels around -.
Considering alternative scenarios, if GLD successfully surpasses the .30 resistance, the absence of historical price action above this point implies an unlikely encounter with significant overhead supply in the immediate term, which could facilitate accelerated gains. However, if the current upward momentum dissipates before reaching the .30 level and price retreats, a break below the established support near could imply a roughly even chance of a more protracted consolidation or a deeper correction. In such a scenario, the previous July highs around - could emerge as critical support zones, absorbing selling pressure. The high volume spikes observed during phases of both rapid ascent and sharp decline suggest that GLD remains prone to periods of heightened volatility.
GLD Price & Indicators (RSI_14_DAY, MACD_13_21_DAY)
Gold/Silver Ratio
The 14-day technical data for the GLD/SLV ratio reveals a clear and sustained downtrend, concluding at its lowest point within the observed period. The provided ’trend’ analysis explicitly identifies the direction as “down” with “moderate” strength, evidenced by a nearly 7% decline from its initial value of 8.5819 on October 24th, 2025, to the current ratio of 7.9855 on November 12th, 2025. This ratio’s journey commenced with an early peak at 8.6559 on October 27th, after which it largely consolidated before resuming its descent. The fact that the current ratio (7.9855) matches the ’low_ratio’ for the entire 14-day period, with a ‘relative_position’ of 0, is a highly salient technical characteristic, indicating significant selling pressure and a lack of support at higher levels. The moderate volatility of 0.0261 further suggests that this downtrend is not erratic but rather a relatively consistent directional move.
The price action over the period shows GLD values generally increasing from 377.52 to 386.06, while SLV values experienced a more pronounced surge from 43.99 to 48.345. This disproportionate increase in SLV relative to GLD is the fundamental driver behind the declining ratio, indicating a period where silver (SLV) is outperforming gold (GLD) on a relative strength basis. The consistent sequence of lower high and lower low ratios observed from the peak in late October through early November, culminating in the new 14-day low, implies robust downward momentum. Based purely on this limited dataset, it is likely that the GLD/SLV ratio will continue to exhibit downward pressure in the very near-term, as there are no immediate technical signals within the provided data to suggest a reversal.
While the immediate technical posture suggests continued weakness, it is important to consider alternative scenarios, though these are presently less likely based solely on the provided data. A reversal would require the ratio to find support and begin forming higher lows and higher highs, potentially encountering resistance around the prior average ratio of 8.385. However, with the ratio currently at its absolute low for the observation period, there is no technical evidence of such a consolidation or bounce forming. Without additional data beyond 14 days, particularly regarding volume trends or longer-term support/resistance levels, any projection for a sustained reversal lacks current technical corroboration. There is roughly an even chance that the ratio might temporarily consolidate around current levels before a clearer direction emerges, but the prevailing momentum strongly favors a continued decline or at least a test of even lower levels.
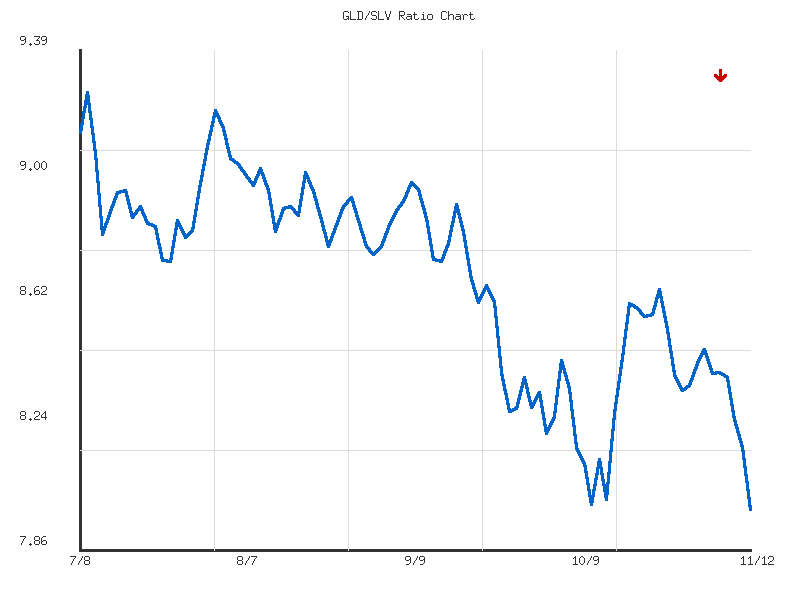
As a Chartered Market Technician with over 15 years of experience, my analysis of the provided GLD/SLV ratio over the past 90 days indicates a clear and robust directional preference for silver (SLV) relative to gold (GLD). The data explicitly states a “strong” downward trend for the ratio, characterized by a significant -12.60% decline over the period. The ratio commenced near its 90-day high of 9.258 on July 9, 2025, and has since descended to its current and lowest point within this dataset, 7.985, as of November 12, 2025. This consistent depreciation of the ratio signals a persistent and accelerating outperformance of SLV against GLD, a critical observation for asset allocators navigating the precious metals complex.
The decline in the GLD/SLV ratio has exhibited distinct phases. Initially, from July into early September, the ratio showed a gradual descent, marked by occasional minor retracements, fluctuating generally within the 9.2 to 8.7 range. This period might suggest an initial phase of relative consolidation before a more pronounced directional commitment. However, a notable acceleration in the downward momentum became evident from late September onwards, as the ratio decisively broke below previously established fluctuating support areas, moving from around 8.6 on September 24th to pierce the 8.0 threshold by mid-October. This break suggests increasing conviction in silver’s relative strength and a weakening of previous equilibrium points for the ratio.
Currently, the GLD/SLV ratio sits precisely at its 90-day low of 7.985. This “relative_position: 0” highlights an extreme point within the observed data range, reinforcing the significant strength of the current trend. Based on the persistent downward trajectory and the accelerated pace of decline observed in the latter half of the period, it is likely that the ratio will continue to probe lower levels in the immediate term. This implies a continued environment where silver is expected to maintain its leadership over gold, presenting a potentially advantageous position for traders or investors seeking relative outperformance within the precious metals sector. The overall technical picture suggests that the path of least resistance for the GLD/SLV ratio remains to the downside.
Considering alternative scenarios, a significant and sustained reversal in the GLD/SLV ratio, which would see GLD begin to outperform SLV, appears unlikely without concrete technical evidence emerging from future price action. While the ratio is at an extreme low, leading to a roughly even chance of either a period of consolidation around the current 7.985 level or a slight upward retracement in the short term, such movements would likely be interpreted as minor counter-trend rallies. A substantial rebound that challenges the established strong downtrend, perhaps back towards the average ratio of 8.688, would necessitate a clear break above developing resistance levels, which are not yet discernible within the provided data. Therefore, clients should proceed with the expectation that the robust trend of SLV outperformance is set to continue unless a compelling shift in the ratio’s momentum materializes.
Ratio Analysis: GLD/SLV
Generated for 90days timeframe analysis
Bonds
| Symbol | Daily Percent Change |
|---|---|
| TLT | 0.178% |
| UTHY | 0.141% |
| IEF | 0.015% |
| IEI | -0.018% |
| SHY | -0.024% |
An analysis of the provided daily percentage change data reveals a mixed performance across the five observed symbols for the single trading day. The strongest positive performance was observed in TLT, registering a daily gain of approximately 0.178%. Following TLT, UTHY also closed positively with a change of roughly 0.141%. IEF posted a marginal gain of about 0.015%, indicating very limited upward momentum. In contrast, two symbols concluded the day in negative territory; IEI recorded a minor decline of approximately -0.018%, and SHY exhibited the weakest performance, falling by roughly -0.024%. Based on this snapshot, we assess that positive momentum was concentrated in specific areas, while overall market conviction appears somewhat fragmented.
The magnitude of these daily price movements is notably constrained. All changes, whether positive or negative, are well within a 0.20% band. This suggests that the session was characterized by relatively low volatility across these instruments. While TLT and UTHY demonstrated the most positive strength, their gains are modest. Similarly, the declines in IEI and SHY are not substantial enough to indicate strong bearish conviction in a short-term context. We judge it likely that these movements represent minor rebalancing or short-term rotational behavior rather than a definitive breakout or breakdown in established trends, which would typically involve larger percentage shifts confirmed by other technical factors such as volume.
A notable observation is the divergence between the positively performing TLT/UTHY and the negatively performing IEI/SHY, with IEF remaining almost flat. This split performance makes a clear directional assessment for the broader market represented by these instruments challenging based solely on this single day’s data. It is roughly an even chance that this divergence could signify a subtle shift in investor preference within the basket of assets these symbols represent, or it could simply be a random daily fluctuation. An alternative scenario is that market participants are rotating capital from shorter-duration assets (potentially represented by IEI and SHY) into longer-duration assets (possibly TLT and UTHY), though this cannot be definitively confirmed without additional contextual data points such as yield curves or sector-specific trends. The narrow range of price changes suggests that any such rotation is currently very subtle and lacks strong conviction.
It is critical to emphasize that these conclusions are based solely on a single day’s percentage change data. Drawing robust technical conclusions or projecting future price action with high confidence from such limited information is improbable. To form a more reliable technical assessment, additional data points are essential, including multi-day price series to identify trends (e.g., moving averages), volume analysis to confirm conviction, and chart patterns (e.g., support/resistance levels). Without this broader technical context, these daily fluctuations provide only a glimpse into very short-term market dynamics, and any implication of a sustained trend change or significant shift in sentiment would be largely speculative. Therefore, while we observe a modest positive bias in TLT and UTHY, this observation is severely constrained by the limited dataset.
Technical Analysis: Short-Term Bond ETF Overview (2025-11-11 to 2025-11-12)
Analysis of the provided two-day candlestick data reveals a bifurcated market sentiment across the observed bond ETFs, particularly between longer and intermediate maturities. The iShares 20+ Year Treasury Bond ETF (TLT) exhibits a notably bullish short-term pattern. Following an indecisive Doji candle on the first day, the second day presented a strong white candle with a higher high and higher low, closing above the prior day’s close. This upward movement was accompanied by a significant increase in trading volume, suggesting increased conviction behind the advance. Based on this pattern, a continued upward trajectory for TLT is likely in the immediate future. Similarly, the iShares 7-10 Year Treasury Bond ETF (IEF) also demonstrates a probable short-term bullish bias. IEF recorded two consecutive white candles, with the second day posting a slightly higher close and a higher high than the first. Crucially, this move was supported by a notable increase in volume, reinforcing the observed upward momentum. Thus, continued upward price action for IEF is also likely.
In contrast, the shorter-duration bond ETFs present a more nuanced picture. The iShares 1-3 Year Treasury Bond ETF (SHY) saw a small white candle followed by an equally small black candle. The second day’s close was marginally below the first day’s close, and this slight downward drift occurred on lower volume. This suggests a potential loss of short-term buying enthusiasm, though the overall price range remains exceptionally tight. Given the limited volatility and decreasing volume on the second day’s minor retracement, a significant directional move in either direction for SHY is unlikely in the immediate term; a continued tight range or slight downward pressure is roughly an even chance. The iShares 3-7 Year Treasury Bond ETF (IEI) shows a white candle followed by a black candle. Although the second day saw an increased high, its close was below the previous day’s close, and this occurred on increased volume. This price action, while not a definitive reversal, suggests a potential pause or a minor pullback after the initial upward momentum. Therefore, a continuation of the upward trend for IEI is roughly an even chance against a short-term consolidation or slight retracement.
The US Treasury High Yield Bond ETF (UTHY) registered very low trading volume across both days, with figures of 2,104 and 5,703 shares, respectively. The price action moved from a small black candle to a small white candle, closing marginally higher on the second day. However, due to the extremely low liquidity, any strong conclusion regarding UTHY’s short-term direction is highly uncertain. The increased volume on the up day might suggest some emerging buying interest, but its reliability is questionable. Consequently, predicting a clear short-term trend for UTHY is highly unlikely, and a roughly even chance exists for either a continuation of the slight upward drift or a return to the prior day’s levels. In summary, the provided two-day data suggests divergent short-term trends within the Treasury bond sector. Longer-duration ETFs (TLT, IEF) are exhibiting more robust technical signals for probable upward continuation. Conversely, shorter-duration ETFs (SHY, IEI) display more indecision or signs of potential short-term weakness, with SHY indicating slight downward pressure and IEI suggesting a possible consolidation or mild retracement. Retail traders should note the higher conviction in the longer-duration products based solely on these two days of data, while exercising caution with shorter-duration instruments where technical signals are less definitive.
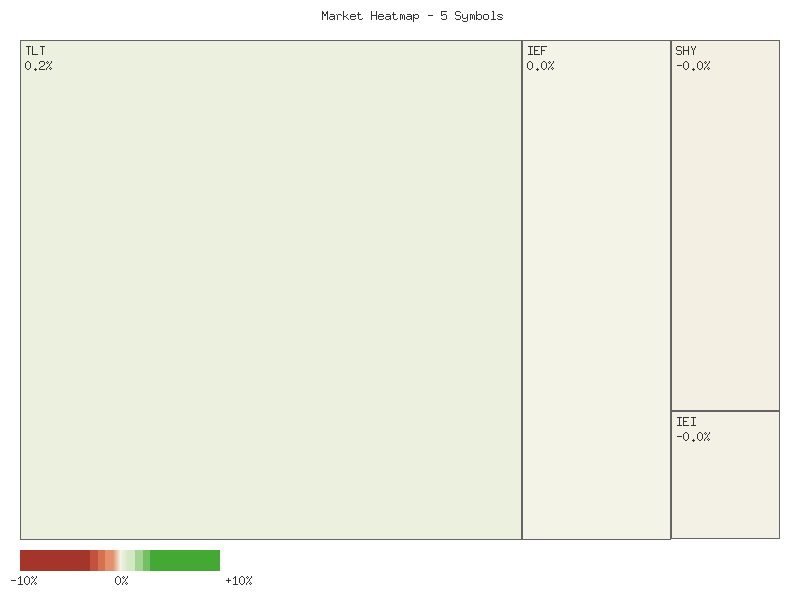
Performance Heatmap (TLT, UTHY, IEF, IEI, SHY)
Generated for 2days timeframe analysis
Magnificent 7 & Friends
Here is an analysis of the provided single-day market data, focusing solely on the daily percentage changes.
The market data for the selected symbols on the specified day presents a mixed picture, with a notable bifurcation between advancers and decliners. Among the ten tracked symbols, four experienced positive daily percentage changes, while six closed lower. This distribution suggests a market environment that is not uniformly bullish or bearish, but rather selective in its daily movements. The subsequent matrix provides a clear view of these daily shifts, sorted from the strongest performer to the weakest:
| Symbol | Daily Percent Change |
|---|---|
| AVGO | 0.943% |
| MSFT | 0.484% |
| NVDA | 0.331% |
| ANET | 0.024% |
| AAPL | -0.636% |
| GOOGL | -1.579% |
| AMZN | -1.947% |
| TSLA | -2.052% |
| META | -2.882% |
| CRWV | -3.349% |
Examining the positive performers, AVGO stands out as the strongest, advancing by 0.943%. MSFT and NVDA also posted respectable gains of 0.484% and 0.331% respectively, with ANET showing a marginal positive change of 0.024%. Based on this single day’s data, it is likely that these symbols experienced some degree of buying interest or resilience compared to their peers. For AVGO in particular, this relative strength suggests that immediate sentiment was moderately positive, which could imply a short-term upward bias if sustained, although such a conclusion is limited by the brevity of the data.
Conversely, the majority of the tracked symbols recorded declines. AAPL saw a modest dip of -0.636%, which, while negative, is less pronounced than some others. GOOGL, AMZN, and TSLA experienced more significant pullbacks, ranging from -1.579% to -2.052%. Most notably, META and CRWV exhibited considerable weakness, declining by -2.882% and -3.349% respectively. The magnitude of these declines, especially in META and CRWV, makes it likely that these stocks faced substantial selling pressure on this particular day. This relative underperformance could indicate a short-term bearish sentiment or potential profit-taking in these specific names.
Given this limited dataset, interpreting the broader market implications should be done with caution. While there are more decliners than advancers, the overall sentiment is likely mixed, with strength localized in a few names. It is roughly an even chance that these single-day movements represent isolated reactions to specific news or sector rotations rather than the initiation or continuation of robust trends. An alternative scenario is that these daily changes are merely short-term fluctuations or normal volatility within existing patterns, and a more definitive assessment would require analysis of multiple periods, volume data, and chart patterns to confirm any emerging technical signals. However, based purely on this snapshot, the immediate momentum appears somewhat tilted towards downside for the larger cohort of tracked stocks.
Market Commentary: Technical Analysis of Selected Equities (November 11-12, 2025)
This commentary provides a rigorous technical analysis of the provided 2-day candlestick data for a selection of equities, focusing solely on price action and volume patterns. The market exhibited a notable divergence over the observed period, with several key components demonstrating significant bearish reversals, while others sustained upward momentum or entered consolidation phases. The aggregated data suggests an environment where selling pressure gained traction in specific high-profile names, indicating a likely shift in short-term sentiment for those particular assets.
Several equities displayed distinct bearish tendencies over the two-day period, suggesting a likely continuation of downward pressure in the immediate future. TSLA on November 12th executed a large bearish candle, closing significantly below its open and below the prior day’s close, following a marginal gap up from the previous close. This price action, coupled with slightly decreased but still substantial volume, indicates strong selling pressure. META experienced a similar fate, presenting a pronounced bearish engulfing pattern on November 12th with a substantial increase in volume, closing near its lowest point of the two days. GOOGL and AMZN also exhibited strong bearish reversals on November 12th. GOOGL formed a Dark Cloud Cover pattern, seeing its significant bullish gains from November 11th largely negated by a strong sell-off on increased volume. AMZN’s bearish candle on November 12th effectively engulfed the prior day’s modest bullish body, also on increased volume, strongly suggesting a shift to bearish control. CRWV sustained two consecutive large bearish candles, with the second day closing at a new low for the period, reinforcing a likely bearish continuation, although on decreasing volume, which might indicate a slight reduction in selling intensity.
Conversely, MSFT demonstrated clear bullish momentum. Following a strong bullish candle on November 11th, November 12th saw a continuation of this upward trend, forming another bullish candle with a higher close and notably increasing volume. This pattern, characterized by consecutive higher closes supported by rising volume, suggests a likely continuation of the established bullish short-term trend. The price action indicates strong buying interest and a potential for further upside movement in the immediate term.
Other names presented a more mixed or indecisive technical picture. AAPL, after a strong bullish candle on November 11th, retreated slightly on November 12th with a bearish candle, though it remained within the body of the prior day’s candle. This suggests a roughly even chance of either a short-term pullback before resuming upward momentum or a loss of conviction by buyers, potentially signaling a more prolonged consolidation. NVDA and ANET both displayed periods of consolidation. NVDA posted two small-bodied candles, one slightly bearish and one slightly bullish, with decreasing volume, indicating indecision and a lack of strong directional conviction. ANET also printed two small-bodied bullish candles that were largely range-bound with decreasing volume, signaling a likely pause in significant price movement. AVGO, after a large bearish candle on November 11th, showed a potential bullish reversal on November 12th by closing significantly higher than the prior day’s close, despite opening higher and experiencing a pullback. However, the reversal occurred on lower volume, making the strength and sustainability of this bullish recovery somewhat questionable. It is a roughly even chance whether this represents a definitive reversal or merely a short-term rebound within a broader bearish context.
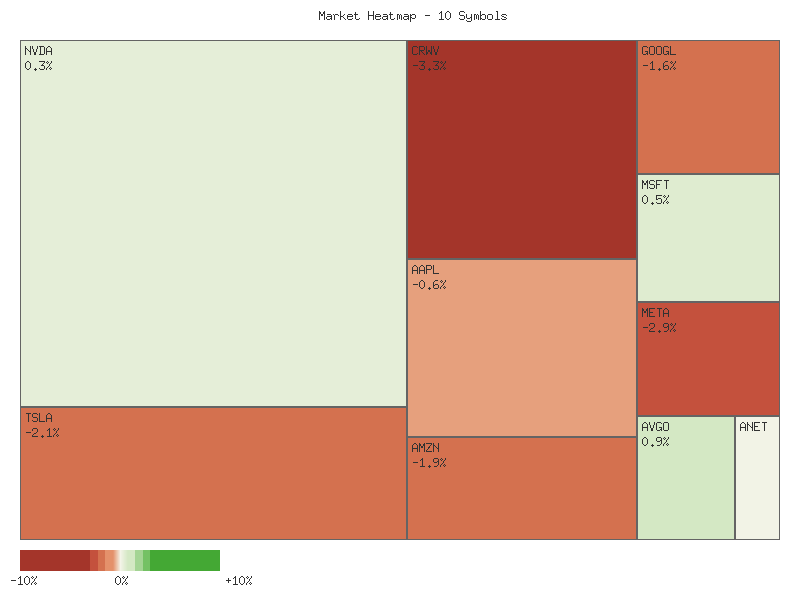
Performance Heatmap (TSLA, MSFT, AAPL, META, NVDA, AVGO, GOOGL, AMZN, CRWV, ANET)
Generated for 2days timeframe analysis
S&P 500 Sector Breadth
The daily performance of the S&P 500 sectors reveals a moderately positive market breadth for the session under review. Out of the eleven sectors analyzed, six advanced, while five declined. This indicates a roughly even distribution of market participation, with a slight tilt towards positive momentum. The sector performance, sorted by daily percentage change, is presented below:
| Symbol | Daily Percent Change |
|---|---|
| XLV | 1.404% |
| XLF | 0.912% |
| XLB | 0.725% |
| XLK | 0.338% |
| XLU | 0.234% |
| XLI | 0.097% |
| XLP | -0.129% |
| XLC | -0.578% |
| XLY | -0.701% |
| XLRE | -0.755% |
| XLE | -1.420% |
Analyzing the performance by sector type, we observe a mixed environment. Among the designated defensive sectors (XLU, XLP, XLV, XLRE), two advanced (XLV, XLU) and two declined (XLP, XLRE). Notably, XLV (Healthcare) was the strongest performer among all sectors. Conversely, within the offensive sectors (XLK, XLY, XLF, XLI, XLB, XLE), four advanced (XLF, XLB, XLK, XLI) and two declined (XLY, XLE). The Communications Services sector (XLC), which often behaves offensively, also declined significantly. The presence of both advancing and declining sectors within both offensive and defensive categories suggests a lack of clear, uniform directional conviction across the broader market.
Regarding market rotation and sentiment, the data presents an ambiguous picture. While more offensive sectors advanced than declined (four vs. two), the leading performer was a defensive sector (XLV), and the weakest was an offensive sector (XLE). This mixed performance across both offensive and defensive groups suggests that broad market rotation towards either “risk-on” or “risk-off” assets is unlikely to be a dominant theme based on this single day’s activity. Instead, sector-specific drivers appear to be at play. Therefore, we assess a roughly even chance of continued mixed sector leadership in the immediate term, rather than a decisive shift towards either offensive or defensive market postures.
Technical Market Commentary: Two-Day Sector Snapshot (November 11-12, 2025)
This analysis provides a concise technical overview of eleven SPDR Sector ETFs, focusing exclusively on the provided two-day candlestick and volume data. The market exhibited varied performance across sectors, with clear indications of directional conviction in some areas, while others presented signals of reversal or indecision.
A review of the provided data suggests that the Financials (XLF), Materials (XLB), and Health Care (XLV) sectors demonstrate the strongest upward momentum. XLF notably displayed two consecutive bullish candles, with the second day opening at its low and closing near its high, accompanied by a significant surge in volume. This pattern provides a high probability of continued bullish sentiment in the near term. Similarly, XLB and XLV both recorded strong bullish candles with increasing volume over the two days, indicating a likely continuation of their respective uptrends. The Industrials (XLI) and Utilities (XLU) also registered higher closes over the two-day period, though XLI showed more conviction with slightly increased volume, while XLU’s smaller real bodies suggest limited enthusiasm despite the upward drift.
Conversely, several sectors exhibited technical patterns indicative of a potential shift to bearish momentum or a loss of prior bullish conviction. The Consumer Discretionary (XLY), Energy (XLE), Real Estate (XLRE), and Communication Services (XLC) sectors all concluded the two-day period with significant bearish reversals. XLY experienced a bearish engulfing pattern on the second day, with a close significantly below the prior day’s close, suggesting a moderate probability of further downside. XLE similarly formed a strong bearish candle following a bullish day, with its close dropping below the prior day’s low, signaling a likely bearish turn. XLRE showed a bearish reversal after a strong bullish opening, while XLC’s second day featured a substantial upper shadow and a close well below the prior day’s high, indicating strong selling pressure after an attempted rally. The Consumer Staples (XLP) sector, after a strong bullish opening day, printed an inside bearish candle with sharply decreased volume on the second day, suggesting a roughly even chance of either consolidation or a loss of upward momentum.
The Technology (XLK) sector presented mixed signals. After a bearish candle on the first day, the second day saw a significant gap-up at the open, yet price failed to sustain these gains, closing near the open and below the day’s high, forming a long upper shadow. While the closing price was slightly higher than the previous day’s close, the strong rejection from the high and decreased volume suggest uncertainty. Therefore, the probability of a clear directional move for XLK in the immediate future is roughly even, as buying strength at the open was met with considerable selling pressure higher up. Traders should exercise caution, as this pattern could precede either a continuation of the upward momentum if the prior session’s high is overcome with conviction or a reversal if selling pressure persists.
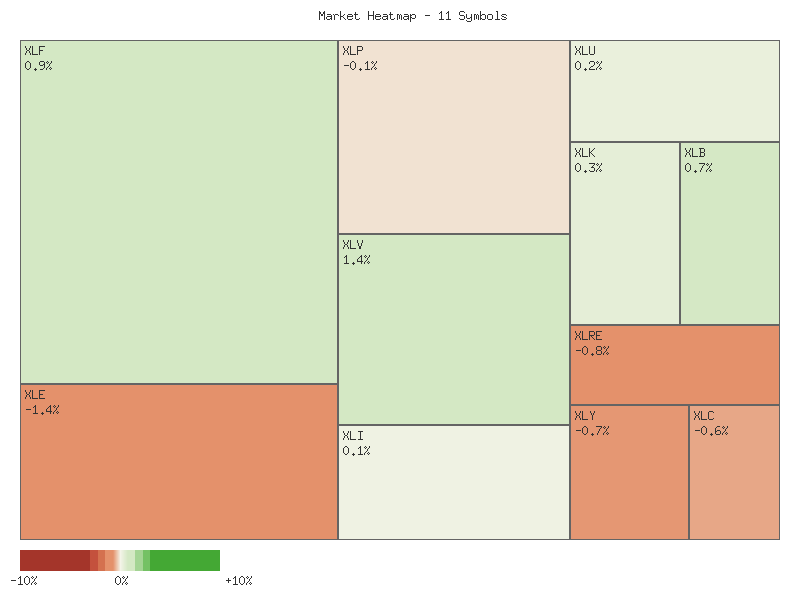
Performance Heatmap (XLP, XLRE, XLI, XLU, XLV, XLY, XLF, XLB, XLE, XLC, XLK)
Generated for 2days timeframe analysis
XLY vs XLP
The XLY/XLP ratio, a key metric for assessing the relative strength between Consumer Discretionary and Consumer Staples sectors, has exhibited a weak downward trend over the most recent seven-day period. This observed decline of approximately 1.80% indicates a moderate shift in capital away from the more growth-sensitive discretionary sector towards the typically defensive staples sector within this short timeframe. The current ratio of 3.0769 is notably below the period’s average of 3.1135, suggesting that recent performance has favored the defensive play.
Analyzing the ratio’s price action in detail, it reached its zenith for the period at 3.1742 on November 5th. Subsequently, the ratio experienced a decline, finding a near-term low at 3.0750 on November 7th. A brief recovery was observed, pushing the ratio back to 3.1264 on November 10th, but this rally proved unsustainable. The ratio then resumed its descent, closing at 3.0769 on November 12th, placing it just marginally above the prior low. This sequence of a lower high followed by a test of the previous low typically reinforces a bearish short-term outlook for the ratio. The very low volatility (0.00105) across this period indicates that these movements, while directional, were not characterized by sharp or erratic swings.
Considering the weak downward trend and the ratio’s current proximity to its recent low, there is a roughly even chance of either a near-term consolidation around current levels or a continuation of the bearish pressure. A sustained break below the 3.0750 support level would probably suggest further underperformance of XLY relative to XLP, potentially targeting lower technical levels not yet apparent in this limited dataset. Conversely, should the ratio manage to hold this support and move higher, it could indicate a temporary pause or reversal in this short-term trend, though strong evidence for a bullish reversal is not yet present. The weak strength of the observed trend means high-conviction continuation is unlikely without further confirming price action, making a period of sideways consolidation a plausible alternative scenario.
Market Commentary: XLY/XLP Ratio Analysis (90-Day View)
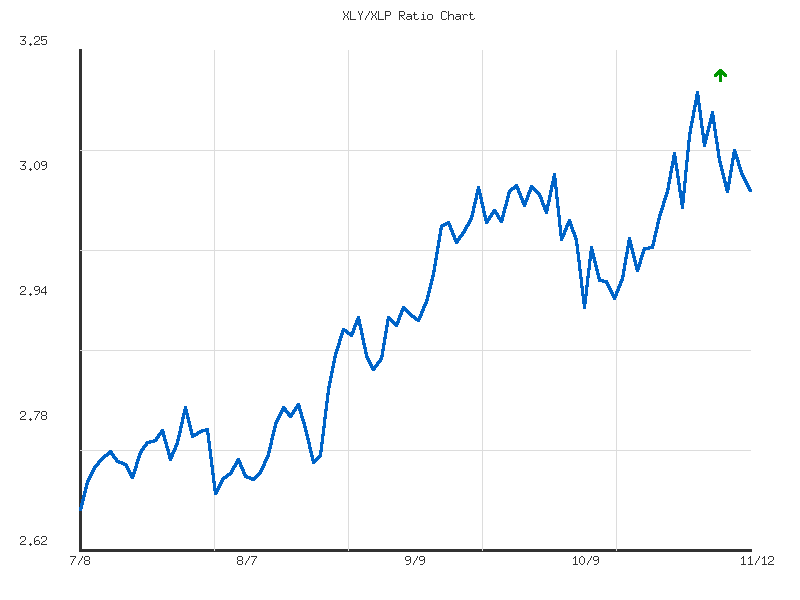
The XLY/XLP ratio, representing the relative performance of Consumer Discretionary (XLY) to Consumer Staples (XLP), has demonstrated a clear and strong upward trend over the past 90 days. Commencing from a ratio of 2.675 in early July, the ratio has ascended approximately 15%, culminating at a current value of 3.077. This persistent rise, particularly given its “strong” classification within the provided trend data, strongly indicates a sustained ‘risk-on’ environment throughout this period, where investors have consistently favored growth-oriented sectors over defensive ones. The overall trajectory points to robust bullish momentum in this relative strength metric.
Examination of the ratio’s price action reveals that it has successfully established a series of higher highs and higher lows, peaking at 3.199 on November 3rd. While the current ratio of 3.077 suggests a minor retracement from this peak, it remains significantly above its 90-day average of 2.914. This positioning, approximately 76.6% between its 90-day low and high, suggests that the overarching bullish sentiment is still largely intact. The average ratio of 2.914 would likely serve as a significant support level in the event of a more substantial pullback, given its role as a central tendency point for the period.
A deeper look into the components reveals confirming technical behavior. The numerator, XLY, has shown appreciable appreciation from 217.66 to 237.88, while the denominator, XLP, has experienced a decline from 81.35 to 77.31 over the 90-day window. This dual action, where XLY advances while XLP recedes, reinforces the strength of the ‘risk-on’ signal embedded in the rising ratio. The stated volatility of 0.021 indicates that this strong upward trend has progressed with relatively contained daily price swings, implying a somewhat orderly and confident progression rather than erratic, high-volatility movements.
Looking forward, the prevailing strong uptrend makes a continuation of the XLY/XLP ratio’s ascent likely. We anticipate a retest of the recent 90-day high of 3.199. A successful break and sustained move above this level would confirm renewed upward momentum and further strengthen the ‘risk-on’ narrative. Conversely, should the ratio fail to breach this resistance and instead decline decisively below the immediate support around 3.05-3.07, there would be a roughly even chance of further consolidation or a deeper pullback towards the average ratio of 2.914. A sustained breach below the average ratio of 2.914 would be unlikely to occur without a fundamental shift in the prevailing technical dynamics, signaling a potential weakening of the ‘risk-on’ environment.
Ratio Analysis: XLY/XLP
Generated for 90days timeframe analysis
Equity Breadth
The SPXA50R, representing the percentage of S&P 500 components trading above their 50-day moving average, has exhibited a notable shift over the past seven days. Commencing at approximately 38.12% on November 4th, the indicator initially experienced a minor pullback to 38.92% by November 6th. Following this brief consolidation, a consistent upward trajectory became evident, with the value steadily climbing. By November 12th, the SPXA50R reached 51.40%. This strong progression indicates a growing number of individual stocks within the S&P 500 establishing short-term upward momentum. The move above the 50% threshold on the final day is a critical technical development, suggesting that a majority of the index components are now participating in the recent advance. It is likely that this expanding short-term breadth will contribute to underlying market stability, at least in the near term.
Concurrently, the SPXA200R, which tracks the percentage of S&P 500 members above their 200-day moving average, also demonstrated significant improvement during the observed period. Starting at roughly 49.90% on November 4th, the indicator saw a slight initial dip to 48.50% by November 6th. However, much like its 50-day counterpart, the SPXA200R subsequently experienced a robust and sustained rally, reaching 56.80% by November 12th. This consistent climb from below the 50% mark to firmly above it signals a broadening of longer-term bullish participation across the index. When a majority of stocks are trading above their 200-day moving average, it typically suggests increasing underlying strength and potentially more durable upward trends. The sustained increase makes it very likely that the market’s long-term technical health is improving.
The concurrent upward movement in both the SPXA50R and SPXA200R is a constructive development for the broader market. The transition of SPXA50R above 50%, coupled with the SPXA200R’s firm establishment above this crucial level, collectively suggests an expanding breadth within the S&P 500. This indicates that recent market gains are not merely concentrated in a few large-cap stocks but are instead being supported by a wider array of companies. Such broad participation often lends greater credibility to an overall market advance and could reduce the probability of an immediate, significant reversal. While short-term pullbacks are always possible, the current technical setup makes a rapid deterioration in market breadth highly unlikely without prior warning from these indicators.
Although the current trajectory of both breadth indicators is largely positive, alternative scenarios warrant consideration. A sudden negative catalyst external to this data could lead to a rapid reversal, causing both SPXA50R and SPXA200R to decline. However, based solely on the provided seven days of data, which show consistent daily improvements, the momentum appears to be to the upside. The indicators reaching 51.40% (50-day) and 56.80% (200-day) by the final observation date implies that the market is currently experiencing healthy internal dynamics. Continued upward movement in both measures would provide further confirmation of a robust market environment, making it very likely that the S&P 500 components are building a solid technical foundation. Monitoring these breadth indicators for any divergence or sharp decline will be crucial for assessing the durability of the observed strength.
SPY Daily
Over the past seven trading days, SPY’s price action initially saw a dip from the 2025-11-05 close of 677.54 to 670.24 on 2025-11-06, with elevated volume of 77.16M, suggesting selling pressure. This downward momentum persisted briefly on 2025-11-07, closing at 670.91 on even higher volume (92.96M), marking a test of recent support. Subsequently, the price recovered with increasing closes from 2025-11-10 (681.31) to 2025-11-12 (683.285). The most recent trading day, 2025-11-12, presented a small-bodied candle, indicating mild indecision, with volume decreasing to 56.31M, a potentially cautionary sign after the preceding upward moves. The 14-day RSI reflected this sentiment, dropping from 62.62 on 2025-11-03 to 48.17 on 2025-11-06, indicating a loss of momentum, before recovering to 59.25 on 2025-11-12, suggesting a re-establishment of positive momentum.
Analyzing support and resistance levels, the EMA_50_DAY, currently at 666.22, and the EMA_200_DAY at 623.55, both exhibit an upward trajectory, confirming a prevailing long-term uptrend. Immediate support is likely found near the 675 level, correlating with the lows observed around 2025-11-04 and 2025-11-10. A more robust support zone appears to be near the 661-666 area, encompassing the low from 2025-11-07 and the EMA_50_DAY. Significant resistance is evident in the 685-690 range, where previous highs, notably 689.70 from 2025-10-29, have limited upward movement.
Considering future price action, a bullish case is likely if SPY sustains its current recovery, breaking above the 685-690 resistance zone. The price is currently well above both key EMAs, and the RSI, while recovering, is not yet in overbought territory, suggesting room for further ascent. In this scenario, SPY would establish new highs. Conversely, a bearish case could develop if the current resistance holds and price breaks below the 675 short-term support. A decline below the 50-day EMA (666.22) would be a more significant bearish signal, likely leading to a test of the 650-653 range, which provided support after the 2025-10-10 drop. A sustained break below the 200-day EMA is unlikely in the immediate term, given the current trend strength. A neutral case is roughly even chance; price could consolidate within the 670-685 range, oscillating between identified support and resistance. The moderate RSI and mixed volume signals support a period of accumulation or distribution without a clear directional breakout.
Sentiment drivers, based strictly on the provided technical data, suggest a prevailing positive bias in the market, supported by the strong upward trend in both the 50-day and 200-day EMAs. The rebound from the early November dip indicates resilient buying interest; however, the decreasing volume during the recent price increases and the established resistance around 685-690 imply that buying conviction might be moderating, leading to cautious optimism. The market appears to be in a phase where positive sentiment is present but potentially tempered by profit-taking at established resistance levels, preventing an immediate surge into overtly overbought conditions.
SPY Technical Analysis: Nov 12, 2025
The SPY ETF has exhibited a clear intermediate-term uptrend over the past 90 days, characterized by a series of higher highs and higher lows. This upward trajectory commenced from price levels around in early July and has extended to the current trading range near . Significant upward movements were observed in late July, mid-August, and throughout September into early October. Volume analysis indicates generally active trading during both rallies and notable pullbacks, suggesting broad market participation in these price movements. Key periods of intensified volume, such as the sharp decline on August 1st and the more pronounced drop on October 10th, suggest moments of increased selling pressure within the broader bullish context, but these were typically met with subsequent buying interest leading to recovery.
Momentum analysis, as indicated by the 14-day Relative Strength Index (RSI), largely corroborates the price action. During periods of strong upward price movement, the RSI frequently entered overbought territory (above 70), notably in late July, mid-September, and early October. These instances of overextended momentum were often followed by minor price pullbacks, which brought the RSI back into more neutral ranges (between 40 and 60). For example, the significant price decline on October 10th, which saw SPY drop from approximately to , was accompanied by the RSI falling from over 70 to around 41, indicating a rapid loss of bullish momentum but not reaching oversold conditions. The RSI’s bounce from these lower levels generally corresponded with price recovery, confirming underlying demand.
In the more recent short-term, SPY achieved a peak near on October 28th, following a robust rally where the RSI again approached the overbought threshold, reaching approximately 69. Following this high, the ETF experienced a moderate pullback, with the price declining to a low of .31 on November 4th. This retracement was mirrored by the RSI, which fell to approximately 48 on November 6th and 7th, signaling a de-escalation of buying pressure and resetting momentum. Subsequently, the price has rebounded firmly, closing at .285 on November 12th, with the RSI now recovering to just under 60.
Given the observed patterns, it is likely that SPY will attempt to retest the recent high established around in the near term, supported by the recovering RSI momentum. A sustained move above this level would very likely signal a continuation of the intermediate-term uptrend toward new highs. However, a failure to decisively break above could indicate a period of consolidation or a deeper pullback. In such an alternative scenario, a retracement to the support established around - (the lows of early November) is a roughly even chance, particularly if buying volume diminishes. A breach below this support would raise the probability of a test of the level (early November’s lower trading range) or potentially the more significant support zone around the October 10th open/close levels in the - range, though this appears less likely in the immediate future without a strong catalyst.