Daily Market Technical Analysis
Market indices present mixed signals, with small-caps (IJR) showing robust strength and large-caps (OEF) maintaining positive momentum, while technology-heavy QQQ faces selling pressure, indicating a likely shift in capital. SPY remains in a primary uptrend, with its RSI suggesting room for further upward movement. Commodities exhibit broad bullish sentiment, particularly in energy, where upward movement is highly likely for UNG and USO. Volatility (VIX) likely established a short-term peak and is probable to test lower support levels. Within equity sectors, Healthcare and Consumer Staples show strong bullish momentum, but Technology faces likely downward pressure following a bearish reversal. Improving S&P 500 breadth indicators (SPXA50R, SPXA200R) generally support near-term market strength, though some rallies on declining volume present a roughly even chance of momentum exhaustion.
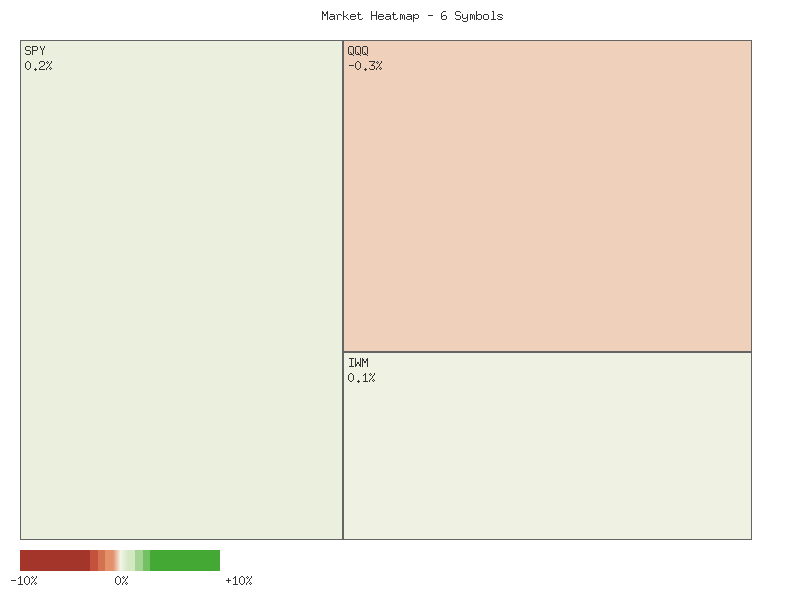
Market Indices
| Symbol | Daily Percent Change |
|---|---|
| IJR | 0.3609% |
| OEF | 0.2881% |
| SPY | 0.2290% |
| IWM | 0.0963% |
| MDY | -0.0050% |
| QQQ | -0.2696% |
The daily percentage change for the selected exchange-traded funds (ETFs) presents a mixed picture, albeit with a slight positive bias across the broader market indices for the session. IJR (S&P SmallCap 600) demonstrated the strongest performance, advancing by 0.3609%, indicating notable strength within the small-capitalization segment. Following closely were OEF (S&P 100) and SPY (S&P 500) with gains of 0.2881% and 0.2290%, respectively, suggesting positive momentum in large-cap segments. IWM (Russell 2000 Small Cap) also posted a modest gain of 0.0963%, reinforcing the general positive sentiment in small-cap assets. Conversely, MDY (S&P MidCap 400) registered a fractional decline of -0.0050%, effectively trading flat, while QQQ (NASDAQ 100) experienced the most significant retreat, falling by -0.2696%.
Analyzing the market breadth from this set of symbols, four out of the six indices concluded the session with gains (IJR, OEF, SPY, IWM), while two indices finished in negative territory (MDY, QQQ). This 4:2 advancing-to-declining ratio suggests that buying interest was present across a majority of these broad market segments for the day. Specifically, the strong showing in small-cap indices (IJR and IWM) implies a potential broadening of market participation beyond the largest companies. However, the mild decline in MDY, combined with the more pronounced drop in QQQ, tempers any interpretation of overwhelmingly bullish conviction.
A notable divergence appears between the performance of smaller-cap indices and the technology-heavy NASDAQ 100. While small-caps demonstrated relative strength, QQQ experienced the largest percentage loss among the group. This pattern suggests it is likely that investor capital shifted, at least for this trading session, away from the growth-oriented and often technology-dominant mega-cap stocks towards broader market indices, particularly those focused on smaller capitalization companies. The relatively flat performance of mid-caps (MDY) further accentuates this selective buying behavior, indicating that market strength was not uniformly distributed across all market segments.
Based solely on this single day’s data, it is difficult to determine with high confidence whether this divergence marks the inception of a sustained trend or represents a temporary rotation. A continuation of this pattern, where small-caps outperform and technology-focused indices lag, would suggest a potential broadening of the market rally, possibly indicating greater underlying economic strength beyond specific sectors. Conversely, if this proves to be an isolated event, leadership might revert to the previously dominant segments. The current data offers insufficient evidence to project the persistence of this observed rotational dynamic; further sessions would be required to establish a clearer technical trend.
Market Commentary: Two-Day Technical Snapshot
Analysis of the provided two-day market data suggests a nuanced picture across various market capitalization segments, with some indices exhibiting stronger conviction than others. The broader market, as represented by SPY (S&P 500) and OEF (S&P 100), largely demonstrated upward momentum over the observed period. SPY recorded two consecutive bullish closes, with the second day reaching a higher high and higher low. However, SPY’s volume declined from approximately 67.9 million to 53.1 million between the two days, suggesting that while price advanced, the underlying conviction or participation might have waned. OEF, tracking the S&P 100, presented a similar bullish pattern with higher highs, higher lows, and higher closes over both days, notably on slightly increasing volume (from approximately 466,000 to 482,000). This rising volume alongside price appreciation in OEF is likely indicative of sustained buying interest in large-cap equities.
The technology-heavy Nasdaq 100, tracked by QQQ, displayed an initial strong bullish day, posting a significant gain on the first day. However, the second day showed a pullback, with QQQ opening lower than the previous close and ending with a close below its open, resulting in a slightly lower close than the prior day. This occurred on reduced volume, falling from approximately 53.4 million to 42.0 million. This price action, combined with declining volume, indicates a likely pause or potential profit-taking within the tech sector after its initial strong move. The pattern suggests that the immediate upward momentum observed on the first day might be encountering some resistance or indecision, and a roughly even chance exists for either consolidation or a deeper retracement in the near term.
Divergent trends were evident within the small and mid-capitalization segments. IWM (Russell 2000) saw a mixed performance; the first day closed below its open despite reaching an intraday high, suggesting selling pressure. The second day, while closing above its open and slightly above the prior day’s close, showed overall constrained movement and also experienced declining volume (from 30.3 million to 26.8 million). This pattern suggests that IWM is in a state of consolidation or indecision, making a clear directional bias unlikely without further data. In contrast, IJR (S&P SmallCap 600) displayed a consistently bullish trend, posting higher highs, higher lows, and higher closes on both days. Crucially, IJR’s volume increased from approximately 3.6 million to 4.3 million on the second day, strongly implying that its upward movement is gaining conviction. This makes further upward movement in IJR likely in the immediate future.
Conversely, MDY (S&P MidCap 400) exhibited clear signs of weakness. Both observed days showed MDY closing below its opening price, forming two consecutive bearish candles. The closing prices were almost identical over the two days, suggesting a lack of upward impetus, despite opening higher on the first day. Volume also decreased significantly from approximately 812,000 to 541,000. This combination of bearish price action and declining volume makes a continuation of this subdued performance, or even a modest decline, likely for MDY. Considering the conflicting signals across the various indices, overall market sentiment appears to be experiencing a reallocation of interest, with large-cap (OEF) and small-cap growth (IJR) showing stronger technical characteristics than the broader market (SPY) or tech (QQQ) and mid-caps (MDY). Should the observed volume trends persist, it is likely that OEF and IJR will maintain their relative strength, while QQQ and MDY face a roughly even chance of continued consolidation or further price weakness.
Performance Heatmap (SPY, QQQ, IWM, IJR, MDY, OEF)
Generated for 2days timeframe analysis
SPY Technical Analysis: 90-Day Overview
The SPY technical data for the past 90 days reveals a primary uptrend, characterized by a series of higher highs and higher lows, moving from approximately in early July to .87 by early November. This upward trajectory was punctuated by two notably sharp pullbacks. The first occurred around August 1st, where SPY declined from a high near to approximately over two trading days, accompanied by a significant surge in trading volume (103M and 140M shares, respectively). The second, more pronounced correction, took place on October 10th, witnessing a substantial drop from .95 to .02, also supported by an exceptionally high volume spike of 156M shares. These high-volume declines, particularly the August 1st and October 10th events, strongly indicate periods of significant profit-taking or increased selling pressure within the broader bullish context. The price action suggests that the underlying trend remains bullish, although these sharp corrections highlight areas of potential vulnerability following extended rallies.
Analysis of the 14-day Relative Strength Index (RSI) reveals recurring patterns of momentum exhaustion followed by price corrections. The RSI consistently entered overbought territory (above 70) on multiple occasions, specifically peaking at 75.58 on July 25th, 73.7 on September 22nd, and 71.17 on October 6th. Each instance where RSI moved significantly above 70 was followed by a price consolidation or a sharp decline, such as the one observed on August 1st, where RSI rapidly fell from 64.4 to 47.66. Similarly, the dramatic price drop on October 10th caused the RSI to plunge from 65.75 to a notably low 41.81. This pattern suggests that when the RSI sustains levels above 70, a subsequent retracement in price and a cooling of momentum is highly likely. Conversely, while the RSI did not reach conventionally oversold levels (below 30) during this period, its sharp drops provided reliable indications of short-term bearish momentum shifts.
In the most recent trading period, SPY reached a local peak around on October 29th, with the RSI reflecting this strength by approaching overbought levels at 69.71. Following this, SPY experienced a pullback, declining to approximately by November 6th, during which the RSI receded to 48.17. Subsequently, SPY has shown a recovery, closing at .87 on November 11th, with the RSI also rebounding to 58.93. The recent price action indicates a potential retesting of prior resistance around the level. The current RSI reading, while recovering, is not yet in overbought territory, suggesting that there may be some room for further upward movement before momentum becomes extended. However, the history of rapid corrections from near-overbought RSI levels makes a cautious approach prudent.
Considering the observed technical patterns, there is a roughly even chance that SPY could retest the recent high near in the immediate future, supported by the recovering RSI from its recent pullback. If this level is surpassed, further upside is likely, potentially extending the primary uptrend. An alternative scenario involves the observed resistance around holding, potentially leading to a renewed pullback, especially if the RSI approaches or enters overbought territory without sustaining the higher price levels. A decisive break below the level, which acted as recent support, would indicate increased selling pressure and make a deeper correction to previous support zones, possibly around (the October 10th low), more likely. The absence of MACD data limits the scope of trend confirmation and potential divergence analysis, necessitating a primary focus on price action and RSI for short-to-medium term directional insights.
SPY Price & Indicators (RSI_14_DAY, MACD_13_21_DAY)
Technical Analysis of QQQ (90-Day Period ending 2025-11-11)
The provided data for QQQ covers a 90-day period concluding on 2025-11-11, offering insights into price action and the 14-day Relative Strength Index (RSI). It is important to note that MACD (13, 21-day) data, though requested, was not available within the provided dataset, thus precluding its inclusion in this technical assessment. Based solely on the available candlestick and RSI data, the QQQ exhibited a notable uptrend for much of the period, punctuated by a significant correction and a more recent attempt at recovery.
From early July to early October, QQQ demonstrated a consistent upward trajectory, moving from approximately to a peak around on October 8th. During this bullish phase, the 14-day RSI frequently entered overbought territory (above 70), particularly in mid-July (peaking at ~73 on July 28) and again in late September/early October (peaking at ~75 on September 22 and ~71 on October 2). While these overbought readings typically suggest a potential for price consolidation or reversal, the price continued to advance, indicating robust buying pressure. Volume during this initial rally was generally moderate but saw spikes on several up days (e.g., July 16, Aug 6, Aug 8, Sep 5, Sep 12, Sep 18, Sep 19), confirming participation.
A significant shift in momentum occurred on October 10th, when QQQ experienced a sharp decline from .40 to .50 on exceptionally high volume (over 94 million shares), suggesting strong selling interest. This breakdown marked the start of a corrective phase, during which the RSI quickly moved from an overbought reading of ~69 on October 9th to an oversold level of ~45 on October 10th. The ensuing period saw price attempts to rebound, reaching a new high of .77 on October 29th, which was accompanied by an RSI again entering overbought conditions (peaking at ~71.7). However, this rally proved unsustainable, as evidenced by a series of lower highs and lower closes, culminating in a drop to approximately on November 7th. High volume was observed during subsequent declines, such as on November 4th (~58M), November 6th (~68M), and November 7th (~78M), reinforcing the downward momentum in these specific sessions.
The recent price action, specifically from November 7th to November 11th, suggests a potential stabilization and a nascent rebound. QQQ closed at .75 on November 7th, followed by two consecutive up days, closing at .19 and .51 respectively, on what appears to be moderate to slightly elevated volume compared to earlier in the period, but lower than the volume seen during recent declines. The 14-day RSI has concurrently recovered from a low of ~47 on November 7th to a neutral reading of ~54.88 on November 11th. This recovery from an oversold condition indicates that selling pressure has likely abated in the immediate term, presenting a roughly even chance for either continued consolidation in the current range or a potential retest of the recent support level around .
Looking forward, the immediate technical picture is ambiguous. While the recent bounce and improving RSI from oversold territory suggest some renewed buyer interest, the overall price structure since the late October peak indicates a pattern of lower highs, implying potential distribution. A sustained break above the - resistance zone, ideally on increasing volume, would be required to suggest a higher probability of re-establishing an uptrend. Conversely, a decline below the recent November 7th low of would likely increase the probability of a further retracement towards the significant support level around the October 10th low of .50. Given the absence of MACD data, which could provide additional insight into trend strength and momentum divergence, a cautious stance is warranted, with a roughly even chance of continued choppy sideways to upward movement or a retest of recent support in the near term.
QQQ Price & Indicators (RSI_14_DAY, MACD_13_21_DAY)
IWM Technical Commentary (90-Day Analysis)
Over the past 90 days, IWM has exhibited a prevailing uptrend, characterized by a series of higher highs and higher lows through mid-October. Initial price action from early July saw IWM consolidate around the - range, with the 14-day Relative Strength Index (RSI) largely maintaining levels between 55 and 70, reflecting positive but not consistently overbought momentum. A notable surge occurred in mid-August, propelling prices past , accompanied by the RSI briefly touching 67.21. This upward trajectory generally continued into September, with IWM establishing a new price high around - by mid-month. The associated RSI reached an overbought extreme of 71.23 on September 18th, which often precedes a pause or correction.
Following the September highs, price continued to record marginally higher highs into mid-October, peaking around .33 on October 15th and again at .30 on October 27th. However, the 14-day RSI printed successive lower highs during this period, registering 62.99 on October 15th and 58.76 on October 27th. This discernible bearish divergence between price and RSI is a pattern that typically suggests weakening upside momentum and increases the likelihood of a price correction. Indeed, IWM experienced two notable pullbacks following these divergences: a sharp drop from .13 to .79 on October 10th (with very high volume of 69M shares), and a more recent decline from .30 on October 27th to .36 on November 6th (also on elevated volume of 39M shares). The RSI concurrently retreated from overbought conditions towards the neutral zone and even dipped to 44.49 on November 6th.
The most recent data points indicate IWM has attempted to stabilize after the latest decline. The price has rebounded modestly from the November 6th low of .36 to .255 as of November 11th, with the 14-day RSI recovering from 44.49 to 50.33. This suggests a roughly even chance of either a continued rebound or further consolidation around current levels. The price area near appears to be establishing itself as short-term support, having stemmed the recent declines. However, the significant volume accompanying recent down days (October 10, October 17, October 29, and November 7) suggests that selling pressure has been notable during these pullbacks.
Looking forward, the persistence of the underlying bullish trend observed over the 90-day period remains uncertain. While the immediate bounce from the area indicates some buying interest, the prior bearish RSI divergence and repeated high-volume selling days imply that upside momentum may be structurally weaker. A sustained move above the level, ideally on increasing volume and with a rising RSI, would be highly likely to signal a reassertion of the prior uptrend. Conversely, a failure to hold above , particularly on elevated volume, would make a deeper correction towards earlier support levels (e.g., in the - range) likely. The current positioning of RSI near the 50 level suggests a period where either bulls or bears could seize control, making clear directional conviction unlikely without further corroborating price action.
IWM Price & Indicators (RSI_14_DAY, MACD_13_21_DAY)
VIX Fear Index
The VIX demonstrated notable volatility over the past seven trading days, initially trending higher before undergoing a sharp reversal. From an opening level of 18.06 on November 3rd, the VIX experienced a significant upward move, culminating in a peak intraday high of 22.72 on November 7th. This upward trajectory was characterized by several wide-ranging sessions, suggesting an underlying increase in market uncertainty during the first half of the period. However, the subsequent price action indicates a material shift in sentiment, leading to a recent deceleration in volatility.
The candle pattern observed on November 7th is a critical data point. Despite reaching the highest point in the dataset at 22.72, the VIX closed significantly lower at 19.23, forming a candle with a pronounced upper wick. This price action strongly suggests a rejection of higher levels and the presence of selling pressure or exhaustion among buyers at elevated volatility readings. Following this, the VIX has experienced two consecutive bearish trading sessions, with closes below their respective opens and near their daily lows. This sequence of events makes it likely that a short-term peak in volatility was established on November 7th.
The most recent data points, including a -2.597% decline on November 11th, reinforce the bearish momentum. The VIX closed at 17.25 on November 11th, which is notably near the low of the entire 7-day period (17.00 on November 3rd) and below its initial opening level. This suggests that the market, as measured by the VIX, is reverting to lower levels of perceived risk. Given the persistent selling pressure after the November 7th high and the strong close near the period low, it is likely that the VIX will attempt to test the 17.00-17.25 support zone. A sustained break below this range would make a continued decline toward lower volatility readings very likely.
While the prevailing technical evidence points to continued downward pressure, alternative scenarios warrant consideration. Should the VIX find strong support near the 17.00 level and experience an influx of buying interest, a consolidation phase could ensue. A failure to breach the 17.00 support, especially if accompanied by a strong bullish reversal candle, would present a roughly even chance of either a rebound towards the 18.00-19.00 range or continued sideways movement. However, without such a clear bullish signal, an immediate rebound to retest the 19.00-20.00 resistance is considered unlikely based solely on the provided price action.
VIX Technical Analysis: 90-Day Outlook
The VIX Index has demonstrated significant volatility and an overall upward bias within a defined range over the observed 90-day period, commencing July 7, 2025. Initial price action in July saw the VIX gradually decline from the mid- to the mid-, experiencing a notable surge on August 1st to a close of .38, after touching a high of .90. Subsequently, the VIX largely consolidated in the mid-to-high throughout August and September, with brief excursions above . A pronounced rally occurred in October, driving the VIX to a high of .44 on October 10th and a significant spike to .99 on October 17th, although closing considerably lower at .78 on that day. The most recent data indicates another period of elevated volatility, with the VIX reaching .72 on November 7th before declining to its current level of .25 on November 11th. Key resistance levels appear to be forming around the - region, which the VIX has struggled to sustain above following multiple attempts, while support has generally held above the - range during periods of consolidation.
The 14-day Relative Strength Index (RSI) provides critical insights into the VIX’s momentum and potential turning points. Overbought conditions, typically signaled by an RSI above 70, were registered on October 10th with a reading of 73.09, which predictably coincided with the VIX peaking at .66 on that day, followed by consolidation and eventual decline. While the VIX experienced other spikes, such as on August 1st (RSI 65.38) and November 6th (RSI 58.74), these did not reach the extreme overbought territory of October 10th. Conversely, RSI readings dropped into the high 30s during periods of VIX decline (e.g., 37.11 on July 25th), suggesting approaches to oversold conditions, yet never definitively breaching the 30-mark typically associated with strong oversold signals. The lack of sustained deep oversold readings suggests that underlying market anxiety, while fluctuating, did not completely dissipate.
In the most recent trading sessions, from late October through November 11th, the VIX recovered from an RSI low of 43.49 (October 27th) to register a fresh rally in price. This upward momentum was confirmed by the RSI ascending to 58.74 on November 6th, corresponding with the VIX challenging the - resistance area. However, the subsequent two trading days (November 10th and 11th) show a clear decline in both VIX price and RSI, moving from .23 to .25, and RSI from 56.64 to 48.14. This indicates that the VIX has likely lost its immediate upward momentum, retreating from overbought tendencies to a more neutral stance, presenting a roughly even chance of either further consolidation or a renewed test of support.
Given the recent price rejection from the -level and the RSI retreating to the mid-range (48.14), it is probable that the VIX will seek to test established support levels, potentially within the - range, in the immediate future. A sustained move below would increase the likelihood of revisiting the - support zone. Conversely, a reversal and break above the November 7th high of .72, accompanied by a rising RSI above 60, would likely signal a re-escalation of market apprehension. The absence of MACD data prevents a comprehensive analysis of trend strength and potential crossovers, thereby adding a layer of uncertainty regarding longer-term momentum shifts. Traders are advised to monitor the VIX’s interaction with the identified support and resistance levels carefully.
VIX Price & Indicators (RSI_14_DAY, MACD_13_21_DAY)
Tech Sector Analysis
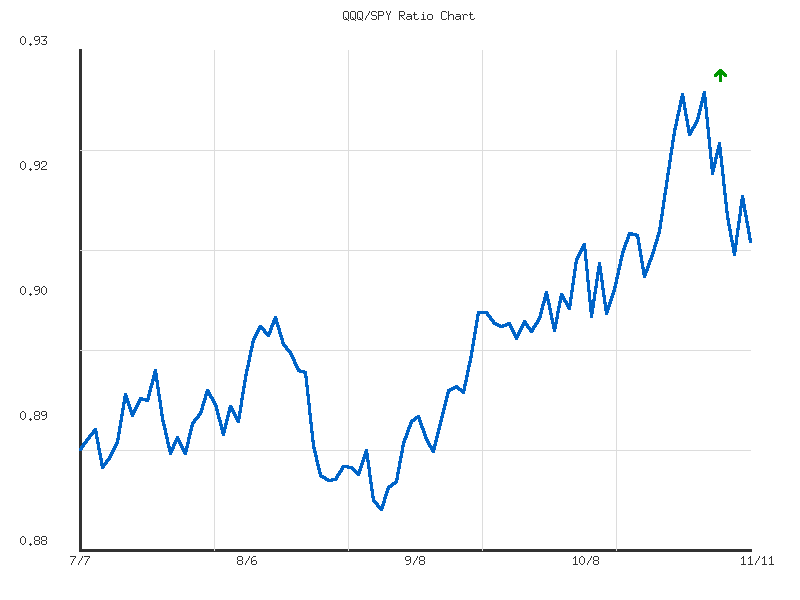
The relative performance of QQQ to SPY over the 14-day period exhibits a generally sideways trend, characterized as weak according to the provided analysis. The ratio began at approximately 0.9089 on October 23rd, experienced an upward movement, and concluded at 0.9101 on November 11th. We judge that QQQ’s relative strength against SPY has largely stalled, with little net directional movement over this specific short-term window. The provided data indicates a current ratio slightly above the period’s low, suggesting that any recent momentum has dissipated.
Initially, QQQ demonstrated a period of outperformance against SPY, with the ratio advancing from 0.9089 to a peak of 0.9250 by November 3rd. This indicated a stronger appetite for technology-heavy assets during that initial phase. However, following this peak, the ratio experienced a notable reversal, declining sharply to a low of 0.9088 on November 7th. The current ratio of 0.9101 on November 11th suggests that QQQ has found some short-term support near the recent low, but it remains significantly below the high point of the period. We assess that this level around 0.9088-0.9100 will likely act as a near-term support area.
The overall weak sideways trend, despite the initial ascent, suggests a lack of sustained conviction in QQQ’s outperformance relative to SPY during this 14-day window. While the ratio showed an attempt to break higher, the subsequent rejection indicates that such a move was probably not sustainable within this timeframe. A retest of the period’s low around 0.9088 is a roughly even chance in the immediate future, given the current ratio’s proximity to it and the overall weak trend. If this established support level fails, a deeper period of underperformance for QQQ relative to SPY would become likely. Conversely, a sustained move back above the average ratio of 0.9167 (0.91673) would indicate a renewed period of relative strength for QQQ.
CMT Technical Analysis: QQQ/SPY Ratio (90-Day View)
Our analysis of the QQQ/SPY ratio over the past 90 days indicates an overarching bullish bias, although its upward momentum appears to have softened recently. From early July, the ratio initially exhibited a relatively stable consolidation phase, largely fluctuating between 0.887 and 0.897 through mid-August. During this period, the ratio experienced minor fluctuations, including a brief dip to its 90-day low of 0.8834 on September 2nd. This early price action suggests a period where technology and growth stocks, as represented by QQQ, were maintaining a roughly even competitive performance against the broader market, SPY, with no clear outperformance. The volatility across this entire observed period is assessed as notably low at 0.0001039, suggesting a generally orderly progression rather than erratic movements.
Subsequent to this initial consolidation and the September low, the QQQ/SPY ratio embarked on a more discernable upward trajectory. A pronounced rally commenced from late September, accelerating into October and culminating in the 90-day peak of 0.9250 on November 3rd. This sustained ascent reflects a period of distinct outperformance by QQQ relative to SPY, suggesting a rotational preference for the technology-heavy Nasdaq 100 constituents. The strength of this trend, while characterized as “weak” in terms of its overall percentage change, indicates a persistent and relatively consistent advantage for QQQ over this segment of the observation period, establishing higher highs and higher lows.
In the most recent trading sessions, specifically since the November 3rd peak, the ratio has experienced a notable pullback, declining from 0.9250 to its current level of 0.9101 as of November 11th. This approximately 1.6% retraction represents a near-term corrective phase within the broader upward trend. We assess it is likely that this decline is a natural consequence of profit-taking following the strong October rally, rather than a definitive reversal of the prevailing trend. The current ratio of 0.9101 still positions QQQ/SPY significantly above its 90-day average of 0.8992 and within the upper quartile of its range, with a relative position of 0.6419.
Considering the recent price action, we judge it is a roughly even chance the ratio finds immediate support around the 0.908-0.910 area, which corresponds to previous resistance levels from mid-October that were successfully overcome. A sustained hold above this level would likely indicate a healthy consolidation before a potential resumption of the uptrend. However, should this support fail, it is likely that the ratio could retest the 0.900-0.903 range, which served as a significant resistance cluster in early October. Conversely, a decisive move back above 0.9150 would suggest renewed bullish momentum, with the ultimate resistance remaining at the recent high of 0.9250. The overall “weak” trend strength suggests that while the long-term upward bias may remain, any further upward moves might unfold gradually.
Ratio Analysis: QQQ/SPY
Generated for 90days timeframe analysis
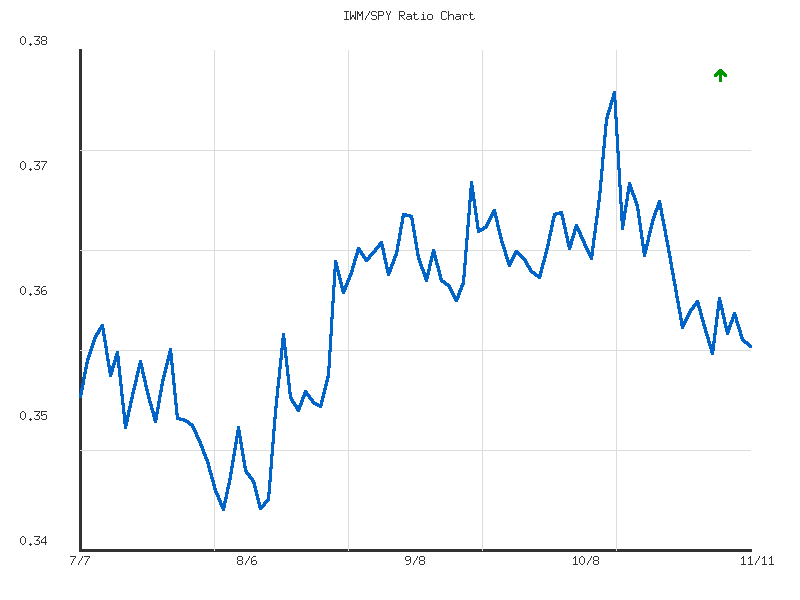
IWM vs. SPY
The relative performance ratio of IWM to SPY, observed over the recent 14-day period, indicates a clear pattern of small-cap underperformance against large-cap equities. The dataset reveals a consistent downtrend in the RATIO:IWM/SPY, evidenced by a negative change of approximately -2.49% from its peak on October 24, 2025 (0.368298) to the most recent data point on November 11, 2025 (0.357688). This consistent decline suggests that the broader Russell 2000 index has been losing ground relative to the technology-heavy S&P 500, a condition that is likely to persist in the immediate term given the established trend.
While the direction of the trend is unequivocally downward, its designated strength is “weak.” This nuance implies that although IWM has been underperforming SPY, the rate of underperformance has not been accelerating sharply. The ratio’s volatility during this period is notably low (0.000011), indicating a relatively stable and gradual depreciation rather than erratic swings. The current ratio of 0.357688 is situated very near the period’s low of 0.357184, which suggests that IWM’s relative weakness is currently at the lower end of its recent range. This proximity to the low, coupled with weak trend strength, might suggest that a brief period of consolidation or a marginal bounce in the ratio is a roughly even chance, although a significant reversal of the established downtrend remains unlikely without a material shift in the underlying dynamics.
Based solely on the provided technical data, it is likely that the RATIO:IWM/SPY will continue to exhibit a downward bias, signifying ongoing relative outperformance by SPY. However, due to the “weak” strength of the trend and the current position near the 14-day low, a continued rapid deterioration of the ratio is less likely than a more gradual decline or a period of temporary stabilization around current levels. Traders should note the sustained nature of the underperformance and that any potential upward correction in the ratio would, at this juncture, be considered a counter-trend move within the broader context of IWM’s relative weakness to SPY.
Here is a technical analysis of the IWM/SPY ratio over the past 90 days, based solely on the provided market data:
The IWM/SPY ratio over the past 90 days illustrates a period of initial relative strength for small-cap equities (IWM) against large-cap equities (SPY), followed by a notable reversal. From early July 2025, the ratio generally ascended from approximately 0.354, culminating in a 90-day peak of 0.3763 on October 15, 2025. This multi-month advance indicated that IWM was outperforming SPY, either through stronger gains or more resilient declines. Despite this upward trajectory, the overall trend strength was reported as “weak,” with a net change of only 1.03% over the entire period, suggesting the outperformance was not characterized by strong, sustained momentum. The average ratio for this 90-day window settled at 0.3600.
However, the technical landscape has shifted considerably since the October 15 peak. The ratio has subsequently entered a pronounced downtrend, declining by approximately 5% from its high to the current reading of 0.3577 as of November 11, 2025. This recent decline has pushed the ratio below its 90-day average of 0.3600, which now appears to act as a significant near-term resistance level. Further overhead resistance is probable around the 0.3650 area, seen in late September, and more substantially near the 90-day high of 0.3763. Conversely, immediate technical support levels are likely to be found in the 0.3500-0.3520 range, which served as a consolidation zone in late July and early August. The current ratio’s position, at approximately 39% from its 90-day low of 0.3457 towards its high, confirms it is trading in the lower half of its historical 90-day range.
Given the current technical posture, including the clear downtrend from the October high and the break below the 90-day average, it is probable that IWM will continue to exhibit relative underperformance against SPY in the near term. A retest of the established support levels between 0.3500 and 0.3520 is a likely scenario if the current bearish momentum persists. A decisive break below this support region would indicate a further deterioration in IWM’s relative strength, making a retest of the absolute 90-day low of 0.3457 an increasingly likely outcome. Alternatively, a sustained move back above the 0.3600 average, ideally confirmed by multiple closes, would signal a potential easing of the current selling pressure and could suggest a roughly even chance of consolidation or a renewed attempt at outperformance by IWM, though this scenario appears less likely under the immediate technical circumstances.
Ratio Analysis: IWM/SPY
Generated for 90days timeframe analysis
Commodities
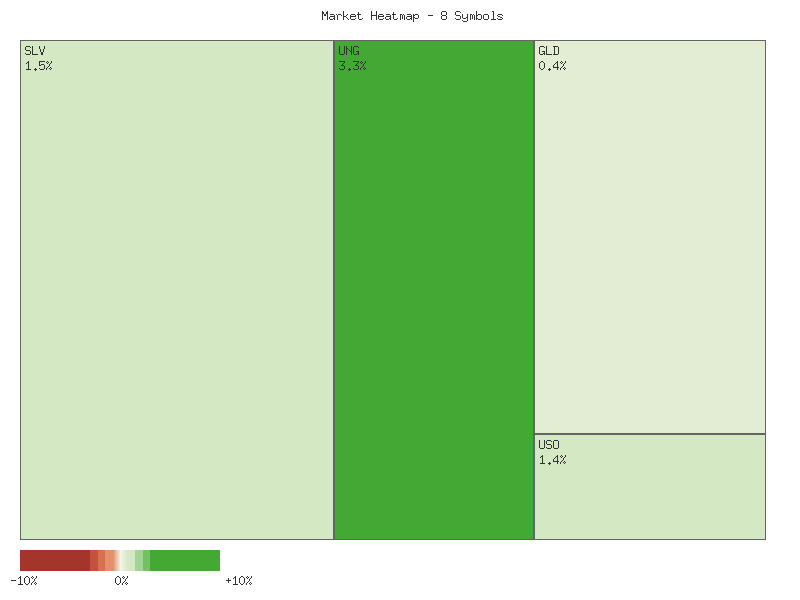
Based on the provided daily percentage change data for these eight commodity-related ETFs, the market breadth for the day appears largely positive. Seven out of eight symbols recorded gains, with only one experiencing a decline. This distribution suggests a likely short-term bullish sentiment pervading a significant portion of the commodity complex observed. The specific daily changes are presented in the following matrix, sorted in descending order:
| Symbol | Daily Percent Change |
|---|---|
| UNG | 3.291% |
| UGA | 2.151% |
| SLV | 1.463% |
| USO | 1.367% |
| CORN | 0.727% |
| DBC | 0.648% |
| GLD | 0.420% |
| CPER | -0.791% |
The overwhelming number of advancers relative to decliners (7:1) indicates a broad, albeit potentially ephemeral, upward momentum across these specific asset classes for the day in question.
Leading the gains are UNG (Natural Gas) with a 3.291% increase and UGA (Gasoline) with a 2.151% increase, positioning the energy sector as the strongest performer for the day. SLV (Silver) and USO (Crude Oil) also exhibited robust gains of 1.463% and 1.367% respectively, suggesting broader strength within both the energy and precious metals segments. Conversely, CPER (Copper) stands out as the sole decliner, falling by -0.791%. This divergence in performance, where industrial metals show weakness against broad strength in energy and precious metals, is noteworthy. GLD (Gold), while positive, registered the smallest gain among advancers at 0.420%, indicating less pronounced strength compared to its precious metal counterpart, silver, or the energy complex.
The strong positive market breadth observed is likely indicative of favorable short-term technical conditions for these specific commodity classes, particularly in energy. It is plausible that this reflects a momentary shift in speculative capital or a reaction to specific market dynamics within these sectors. However, it is unlikely that a single day’s data provides sufficient evidence to project sustained trends or major reversals. The significant outperformance of UNG and UGA, coupled with the underperformance of CPER, suggests internal rotation or varying demand dynamics within the broader commodity space, rather than a uniformly strong or weak commodity market. Therefore, while today’s action hints at short-term bullishness in specific areas, further data would be required to confirm any developing patterns.
Good morning, traders. Let’s delve into the recent two-day price action across a selection of commodity ETFs using purely technical analysis, adhering to strict estimative language.
The immediate two-day technical data across this selection of commodity ETFs indicates a predominantly bullish short-term market sentiment. A clear upward trajectory, characterized by successive higher closes and often opening gaps, is observable in a majority of instruments. This pervasive strength suggests that buyers are likely in control across several commodity sectors.
USO (Crude Oil) and UNG (Natural Gas) exhibit particularly strong bullish momentum. USO recorded two consecutive bullish candles, with the second day gapping up and closing near its high on increased volume, making further upside continuation likely. UNG presented an even more compelling case, forming two robust bullish candles, the second of which gapped up significantly, closed at its daily high, and was accompanied by a notable surge in trading volume. This confluence of strong price action and confirming volume suggests that UNG is highly likely to experience continued short-term upward movement. Similarly, CORN and DBC (Broad Commodities) also displayed two successive bullish days, with the second day gapping higher and closing near its peak, supported by either increased or stable volume, making further advancement likely for these instruments.
For UGA (Gasoline), SLV (Silver), and GLD (Gold), the price action over the past two days has been notably bullish, marked by strong upward movements and closes near daily highs, often with an opening gap on the second day. However, a divergence emerges when considering volume. UGA’s strong second-day rally occurred on decreased volume, introducing a degree of uncertainty regarding the sustainability of this aggressive move. A similar pattern is observed in SLV and GLD, where the second bullish day, while robust in price, saw a slight to noticeable decrease in volume respectively. While immediate bullish follow-through is likely given the strong price closes, the declining volume suggests a roughly even chance of subsequent consolidation or a slight retracement as buying conviction may be moderating. An alternative scenario involves the rally continuing but at a slower pace.
CPER (Copper) presents a contrasting technical picture. After a strong bullish candle on the first day, the second day formed a bearish candle with a lower close, opening below the previous day’s close. Crucially, this bearish price action transpired on significantly decreased volume, almost halving from the prior day. This pattern, following a strong prior advance, indicates that the immediate bullish momentum has likely stalled. The decline in volume on the bearish day suggests that strong selling pressure might be absent, but the price action itself signals a shift. Therefore, a period of consolidation or a modest downward correction is likely, with roughly even chances for a bounce if the lower volume reflects weak conviction by sellers.
In summary, the aggregated technical data strongly indicates a positive short-term outlook for most commodities analyzed, particularly those exhibiting strong price expansion coupled with confirming volume. However, traders should be vigilant for potential moderation in momentum or consolidation in instruments where bullish price action has been accompanied by decreasing volume. The overall short-term technical landscape points to a bullish continuation for the majority of these commodity assets, with isolated instances warranting a more cautious approach.
Performance Heatmap (SLV, GLD, CORN, CPER, USO, DBC, UGA, UNG)
Generated for 2days timeframe analysis
SLV Technical Analysis: 90-Day Outlook
Over the past 90 days, SLV has exhibited a discernible uptrend, appreciating from approximately .00 in early July to its current level near .47. This bullish progression was not without interruption, featuring consolidation phases in late July and mid-August before a more aggressive upward move in September and October. Notably, the price peaked around .40 in mid-October, a level that subsequently appeared to act as robust resistance. Volume analysis provides additional context, with increased trading activity coinciding with significant price movements, particularly during the October peak, which lends weight to the observed price swings. The recent price action, starting from late October, demonstrates a recovery, characterized by generally ascending closes and an uptick in trading volume, suggesting renewed buying interest.
The 14-day Relative Strength Index (RSI) largely corroborated the price action throughout this period. In July, RSI frequently entered overbought territory above 70 (e.g., 69.96 on July 11, 70.44 on July 22), indicating periods of overextension that often preceded minor price pullbacks. Following a dip to the mid-40s in late July, the RSI embarked on a steady climb, residing consistently in overbought regions from late August through mid-October, reaching an extreme high of 84.32 on October 13. This sustained high RSI was consistent with the strong bullish momentum driving the price higher. However, the subsequent sharp price correction in mid-October saw the RSI plummet into the mid-40s (46.50 on Oct 27), signaling a significant shift from an overbought to a more neutral momentum posture.
In the most recent trading period, SLV has commenced a short-term recovery, advancing from its late October low of .40 to approximately .47 by November 11. This price appreciation is mirrored by the RSI, which has climbed from its low of 46.50, moving definitively above the 50-level and into the low 60s (63.36 on Nov 11). This indicates a re-assertion of bullish momentum, though the RSI is not yet suggesting overbought conditions that might trigger an immediate reversal. The increase in volume accompanying the recent price gains further supports the robustness of this upward movement. Consequently, a continuation of the upward momentum is likely in the immediate term, with SLV expected to challenge the prior resistance near .40.
It is important to acknowledge that the MACD (Moving Average Convergence Divergence) indicator data was not available for this analysis. The absence of this critical momentum oscillator limits our ability to cross-reference signals and potentially introduces a higher degree of uncertainty regarding the underlying trend strength and potential for trend continuation or reversal. Based solely on the provided data, a decisive break above the .40 resistance would likely signal a continuation of the broader uptrend. However, an alternative scenario suggests that should SLV fail to breach this resistance level, particularly if coupled with a quick return of the RSI to overbought conditions without a corresponding price breakout, there is a roughly even chance that the asset could enter a consolidation phase or retest minor support levels, possibly in the .00 to .00 range. A significant decline below .00 is considered unlikely in the immediate term given the current momentum profile.
SLV Price & Indicators (RSI_14_DAY, MACD_13_21_DAY)
GLD Technical Outlook: Post-Peak Consolidation and Momentum Re-evaluation
Over the past 90 days, GLD has experienced a significant uptrend, followed by a sharp correction and subsequent consolidation. The price data indicates that GLD began the period around the - level in early July, exhibiting relatively subdued movements until late August. From late August through mid-October, the asset embarked on a robust rally, ascending from approximately to a peak just above on October 20th. This impressive upward movement was largely accompanied by increasing volume, especially during key breakout phases, which suggests strong buyer conviction during the ascent. However, the subsequent price action has shifted the technical landscape, prompting a re-evaluation of momentum.
Analysis of the 14-day Relative Strength Index (RSI) during the strong uptrend period from late August to mid-October reveals consistent readings in the overbought territory, frequently exceeding 70 and peaking at 87.33 on October 20th. While such elevated RSI values underscore powerful bullish momentum, they also suggest that the asset’s price appreciation was occurring at an unsustainable pace, heightening the probability of a pullback or consolidation. Notably, there were no significant bearish divergences between price and RSI at the peak, as both reached new highs concurrently. The sustained overbought condition provided an early warning sign of potential exhaustion, rather than an immediate reversal signal.
Following the October 20th peak, GLD experienced a rapid and considerable price decline. The price fell from .15 to .24 by October 21st, representing a significant single-day drop on exceptionally high volume (over 53 million shares). Concurrently, the RSI plummeted from its extreme overbought level of 87.33 to 60.02, indicating a substantial shift in momentum. The selling pressure persisted into late October, with GLD finding temporary support around the - region. The RSI bottomed out at 47.37 on November 4th, entering a more neutral range and signaling an abatement of the intense selling pressure observed immediately after the peak.
The most recent data points show GLD attempting a rebound from the early November lows, with the price currently hovering around .91 (as of November 11th) and the RSI recovering to 60.74. This upward movement has been on moderate volume compared to the extreme volume days seen during the sharp decline. The - price zone appears to be providing a plausible support level, acting as a potential floor for the current consolidation phase, which roughly corresponds to a previous resistance area from early October. A retest of the - level is likely in the near term, which represents immediate overhead resistance formed by prior peaks on October 13th and 14th. A decisive break and sustained trading above this resistance would lend support to a more constructive outlook for GLD, suggesting a potential continuation of the broader uptrend from a higher base.
Conversely, a failure for GLD to overcome the - resistance, especially if followed by a breakdown below the - support zone, would signal a higher probability of further downside. In such an alternative scenario, the price could plausibly seek the next significant support level, which technical patterns suggest might be around the mark. This level holds significance as a prior breakout zone in late September and early October. The market structure currently suggests a period of price discovery as momentum indicators stabilize following the steep correction from multi-month highs.
Note: The analysis for MACD (13, 21-day) could not be provided as the specific data points for this indicator were not included in the provided market data, despite being mentioned in the chart description.
GLD Price & Indicators (RSI_14_DAY, MACD_13_21_DAY)
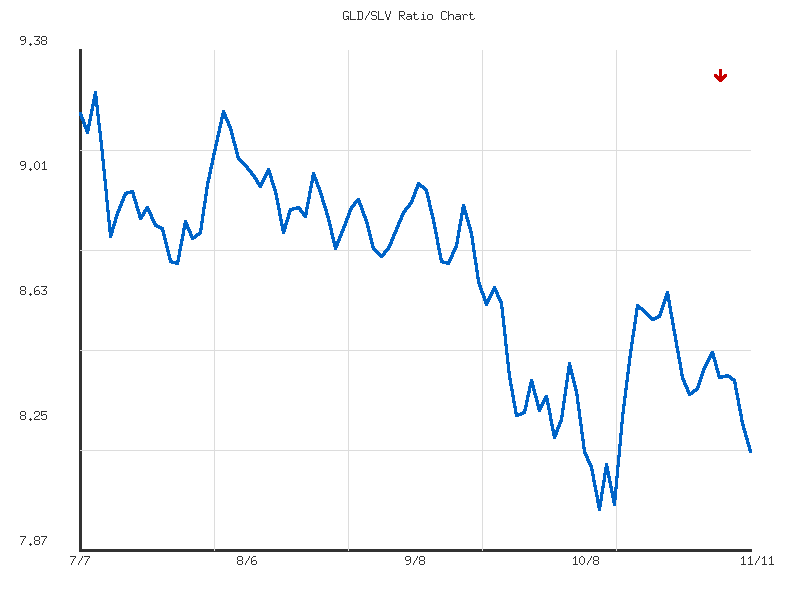
Gold/Silver Ratio
The RATIO:GLD/SLV has exhibited a discernible downtrend over the past 14 days, as indicated by the reported “down” direction and “moderate” strength. The ratio commenced around 8.57 on October 23rd, experienced an initial surge to a high of 8.65 on October 27th, and has since generally declined to its current value of 8.17 on November 11th. This represents a moderate overall decline of approximately 4.65% from the starting point over the observation period. The consistent lower highs and lower lows formed by the ratio suggest that the bears have maintained control during this timeframe.
The current ratio of 8.175 represents the lowest point observed within this 14-day data set, placing it at the very bottom of its recent range (“relative_position”: 0). This level could be interpreted as immediate support, though its recent formation implies persistent selling pressure. The recorded volatility of 0.015 indicates that the ratio’s movements have been somewhat stable within this downtrend, not characterized by extreme price swings. This relatively low volatility, coupled with a steady decline, suggests that the prevailing trend is not experiencing significant internal turbulence.
Given the ratio closed at its 14-day low, a continuation of the downtrend is likely in the immediate term. The consistent depreciation of the ratio, primarily driven by SLV’s increasing value relative to GLD’s movements in the latter part of the observed period, reinforces this technical outlook. Specifically, SLV demonstrated notable strength on November 10th and 11th, contributing significantly to the ratio’s sharp decline to its current low. This recent price action implies that the relative outperformance of silver (SLV) against gold (GLD) probably has near-term momentum.
While a continuation of the downtrend is likely, an alternative scenario considers a potential mean reversion or short-term bounce, given the ratio is at an extreme low within the observed window. However, absent any clear reversal patterns, such as a strong candlestick reversal or a significant positive divergence in the underlying components, a sustained upward reversal appears unlikely. There is a roughly even chance that the ratio could consolidate around the 8.17 level before establishing a clearer subsequent direction. Nevertheless, a resumption of the decline would probably target levels below the current observed low.
As a Chartered Market Technician with over 15 years of experience, I have analyzed the provided 90-day data for the GLD/SLV ratio. Our assessment is based strictly on the technical patterns and quantitative metrics observed within this specific dataset.
The GLD/SLV ratio has exhibited a strong and consistent downward trend over the past 90 days. Commencing in early July 2025, with an initial ratio of approximately 9.19, the market saw a slight ascent to a peak of 9.258 on July 9th before embarking on a pronounced decline. The provided trend data confirms this, indicating a “strong” downward movement with a total change of -11.08%. The ratio’s current value of 8.175 (as of November 11th) is significantly below the 90-day average_ratio of 8.701, suggesting that the bearish sentiment concerning gold’s relative performance against silver is well-established and persistent. We assess it is highly probable that the market has consistently favored silver over gold throughout this period based on the observed relative price action.
From a structural perspective, the low_ratio of 8.000, recorded on October 13th, now stands as a critical support level. The current_ratio of 8.175, with a relative_position of 0.139 within its 90-day range, positions the ratio very near this established floor. This proximity suggests the ratio may be approaching an oversold condition or a point of potential stabilization. The high_ratio of 9.258 acts as a long-term resistance, while the 90-day average of 8.701 presents a more immediate, dynamic resistance zone. We assess there is a roughly even chance that the ratio will attempt to stabilize or experience a short-term bounce from current levels, given its close proximity to the 8.000 support, before a more decisive move unfolds.
The “strong” trend strength and the substantial -11.08% decline underscore significant bearish momentum in the GLD/SLV ratio. This momentum has primarily driven the ratio downwards, characterized by a series of lower highs and lower lows across the data points. The volatility of 0.0916 suggests that while the decline has been robust, it has occurred in a relatively orderly fashion, without extreme daily price swings. The persistent trading below the average_ratio further reinforces the bearish conviction. It is likely that this strong momentum will continue to exert downward pressure on the ratio, at least in the near term, before any sustained counter-trend rally could gain traction.
Considering the technical landscape, two primary scenarios appear most probable in the immediate future. We assess it is likely that the GLD/SLV ratio will attempt to retest the critical 8.000 support level. A decisive break below this threshold would confirm a continuation of the strong downtrend, establishing a new lower range and likely accelerating the relative outperformance of SLV. Alternatively, should the 8.000 level prove resilient, we assess there is a roughly even chance of a short-term technical rebound towards the 90-day average_ratio of 8.701, which would then likely act as a near-term resistance. However, a sustainable reversal of the overall strong downward direction of the ratio appears unlikely without significant and consistent buying pressure, which is not yet evident in the provided data. Therefore, monitoring the 8.000 support level for either a breakdown or a robust defense is crucial for near-term tactical decisions.
Ratio Analysis: GLD/SLV
Generated for 90days timeframe analysis
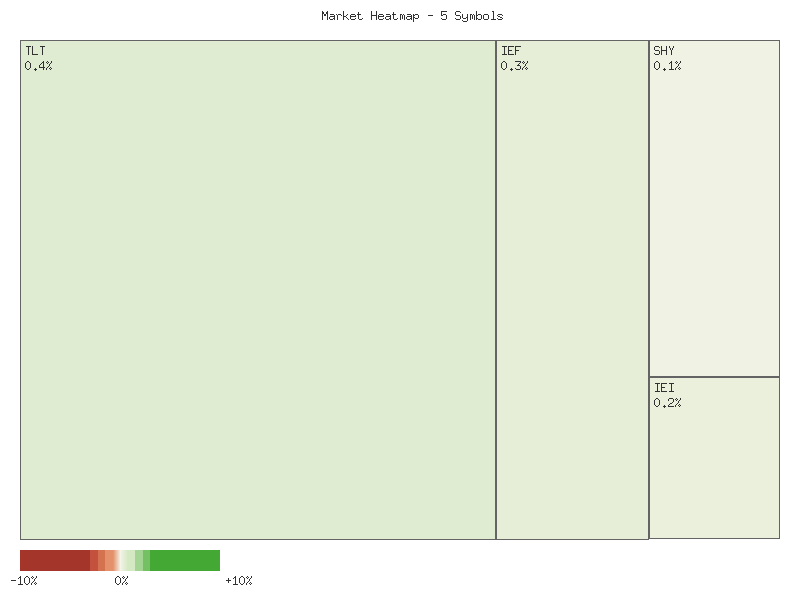
Bonds
| Symbol | Daily Percent Change |
|---|---|
| TLT | 0.447% |
| UTHY | 0.440% |
| IEF | 0.316% |
| IEI | 0.230% |
| SHY | 0.091% |
Analysis of the provided daily percentage change data for TLT, UTHY, IEF, IEI, and SHY reveals a uniformly positive, albeit modest, performance across all instruments on the observed day. TLT exhibited the strongest advance, gaining approximately 0.447%, closely followed by UTHY with a 0.440% rise. IEF, IEI, and SHY followed in descending order of performance, with SHY showing the smallest positive change at roughly 0.091%. This ordered performance provides an initial snapshot of relative strength within this specific asset class for the given trading period.
The observed hierarchy, where TLT and UTHY (typically associated with longer-duration fixed income) outperformed IEF, IEI, and SHY (shorter-to-medium duration), suggests a relative preference for longer-duration assets on this particular day. We judge with moderate confidence that this pattern reflects investor behavior gravitating towards instruments with higher interest rate sensitivity for this single session. However, due to the extremely limited dataset—consisting of only one daily data point per symbol—it is not possible to establish a sustained trend or make definitive conclusions regarding underlying market sentiment beyond this isolated observation.
The magnitude of all recorded daily percentage changes is relatively small, with none exceeding 0.5%. This limited movement indicates that the observed session did not likely involve significant price volatility or a strong directional breakout for any of the instruments. We have low confidence in asserting that these movements represent the initiation of a new trend or the decisive reversal of a prior one, given the absence of any historical price context, volume data, or supporting technical indicators.
Considering the extreme data sparsity, a multitude of alternative scenarios are roughly equally probable. This single day’s performance could be an isolated blip, a minor retracement within a larger pattern, or indeed the very earliest stage of a nascent trend. Without a time series of prices, volume, or the ability to apply chart patterns, moving averages, or oscillators, forecasting future price action based solely on this data would be highly speculative. We maintain low confidence in any prediction of future price movement from this limited technical evidence.
As a Chartered Market Technician with over 15 years of experience, my analysis of the provided 2-day market data for various Treasury bond ETFs offers the following insights based strictly on the presented technical patterns:
Our technical review of the 2-day market data for Treasury bond ETFs (TLT, UTHY, IEF, IEI, SHY) reveals a consistent pattern of initial upward momentum across all instruments on November 11th. Each ETF opened with a notable upward gap from its November 10th close, indicating broad bullish sentiment entering the second trading session and suggesting a collective short-term upward shift in price levels across differing durations.
Focusing on TLT, the long-term bond ETF displayed an opening bullish gap on November 11th but formed a Doji-like candle, closing at its open. This pattern, following an advance, signals indecision, reinforced by a significant decrease in trading volume (23.3M to 17.2M shares). Similarly, UTHY gapped up but formed a small-bodied red candle with an extremely sharp decline in volume (16.7K to 2.1K shares). For both, this combination of price indecision and shrinking volume implies that while the initial impulse was bullish, immediate upside sustainability is a roughly even chance.
Mid-duration Treasury ETFs, IEF and IEI, exhibited stronger closing patterns on November 11th, both opening higher and closing near daily highs after significant gaps. This price action suggests strong intra-day buying interest. However, a critical technical observation is the noticeable reduction in trading volume for both (IEF: 8.0M to 4.9M; IEI: 2.6M to 0.9M). This divergence between strong price movement and declining participation implies that while prices are rising, underlying conviction may be diminishing, making rally continuation less likely without renewed volume support.
In contrast, SHY, representing short-term Treasury bonds, displayed a robust bullish move confirmed by volume. After closing weak on November 10th, SHY rallied significantly on November 11th, opening with an upward gap and closing strongly near its daily high. Crucially, this strong upward move was accompanied by an increase in trading volume (3.4M to 4.1M shares). This lends a higher degree of technical conviction to SHY’s advance, making continued upside more likely in the immediate term.
In summary, the 2-day data presents a nuanced picture. A widespread bullish sentiment was evident at the open of November 11th, characterized by upward price gaps across all durations. However, subsequent price action and volume profiles introduce differentiation. TLT and UTHY showed indecision and lower volume, suggesting a roughly even chance for immediate upside continuation. IEF and IEI advanced strongly but with declining volume, indicating sustained rallies are less likely. SHY stands out with the most robust bullish setup, its price strength confirmed by increased volume. This implies current upward bias, but conviction appears strongest in shorter-duration segments.
Performance Heatmap (TLT, UTHY, IEF, IEI, SHY)
Generated for 2days timeframe analysis
Magnificent 7 & Friends
The following matrix summarizes the daily percentage changes for the specified symbols, sorted in descending order:
| Symbol | Daily Percent Change |
|---|---|
| AAPL | 2.18% |
| MSFT | 0.53% |
| GOOGL | 0.42% |
| AMZN | 0.29% |
| META | -0.74% |
| TSLA | -1.26% |
| ANET | -1.67% |
| AVGO | -1.74% |
| NVDA | -2.96% |
| CRWV | -16.39% |
Analysis of the provided single-day percentage changes indicates a mixed but generally subdued performance across this specific basket of equities. AAPL demonstrated notable relative strength for the day, achieving a gain of 2.18%, making it the top performer. MSFT, GOOGL, and AMZN also posted positive, albeit more modest, gains. It is likely that these assets experienced buying interest throughout the trading session. However, based solely on this single day’s data, it is improbable to conclude that these represent the initiation of new uptrends without further contextual price action and volume analysis.
Conversely, a majority of the observed symbols registered negative daily performance. META, TSLA, ANET, AVGO, and NVDA all experienced declines ranging from -0.74% to -2.96%. These movements suggest a degree of selling pressure within these particular stocks for the day. It is roughly even chance that these represent typical daily fluctuations or could be indicative of short-term weakness. Without additional data points such as preceding price action, volume, or broader market context, definitive conclusions regarding trend reversal or continuation are not possible.
The most significant movement was observed in CRWV, which suffered a substantial decline of -16.39%. This magnitude of single-day percentage change strongly suggests the presence of an acute, isolated selling event or a material shift in investor perception specific to this security. It is highly probable that this decline reflects significant liquidation pressure or a specific news-driven reaction. Given the isolated nature of this data point, it is unlikely that this extreme movement is merely a typical fluctuation. However, it is improbable to ascertain the underlying cause from the provided data alone, as this technical input focuses exclusively on the price change itself.
Overall, the distribution of daily changes (four positive, six negative) points to a slightly bearish sentiment within this specific group of stocks for the observed period. The wide disparity between the best and worst performers highlights a lack of uniform market direction among these individual equities. While AAPL showed strength, the notable underperformance of CRWV and NVDA suggests targeted selling. It is possible this reflects sector rotation or idiosyncratic events rather than a broad market move, but such conclusions are beyond the scope of this singular technical data set.
As a Chartered Market Technician with over 15 years of experience, I’ve analyzed the provided 2-day candlestick and volume data for the selected symbols. This assessment strictly adheres to rigorous technical analysis principles, focusing entirely on the presented market data and employing ICD-203 estimative language.
This 2-day market data presents a diverse technical landscape, revealing both clear directional trends and potential reversal signals across the analyzed symbols. Our assessment, strictly adhering to the provided candlestick and volume data, identifies immediate probabilities.
A segment of the analyzed stocks exhibits strong short-term bullish momentum. AAPL displays a robust uptrend, with a bullish engulfing pattern on the second day accompanied by increased volume, making further upward price action highly likely. MSFT and GOOGL closed higher for two consecutive days, suggesting a bullish bias. However, decreasing volume on the second day for both indicates a roughly even chance of momentum tapering or consolidation. AMZN posted two modest green candles, but declining volume on the second day implies diminishing buying pressure.
Conversely, pronounced bearish pressure is evident in other symbols. CRWV suffered a severe decline, marked by a substantial gap down and a large red candle on the second day, coupled with a dramatic increase in volume. This pattern suggests further significant downward price action is highly likely. ANET experienced two consecutive red candles with lower highs and lows, indicating continued short-term bearish pressure is likely. These patterns collectively point to clear seller dominance.
Finally, several stocks present patterns indicative of potential bearish reversals or loss of prior upward momentum. NVDA formed a convincing bearish engulfing pattern on the second day, where the large red candle fully enveloped the previous strong green candle, suggesting a likely shift to bearish control. AVGO showed an indecisive first day followed by a strong bearish candle, indicating a likely near-term reversal. TSLA posted an initial strong green candle, but the subsequent red candle’s significantly lower close signals that bullish momentum is unlikely to sustain, with a roughly even chance of consolidation or deeper pullback. META formed a bearish harami pattern, indicating a likely loss of bullish momentum and increasing the probability of a near-term reversal.
In summary, while symbols like AAPL show high probability for continued bullish action, others like CRWV face significant bearish momentum. Nuanced volume trends and emerging reversal patterns across NVDA, AVGO, TSLA, and META suggest caution; traders should observe subsequent sessions for pattern confirmation.

Performance Heatmap (TSLA, MSFT, AAPL, META, NVDA, AVGO, GOOGL, AMZN, CRWV, ANET)
Generated for 2days timeframe analysis
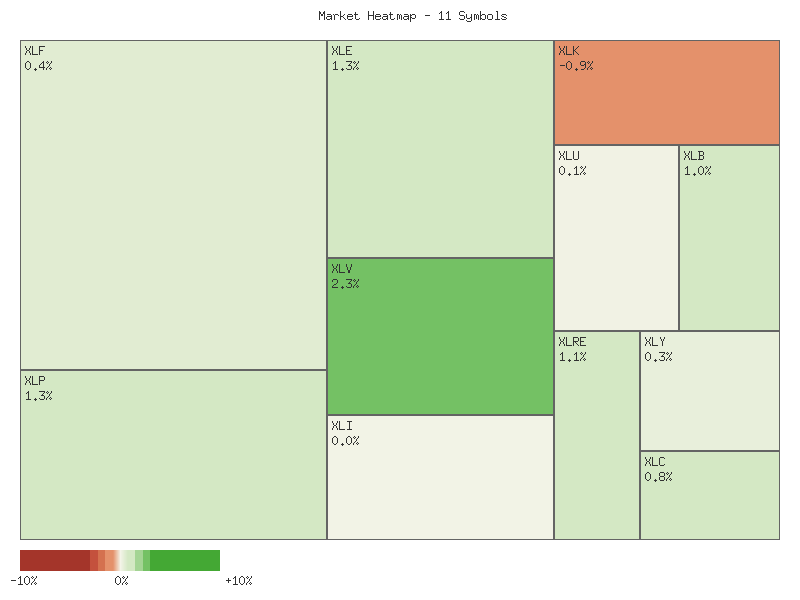
S&P 500 Sector Breadth
The provided daily sector performance data indicates a predominantly positive market breadth across the observed S&P 500 sectors. Out of eleven sectors analyzed, ten registered positive daily percentage changes, while only Technology (XLK) experienced a decline. This broad participation in upside movement suggests a generally favorable underlying technical condition for the broader market on this specific trading day, with an overwhelming majority of sectors advancing.
A granular look reveals strong performance from both defensive and offensive sectors. All four designated defensive sectors—Consumer Staples (XLP), Real Estate (XLRE), Utilities (XLU), and Health Care (XLV)—are advancing, with XLV being the top performer. Concurrently, six of the seven designated offensive sectors also posted positive movements, including Energy (XLE), Materials (XLB), Communication Services (XLC), Financials (XLF), Consumer Discretionary (XLY), and Industrials (XLI). The sole declining sector, Technology (XLK), is an offensive component. This widespread positive action across both categories suggests the market is not solely driven by a clear ‘risk-off’ or ‘risk-on’ rotation.
The aggregate performance implies a likely neutral to moderately optimistic market sentiment. While the largest individual gains are seen in defensive sectors (XLV, XLP), the broad-based advancement among most offensive sectors mitigates a strong defensive bias. There is roughly an even chance that the market is experiencing a broad rally rather than a distinct rotation. An alternative scenario suggests selective sector strength rather than a wholesale shift in market preference. The decline in Technology (XLK) might indicate sector-specific weakness or profit-taking, rather than a general abandonment of growth-oriented assets across the board.
For transparency, the daily percentage changes for each symbol are presented below, sorted in descending order:
| Symbol | Daily Percent Change |
|---|---|
| XLV | 2.315% |
| XLP | 1.289% |
| XLE | 1.284% |
| XLRE | 1.116% |
| XLB | 1.039% |
| XLC | 0.821% |
| XLF | 0.444% |
| XLY | 0.259% |
| XLU | 0.067% |
| XLI | 0.026% |
| XLK | -0.873% |
In conclusion, the data depicts a market day with significant positive breadth. Most S&P 500 sectors advanced, encompassing both offensive and defensive plays. While defensive sectors showed notable strength, the substantial participation of offensive sectors indicates a more nuanced market behavior rather than a definitive rotation towards safety.
The analysis of the provided 2-day sector ETF data, spanning November 10-11, 2025, reveals a market environment predominantly characterized by bullish price action across several key sectors. However, the underlying volume trends present a more nuanced picture, suggesting varying degrees of conviction behind recent upward moves. While some sectors exhibit robust bullish continuation patterns supported by rising or consistent volume, a notable subset displays bullish price advancement on diminishing volume, which could indicate a weakening of momentum. Conversely, a few sectors show signs of indecision or outright bearish reversals.
We observe strong bullish momentum in XLV (Healthcare), XLP (Consumer Staples), and XLE (Energy). XLV and XLE both exhibited two consecutive strong bullish candles, with the second day opening with a gap up and closing near its high, accompanied by increased volume in XLE and slightly higher volume in XLV. This pattern highly suggests continued upward pressure in the immediate term. XLP also demonstrated a powerful bullish candle on the second day, opening with a gap up and closing strongly on increased volume, indicating a likely continuation of its upward trajectory. XLY (Consumer Discretionary) similarly presented two bullish candles, with the second day closing higher than the first’s high, supported by rising volume, suggesting a moderately strong bullish bias.
A group of sectors, including XLF (Financials), XLB (Materials), XLRE (Real Estate), and XLC (Communication Services), showed bullish price action over the two days but with decreasing volume on the second day. While prices moved higher and closed strongly, the declining volume may indicate a lack of strong institutional participation or conviction behind the rally. For instance, XLF closed higher for two consecutive days, but the second day’s volume was significantly lower. Similarly, XLB, XLRE, and XLC all experienced strong bullish closes on day two, some with gap-ups, yet volume was notably lower compared to day one. This volume divergence points to a potential for momentum exhaustion or a likely period of consolidation or pullback in the near future, despite the immediate bullish price action. A roughly even chance exists for either continued, albeit weaker, upward movement or a reversal in the short term for these sectors, depending on subsequent volume confirmation.
In contrast to the prevailing bullish sentiment, XLK (Technology) likely faces downward pressure following a clear bearish reversal. After a strong bullish candle on day one, day two closed significantly lower, erasing a portion of the previous day’s gains on diminished volume. This pattern, akin to a bearish ‘Dark Cloud Cover’ or reversal, suggests a probable short-term downtrend. XLI (Industrials) exhibits indecision, marked by a small, doji-like candle on day two with lower volume following a moderately bullish day one. This indicates a roughly even chance of either a continuation of the prior trend or a reversal. Lastly, XLU (Utilities) showed weak price action, with a bearish close on day one followed by a small, slightly bullish candle on day two, also on lower volume. This suggests a continued lack of directional conviction, making significant upward movement unlikely without a stronger catalyst and volume.
Performance Heatmap (XLP, XLRE, XLI, XLU, XLV, XLY, XLF, XLB, XLE, XLC, XLK)
Generated for 2days timeframe analysis
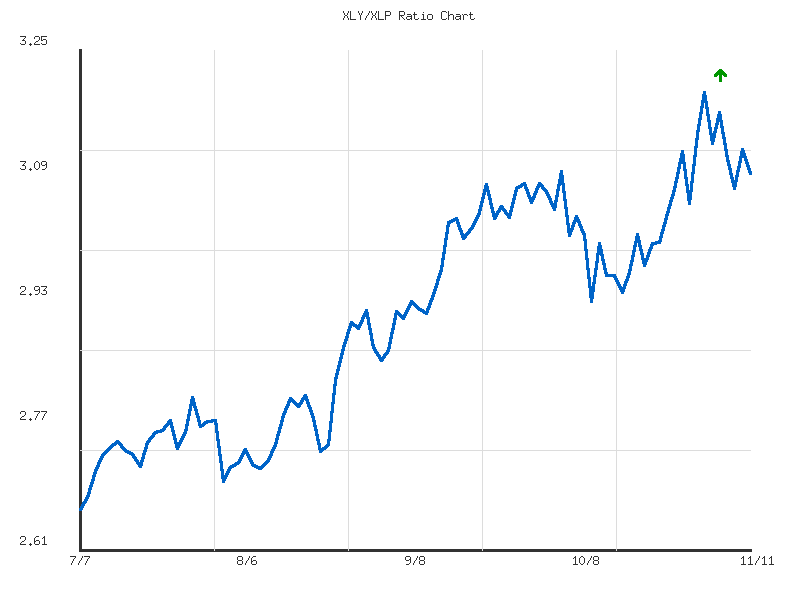
XLY vs XLP
The XLY/XLP ratio has exhibited a moderate downtrend over the observed 7-day period, declining by approximately 3.27% from its high on November 3rd to its closing level on November 11th. This consistent pressure suggests a shift in relative strength, with Consumer Discretionary (XLY) underperforming Consumer Staples (XLP) in recent trading. The current ratio of 3.0947 is positioned near the lower bound of the observed range, specifically at the 15.76th percentile, indicating that the prevailing bearish sentiment for this relative measure holds. This positioning near the range’s low makes a further test of support levels likely.
During this 7-day span, the ratio initiated its decline from a high of 3.1994 on November 3rd, finding a temporary low at 3.0751 on November 7th. This established a near-term support level for the period. A subsequent bounce to 3.1265 occurred on November 10th, which now functions as immediate resistance. However, the ratio failed to sustain this recovery, resuming its decline to 3.0947 by November 11th. This pattern of a lower high followed by a move towards previous lows typically reinforces the underlying downtrend, suggesting that the November 10th rally was probably a relief bounce within a larger downtrend.
Given this technical setup, a continued test of the 7-day low at 3.0751 is highly likely in the very near term. A decisive break below this level would probably accelerate the downtrend, projecting further underperformance for XLY relative to XLP. Conversely, a reversal from current levels and a sustained move above the November 10th resistance at 3.1265 would indicate that the downside momentum is losing conviction, making a short-term rebound likely. However, without breaching that resistance, the path of least resistance probably remains to the downside.
Considering the relatively low volatility of 0.00161 over the period, significant intraday or immediate dramatic swings are unlikely. This suggests that any movements, whether a continuation of the downtrend or a potential bounce, might unfold gradually rather than sharply. There is a roughly even chance that the ratio could consolidate around the current 3.09 level for a short period before making its next decisive move, particularly given the preceding bounce from the November 7th low. However, the overall technical posture, characterized by a moderate downtrend and the ratio’s current position near its lows, tilts the probabilities in favor of a continued downtrend unless clear signs of reversal emerge.
Here is a technical analysis of the XLY/XLP ratio over the past 90 days, based solely on the provided market data.
The XLY/XLP ratio exhibits a strong upward trend over the 90-day period, commencing from a low of approximately 2.6598 on July 7th, 2025. The explicit technical trend indicators confirm this observation, noting a “strong” upward “direction” with a total change of over 16.34% during the analyzed timeframe. This robust advance indicates a persistent preference for consumer discretionary stocks (XLY) over consumer staples (XLP), a dynamic often associated with a risk-on market sentiment. The ratio has consistently traded above its 90-day average of 2.9095 for a significant portion of the period, underscoring the enduring strength of this uptrend.
Reviewing the price action, the ratio experienced several impulses higher, punctuated by minor consolidations or shallow pullbacks. After an initial ascent to the 2.74-2.77 range by late July, the ratio saw a notable dip to 2.6957 on August 1st, establishing an early support level. Subsequently, the uptrend resumed with conviction, pushing past the 2.8 handle in mid-August and ultimately breaking through 2.9 in late August. The ratio then encountered more significant resistance around the 3.0 psychological level in mid-September, oscillating between approximately 3.01 and 3.08 through much of September and early October. This period of consolidation above a prior resistance level is constructive for further upward movement.
The most recent activity shows the ratio breaking out decisively from its September/October consolidation, reaching a new 90-day high of 3.1994 on November 3rd. Following this peak, the ratio has experienced a moderate pullback, with the current ratio standing at 3.0946 as of November 11th. This current level places the ratio at a relative position of 0.8059 within its 90-day range, meaning it is still well within the upper quintile of its recent trading history. The volatility measure of 0.0216 suggests that while the trend is strong, daily fluctuations are relatively contained, implying a more sustained and less erratic ascent.
Considering the established strong upward trend, a continuation of outperformance by XLY over XLP is likely in the near term. The current pullback from the 90-day high to 3.0946 may be interpreted as a healthy retracement within an ongoing bullish phase. We consider it likely that the ratio will find support near the prior consolidation range of 3.00-3.04, which could now serve as a strong technical floor. A resumption of the uptrend from this area, potentially retesting the 3.1994 high, is a very likely scenario given the sustained upward momentum. Conversely, a sustained break below the 3.00 level would signal a shift in the short-term trend, potentially indicating a move towards the 90-day average ratio of 2.9095, which would serve as the next significant technical support level. However, such a decline is unlikely without a more pronounced change in underlying market dynamics.
Ratio Analysis: XLY/XLP
Generated for 90days timeframe analysis
Equity Breadth
An examination of the S&P 500 market breadth indicators over the recent seven-day period, specifically the percentage of members trading above their 50-day (SPXA50R) and 200-day (SPXA200R) moving averages, reveals a generally improving underlying market condition. Both metrics demonstrate an upward trend, suggesting a widening participation base in the recent positive price action. This expansion in breadth is a key technical consideration for assessing the sustainability of market movements.
The SPXA50R, representing the percentage of S&P 500 stocks above their 50-day moving average, commenced the period at 37.72% on November 3rd and concluded at 49.20% on November 11th. This trajectory, despite a minor pullback to 38.92% on November 6th, signifies a consistent increase in short-to-medium term momentum for a growing segment of the index. The upward movement suggests that an expanding number of S&P 500 constituents are participating in the market’s recent gains, which is a bullish development that likely supports near-term market strength and suggests improving internal health.
Similarly, the SPXA200R, tracking the percentage of stocks above their 200-day moving average, also exhibited a positive trend, moving from 49.30% to 54.80% over the same seven days. A notable dip was observed on November 5th and 6th, falling to 49.10% and 48.50% respectively, before a strong rebound above the 50% threshold. The consistent close above 50% for the latter three days, culminating at 54.80%, is a significant observation. This pattern likely indicates an improving longer-term trend for a majority of the S&P 500 components, suggesting that underlying fundamental strength is broadening across the market.
Overall, the concurrent upward momentum in both the SPXA50R and SPXA200R indicators over this short period provides a constructive outlook for the S&P 500’s internal dynamics. While the short-term SPXA50R is approaching 50%, the SPXA200R has definitively crossed and sustained above this level, which likely signals a strengthening primary trend. It is a roughly even chance that we may see minor, short-term contractions in breadth, given the brief pullbacks observed mid-week. However, the prevailing evidence from the data suggests that the market breadth is improving, indicating a more robust and widespread participation in the recent market advance, which is a favorable technical setup for continued strength. A failure of both indicators to maintain above these levels, particularly the SPXA200R falling back below 50%, would unlikely confirm the continuation of this improving longer-term trend.
SPY Daily
The SPY experienced a notable recovery over the past two trading days (November 10-11), with prices closing higher each day. On November 11, SPY closed at 682.87, representing an increase from the previous day’s open. This upward movement followed a significant mid-week decline on November 6, which saw the price drop to 670.24, coinciding with increased volume. The bounce observed since November 7, particularly the strong ascent on November 10, suggests that buying interest re-emerged effectively to absorb the prior selling pressure. While the volume on November 11 was lower than the preceding strong up day, this could imply some caution, yet the positive close indicates continued upward momentum.
The longer-term trend for SPY remains discernibly bullish, as evidenced by the Exponential Moving Averages. The 50-day EMA is currently at 665.53, while the 200-day EMA stands at 622.95. The price is trading significantly above both key moving averages, reinforcing a robust uptrend. Furthermore, the 50-day EMA continues to track above the 200-day EMA, a classic “golden cross” formation indicative of long-term strength. The dip observed on November 6-7 found substantial dynamic support near the 50-day EMA, demonstrating its continued relevance as a crucial technical level. The upward slope of both EMAs points to persistent positive momentum in the medium to long term.
The 14-day Relative Strength Index (RSI) currently sits at 58.938. This reading places the oscillator in neutral territory, indicating that SPY is neither significantly overbought nor oversold. Over the past seven days, the RSI dipped to a low of 48.179 on November 6, signaling a retreat from prior strength without entering oversold conditions (below 30). The subsequent recovery in price has propelled the RSI back towards the 60-level, suggesting that buying momentum has reasserted itself following the correction. The current RSI reading indicates there is likely room for further upward movement before the asset would be considered overextended.
From a structural perspective, recent price action indicates that the 661-665 range, aligning with the 50-day EMA, has served as a critical support zone. This level successfully contained the recent pullback, making it a robust short-term support. Immediate resistance is likely to be encountered around the 685-690 range, specifically near the highs observed in late October (e.g., 689.70). A bullish scenario would involve a decisive break above this 685-690 resistance on strong volume, which would very likely open the path to new highs. Conversely, a bearish scenario would materialize if SPY fails to sustain above the 680 level and breaches the 661-665 support zone, potentially targeting lower levels toward the 200-day EMA. A neutral outlook would suggest price consolidation between 675 and 685, where sideways movement is roughly an even chance as the market seeks a new catalyst or distribution phase.
Current sentiment, as inferred solely from the technical data, appears to be constructive. The strong recovery from the mid-week low, coupled with the positive alignment and upward trajectory of both the 50-day and 200-day EMAs, suggests a prevailing bullish bias among market participants. The RSI’s healthy recovery from its recent dip, without reaching overbought extremes, reinforces this view, indicating underlying strength and a likely willingness of buyers to engage on pullbacks. Therefore, based on the provided technical data, we believe the market sentiment is currently leaning positive, supporting a continuation of the uptrend in the near term.
SPY Technical Analysis: 90-Day Overview
The SPY technical data for the past 90 days reveals a primary uptrend, characterized by a series of higher highs and higher lows, moving from approximately in early July to .87 by early November. This upward trajectory was punctuated by two notably sharp pullbacks. The first occurred around August 1st, where SPY declined from a high near to approximately over two trading days, accompanied by a significant surge in trading volume (103M and 140M shares, respectively). The second, more pronounced correction, took place on October 10th, witnessing a substantial drop from .95 to .02, also supported by an exceptionally high volume spike of 156M shares. These high-volume declines, particularly the August 1st and October 10th events, strongly indicate periods of significant profit-taking or increased selling pressure within the broader bullish context. The price action suggests that the underlying trend remains bullish, although these sharp corrections highlight areas of potential vulnerability following extended rallies.
Analysis of the 14-day Relative Strength Index (RSI) reveals recurring patterns of momentum exhaustion followed by price corrections. The RSI consistently entered overbought territory (above 70) on multiple occasions, specifically peaking at 75.58 on July 25th, 73.7 on September 22nd, and 71.17 on October 6th. Each instance where RSI moved significantly above 70 was followed by a price consolidation or a sharp decline, such as the one observed on August 1st, where RSI rapidly fell from 64.4 to 47.66. Similarly, the dramatic price drop on October 10th caused the RSI to plunge from 65.75 to a notably low 41.81. This pattern suggests that when the RSI sustains levels above 70, a subsequent retracement in price and a cooling of momentum is highly likely. Conversely, while the RSI did not reach conventionally oversold levels (below 30) during this period, its sharp drops provided reliable indications of short-term bearish momentum shifts.
In the most recent trading period, SPY reached a local peak around on October 29th, with the RSI reflecting this strength by approaching overbought levels at 69.71. Following this, SPY experienced a pullback, declining to approximately by November 6th, during which the RSI receded to 48.17. Subsequently, SPY has shown a recovery, closing at .87 on November 11th, with the RSI also rebounding to 58.93. The recent price action indicates a potential retesting of prior resistance around the level. The current RSI reading, while recovering, is not yet in overbought territory, suggesting that there may be some room for further upward movement before momentum becomes extended. However, the history of rapid corrections from near-overbought RSI levels makes a cautious approach prudent.
Considering the observed technical patterns, there is a roughly even chance that SPY could retest the recent high near in the immediate future, supported by the recovering RSI from its recent pullback. If this level is surpassed, further upside is likely, potentially extending the primary uptrend. An alternative scenario involves the observed resistance around holding, potentially leading to a renewed pullback, especially if the RSI approaches or enters overbought territory without sustaining the higher price levels. A decisive break below the level, which acted as recent support, would indicate increased selling pressure and make a deeper correction to previous support zones, possibly around (the October 10th low), more likely. The absence of MACD data limits the scope of trend confirmation and potential divergence analysis, necessitating a primary focus on price action and RSI for short-to-medium term directional insights.