Daily Market Technical Analysis
The market experienced a broadly positive session, led by large-cap growth (QQQ), though diminishing volume signals caution for small/mid-caps, which face a roughly even chance of consolidation. Metals (GLD, SLV, CPER) are highly likely to continue upward momentum in commodities, while the VIX’s recent decline suggests reduced fear and is likely to persist downward. Overall, a “risk-on” sentiment is highly probable, with improving S&P 500 breadth indicators supporting the dominant bullish trend in SPY. However, bonds are likely to face continued short-term bearish pressure. The QQQ/SPY ratio is likely to retest resistance, but weak strength and an even chance of consolidation suggest no immediate decisive breakout.
Market Indices
| Symbol | Daily Percent Change |
|---|---|
| QQQ | 2.204% |
| OEF | 1.828% |
| SPY | 1.550% |
| IJR | 1.013% |
| IWM | 1.002% |
| MDY | 0.644% |
Analysis of the provided daily percentage change data across these six key market index ETFs reveals a broadly positive session. All six instruments recorded gains, indicating a universal advance on this particular day. The Nasdaq 100 tracking QQQ exhibited the strongest performance, advancing by 2.204%, which is roughly 20 basis points above the S&P 100 tracking OEF’s 1.828% gain. The S&P 500 tracking SPY also delivered a robust advance of 1.550%. This clustering of gains across large-cap and growth-oriented indices suggests a strong upward momentum originating from these segments, which is likely to contribute to overall market optimism.
Regarding market breadth, the data indicates a decisively bullish environment for the day under review. With all six symbols — QQQ, OEF, SPY, IJR, IWM, and MDY — closing with positive daily percent changes, the ratio of advancing to declining symbols is 6:0. This represents a perfect advance in the observed sample. Such unanimous positive movement across diverse market capitalization segments, from large-cap (QQQ, OEF, SPY) to mid-cap (MDY) and small-cap (IJR, IWM), indicates that buying pressure was pervasive. A breadth reading of this nature is generally interpreted as a sign of underlying market strength and suggests that the daily advance was not confined to a few dominant issues but was broadly supported.
While all segments advanced, the performance differential offers some insight into relative strength. The QQQ’s significant outperformance (2.204%) compared to the mid-cap (MDY at 0.644%) and small-cap (IJR at 1.013%, IWM at 1.002%) indices suggests that growth-oriented and larger capitalization stocks likely led the market on this specific day. This pattern, where technology and large-cap leadership is evident, implies that market participants might be favoring these segments for capital allocation. Conversely, MDY, representing mid-cap stocks, posted the weakest gain among the advancers. While still positive, its relative underperformance could suggest a comparatively lower conviction in the broader market outside of the largest components.
Considering alternative scenarios, had there been a mix of advancing and declining symbols, especially within the mid- and small-cap space, the interpretation of market breadth would be notably different. For instance, if IJR and IWM had declined, it would suggest a market advance primarily driven by larger-cap names, raising questions about the sustainability and underlying health of the broader market. However, based solely on the provided data, the universal advance indicates a strong day for equities. The persistence of such broad strength over multiple periods would be an indication that the current uptrend is likely robust and supported by a wide range of market participants.
Market data over the past two trading sessions reveals a pronounced bullish thrust across the analyzed U.S. equity benchmarks. On November 7th, all listed Exchange Traded Funds (ETFs) – SPY, QQQ, IWM, IJR, MDY, and OEF – registered strong bullish candles, characterized by closes near their daily highs and significant ranges. This robust initial price action established a clear short-term upward momentum, indicative of strong buying pressure entering the subsequent trading session.
On November 10th, this momentum largely continued, with all six ETFs opening with notable price gaps above their previous day’s closes. Specifically, SPY, QQQ, and OEF exhibited strong follow-through, posting additional bullish candles that closed near their respective daily highs. This pattern of two consecutive strong bullish sessions, punctuated by a gap-up on the second day, strongly suggests continued upward trajectory for these large-cap and broad market indices. Consequently, it is likely that SPY, QQQ, and OEF will attempt to test higher price levels in the immediate term, extending the current rally. However, a critical observation across all ETFs for November 10th was a consistent reduction in trading volume compared to November 7th, a factor that warrants careful consideration for the sustainability of this rally.
In contrast, the small and mid-cap segments, represented by IWM, IJR, and MDY, displayed some signs of diminishing conviction on November 10th, despite also gapping higher. While IWM and MDY maintained bullish closes, their candle bodies were notably smaller than those of November 7th, and they closed off their daily highs, suggesting less aggressive buying interest into the close. IJR exhibited the most pronounced softening, closing with a very small candle body barely above its open price, indicating minimal follow-through after its gap-up. The significant decline in volume for these smaller-cap indices, particularly the substantial drop of over 50% in IJR, suggests an increasing likelihood of near-term consolidation or a minor pullback as the initial momentum potentially wanes.
Considering the nuanced market signals, the technical posture suggests a bifurcated outlook. While the strong two-day rally, particularly in large-cap indices, makes further upward movement likely in the immediate future, the broad-based reduction in trading volume on the second day implies that this upward pressure might encounter resistance if buyer participation does not strengthen. Therefore, while a continuation of the rally is the primary scenario, there is a roughly even chance that these indices, particularly the less convincing small and mid-cap segments, could enter a period of consolidation or experience a minor retracement in the coming sessions. A complete reversal of the strong two-day bullish impulse, however, appears unlikely at this juncture, given the strength and conviction observed in the preceding bullish candles.
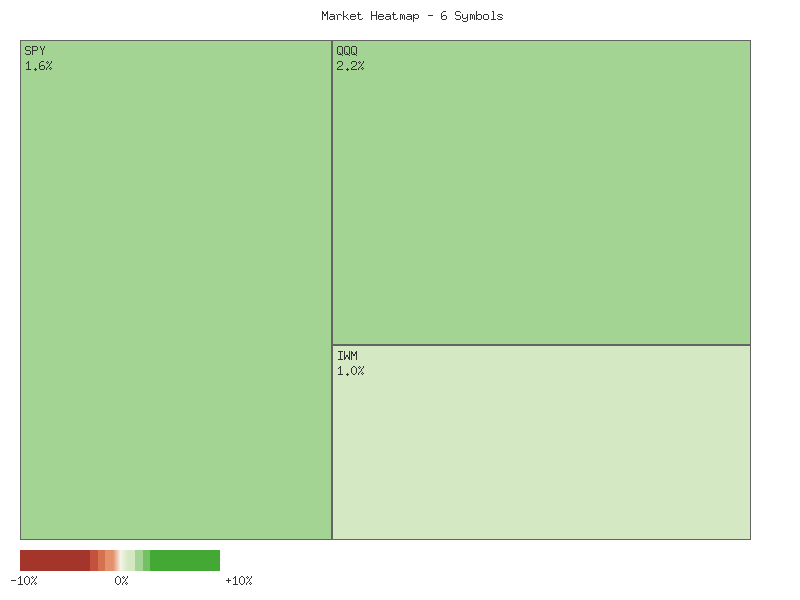
Performance Heatmap (SPY, QQQ, IWM, IJR, MDY, OEF)
Generated for 2days timeframe analysis
SPY Technical Analysis: 90-Day Overview and Current Outlook
Over the past 90 days, the SPY exchange-traded fund has largely exhibited a robust bullish trajectory, characterized by a series of higher highs and higher lows within the provided data. From early July lows around -, SPY progressed steadily, eventually reaching new highs near by late October. This upward movement was punctuated by two notable and sharp pullbacks. The first occurred around August 1st, with price retracting from approximately to on significantly elevated volume (140 million shares). The second, more pronounced correction, took place on October 10th, witnessing a decline from approximately to , accompanied by the highest single-day volume in the dataset (156 million shares). These corrections, while sharp, were followed by relatively swift recoveries, suggesting underlying demand at lower price levels. The most recent price action indicates a rebound from the November 6th low of .24 to the current close of .31 on November 10th, reflecting renewed buying interest.
The 14-day Relative Strength Index (RSI) largely corroborated the price action, frequently registering levels indicative of an overbought condition (above 70) during periods of strong rallies in July, September, and late October. For instance, RSI peaked at 75.58 on July 25th and 73.70 on September 22nd, preceding minor consolidations or pullbacks. Correspondingly, the significant price drops on August 1st and October 10th saw the RSI decline sharply to 47.66 and 41.81, respectively. These rapid descents from previously overbought or strong levels indicated a temporary dissipation of bullish momentum and an increase in selling pressure. However, in both instances, the RSI found support above the oversold threshold (30), which is a characteristic pattern in strong uptrends, further underscoring the market’s underlying resilience.
Presently, SPY’s RSI stands at 57.77 as of November 10th. This level is situated comfortably above the midpoint of 50, indicating that bullish momentum has regained ascendancy following the brief dip in early November, but it is not yet in overbought territory. This suggests that there is a reasonable probability of further upward price movement before the market might encounter significant exhaustion or a renewed selling phase based solely on the RSI. While the overall trend appears positive, the sharp, high-volume corrections observed twice in the 90-day period suggest that SPY remains susceptible to sudden, substantial downward moves. Therefore, while a continuation of the bullish trend is likely, a roughly even chance exists for periodic, rapid price pullbacks on elevated volume.
Note: Analysis of MACD (13,21-day) was requested but the corresponding indicator data was not provided in the market data for analysis. Therefore, no conclusions regarding MACD could be drawn.
SPY Price & Indicators (RSI_14_DAY, MACD_13_21_DAY)
QQQ Technical Analysis: Navigating Recent Volatility within a Broader Uptrend
The price action for QQQ over the last 90 days indicates a strong primary uptrend, characterized by a series of higher highs and higher lows. QQQ commenced the period around the - range, steadily advancing to establish a peak near in late July. This advance was interrupted by a notable sharp correction in early August, seeing QQQ decline to approximately on significantly elevated volume (69.4M shares on August 1st). Following this, a robust recovery ensued, propelling QQQ higher throughout August and September, breaking above the threshold. Another significant correction occurred on October 10th, where the price dropped sharply from approximately to on the highest volume recorded in the dataset (94.4M shares), suggesting considerable selling pressure. However, QQQ quickly regained its footing, entering a powerful rally that culminated in a new peak near .77 on October 29th. The most recent price action shows a retreat from this peak, with prices finding temporary support around the - level as observed by the bullish candle on the last day of data, 2025-11-10, closing at .19. This suggests the market is currently testing support after the sharp decline from the late October highs.
The 14-day Relative Strength Index (RSI) provides valuable insights into momentum. Throughout much of the 90-day period, the RSI has frequently entered overbought territory (above 70), aligning with periods of strong price appreciation. For instance, in early July, mid-September, and late October, RSI readings were consistently above 70, preceding subsequent price pullbacks. The early August price correction from saw the RSI plummet from the 70s to a low of 48.26, indicating a substantial loss of bullish momentum. Similarly, the sharp sell-off on October 10th pushed the RSI down from the low 70s to 45.42, confirming significant bearish impulse. In both instances, the RSI found support near the 45-50 range before price recoveries. Most recently, the RSI reached 71.73 on October 29th, immediately prior to the latest price downturn. As of November 7th, the RSI had fallen to 47.97, reflecting the recent selling pressure from the late October highs. The final data point for November 10th shows the RSI rebounding to 56.03, suggesting a modest recovery in momentum but still well below overbought levels. This pattern suggests that entering overbought conditions for RSI around the 70s has frequently preceded short-term price corrections, while dips into the mid-40s have often marked points of stabilization or rebound.
Based on the provided technical data, a continuation of the recent upward rebound in QQQ is roughly even chance in the immediate term. The bullish candle on November 10th, coupled with the bounce in the 14-day RSI from the mid-40s to 56, suggests that the selling pressure from the late October highs may be waning. Traders are likely to observe whether QQQ can sustain above the - support zone and subsequently challenge the previous high around .77. A successful break above .77 would reinforce the primary uptrend. However, an alternative scenario where QQQ faces renewed selling pressure and revisits lower support levels is also plausible, particularly given the previous history of sharp, high-volume corrections after reaching overbought RSI levels. The significant volume seen on the recent downturns (Oct 10th, Nov 6th) indicates strong distribution at higher prices. Should the - support fail to hold, a retest of the - range, a previous area of contention and support following the October 10th sell-off, becomes likely. It is important to note that the MACD indicator was specified in the analysis request but its data was not provided. Therefore, any insights that could be derived from MACD crossovers or divergences are absent from this analysis, limiting a comprehensive view of momentum changes and trend strength from that particular oscillator.
QQQ Price & Indicators (RSI_14_DAY, MACD_13_21_DAY)
Here is a technical analysis of IWM based on the provided 90-day market data, adhering strictly to ICD-203 estimative language guidelines.
The price action for IWM over the 90-day period, from early July to mid-November 2025, generally suggests an intermediate-term uptrend, although the most recent activity indicates a phase of consolidation. The price began around and experienced a significant rally, reaching a peak close of .33 on October 15, 2025, and an intraday high of .77 on the same day. This uptrend has been characterized by a pattern of higher highs and higher lows since a notable trough on August 1st at .92. Following the October peak, IWM has entered a period of lateral movement, with prices generally fluctuating between approximately and . We assess that current price action reflects underlying buying interest attempting to absorb selling pressure after the previous rally.
The 14-day Relative Strength Index (RSI) provides insights into momentum and potential overbought/oversold conditions. During periods of strong upward price movement, RSI registered values above 65 multiple times, notably hitting 71.57 on July 3rd, 67.21 on August 13th, and peaking at 71.23 on September 18th. Each instance where the RSI entered or approached the overbought threshold (above 70) was followed by a period of price consolidation or a minor pullback, which is consistent with the traditional interpretation of RSI signaling temporary buying exhaustion. Conversely, the RSI reached its lowest point at 41.36 on August 1st, coinciding with a price bottom, but never entered deeply oversold territory (below 30) within this 90-day window, suggesting that severe bearish momentum was largely absent or quickly reversed. The most recent RSI reading on November 10th stands at 49.98, which is a neutral level, indicating a rough balance between buying and selling pressure.
Volume analysis reveals several significant observations. The sharp decline on August 1st to .92 was accompanied by the highest volume in the dataset (63.85 million shares), which suggests strong conviction from sellers at that specific juncture. Subsequently, robust rallies, such as the one on August 22nd, which propelled IWM to .83, also occurred on notably high volume (58.20 million shares), reinforcing the validity of the upward price movement. More recently, a substantial price drop on October 10th was met with exceptional volume (69.67 million shares), underscoring intense selling interest. However, the ensuing recovery on October 13th transpired on comparatively lower volume (36.21 million shares), which we assess might suggest a weaker immediate conviction behind the bullish rebound. The recent consolidation since mid-October has seen intermittent spikes in volume, particularly during down days (e.g., October 29th, 55.44 million shares), indicating that sellers remain active in the market.
Considering the combined technical factors, we assess that IWM is currently undergoing a period of consolidation following a robust uptrend. The price action indicates strong support forming around the - level, which has successfully contained several recent tests. The RSI’s neutral posture does not offer immediate directional bias. A bullish continuation of the broader uptrend is likely if IWM can achieve a decisive breakout above the resistance zone between - on increasing volume, potentially targeting new price highs. Conversely, a breakdown below the established - support, particularly if accompanied by heavy volume, would signal a higher likelihood of further declines, potentially challenging previous support levels in the - range. We judge that a roughly even chance exists for either a breakout or a breakdown from the current consolidation range in the near term, given the balanced momentum and mixed volume signals during this recent lateral trading.
IWM Price & Indicators (RSI_14_DAY, MACD_13_21_DAY)
VIX Fear Index
Analysis of the VIX technical data for the observed period indicates a notable shift in market sentiment towards reduced volatility. The VIX experienced an initial upward trajectory, advancing from an open of 16.43 on 2025-10-31 to reach a multi-day high of 22.72 on 2025-11-07. This upward movement saw the VIX attempt to sustain levels above 20 on multiple occasions, notably on 2025-11-04, 2025-11-06, and culminating in the 2025-11-07 peak. However, the price action on 2025-11-07 presents a critical technical signal.
The candle pattern observed on 2025-11-07, characterized by a substantial upper wick extending to 22.72 and a close significantly below its open (19.52 open, 19.23 close), is a strong indicator of bearish rejection at higher levels. This ‘shooting star’ type formation suggests that despite attempts by buyers to push prices higher, sellers decisively reasserted control, likely marking a near-term top. We judge that this pattern, appearing after an upward move, provided an early signal of a probable reversal in the VIX’s short-term trend.
Confirmation of this bearish shift emerged on 2025-11-10, with the VIX closing at 17.71 and registering a daily percentage change of -7.90%. This substantial single-day decline following the reversal pattern of 2025-11-07 strongly reinforces the notion of prevailing selling pressure. The current close is also notably below the cluster of prices seen around the 19-20 level in the preceding days, suggesting a breakdown of short-term support established during the ascent.
Given the confluence of the reversal candle pattern and the subsequent significant bearish momentum, it is likely the VIX will continue to experience downward pressure in the immediate term. Potential short-term support levels might be found near the recent lows of 17.00 (from 2025-11-03) or 15.96 (from 2025-10-31). A test of these levels is a roughly even chance, as the strong downward move might propel it towards the lower end of the observed range.
An alternative scenario, while less likely given the current momentum and candlestick signals, would involve the VIX finding immediate support around its current 17.71 level and consolidating or staging a minor bounce. However, the decisiveness of the -7.90% daily change suggests that any rebound would likely be short-lived unless new data fundamentally alters the perception of market risk, which is not indicated by the provided technicals. We judge a continued decline to be the more probable path based solely on the presented data.
Technical Analysis of VIX, RSI (14-day) for the Past 90 Days
The VIX, the market’s “fear gauge,” has exhibited a pattern of notable volatility spikes interspersed with periods of relative calm over the past 90 days. From early July through late September, the VIX largely traded within a broad range, primarily between 14.5 and 18.0. During this period, brief surges above this band, such as the rise to 20.38 on August 1st or the high of 19.38 on September 2nd, were consistently met with subsequent retracements, indicating that market participants were quick to bid down implied volatility after initial scares. These pullbacks often brought the VIX back into the 15.0-16.5 zone, suggesting a persistent underlying level of calm or resilience in equity markets, as implied by the VIX’s inverse relationship with broad market movements. The absence of sustained upward momentum in VIX during these earlier spikes suggests that these were primarily temporary bursts of anxiety rather than the onset of a prolonged period of elevated volatility.
A more significant volatility event materialized in October. The VIX surged from approximately 16.3 on October 9th to a closing high of 21.66 on October 10th. This acceleration continued, with an intraday high reaching 28.99 on October 17th, although it closed that day at 20.78. This marked the highest volatility peak within the observed 90-day window, suggesting a more pronounced increase in market uncertainty during this specific period. Following this peak, the VIX embarked on a distinct downtrend, retreating steadily to the 15.6-16.5 range by late October. This retracement from the October highs indicates that the extreme fear observed earlier in the month began to dissipate, with VIX establishing a potential temporary support level around the mid-15s to low-16s, a level it had frequently visited in the preceding months.
The 14-day Relative Strength Index (RSI) provided corroborative insights into VIX’s price action. Throughout July, August, and September, the RSI mostly hovered in the neutral zone, generally between 40 and 55, with occasional forays into the high-50s or low-60s during VIX spikes. Notably, during the significant VIX surge on October 10th, the RSI reached a high of 73.09, firmly signaling an overbought condition. This RSI reading coincided precisely with the VIX’s peak in implied volatility, suggesting that the VIX’s rapid ascent was unsustainable in the very short term. Following this overbought signal, the RSI promptly corrected, falling to the mid-40s by late October, consistent with the VIX’s price retreat. In early November, a renewed VIX uptick (reaching 19.67 on November 6th) pulled the RSI back up to 58.74, but it did not reach the previous overbought extremes. The most recent RSI reading of 49.98 on November 10th places the indicator squarely in the neutral territory, suggesting a lack of strong momentum in either direction for the VIX.
Considering the combined technical picture, VIX is currently situated at 17.71 with a neutral RSI of 49.98, following a brief but significant surge earlier in November. The sustained upward momentum observed in the VIX from early October appears to have stalled, with a retreat from recent highs. Based on these patterns, it is roughly a moderately likely chance that VIX will continue to consolidate within its established range, approximately between 15.5 and 18.5, in the near term. A further retest of the lower bound of this range (around 15.5) is plausible, particularly given the RSI’s return to neutral. Alternatively, should VIX manage to hold above its recent low of 17.0 (November 3rd close) and the RSI begin to trend upwards from its neutral position, a retest of the early November highs (near 20.0) would become more likely. However, a significant breach of the October highs (above 22.0) is unlikely in the immediate future without a renewed, substantial catalyst to drive volatility, which is not indicated by the current technical data alone.
VIX Price & Indicators (RSI_14_DAY, MACD_13_21_DAY)
Tech Sector Analysis
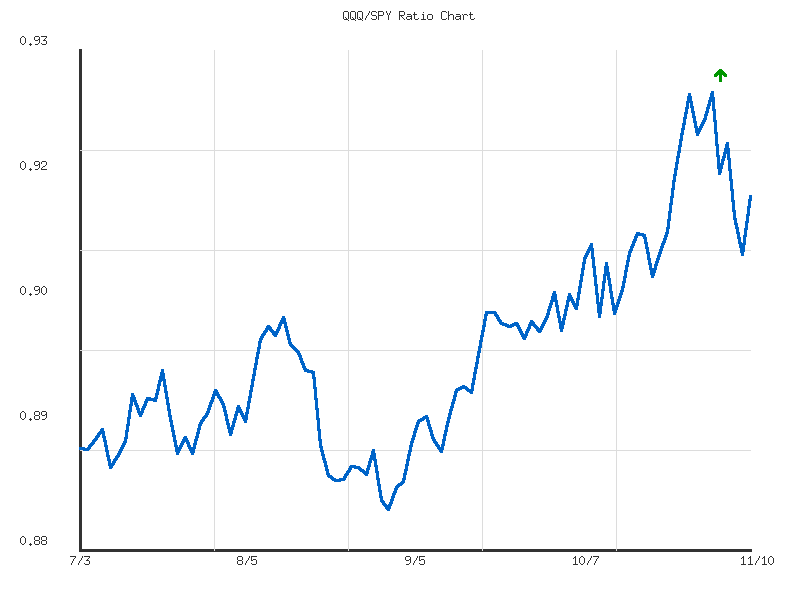
The relative performance of QQQ versus SPY, as measured by the QQQ/SPY ratio over the past 14 days, indicates a period of predominantly sideways consolidation. The provided data explicitly characterizes the trend as “sideways” with “weak” strength. The ratio has traded within a narrow range, from a low of approximately 0.9066 to a high of 0.9250. This low volatility environment suggests a near-term equilibrium between the technology-heavy Nasdaq 100 and the broader S&P 500, with neither index demonstrating a clear, sustained edge in performance over the other in this short timeframe.
Analyzing the price action, the ratio initially advanced from 0.9066 on October 22nd to a peak around 0.9250 by November 3rd, indicating a period where QQQ moderately outperformed SPY. However, this outperformance was not sustained, as the ratio subsequently retreated, notably dipping to 0.9088 on November 7th. The last data point shows the ratio at 0.9146, recovering slightly but remaining below the 14-day average of 0.9164. This positions the current ratio near the midpoint of its recent range (0.4356 relative position), suggesting it is not at an extreme overbought or oversold level based on this narrow historical window.
Given the identified “sideways” trend and “weak” strength, a continuation of this consolidation pattern is likely in the immediate future. It is a roughly even chance that the ratio will continue to oscillate within the established 0.9066-0.9250 range. A decisive breakout above the 0.9250 resistance level would suggest renewed outperformance for QQQ relative to SPY, while a breach below the approximate 0.9060 support level would imply increasing relative weakness for QQQ. However, the current data provides no strong technical signals to suggest a high probability for either a significant upside or downside breakout at this juncture. Without a material change in volatility or a clear directional impulse, market participants should anticipate continued range-bound behavior.
As a Chartered Market Technician with over 15 years of experience, I have analyzed the provided 90-day market data for the QQQ/SPY ratio. This analysis focuses exclusively on the technical patterns and quantitative metrics presented.
The QQQ/SPY ratio has exhibited an overall upward trend over the 90-day period, starting near 0.889 in early July 2025 and closing around 0.914 on November 10, 2025. This 2.84% increase indicates that the Nasdaq 100 ETF (QQQ) has generally outperformed the S&P 500 ETF (SPY) during this timeframe. Despite the clear upward direction, the provided trend summary categorizes the strength as “weak.” This implies that while the long-term relative performance favors QQQ, the ascent has likely been characterized by periods of consolidation or pullbacks rather than a sustained, robust surge. The current ratio stands in the upper quartile of its 90-day range, specifically at the 75th percentile relative to its low of 0.883 and high of 0.925.
From a structural perspective, the ratio established a significant support zone around 0.883 to 0.886 in late August and early September, representing a key low point for relative QQQ performance. Subsequent price action saw a series of higher lows and higher highs, affirming the developing uptrend. A notable rally initiated in late September, propelling the ratio from approximately 0.890 to its peak of 0.925 on November 3rd. This 0.925 level now stands as a critical near-term resistance, as the ratio subsequently failed to sustain above it. Intermediate support might be observed around the 0.908 to 0.910 area, which stemmed the initial pullback from the recent high.
The recent price action warrants closer scrutiny. Following the peak at 0.925 on November 3rd, the QQQ/SPY ratio experienced a decline to 0.908 by November 7th, marking a significant pullback from its top. This suggests that buying pressure at the 0.925 level was insufficient to maintain the rally, potentially forming a short-term double top or signaling an exhaustion of upward momentum. However, the ratio subsequently rebounded to 0.914 by November 10th, indicating that some underlying relative strength in QQQ persists, possibly preventing a deeper correction at this juncture. The “weak” trend strength summary suggests that a decisive breakout or breakdown without further consolidation is unlikely.
Considering alternative scenarios, it is likely that the ratio will attempt to retest the 0.925 resistance level in the short term, given the overall upward bias and the recent rebound from 0.908. A sustained break above 0.925 would signal a renewed period of strong QQQ outperformance. Conversely, there is a roughly even chance that the ratio could consolidate further or experience a deeper pullback if the 0.925 resistance proves resilient. A move below the 0.908 support could increase the probability of a test towards the 0.900 level, which has served as a psychological and technical threshold in prior periods. A decisive break below 0.900 would suggest a more significant shift in relative strength, potentially favoring SPY or indicating a protracted period of neutral relative performance.
Ratio Analysis: QQQ/SPY
Generated for 90days timeframe analysis
IWM vs. SPY
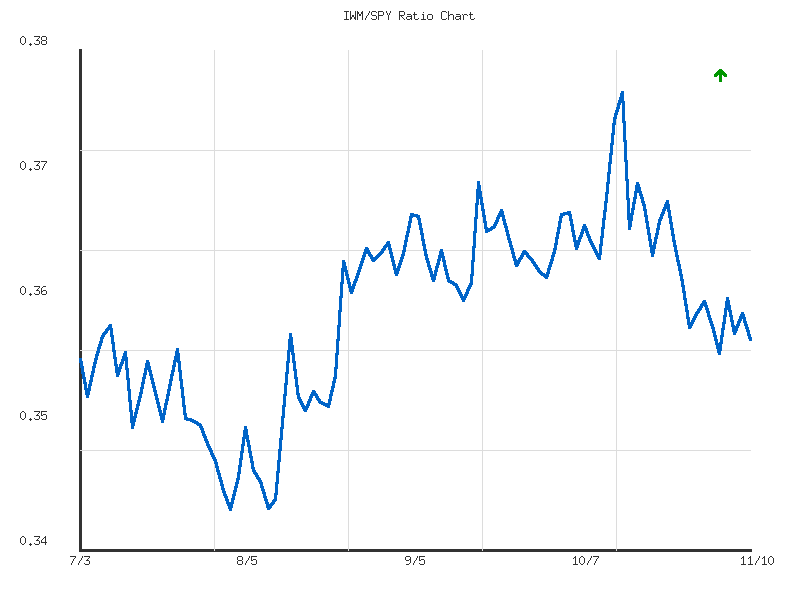
The RATIO:IWM/SPY has displayed a clear downward trend over the past 14 days, indicating that the S&P 500 (SPY) has been outperforming the Russell 2000 (IWM). The ratio declined approximately 1.71% from its peak value, closing the period at 0.35816. This persistent decline suggests that large-cap companies are likely attracting relatively more capital compared to small-cap counterparts during this specific timeframe.
The ratio’s highest point in the observed period was 0.36830 on October 24th. Following this peak, the ratio consistently trended lower, establishing a pattern of lower highs and lower lows. A significant nadir was reached on November 4th at 0.35718. While there were minor attempts at recovery on November 5th and 7th, these were short-lived, with the ratio ultimately closing near its 14-day low on November 10th. This action places the current ratio within 0.088% of its low, indicating the high likelihood of sustained relative weakness for IWM.
An important technical nuance is that while the trend direction is definitively ‘down’, its strength is categorized as ‘weak’. This implies that the outperformance of SPY is ongoing but not accelerating aggressively. Furthermore, the exceptionally low volatility of 0.0000108 over the period suggests that movements in this ratio have been stable and orderly, rather than erratic or subject to sudden shifts. This combination points to a measured, rather than panic-driven, preference for large-cap assets, making a sharp capitulation in small-cap relative performance unlikely in the immediate future without a material increase in volatility.
Given the prevailing downward trend and the ratio’s current position near its 14-day low, it is likely that SPY will continue to exhibit relative outperformance against IWM in the immediate term. However, the ‘weak’ trend strength introduces an element of uncertainty; a period of consolidation or a minor bounce cannot be entirely ruled out, though a significant reversal currently appears unlikely based on the existing data patterns. A decisive break and sustained move above the 14-day average of 0.36156 would be required to signal a potential shift in this relative performance dynamic, for which the current technical data provides no indication.
IWM/SPY Relative Strength: 90-Day Technical Outlook
The technical data for the IWM/SPY ratio over the past 90 days explicitly indicates a sideways trend, characterized by weak strength and notably low volatility. The ratio has traded within a defined range, fluctuating between a low of approximately 0.3457 recorded on August 1st and a high of roughly 0.3763 on October 15th. The current ratio stands at 0.3582, placing it within the lower half of this established 90-day range, specifically at about 40.7% from its low. The negligible net change of +0.40% over the entire period further corroborates the overarching sideways directional assessment, suggesting a period of consolidation where neither IWM nor SPY has demonstrated persistent relative outperformance.
Following the peak on October 15th at 0.3763, the IWM/SPY ratio has experienced a discernible downtrend, retracting substantially from its range high. This recent decline appears to have established a new short-term resistance area around the 0.3763 level, with secondary resistance likely around the earlier September peak of 0.3674. Given the overall weak sideways trend, such a pullback from resistance levels is a plausible development within a consolidation pattern. The magnitude of this decline to the current ratio of 0.3582 suggests a shift in short-term momentum towards IWM underperformance relative to SPY.
From a support perspective, the ratio is approaching a cluster of previously established lows. The zone around 0.3510 to 0.3520 (observed mid-July and mid-August) represents a significant support level. Further down, the absolute 90-day low of 0.3457 forms the ultimate technical support for this period. It is likely that the ratio will encounter some buying interest in the vicinity of these levels. Should the ratio successfully hold above the 0.3510-0.3520 region, a rebound towards the 90-day average ratio of 0.3599 is a roughly even chance, consistent with a continuing sideways consolidation. Conversely, a decisive break below 0.3510 would indicate a higher probability of challenging the 0.3457 low, suggesting intensified relative weakness for IWM.
In conclusion, the IWM/SPY ratio’s technical posture is currently situated in a recent downtrend, within a broader 90-day sideways consolidation pattern. The current ratio is below its 90-day average and closer to its period low than its high. It is highly probable that the ratio will continue to exhibit mean-reverting behavior, oscillating between established support and resistance levels, given the explicitly stated “weak” trend strength. Traders should anticipate the possibility of continued sideways movement, with short-term price action now testing critical support zones.
Ratio Analysis: IWM/SPY
Generated for 90days timeframe analysis
Commodities
| Symbol | Daily Percent Change |
|---|---|
| SLV | 4.304% |
| CPER | 2.932% |
| GLD | 2.718% |
| UGA | 1.259% |
| UNG | 1.227% |
| DBC | 1.092% |
| CORN | 0.732% |
| USO | 0.617% |
An analysis of the provided daily percentage change data for these eight commodity-related exchange-traded funds (ETFs) reveals a universally positive market session. We assess that all eight symbols experienced gains, ranging from SLV’s significant 4.304% advance to USO’s more modest 0.617% increase. This strong market breadth, with 8 advancing symbols and 0 declining symbols out of the analyzed set, is a clear technical signal. We judge it highly likely that this broad-based upward movement indicates a prevailing bullish sentiment across this specific basket of commodities on the observation day, suggesting demand is widespread rather than confined to a single sector.
The top performers for the session are notable: SLV (Silver) surged by 4.304%, followed by CPER (Copper) at 2.932%, and GLD (Gold) at 2.718%. These robust gains in precious and industrial metals strongly suggest these sectors are leading the current upward price action within this commodity group. We judge it likely that the strength in silver and gold may reflect an increased appetite for traditional safe-haven assets or an inflation hedge, while copper’s performance could imply an improved outlook for industrial demand. The significant magnitude of these gains relative to other commodities suggests a concentrated positive momentum in the metals complex.
Beyond the metals, other commodity categories also contributed positively, reinforcing the collective strength. UGA (Gasoline) gained 1.259%, UNG (Natural Gas) advanced by 1.227%, DBC (a diversified commodity index) was up 1.092%, CORN saw a 0.732% rise, and USO (Crude Oil) increased by 0.617%. This broad participation across energy and agriculture reinforces the observed positive market breadth, indicating that the bullish sentiment is not isolated to just one segment. We assess there is a roughly even chance that this single day’s strong performance could extend into the near term, given the unanimous positive momentum observed across all eight assets. However, for a more definitive trend confirmation, we would require sustained positive breadth and price action over subsequent sessions. Based purely on this single-day data, it is unlikely to infer an immediate reversal of this collective upward movement for the short term.
Technical Market Commentary: Two-Day Commodity ETF Analysis (November 7-10, 2025)
Our two-day technical review of select commodity ETFs reveals a predominantly bullish sentiment, with most instruments concluding the period with upward price action. However, a deeper analysis into candlestick patterns and corresponding volume trends suggests varying degrees of conviction among these assets. While several commodity-linked ETFs display robust bullish signals, others exhibit patterns where the accompanying volume decline could introduce near-term uncertainty regarding the sustainability of the upward momentum.
Specifically, GLD (Gold), SLV (Silver), and CPER (Copper) exhibit particularly strong bullish technical patterns. Both GLD and SLV formed textbook bullish engulfing patterns on the second day, where the open was significantly higher than the prior day’s close and the close was near the high, completely overshadowing the first day’s price action. Critically, this strong price appreciation was accompanied by a noticeable increase in trading volume for both assets, particularly GLD and SLV, and a near doubling of volume in CPER. This volume confirmation alongside the decisive price action makes it highly likely that these assets will continue their upward trajectory in the immediate short-term, with the strength of the breakout suggesting sustained buying interest.
A second group of commodity ETFs, including USO (Oil), DBC (Broad Commodities), CORN (Corn), UGA (Gasoline), and UNG (Natural Gas), also registered bullish closes but with a notable caveat. While USO and DBC demonstrated bullish continuation patterns, closing higher with higher highs and lows, their rallies occurred on decreased volume. Similarly, CORN showed a bullish close above the prior day’s range but on reduced volume. UGA and UNG both presented bullish reversal patterns, such as a piercing line or strong bullish hammer-like candles on Day 2, effectively reclaiming much of Day 1’s losses or even exceeding it, but also on declining volume. This decrease in participation during bullish moves typically suggests waning conviction from buyers and introduces a greater degree of uncertainty regarding sustained upward momentum.
Given the limited two-day data, the technical signals for this second group imply that a continuation of the rally is likely, but the diminishing volume indicates that the upward momentum may not be as robust or as sustainable compared to GLD, SLV, and CPER. There is roughly an even chance that these assets could experience a period of consolidation or a minor pullback in the very near term as traders assess the conviction behind the rally. Conversely, should volume pick up on subsequent positive price action, it would lend greater support to the continuation scenario. Traders should observe subsequent price action and volume closely to discern whether the initial bullish moves are truly supported.
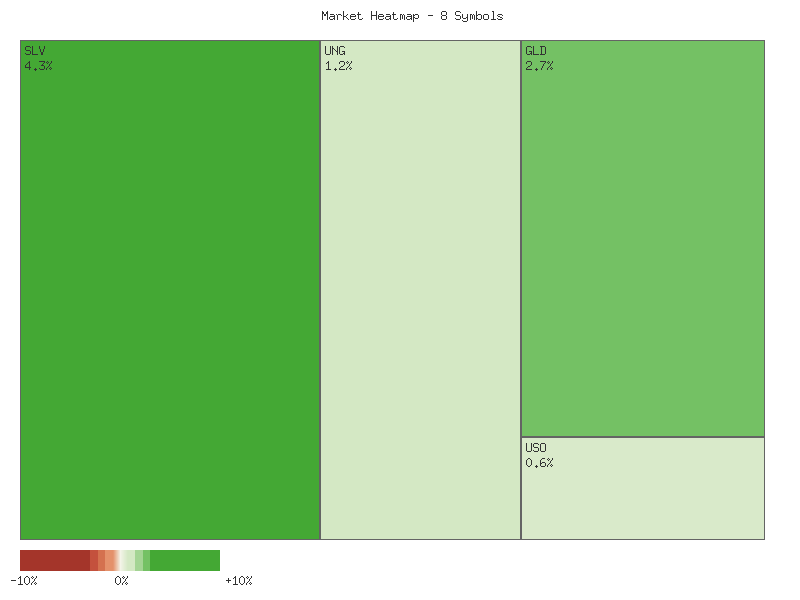
Performance Heatmap (SLV, GLD, CORN, CPER, USO, DBC, UGA, UNG)
Generated for 2days timeframe analysis
The SLV exchange-traded fund experienced distinct phases over the observed 90-day period. Initially, during July and early August, prices demonstrated a roughly sideways to slightly upward trajectory, generally confined between and . Trading volume during this period was moderate, not indicative of strong directional conviction. The 14-day Relative Strength Index (RSI) largely reflected this equilibrium, oscillating around the 50-60 level and occasionally approaching the overbought threshold of 70 before receding. This pattern suggests a market finding its footing rather than engaging in a committed trend. It is important to note that MACD (13,21-day) data was not provided in the market information and thus cannot be included in this analysis.
A notable acceleration in bullish momentum commenced from late August, propelling SLV into a robust uptrend that persisted through mid-October. Prices advanced significantly, ascending from approximately to reach an intraday high near .40 and a closing high of .33 on October 15th. This strong price appreciation was supported by a substantial increase in trading volume, particularly during upward moves, which typically validates the strength of a trend. During this powerful rally, the 14-day RSI consistently indicated overbought conditions, frequently registering above 70 and peaking at an extreme 84.32 on October 13th. While signaling intense buying interest, such extended overbought readings heighten the probability of an impending price correction due to an overextension of the market.
Indeed, the market transitioned into a pronounced corrective phase from mid-October, following the peak. SLV prices experienced a sharp decline from their highs, retracing significantly into the low . This period of selling pressure was evident through several high-volume down days, notably on October 17th and October 21st, suggesting active distribution rather than passive profit-taking. The 14-day RSI mirrored this bearish shift, plummeting from its highly overbought levels to settle in the mid-40s by late October and early November. This rapid deceleration of RSI indicates a significant dissipation of bullish momentum and a re-establishment of more neutral market sentiment.
The most recent data, concluding on November 10th, suggests a potential stabilization and attempted rebound for SLV. The closing price of .80 on November 10th represents an upward move from the recent lows observed in late October and early November. Concurrently, the 14-day RSI has recovered from its mid-40s trough, climbing to 60.97. This recovery places the RSI back into neutral-to-bullish territory, but it is not yet indicative of an overbought market. Given this price action and RSI recovery, a continued short-term upward momentum appears to be a roughly even chance, possibly aiming to test previous resistance levels around -. However, it is uncertain whether this rebound signifies the definitive end of the corrective phase or merely a temporary bounce within a broader period of consolidation or further decline. A failure to sustain prices above the area and a renewed decline in RSI would make a re-test of the recent lows in the low likely. Conversely, a decisive break above the resistance, accompanied by increasing volume and an RSI push towards 70, would make a resumption of the broader uptrend probable.
SLV Price & Indicators (RSI_14_DAY, MACD_13_21_DAY)
GLD demonstrated varied price action over the past 90 days. From early July through mid-August, GLD traded largely within a range between approximately and . The 14-day Relative Strength Index (RSI) largely remained in the neutral zone (between 40 and 60) during this period, with a brief dip into oversold territory (39.55) on July 30th when GLD closed at .96. This period established a foundational price area before a significant trend developed, with volume generally moderate, punctuated by occasional spikes.
From late August to mid-October, GLD experienced a robust and sustained uptrend, climbing from around to a peak close of .15 on October 20th. This impressive rally was accompanied by a consistent rise in the 14-day RSI, which entered overbought territory (above 70) by early September and remained there for much of the rally. The RSI reached extreme overbought levels, peaking at 87.33 on October 20th, precisely coinciding with the price peak. Such elevated RSI readings are highly likely to precede price corrections and indicate that the asset’s upward movement may be unsustainable in the short term. Volume increased significantly during this rally, particularly on strong up days, consistent with strong buying interest.
Following the peak on October 20th, GLD underwent a sharp and rapid correction. The price declined from .15 to a low of .01 by October 27th, representing a substantial retracement of the prior gains. This downturn was characterized by exceptionally high volume on the initial steep decline (53.69 million shares on October 21st), which strongly suggests significant selling pressure and a sharp shift in market sentiment. The 14-day RSI corroborated this shift, plummeting from its overbought extreme of 87.33 to 48.46 by October 29th, moving swiftly through the neutral zone and confirming a loss of bullish momentum.
In the most recent trading days, from late October through November 10th, GLD appears to have found a temporary bottom and is attempting a recovery. The price has gradually advanced from the - support zone, closing at .32 on November 10th. This recovery is reflected in the 14-day RSI, which has moved from around 47 to 59.70. This indicates strengthening bullish momentum; however, the RSI remains below the overbought threshold, suggesting there is still room for further upward price movement before the asset becomes technically extended. The volume during this recovery has been generally lower than the peak distribution phase, which could suggest less conviction behind the current rally.
Looking forward, a continuation of the current recovery is likely if GLD can sustain closes above the - area, with the next significant technical resistance likely near the - zone. A breakout above these levels would improve the probability of a test of the previous + highs. However, it is also plausible that the recent rally is a short-term rebound within a broader corrective phase following the extensive prior uptrend. If GLD fails to hold above and breaks below the - support established in late October, a further decline towards the - region becomes likely. The 14-day RSI would need to re-enter overbought territory to confirm strong bullish conviction, or dip below 40 to indicate renewed bearish pressure, with roughly even chances of either scenario in the immediate short term based solely on the current RSI and recent candle trends.
GLD Price & Indicators (RSI_14_DAY, MACD_13_21_DAY)
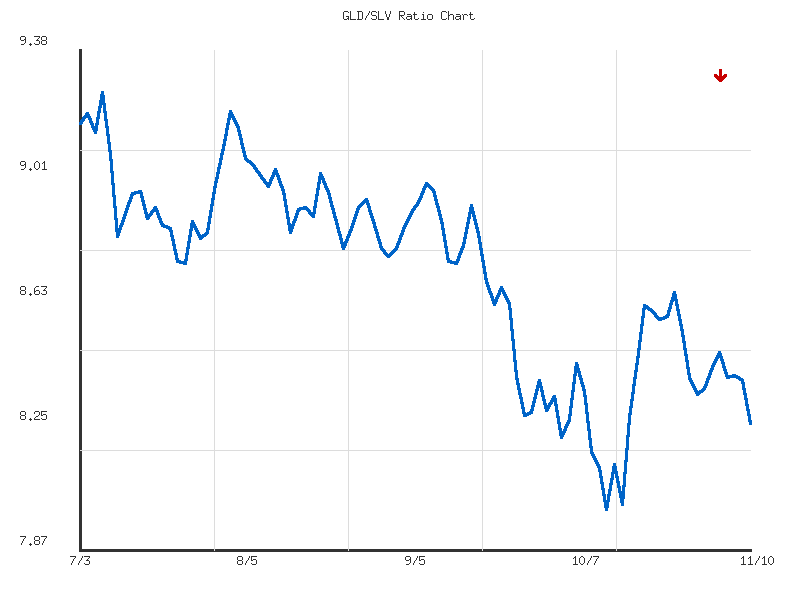
Gold/Silver Ratio
The data for the GLD/SLV ratio over the past 14 days reveals a discernible, albeit moderate, downtrend. The ratio has declined by approximately 3.93% from its period high to its current level. This downward trajectory suggests that Silver (SLV) has likely been outperforming Gold (GLD) during this specific observation window, as a falling ratio indicates relative strength in the denominator (SLV). The average ratio for this period stands at approximately 8.457, with the current ratio trading noticeably below this average.
The ratio initiated the period near 8.59 on October 22nd and reached its peak at roughly 8.65 on October 27th. Following this high, the ratio has generally trended lower, exhibiting several minor bounces before resuming its decline. The most recent data point on November 10th shows the ratio at approximately 8.26, which represents the absolute low point within this 14-day observation period. This position at the very bottom of its short-term range strongly suggests that bearish momentum for the ratio is likely dominant at present.
The volatility during this period has been relatively low, registered at approximately 0.012. This low volatility, coupled with the moderate trend strength, implies that the downward movement has been relatively orderly rather than characterized by sharp, erratic swings. Given the established moderate downtrend and the current ratio resting at the 14-day low, a continued decline in the GLD/SLV ratio, indicating ongoing outperformance of SLV relative to GLD, is likely in the immediate short term. However, traders should be mindful that reaching an extreme within a range can sometimes precede consolidation or a minor rebound; without additional data beyond this 14-day window, predicting such a reversal with high confidence is problematic. A significant reversal without further consolidation or a clear pattern emerging is currently less likely.
Here is a technical analysis of the GLD/SLV ratio data over the past 90 days. This commentary is based solely on the provided market data, adhering strictly to rigorous technical analysis principles and ICD-203 estimative language guidelines.
The GLD/SLV ratio has exhibited a clear and sustained moderate downtrend over the observed 90-day period, declining by approximately 9.88%. This consistent depreciation of the ratio indicates that SLV has, on balance, outperformed GLD during this timeframe. The ratio commenced this period around 9.16, experiencing an initial peak at 9.258 on July 9th. As of the most recent data point, the ratio stands at 8.260. The overall average ratio for this period settled at 8.712, with the current value resting below this average, reinforcing the established bearish momentum for the ratio.
Analysis of the trading range reveals critical technical levels. The 90-day high for the GLD/SLV ratio was established at 9.258 on July 9th, while the significant 90-day low of 8.000 was registered on October 13th. The current ratio of 8.260 sits markedly closer to this 90-day low, with a relative position indicator of 0.2067. This proximity to the lower bound of its historical range suggests the ratio is currently trading in the weaker portion of its recent performance, with the 8.000 level acting as a pivotal support zone. The average ratio of 8.712 may serve as a potential resistance if the ratio attempts to reverse course.
Tracing the intermediate price action, the ratio initially declined from its July peak into mid-August, consolidating around the 8.8-9.0 range before a brief rebound to 9.20 in early August, which proved unsustainable. A more decisive downtrend then developed through September, culminating in a significant move lower that tested and established the 90-day low of 8.000 on October 13th. Following this low, the ratio experienced a notable rebound, climbing to approximately 8.61 by late October. However, this recovery lacked lasting momentum, with the ratio subsequently resuming its decline and now trading near the lower end of its established range. The moderate volatility of 0.0908 suggests fluctuations are present but do not typically involve extreme, sudden movements, aligning with a somewhat steady trending behavior.
Considering the persistent moderate downtrend and the ratio’s current position near its 90-day low, a continuation of GLD’s underperformance relative to SLV is likely in the near term. It is likely the GLD/SLV ratio will retest the 90-day low of 8.000 in the coming sessions. Should this pivotal 8.000 support level be retested, there is a roughly even chance that it will either hold, leading to a potential bounce towards the previous rebound high of 8.61 or the average ratio of 8.712, or fail. If the 8.000 support level is decisively breached, it is likely to accelerate the downtrend, establishing new 90-day lows for the GLD/SLV ratio and signaling a further strengthening of SLV relative to GLD.
Ratio Analysis: GLD/SLV
Generated for 90days timeframe analysis
Bonds
| Symbol | Daily Percent Change |
|---|---|
| TLT | -0.028% |
| SHY | -0.042% |
| UTHY | -0.109% |
| IEI | -0.125% |
| IEF | -0.134% |
The market data for the observed day indicates a broad negative performance across all provided instruments, which typically represent various durations of U.S. Treasury bonds. Specifically, TLT, UTHY, IEF, IEI, and SHY each recorded a daily percentage decline. The magnitude of these declines varied, suggesting a differentiated market response within the fixed-income sector on this particular day. This collective negative movement warrants closer technical observation for potential broader implications.
A more detailed examination of the daily percentage changes reveals a hierarchy of performance. TLT, representing longer-duration bonds, experienced the least significant decline at -0.028%, positioning it as relatively resilient among the group. Similarly, SHY, indicative of shorter-duration bonds, followed with a decline of -0.042%, also showing comparative strength. In contrast, UTHY, IEI, and IEF exhibited more substantial negative movements, with IEF registering the largest percentage drop at -0.134%. This divergence in performance, where shorter- and longer-duration instruments (SHY, TLT) incurred smaller losses compared to intermediate-duration assets (UTHY, IEI, IEF), is a notable technical characteristic for the period under review.
Based solely on this singular day’s data, inferring a definitive trend or predicting future price action is challenging. The observed widespread negative movement could represent a temporary pullback, a market reaction to specific daily trading dynamics, or the initial phase of a more significant downward shift. Without historical context such as previous price action, volume data, or candlestick patterns, concluding a high probability for either continuation or reversal is not possible. It is roughly an even chance that this negative momentum will continue into the next trading session or consolidate/reverse, as a single data point offers limited predictive power for establishing robust technical patterns. Subsequent sessions would be necessary to confirm any emergent trends or patterns.
Our technical analysis of the provided two-day candlestick data for key bond ETFs (SHY, TLT, UTHY, IEF, IEI) reveals a dominant theme of short-term weakness across various duration profiles. The price action over these two days generally indicates increased selling pressure or a failure of buying momentum to sustain, leading to bearish closes for most instruments. This suggests that in the immediate term, bears are likely to maintain control, with several patterns hinting at potential for further downside momentum.
The most compelling bearish signals emanate from IEI (3-7 Year Treasury Bond ETF) and IEF (7-10 Year Treasury Bond ETF). IEI demonstrated a highly likely bearish continuation, forming a strong bearish engulfing candle on Day 2 that closed at the two-day low, reinforced by a notable increase in volume. Similarly, IEF produced a bearish engulfing pattern on Day 2, with its close significantly below the prior day’s close. Although IEF’s volume decreased, the clear price action still makes a bearish follow-through likely. SHY (1-3 Year Treasury Bond ETF) also exhibited a minor bearish engulfing pattern on Day 2, closing at its low on increased volume. This combination of price and volume indicates a bearish continuation is likely for SHY in the very short term.
TLT (20+ Year Treasury Bond ETF) presented a more indecisive picture. Day 1’s bullish candle faced upper wick resistance, followed by a small bearish candle on Day 2, closing marginally lower on decreased volume. This suggests a pause in bullish momentum; a strong immediate bullish rally appears unlikely, and there is roughly an even chance for consolidation or a slight downward drift. UTHY (Ultrashort 20+ Year Treasury Bond ETF), despite two small bullish closes, shows decreasing highs and a very tight trading range with low volume. A significant breakout in either direction is unlikely in the immediate term, though a minor upward bias within the current range is likely to persist.
In summary, the technical landscape across these bond ETFs points to prevailing short-term bearish pressure. The consistent formation of bearish engulfing patterns or strong bearish closes for a majority of the instruments examined, particularly with supporting volume, suggests that downside momentum is likely to continue. While TLT and UTHY exhibit consolidation or indecision, they do not present strong counter-signals for a broad-market reversal. Traders should note this analysis is based on limited data. Alternative scenarios include a rapid shift if subsequent trading days show strong bullish reversals or increased buying volume, which could transition consolidation to an upward trajectory. However, based solely on the provided data, a continued bearish bias remains the most likely outcome for the majority of the instruments.

Performance Heatmap (TLT, UTHY, IEF, IEI, SHY)
Generated for 2days timeframe analysis
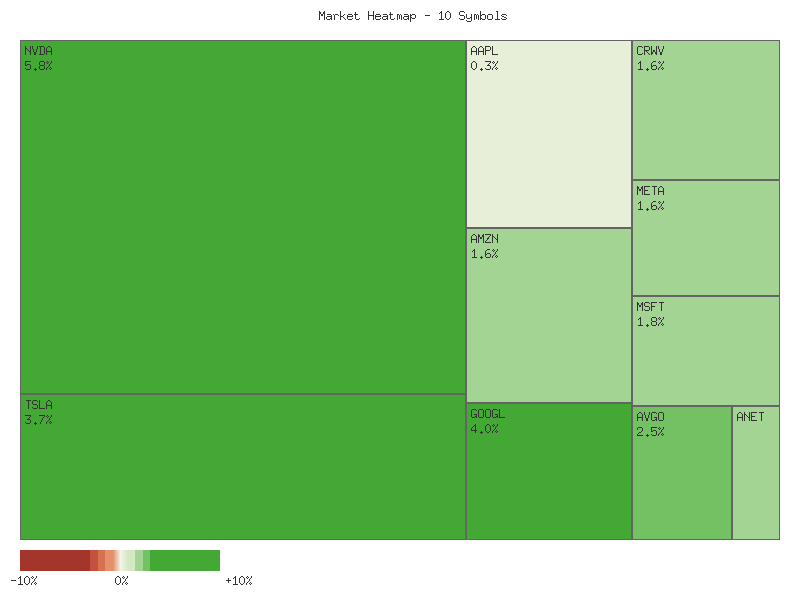
Magnificent 7 & Friends
| Symbol | Daily Percent Change |
|---|---|
| NVDA | 5.793% |
| GOOGL | 4.042% |
| TSLA | 3.658% |
| AVGO | 2.530% |
| ANET | 1.961% |
| MSFT | 1.848% |
| AMZN | 1.629% |
| META | 1.617% |
| CRWV | 1.611% |
| AAPL | 0.294% |
The provided market data for the selected securities indicates a uniformly positive trading session, with all ten symbols registering gains. This broad participation in upward movement suggests a predominantly bullish sentiment among market participants for this specific group during the observed period. The collective positive closes for these technology and growth-oriented stocks make it likely that overall market sentiment was favorable, at least in this segment. This level of positive breadth, where no security experienced a decline, is noteworthy for a single trading day snapshot.
Examining individual performance, NVIDIA (NVDA) stands out as the strongest performer, with a robust daily gain of 5.793%. This significant outperformance indicates strong buying conviction in NVDA during the session. Google (GOOGL) followed closely with a 4.042% increase, and Tesla (TSLA) also posted a substantial gain of 3.658%. These three securities show a clear pattern of leading the rally, suggesting a concentration of capital flow into these specific names. It is highly probable that NVDA experienced particular catalysts or strong technical momentum on this day, given its notably higher percentage change compared to its peers.
The remaining seven securities — AVGO, ANET, MSFT, AMZN, META, CRWV, and AAPL — also contributed positively to the market’s performance, albeit with more modest gains. AVGO and ANET demonstrated solid upward momentum, posting 2.530% and 1.961% respectively, placing them in the upper-mid range of this group. Microsoft (MSFT), Amazon (AMZN), Meta Platforms (META), and CrowdStrike (CRWV) registered gains between 1.611% and 1.848%, indicating consistent, if not exceptional, buying pressure. Apple (AAPL), while positive, recorded the lowest gain at 0.294%. This suggests a relative underperformance compared to its peers within this dataset for the day, implying that while it participated in the upward movement, it likely faced less aggressive buying interest or encountered more resistance.
Based solely on this singular day’s data, it is evident that buying pressure was widespread across the analyzed stocks. The strong positive percentage changes, especially in NVDA, GOOGL, and TSLA, indicate areas of concentrated strength. However, it is unlikely that these single-day movements alone are sufficient to establish durable trends or predict future price action with high confidence. Technical analysis typically requires multiple data points, including volume and historical price action, to confirm trends, identify patterns, and assess momentum. This snapshot primarily reflects the immediate short-term sentiment and relative strength among these specific equities for the given trading day, indicating a high likelihood of continued near-term attention to the leading performers.
Technical Market Commentary: Two-Day Analysis (November 7th - 10th, 2025)
The collective technical landscape across these ten selected equities from November 7th to November 10th, 2025, broadly reflects a positive, albeit nuanced, shift in short-term sentiment. A notable characteristic observed on November 10th was the prevalence of upside price gaps at the open for eight of the ten analyzed symbols (META, AVGO, AMZN, CRWV, MSFT, NVDA, GOOGL, ANET). This pattern suggests an underlying bullish impetus entering the trading session, indicating that market participants were willing to pay higher prices from the outset. For the majority of these equities, the subsequent price action generally sustained these gains, leading to higher closing prices compared to the previous session. However, the accompanying volume dynamics, predominantly showing a decrease on November 10th, warrant closer examination to ascertain the conviction behind these moves.
Several equities exhibited particularly robust technical strength during this two-day period, rendering further upward price action as likely. NVIDIA (NVDA) stands out, forming a strong bullish candle on November 7th, followed by an aggressive gap-up and another very strong bullish close near its daily high on November 10th, albeit on decreased volume. This pattern suggests high buyer conviction and an underlying momentum that is very likely to continue. Similarly, Microsoft (MSFT), Meta Platforms (META), Alphabet (GOOGL), and Tesla (TSLA) all demonstrated strong bullish continuation patterns. MSFT and META both gapped up to close near their highs on November 10th, building on previous bullish or neutral days. GOOGL and TSLA, after relatively bearish candles on November 7th, staged significant bullish reversals on November 10th, with GOOGL forming a strong bullish engulfing pattern. The overall price action for these names indicates that further upside is likely in the immediate term.
Conversely, several stocks presented patterns that suggest emerging caution or indecision, making sustained immediate upward momentum less certain. CrowdStrike (CRWV) experienced a significant gap-up on November 10th but formed a distinct “Shooting Star” candlestick pattern, closing well below its open despite finishing above the prior day’s close. Critically, this pattern occurred on higher volume compared to November 7th, indicating strong selling pressure materialized at higher prices. While the overall trend remains up from the previous close, the failure to hold opening gains on increased volume makes a direct continuation of strong upward momentum unlikely; a period of consolidation or a retracement towards previous support is roughly an even chance. Arista Networks (ANET) also displayed a “Shooting Star” after a gap-up on lower volume, suggesting buyer exhaustion and a roughly even chance of consolidation or a slight pullback.
Furthermore, Broadcom (AVGO) and Amazon (AMZN) both gapped up on November 10th but closed with relatively small bodies (Doji/Spinning Top-like patterns) on decreased volume, indicating indecision after the initial upward thrust. For these equities, there is a roughly even chance of continued consolidation or renewed directional movement, contingent on fresh market impulses. Apple (AAPL), after a bearish session on November 7th, managed only a minor bullish close on November 10th, characterized by a narrow range and decreased volume. This limited price appreciation and lower volume suggest that strong upward momentum is unlikely, with a roughly even chance of continued consolidation within its recent range. These mixed signals suggest a bifurcated market sentiment where some leaders are maintaining strong trajectories, while others are encountering resistance or entering phases of price discovery following initial positive reactions.
Performance Heatmap (TSLA, MSFT, AAPL, META, NVDA, AVGO, GOOGL, AMZN, CRWV, ANET)
Generated for 2days timeframe analysis
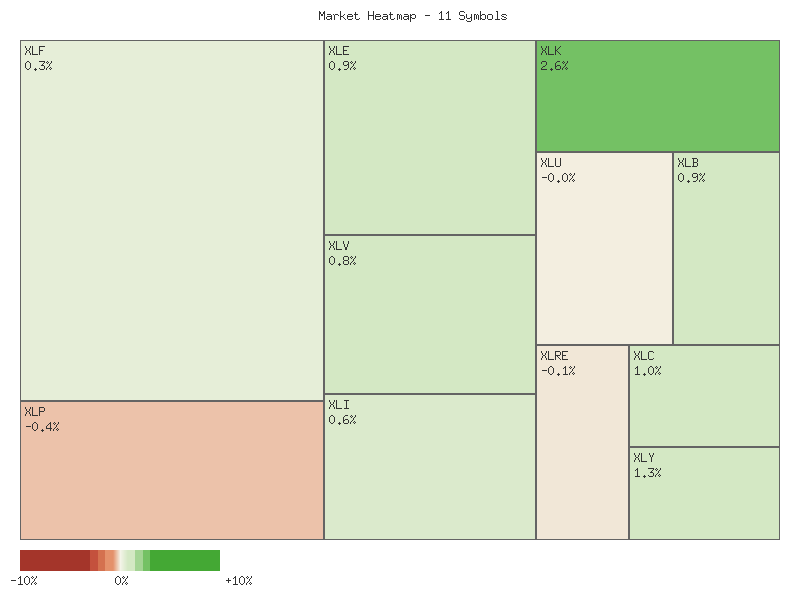
S&P 500 Sector Breadth
The daily percent change data for the eleven S&P 500 sectors provides a clear snapshot of market activity and underlying sentiment. Of the eleven sectors observed, eight registered positive daily changes, while three experienced declines. This distribution indicates broadly positive market breadth, with advancing sectors significantly outnumbering declining ones. Such a breadth profile typically suggests a healthy, albeit potentially specific, market advance, with gains not confined to an extremely narrow group of equities.
The market matrix for the S&P 500 sectors, sorted by daily percent change, is as follows:
| Symbol | Daily Percent Change |
|---|---|
| XLK | 2.5785% |
| XLY | 1.2930% |
| XLC | 1.0482% |
| XLE | 0.9382% |
| XLB | 0.9203% |
| XLV | 0.7939% |
| XLI | 0.5805% |
| XLF | 0.3126% |
| XLRE | -0.0969% |
| XLU | -0.0446% |
| XLP | -0.3715% |
Analysis of the performance across offensive and defensive sectors suggests a notable shift in market preference. All seven identified offensive sectors (XLK, XLY, XLC, XLE, XLB, XLI, XLF) advanced for the day, with XLK (Technology) showing the strongest performance at +2.5785%. Conversely, three of the four defensive sectors (XLP, XLRE, XLU) declined, albeit modestly. XLV (Healthcare), typically considered defensive, was the sole defensive sector to advance. This pattern, where all offensive sectors gained and the majority of defensive sectors declined, strongly indicates a rotation into riskier assets and out of safer havens.
Based on the observed sector performance, it is highly probable that overall market sentiment is tilted towards “risk-on.” The significant outperformance of growth-oriented and economically sensitive sectors like Technology (XLK), Consumer Discretionary (XLY), Communication Services (XLC), Energy (XLE), and Materials (XLB) suggests increasing investor confidence in future economic growth. Conversely, the minor declines in defensive sectors like Consumer Staples (XLP), Real Estate (XLRE), and Utilities (XLU) further reinforce this sentiment, indicating reduced demand for assets typically sought during periods of uncertainty or economic contraction. While the positive performance of XLV (Healthcare) introduces a minor element of uncertainty to an otherwise clear picture, the dominant trend points to a market environment favoring upside potential in risk assets.
As a Chartered Market Technician with over 15 years of experience, my analysis of the provided two-day market data for these eleven select sector ETFs (XLP, XLRE, XLI, XLU, XLV, XLY, XLF, XLB, XLE, XLC, XLK) indicates a predominantly bullish short-term technical posture across the broader market, though tempered by diminishing participation. The majority of sectors displayed clear upward price momentum over the observation period, characterized by higher closes from November 7th to November 10th, 2025. However, a notable and consistent technical characteristic across nearly all observed sectors was a decline in trading volume on the second day, which warrants careful consideration regarding the sustainability of these price movements.
The most robust bullish signals appear in XLK (Technology), XLY (Consumer Discretionary), XLE (Energy), XLV (Health Care), and XLC (Communication Services). XLK and XLY, in particular, exhibited significant gap-up opens on November 10th, followed by strong closes near their daily highs, indicating probable continued buying pressure. XLE also closed strongly, maintaining its upward trajectory. These sectors are highly likely to experience continued upward price action in the immediate future, given the clear higher highs and higher lows established. However, the accompanying decrease in volume across these strong performers suggests that while conviction among current buyers is present, the breadth of participation might be narrowing, posing a roughly even chance of price acceleration or a more gradual ascent.
Conversely, XLP (Consumer Staples), XLRE (Real Estate), and XLU (Utilities) exhibited signs of short-term consolidation or slight weakness. XLP closed marginally lower on November 10th compared to its November 7th close, and XLRE ended essentially flat. XLU, while opening higher on November 10th, ultimately closed slightly lower than its open, forming a candle that might suggest indecision near resistance. For these sectors, a continued period of range-bound trading or a slight pullback is likely. The decreasing volume in these sectors, similar to the broader trend, reinforces the probability of consolidation rather than a decisive directional break in the immediate term. The market is currently signaling a rotation of strength towards growth-oriented sectors and away from defensive segments.
The pervasive reduction in trading volume across virtually all sectors from November 7th to November 10th is a significant technical observation. While many sectors recorded higher prices, the declining volume suggests that these upward moves are occurring with less conviction or broad market participation. This phenomenon, often seen in mature trends, presents an alternative scenario where the current bullish momentum, although likely to continue in the short term, might be vulnerable to reversals or prolonged periods of consolidation if volume fails to confirm price advances. Therefore, while continued upward price action is probable for the leading sectors, the sustainability of these moves without increasing volume is unlikely in the medium term, implying a higher risk of corrective phases.
Performance Heatmap (XLP, XLRE, XLI, XLU, XLV, XLY, XLF, XLB, XLE, XLC, XLK)
Generated for 2days timeframe analysis
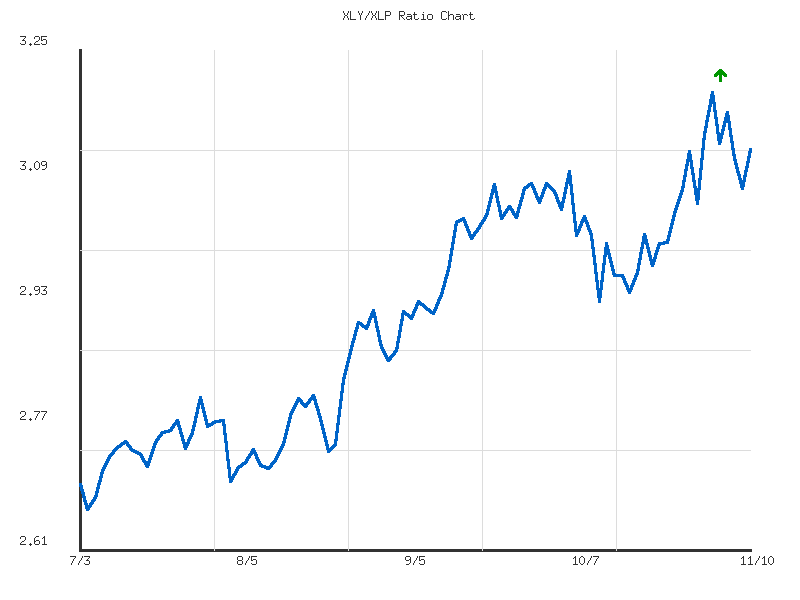
XLY vs XLP
The XLY/XLP ratio has exhibited a predominantly sideways trend over the past seven trading days, ending November 10, 2025. The provided data indicates a weak directional bias, with the ratio experiencing a marginal decline of approximately 0.60% across the period. This subdued movement suggests a current state of equilibrium or indecision regarding the relative performance between Consumer Discretionary (XLY) and Consumer Staples (XLP). The ratio commenced at 3.145 on October 31, peaked early in the period, and finished at 3.126, reinforcing the overall weak directional movement as a key characteristic of the current technical posture.
Throughout this short-term window, the ratio has traded within a relatively narrow range, from a high of 3.199 observed on November 3 to a low of 3.075 reached on November 7. The recorded volatility of 0.0014 is notably low, indicating a tight consolidation phase rather than a clear trending environment. The current ratio of 3.126 is positioned near the midpoint of this short-term range, specifically at 41.3% from its low. This placement suggests the ratio is neither significantly overextended nor oversold within this recent historical context. This tight range and low volatility are likely to precede a more decisive move.
Observing the daily fluctuations, the ratio initially saw an upward movement from 3.145 to 3.199, followed by a decline to its low of 3.075 before rebounding to 3.126. This price action suggests an initial attempt at upward momentum that was subsequently rejected, leading to a test of lower boundaries within the observed range. The bounce from the low on November 7 into the close on November 10 indicates that the immediate downside might have found some support, at least within this limited data set. However, the subsequent rebound did not recapture the earlier peak, reinforcing the prevailing sideways character.
Given the established weak, sideways trend and low volatility, it is roughly even chance that the ratio will continue to consolidate within its defined 7-day range in the immediate future. A decisive breakout above the resistance area near 3.199 would likely signal renewed relative strength for Consumer Discretionary. Conversely, a break below the support around 3.075 would likely indicate a period of relative underperformance for XLY. The absence of strong momentum in either direction over this timeframe suggests that market participants should await a confirmed break of these established boundaries for clearer directional cues. Without further data points to establish longer-term patterns or more robust support/resistance levels, projecting beyond this period of consolidation remains uncertain.
XLY/XLP Ratio Technical Analysis: A Persistent “Risk-On” Preference Evident
The XLY/XLP ratio, a key intermarket indicator reflecting the market’s preference for cyclical consumer discretionary stocks (XLY) over defensive consumer staples (XLP), has displayed a sustained and strong upward trend over the past 90 days. Commencing in early July around the 2.69 level, the ratio has systematically climbed, exhibiting a remarkable 16.15% increase to its current value of 3.126. This prolonged ascent, characterized by higher highs and higher lows throughout the observation period, strongly suggests a persistent “risk-on” sentiment pervading market participants. The aggregated data confirms this with a stated trend direction of “up” and strength as “strong,” underscoring the dominance of buying pressure in Consumer Discretionary relative to Consumer Staples.
Analyzing the price action reveals several notable technical levels that have been established and subsequently reinforced. Following an initial consolidation period in July, the ratio experienced a definitive breakout above the 2.80 level by late July, which then appeared to serve as a support zone during a brief pullback in early August. A more significant upward acceleration followed through August and into September, culminating in the ratio decisively surpassing the 3.00 psychological threshold in mid-September. The sustained trading above this level for the remainder of the period, despite minor retracements, suggests that 3.00 has transitioned from a resistance level to a more probable support zone. Another notable support emerged around the 2.92-2.93 area during a mid-October dip, further validating the upward trajectory.
The recent price action indicates continued, albeit slightly moderated, bullish momentum. The ratio achieved its 90-day high of 3.199 on November 3rd, indicating robust buying interest at that point. However, the subsequent retracement to the current 3.126 level by November 10th suggests a minor period of profit-taking or consolidation. Given the current ratio’s relative position at 0.865 within its 90-day range, it is fairly extended towards its highs, which might imply a roughly even chance of further short-term consolidation before another leg higher, or a continuation of the upward trend if momentum reasserts itself swiftly. The observed volatility of 0.0217 is moderate, suggesting that while price movements are significant, they are not indicative of extreme instability.
Looking forward, the dominant technical picture remains bullish for the XLY/XLP ratio. A continuation of the current “risk-on” preference is likely as long as the ratio maintains above its established support levels, particularly the 3.00 mark. A breakdown below this level, especially if accompanied by increased volume (not provided in this data), would likely signal a significant shift in market sentiment and potentially invalidate the strong bullish trend, making a move towards the 2.92-2.93 area probable. Conversely, a sustained break above the recent 3.199 high would likely signal further upside and reinforce the existing trend strength, indicating a continued appetite for cyclical sectors over defensive ones. Retail traders should monitor these key technical levels closely for potential shifts in this intermarket dynamic.
Ratio Analysis: XLY/XLP
Generated for 90days timeframe analysis
Equity Breadth
The SPXA50R, representing the percentage of S&P 500 members trading above their 50-day moving average, experienced a notable fluctuation over the observed seven-day period. Initially, the indicator registered 42.11% on October 31st, then declined to 37.72% by November 3rd, suggesting a short-term weakening in market breadth. However, following this dip, the metric rebounded consistently, climbing to 40.52% by November 5th, and further accelerating to 44.51% on November 7th. The latest data point, November 10th, shows a significant increase to 47.11%. This pattern suggests a shift in short-term momentum from weakening to strengthening breadth. It is likely that the market saw a rotation or renewed buying interest in a broader set of components during the latter half of the period.
Concurrently, the SPXA200R, which tracks the percentage of S&P 500 stocks above their 200-day moving average, displayed a similar, though less volatile, trajectory. Starting at 51.10% on October 31st, it saw a gentle decline, reaching its lowest point at 48.50% on November 6th. This briefly placed the majority of S&P 500 components below their long-term average, which could have been interpreted as a moderate bearish signal for long-term health. However, the indicator promptly reversed course, recovering to 50.70% on November 7th and closing at 52.10% on November 10th. This recovery suggests that the long-term underlying trend for S&P 500 components, despite a brief waver, is re-establishing a positive posture.
Comparing these two breadth indicators, we observe a broadly consistent message of improving market internals over the latter part of the observed period. The SPXA50R’s more substantial bounce from its low suggests increasing short-to-medium term strength, which is generally a constructive development for the overall index. The SPXA200R’s return above the 50% threshold is a technically significant event, indicating that more than half of the index components are once again in an uptrend on a longer-term basis. It is highly likely that this synchronized improvement in both short and long-term breadth indicators provides support for the underlying strength of the S&P 500 index itself.
While the current data points to an improving technical backdrop, alternative scenarios warrant consideration. Should these breadth indicators fail to hold their recent gains or reverse sharply, particularly if SPXA200R falls back below 50%, it would suggest that the recent recovery was ephemeral. However, based solely on the provided data, a continued modest expansion in positive breadth is roughly an even chance. The sustained upward momentum in SPXA50R is likely to persist in the immediate future, potentially pulling SPXA200R higher as well. A rapid deterioration from current levels appears unlikely, given the recent strong closing figures.
SPY Daily
The SPY has maintained a discernibly upward long-term trend, as evidenced by both the 50-day and 200-day Exponential Moving Averages (EMAs) consistently rising and the 50-day EMA remaining well above the 200-day EMA. Over the past seven trading days, price action initially presented a pullback, with the SPY declining from a close of 683.32 on November 3rd to 670.24 on November 6th. This retracement found dynamic support at the rising 50-day EMA, approximately around 663.87 on November 6th. The subsequent two trading days, November 7th and November 10th, displayed strong bullish reversals, closing higher at 670.91 and 681.31, respectively. Notably, the upward movement on November 7th occurred with a significant increase in volume to 92,965,291 shares, suggesting considerable buying interest.
The most recent trading day, November 10th, concluded with a robust bullish candle, opening at 677.235 and closing strongly at 681.31, near its high for the day. This indicates firm control by buyers. The price currently stands comfortably above both its 50-day EMA (664.82) and 200-day EMA (622.35), reinforcing the established uptrend. The 14-day Relative Strength Index (RSI) for the SPY, after dipping to 48.17 on November 6th during the pullback, has recovered to 57.77. This places the momentum indicator in neutral territory, suggesting that while bullish momentum is reasserting itself, the market is not yet in an overbought condition, thereby allowing for potential further upside without immediate exhaustion.
Based on the observed price patterns, a key resistance zone appears to be in the 689-690 range, established by the highs seen in late October. This area represents a hurdle where upward momentum previously stalled. On the downside, the 50-day EMA, currently around 664-665, has proven to be a significant dynamic support level during the recent pullback. Should this level be breached, the prior support zone around 653-655, which held firm after the sharp decline on October 10th, would likely become the next area of interest for buyers.
Considering future price action, a bullish case appears more likely in the near term. The strong rebound from the 50-day EMA, coupled with rising volume on the recovery and a non-overbought RSI, suggests renewed upward momentum. A decisive break above the 689-690 resistance would indicate a continuation of the rally toward new highs. Conversely, a bearish case holds a roughly even chance if the 689-690 resistance proves resilient and prices fail to sustain above it. A subsequent break below the 50-day EMA could lead to a test of the 653-655 support. A neutral case is also plausible, particularly if the market consolidates between the current levels and the 689-690 resistance, allowing indicators to normalize further before a clearer directional move emerges.
Technical sentiment drivers influencing the near future are primarily driven by the perception of strength in the underlying trend. The successful defense of the 50-day EMA as support, after a brief dip, will likely reinforce confidence among trend-following participants, encouraging buying on subsequent pullbacks. Continued upward momentum toward the resistance at 689-690 could generate further bullish enthusiasm, especially if accompanied by increasing volume. However, repeated failures to overcome this resistance may gradually erode bullish sentiment, leading to a more cautious or even bearish outlook as traders assess the market’s ability to maintain its upward trajectory. The current positioning suggests a short-term bullish bias within the prevailing long-term uptrend.
SPY Technical Analysis: 90-Day Overview and Current Outlook
Over the past 90 days, the SPY exchange-traded fund has largely exhibited a robust bullish trajectory, characterized by a series of higher highs and higher lows within the provided data. From early July lows around -, SPY progressed steadily, eventually reaching new highs near by late October. This upward movement was punctuated by two notable and sharp pullbacks. The first occurred around August 1st, with price retracting from approximately to on significantly elevated volume (140 million shares). The second, more pronounced correction, took place on October 10th, witnessing a decline from approximately to , accompanied by the highest single-day volume in the dataset (156 million shares). These corrections, while sharp, were followed by relatively swift recoveries, suggesting underlying demand at lower price levels. The most recent price action indicates a rebound from the November 6th low of .24 to the current close of .31 on November 10th, reflecting renewed buying interest.
The 14-day Relative Strength Index (RSI) largely corroborated the price action, frequently registering levels indicative of an overbought condition (above 70) during periods of strong rallies in July, September, and late October. For instance, RSI peaked at 75.58 on July 25th and 73.70 on September 22nd, preceding minor consolidations or pullbacks. Correspondingly, the significant price drops on August 1st and October 10th saw the RSI decline sharply to 47.66 and 41.81, respectively. These rapid descents from previously overbought or strong levels indicated a temporary dissipation of bullish momentum and an increase in selling pressure. However, in both instances, the RSI found support above the oversold threshold (30), which is a characteristic pattern in strong uptrends, further underscoring the market’s underlying resilience.
Presently, SPY’s RSI stands at 57.77 as of November 10th. This level is situated comfortably above the midpoint of 50, indicating that bullish momentum has regained ascendancy following the brief dip in early November, but it is not yet in overbought territory. This suggests that there is a reasonable probability of further upward price movement before the market might encounter significant exhaustion or a renewed selling phase based solely on the RSI. While the overall trend appears positive, the sharp, high-volume corrections observed twice in the 90-day period suggest that SPY remains susceptible to sudden, substantial downward moves. Therefore, while a continuation of the bullish trend is likely, a roughly even chance exists for periodic, rapid price pullbacks on elevated volume.
Note: Analysis of MACD (13,21-day) was requested but the corresponding indicator data was not provided in the market data for analysis. Therefore, no conclusions regarding MACD could be drawn.