Weekly Market Technical Analysis
Recent technical analysis indicates a broad market shift towards bearish short-term momentum, evident in pullbacks across major indices like SPY and QQQ from recent highs. QQQ is highly likely to face further near-term downside pressure, while market breadth indicators signal broad underlying weakening. Conversely, defensive sectors, Energy (XLE), and Natural Gas (UNG) exhibit strong uptrends or relative strength. Treasury ETFs are highly likely to continue their downward trajectory, confirmed by persistent selling pressure. Traders should closely monitor critical support levels; sustained breakdowns would likely confirm further declines across major indices and tech names. Consolidation or minor relief bounces in many segments currently have roughly even chances before definitive directional moves.
Market Indices
| Symbol | Daily Percent Change |
|---|---|
| MDY | 1.1527% |
| IJR | 0.8508% |
| IWM | 0.5159% |
| SPY | 0.0999% |
| OEF | -0.1775% |
| QQQ | -0.3172% |
The latest available daily market data, as of 2025-11-07, indicates a mixed but generally positive breadth across the selected market capitalization segments. Four out of the six symbols, comprising mid-cap (MDY), small-cap (IJR, IWM), and broad large-cap (SPY), registered advances. Conversely, OEF (representing the S&P 100) and QQQ (Nasdaq 100) experienced slight declines. This suggests a short-term sentiment that is leaning towards broader market participation, potentially favoring small and mid-cap stocks over the mega-cap technology and larger blue-chip components on this specific trading day. The concentration of advances outside the tech-heavy Nasdaq-100 is noteworthy.
Analyzing the 14-day price action reveals a market characterized by notable volatility and a lack of sustained directional momentum across all indices. The daily percentage changes for symbols such as IJR, IWM, and QQQ frequently demonstrate sharp swings, with strong up days often followed by significant pullbacks, and vice versa. For example, QQQ experienced a period of substantial gains from October 24-29, which was subsequently largely retraced by sharp declines between October 30 and November 6, before a modest recovery. This pattern of “whipsaw” movements strongly indicates that neither bullish nor bearish forces have been able to maintain dominance for an extended period, leading to considerable indecision.
Over the entire 14-day period, the cumulative effect of these daily movements suggests that the market is largely range-bound. Net changes over the fortnight for most indices are near flat (IJR, SPY, MDY showing negligible gains, IWM a slight decline, and OEF/QQQ minor gains), reinforcing the notion of a consolidating market. This price behavior implies that current supply and demand dynamics are roughly balanced, leading to horizontal price action rather than a decisive trend. The repeated testing of perceived resistance after rallies and the emergence of support after declines appear to be containing price within an established trading range.
Considering alternative scenarios, it is plausible that this extended period of consolidation is merely a precursor to a more significant directional move. A decisive break above established swing highs, particularly if accompanied by increased volume, would likely indicate the initiation of a new upward trend. Conversely, a breakdown below recent swing lows would probably signal the development of a bearish trend. Given the current data, a clear directional bias for the next sustained move is not discernible, but a continuation of choppy, range-bound trading has a roughly even chance with a breakout attempt. The elevated intra-range volatility, however, suggests underlying tension that will eventually resolve into a clearer trend.
Market Commentary: ETF Technical Analysis (Oct 21 - Nov 7, 2025)
The collective technical data across the observed ETFs (SPY, QQQ, OEF, IWM, IJR, MDY) over the past 14 trading days generally depicts a significant shift from an initial short-term bullish trend in late October to a prevailing bearish sentiment by early November. SPY, QQQ, and OEF, representing larger market capitalizations, demonstrated robust upward momentum into October 29, establishing clear higher highs. This advance was subsequently met with strong selling pressure, particularly visible on October 30 (SPY), where a distinct bearish reversal pattern, such as an outside bar or engulfing candle, formed with notably high volume, marking a critical turning point. The following days for these ETFs consistently showed lower highs and lower lows, confirming an established short-term downtrend.
The small-cap focused ETFs, IWM and IJR, exhibited similar trajectory shifts, albeit with a comparatively weaker and shorter-lived initial ascent. Their peaks were observed earlier, around October 27-28, with IJR experiencing a pronounced bearish reversal on October 29, characterized by a large bearish candle and its highest volume in the period. This swiftly transitioned both IWM and IJR into clear downtrends, mirroring the larger market segments. The selling pressure across these small-cap indices has been consistent, with lower highs and lower lows dominating the price action into November.
Volume analysis reinforces the conviction behind these price movements. The initial bullish moves in late October for most ETFs were often accompanied by moderate volume. However, the subsequent bearish reversals and continued declines for SPY, QQQ, OEF, IWM, and IJR were frequently associated with elevated and at times, the highest trading volumes observed in the 14-day period. For instance, the Nov 7 candle for SPY, QQQ, and IJR all registered their highest volumes, which, despite closing off their daily lows, suggests significant distribution or aggressive liquidation. This pattern of higher volume on down days lends strong credibility to the prevailing bearish momentum.
A notable divergence appears in MDY, the S&P MidCap 400 ETF. While MDY also experienced a downtrend from its late October peak, the price action on November 7 stands in stark contrast to its counterparts. MDY formed a large bullish reversal candle, closing near its daily high and notably above the prior day’s close, accompanied by high volume. This specific candlestick pattern suggests a likely short-term bullish reversal for MDY, potentially indicating a flight to mid-cap quality or a segment finding earlier support.
Considering these patterns, it is likely that the general selling pressure will persist in the immediate short term for SPY, QQQ, OEF, IWM, and IJR. While the last day’s closes off their respective lows could indicate a temporary pause or short-covering, there is a low probability of a robust, sustained reversal without further confirmation of strong buying volume and clear bullish candlestick patterns. For MDY, however, there is a higher probability of an upward corrective move in the very short term, potentially retesting recent resistance levels. Investors should be aware that a roughly even chance exists for a minor relief bounce across the broader market before the established downtrend potentially resumes. Vigilance for volume confirmation on future price movements is advised to assess the sustainability of any market shifts.
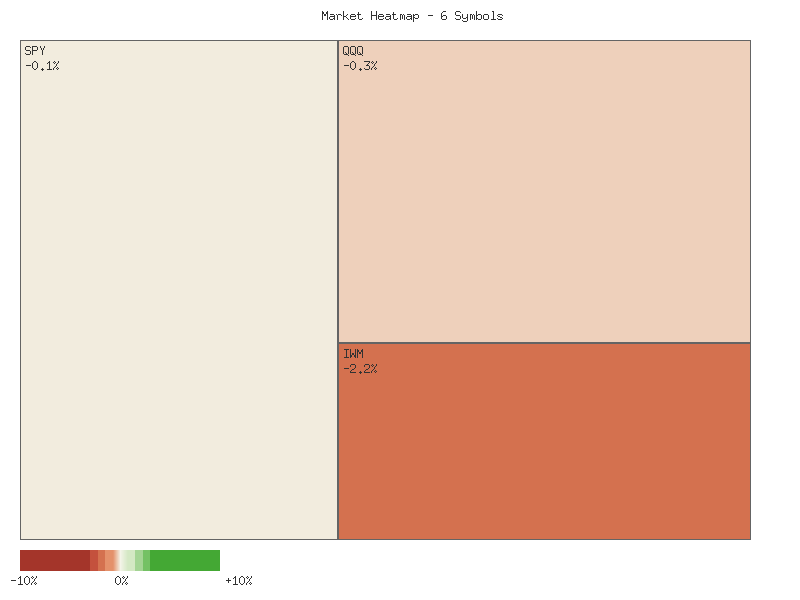
Performance Heatmap (SPY, QQQ, IWM, IJR, MDY, OEF)
Generated for 14days timeframe analysis
Here is a technical analysis of SPY based solely on the provided candlestick and RSI (14-day) data over the past 90 days, adhering strictly to ICD-203 estimative language.
SPY’s price action over the past 90 days indicates an underlying bullish trend, characterized by a series of higher highs and higher lows, despite significant short-term pullbacks. The period commenced with SPY around in early July, progressing to establish new highs. A notable rally in late July pushed prices to approximately , which was promptly followed by a sharp, high-volume decline on August 1st, where the price dropped from to on the highest volume day in the dataset (140M shares). This suggests substantial profit-taking or distribution occurred at that peak. Following this correction, SPY resumed its ascent, steadily climbing through August and September to reach the - range by early October. Another significant high was recorded around , preceding a substantial single-day drop on October 10th from to , again accompanied by the highest volume in the dataset (156M shares). This pattern of sharp, high-volume corrections after reaching new peaks suggests the market is willing to absorb selling pressure at lower levels. The latest price action shows SPY reaching new highs around in late October, followed by a recent retracement, closing at .91 on November 7th.
The 14-day Relative Strength Index (RSI) has provided consistent signals correlating with these price movements. In early July and late July, the RSI entered the overbought zone (above 70), peaking at 75.58 on July 25th, shortly before the August 1st price pullback. This indicated a likely exhaustion of buying momentum. Similarly, in mid-September and early October, RSI again climbed above 70, reaching 73.7 on September 22nd and 71.17 on October 6th, preceding the significant price decline on October 10th. During the severe drops on August 1st and October 10th, the RSI sharply corrected, bottoming out at 47.66 and 41.81 respectively. Notably, the RSI did not reach conventionally oversold levels (below 30) during these pullbacks, which may suggest underlying bullish strength in the broader uptrend, as corrections typically find buying interest before momentum fully reverses.
In the more recent period, the strong rally in late October saw the RSI return to overbought levels, reaching 69.71 on October 29th, indicating robust bullish momentum. However, following the peak around , the RSI has since fallen to 48.83 as of November 7th. This movement into neutral territory suggests a significant loss of short-term bullish momentum and strongly corresponds with the recent price retracement. Given this, a continued short-term pullback or consolidation is likely for SPY. The price is likely to test the support established around the - region, which successfully held after the October 10th decline. A break below this level would increase the probability of SPY testing the lower support zone around -. Alternatively, if SPY finds support around current levels or the - range and the RSI begins to show signs of upward reversal from its current neutral stance, a retest of the - resistance zone is a roughly even chance. However, a sustained breakout above the high would likely require a renewed surge in momentum, potentially signaled by the RSI re-entering overbought territory.
SPY Price & Indicators (RSI_14_DAY, MACD_13_21_DAY)
QQQ Technical Analysis (July 2025 - November 2025)
QQQ has demonstrated a clear underlying uptrend over the past 90 days, characterized by a series of higher highs and higher lows, which indicates sustained bullish sentiment for the period under review. However, this upward trajectory has been punctuated by several notable and sharp pullbacks. The price surged from the mid- in early July to a peak around by late October, reflecting significant overall appreciation. Volume analysis reveals that periods of strong price advancement were often accompanied by moderate-to-high volume, while significant declines frequently saw an increase in trading activity, suggesting stronger conviction in selling pressure during those downturns.
Analysis of the 14-day Relative Strength Index (RSI) corroborates the price action’s cyclical nature. QQQ’s RSI frequently entered overbought territory (above 70) during periods of strong rallies, notably in July, mid-September, and early October, and again towards the end of October. Historically, these instances of overbought conditions were consistently followed by a deceleration in upward momentum, or outright price pullbacks, often accompanied by a rapid decline in the RSI from elevated levels. This pattern suggests that market participants have, at various points, taken profits after extended runs. We note that the MACD indicator was not provided in the market data and therefore cannot be included in this analysis.
Examining the recent price action, QQQ reached its highest point in the dataset on October 29th at .77, coinciding with an RSI reading of 71.73, firmly in overbought territory. Immediately following this peak, QQQ experienced a sharp and significant decline over the subsequent trading days. By November 7th, the price had fallen to .75, representing a notable retreat from its high. This downturn has been accompanied by elevated trading volumes on several of the down days, particularly on October 30th (60M shares), November 6th (68M shares), and November 7th (78M shares), which suggests increasing selling pressure and distribution. The RSI has simultaneously plunged from its overbought reading to 47.97 by November 7th, signaling a decisive shift in short-term momentum from bullish to bearish.
Given the current technical landscape, we assess it is highly likely that QQQ will experience further near-term downside pressure. The combination of a sharp decline from overbought RSI levels, significant price depreciation from recent highs, and increasing volume during the recent down days strongly supports a bearish continuation in the immediate future. Potential support levels to monitor include the prior significant low around - from the October 10th sell-off, which could act as an initial retest point. An alternative scenario, while less likely given the current momentum and volume profile, would involve QQQ finding immediate support around the psychological level or the current RSI stabilizing near 50, potentially leading to a stabilization or a minor bounce. However, without a clear reversal pattern or capitulation volume, the path of least resistance appears to be lower.
QQQ Price & Indicators (RSI_14_DAY, MACD_13_21_DAY)
IWM Technical Analysis: November 7, 2025
Over the past 90 days, the iShares Russell 2000 ETF (IWM) has exhibited a generally bullish trend, characterized by distinct upward legs interspersed with sharp but generally contained pullbacks. The price action reveals a progression from roughly in early July to a peak around in mid-October. Notable rallies occurred in mid-August and again from late September into early October. Volume analysis suggests that significant price movements, both up and down, were frequently accompanied by elevated trading activity, particularly during periods of sharp declines (e.g., August 1 and October 10). It is important to note that while MACD data was specified in the request, it was not provided in the market data, therefore this analysis will solely rely on candlestick price action and the Relative Strength Index (RSI).
The 14-day Relative Strength Index (RSI) has been instrumental in signaling momentum shifts within this period. We observe that IWM’s RSI frequently entered overbought territory (above 70) during strong uptrends, specifically on July 3 (71.57) and September 18 (71.23). These instances were typically followed by price consolidation or minor pullbacks, suggesting that an RSI reading above 70 has historically served as a reliable short-term cautionary signal. Conversely, RSI dips towards the oversold threshold (below 30) or even into the mid-40s have often coincided with local price bottoms or preceded rebounds, as seen on August 1 (41.36) and October 10 (44.97).
The most recent data points to a shift in short-term momentum. From its high around on October 27, IWM has experienced a noticeable decline, closing at .60 on November 7. Concurrently, the 14-day RSI has mirrored this weakening, descending from 58.76 on October 27 to 46.39 on November 7. The RSI is currently positioned below the neutral 50-level, indicating that bearish momentum has gained traction in the very near term. We judge it likely that IWM will experience continued downward pressure or at least range-bound trading in the immediate future, particularly if the RSI persists below 50 and declines further towards the 40-mark.
Considering these patterns, we assess a roughly even chance of IWM experiencing a short-term rebound versus a continued decline. A rebound would likely require the RSI to reclaim the 50-level and price action to consolidate above the area, possibly indicating a re-energized buying interest. However, a continued downtrend is highly likely should the RSI break below its recent lows around 44 and accelerate towards oversold territory (below 30), which would suggest deeper price correction. Traders should monitor the interaction between price and RSI carefully at these levels to ascertain the prevailing short-term directional bias.
IWM Price & Indicators (RSI_14_DAY, MACD_13_21_DAY)
VIX Fear Index
The VIX, often referred to as the fear index, exhibited a clear initial downward trajectory and subsequent consolidation during the early part of the observed 14-day period. From October 21st to October 24th, the VIX declined from an opening of 18.65 to a close of 16.37, registering several consecutive negative daily percentage changes. Following this decline, from October 27th to October 30th, the index largely consolidated within a narrower range, generally fluctuating between lows of 15.62 and highs around 17.58. This period of tighter trading, accompanied by smaller daily percentage changes, indicated a roughly even chance of market participants experiencing reduced short-term anxiety, with volatility unlikely to sustain an upward breakout during this specific timeframe. The overall pattern suggested a temporary abatement of immediate market concerns.
However, a noticeable shift occurred from October 31st, as the VIX began to show renewed upward momentum, indicating a likely resurgence of market uncertainty. Strong positive daily percentage changes were observed on November 4th (+9.58%) and November 6th (+9.82%), signaling a significant increase in perceived market risk. During this phase, the VIX successfully pushed above prior consolidation highs, with notable intra-day spikes to 20.48 on November 4th and 20.31 on November 6th. This aggressive price action, especially the substantial percentage gains, makes it likely that market participants were beginning to price in heightened volatility expectations, pushing the VIX towards the lower end of what is often considered a “fear zone” above 20.
The most recent trading sessions, particularly November 5th and November 7th, present critical patterns for near-term interpretation. Following a robust surge on November 4th, the VIX experienced a -5.08% daily change on November 5th, with its close significantly below its open, despite holding above the prior day’s close. More significantly, on November 7th, the VIX spiked to the highest high in the observed period at 22.72 but ultimately closed lower at 19.23, registering a -2.23% daily change. This forms a candle with a pronounced upper wick, which, in the context of an uptrend, carries a roughly even chance of signaling exhaustion or rejection of higher prices, implying that fear may be reaching a near-term peak. While a complete reversal is possible, there is a substantial chance that the VIX could consolidate or experience a pullback in the immediate future, with an immediate sharp decline below the recent consolidation lows appearing unlikely given the recent surges.
Technical Analysis: VIX (90-Day View) with RSI (14-Day)
This technical analysis examines the VIX over a 90-day period, focusing on VIX price action and the 14-day Relative Strength Index (RSI). It is crucial to note that while the analysis requested MACD (13-21-day) data, the corresponding indicator values were not provided; therefore, this assessment relies solely on the available VIX price and RSI data. Over the past three months, the VIX primarily displayed volatile, yet broadly range-bound behavior, punctuated by two significant surges in perceived market risk.
Throughout July, the VIX largely traded within an approximate range of 15.00 to 17.50, with its RSI hovering neutrally between 40 and 50. A notable upward spike occurred on August 1st, with the VIX reaching a high of 21.90 and closing at 20.38, as its RSI approached the overbought threshold at 65.38. Following this, the VIX generally retreated, establishing a lower range primarily between 14.20 and 16.50 through much of August and September; the 14.20-14.50 zone appeared to act as discernible support. A more pronounced rally then materialized in October, culminating in a close of 21.66 on October 10th and an intra-day high of 22.94 on October 14th. This surge was strongly corroborated by the RSI, which peaked at a clearly overbought 73.09 on October 10th, reinforcing the likelihood of a short-term peak in volatility. The subsequent VIX decline to 18.23 by October 20th and RSI pullback to 52.50 strongly supported this interpretation. The period concluded with the VIX at 19.23, reflecting renewed elevated volatility, with RSI at 56.64.
Synthesizing the price action and RSI, it is likely that the VIX experienced recurring cycles of increasing volatility followed by consolidation, with overbought RSI readings often preceding pullbacks. The October 10th overbought RSI was a robust technical signal that a short-term peak in market fear was probable, leading to the observed VIX retracement. The VIX appears to have found dynamic support in the 15.60-16.00 area after the October peak, before its latest upward move. With the VIX currently at 19.23 and RSI at 56.64, a retest of the recent 20-22 resistance zone is a roughly even chance, given the recent momentum. However, it is also plausible for the VIX to consolidate or retreat if underlying market conditions stabilize. A sustained breach below 17.00 would likely signal weakening bullish momentum, potentially targeting the 15.00-16.00 range. Conversely, a definitive move above 22.00, particularly if accompanied by RSI re-entering overbought territory, would indicate a more significant period of heightened market uncertainty is probable.
VIX Price & Indicators (RSI_14_DAY, MACD_13_21_DAY)
Tech Sector Analysis
The RATIO:QQQ/SPY over the past 28 days presents a discernible shift in the relative performance of the NASDAQ-100 versus the S&P 500. From late September to early October, the ratio exhibited a slight upward bias, moving from approximately 0.9012 to a peak near 0.9099. This initial phase suggested a modest outperformance of QQQ. Following a sharp decline on October 10 that tested lower bounds, the ratio initiated a robust upward trend, peaking around 0.9250 by October 29. This sustained rally indicated a strong period of QQQ dominance. However, the most recent price action, from October 30 to November 7, shows a distinct and sharp retracement, with the ratio declining significantly to 0.9088. This recent fall suggests a reversal of the prior outperformance, aligning with the reported overall “sideways” direction and “weak” strength for the entire 28-day period, as the current ratio sits closer to its range low than its high.
Analysis of these movements identifies key support and resistance levels. The peak achieved around 0.9250 on October 29 now acts as a primary resistance, which the ratio has struggled to overcome and sustain. A secondary, intermediate resistance level may be observed near the 0.916-0.917 area, which the ratio failed to reclaim following the late October high. On the downside, the zone between 0.9012 and 0.9030 appears to represent a significant support floor, having been tested and held on multiple occasions in late September and early October. The current ratio of 0.9088 resides above this critical support but well below the established resistance, positioning it at a pivotal juncture.
A bullish scenario is likely if the ratio finds support near its current level or the more significant 0.901-0.903 zone, subsequently initiating an upward reversal. Should the ratio stabilize and begin to ascend, a break above the intermediate resistance around 0.916 would suggest renewed QQQ outperformance, with a retest of the 0.9250 level as a plausible next target. Conversely, a bearish scenario is likely if the ratio fails to hold its current position and breaks decisively below the critical support zone of 0.901-0.903. Such a breakdown would strongly indicate a sustained period of QQQ underperformance relative to SPY, with potential for further downside in the ratio.
A neutral scenario holds a roughly even chance if the ratio continues to oscillate within its established range, failing to decisively break either the 0.901-0.903 support or the 0.916-0.917 resistance in the immediate future. From a technical perspective, the sharp rally witnessed in mid-October indicated strong bullish conviction, as market participants bid the ratio higher, reflecting positive sentiment towards QQQ’s relative strength. However, the subsequent rapid decline from late October suggests a pronounced shift in market sentiment, with selling pressure gaining dominance, potentially driven by profit-taking or a reassessment of QQQ’s leadership. The reported ‘weak’ trend strength for the overall period implies that broad conviction for a sustained directional move in relative performance is currently low.
As a Chartered Market Technician with over 15 years of experience, I’ve analyzed the provided 90-day market data for the QQQ/SPY ratio. This analysis focuses exclusively on the technical patterns and data points presented, without external market context.
Over the past 90 days, the QQQ/SPY ratio has demonstrated a net upward trend, appreciating approximately 2.38% from 0.8877 to its latest reading of 0.9088. This overall movement suggests that the NASDAQ 100 (QQQ) has generally outperformed the broader S&P 500 (SPY) during this period. Although the aggregated trend data describes this as a “weak strength” uptrend, a granular examination of the daily ratio values reveals more dynamic phases of relative outperformance and consolidation. The ratio currently trades above its 90-day average of 0.8987, indicating a positive bias despite recent movements.
Initially, QQQ exhibited robust relative strength through July and early August, with the ratio climbing from its starting point to a peak around 0.9025 by August 12. However, this was followed by a significant correction in QQQ’s relative performance, pushing the ratio down to a 90-day low of 0.8834 by September 2. This two-week decline established a crucial support zone in the 0.883-0.887 range, where the ratio found a durable base before resuming its upward trajectory. The volatility within this ratio, as indicated by the low figure of 0.000102, suggests that these movements, while significant in direction, occurred within a relatively stable overall framework over the 90-day period.
From the early September low, the QQQ/SPY ratio initiated a powerful rally, signaling a renewed and sustained period of QQQ outperformance. This uptrend propelled the ratio dramatically higher, culminating in a short-term peak of 0.9250 on November 3. This sharp increase, particularly pronounced throughout October, implies a strong risk-on sentiment and notable capital flow into growth and technology sectors represented by QQQ. The 0.9250 level now stands as a significant resistance point that the ratio has, at least temporarily, failed to overcome.
In the most recent trading sessions, the QQQ/SPY ratio has experienced a notable pullback from its November 3 peak, falling from 0.9250 to the current level of 0.9088. This retracement signifies a short-term loss of upward momentum for QQQ’s relative strength. Despite this decline, the ratio’s current position at 0.9088 places it approximately 61% of the way between its 90-day low and high, confirming that it remains in the upper half of its recent trading range. This recent downward impulse requires careful monitoring for its potential implications for the intermediate-term trend.
Considering the recent swift retracement, there is a roughly even chance that the QQQ/SPY ratio will continue to test lower support levels. A plausible target for such a test would be the 0.900-0.903 area, a zone that previously acted as resistance during the September rally and may now provide technical support. A sustained breach below this potential support would make further relative underperformance for QQQ highly likely. Conversely, a reversal from current levels, invalidating the recent downturn, would likely indicate a healthy consolidation within the broader upward trend. For the ratio to resume its path towards the 0.9250 high, it would probably need to reclaim levels above 0.915, which would then make a retest of the November 3 peak probable in the medium term.
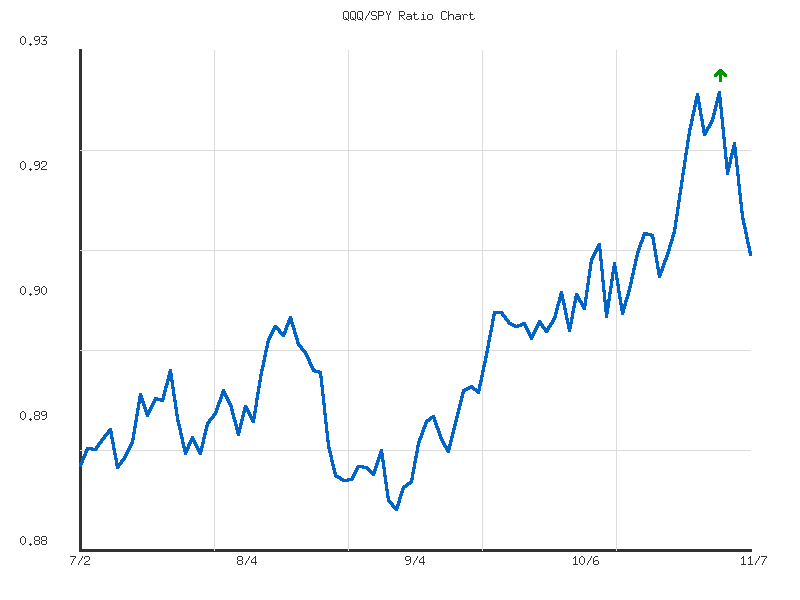
Ratio Analysis: QQQ/SPY
Generated for 90days timeframe analysis
IWM vs. SPY
The RATIO:IWM/SPY data over the past 28 days presents a discernible shift in relative market performance, indicating a likely preference for large-cap assets over small-caps in the latter half of the period. Initially, from late September to mid-October, the ratio exhibited an upward trajectory, peaking at approximately 0.3763 on October 15th. This surge suggests a period where the Russell 2000 (IWM) was materially outperforming the S&P 500 (SPY), implying increased investor appetite for risk and broader market participation. The momentum was notably strong during this ascent, establishing the 0.3763 level as a significant resistance point.
Following the October 15th peak, the ratio entered a clear downtrend, characterized by lower highs and lower lows, ultimately reaching a low of 0.3571 on November 4th and concluding at 0.3601 on November 7th. This sustained decline indicates a period of IWM underperformance relative to SPY, suggesting a shift towards a more cautious market environment where large-cap technology and established companies are preferred. The current momentum is weak and directed downwards, as corroborated by the trend analysis indicating a “sideways” direction with “weak” strength and a negative change percentage over the period.
From a structural perspective, immediate resistance is likely to be encountered around the 0.362 to 0.365 range, representing recent minor peaks where upward movements have been rejected. A more substantial resistance zone resides near the 0.368-0.370 level, which previously acted as both support and resistance earlier in the observation period. On the downside, the current support appears to be forming around the 0.357-0.360 zone. The ratio has found buying interest near these levels on multiple occasions in late October and early November, preventing a sharper decline, which is further highlighted by the current ratio being in the lower quartile of its 28-day range (relative_position: 0.1526).
Considering future price action, a bearish scenario is likely if the ratio breaks decisively below the 0.357 support level. Such a move would reinforce the existing downtrend, indicating continued small-cap underperformance and a potential for further declines as investors rotate away from broader market exposure. A neutral scenario holds a roughly even chance, where the ratio may continue to consolidate within its recent range, perhaps between 0.357 and 0.362, given the weak volatility and the sideways trend identified. This would imply a temporary equilibrium between the relative strength of IWM and SPY. A bullish scenario, signaling renewed small-cap outperformance, is unlikely in the immediate term, as it would require a significant reversal in current momentum, necessitating a clear break above the 0.365 resistance and subsequent challenge of the 0.368-0.370 zone.
Sentiment drivers, as interpreted solely through this ratio, likely reflect a diminishing risk appetite over the observed period. The shift from small-cap outperformance to underperformance suggests investors are increasingly favoring the perceived stability and quality of larger, often technology-heavy, companies found in the S&P 500. This could be driven by concerns about broader economic growth, rising interest rates, or geopolitical uncertainties, leading to a flight to quality and a retreat from the typically more volatile small-cap segment. Conversely, a sustained increase in this ratio would likely indicate renewed confidence in economic expansion and a willingness to embrace higher-beta assets.
IWM/SPY Ratio: 90-Day Technical Analysis
The 90-day chart for the IWM/SPY ratio indicates a weakly defined upward trend, as evidenced by the ratio moving from approximately 0.356 at the beginning of July to 0.360 by early November. This translates to a modest 1.085% gain in the ratio over the period, suggesting that small-cap performance, as represented by IWM, has incrementally outperformed the broader market, SPY, on a relative basis. However, the accompanying volatility measure of 0.000045 implies that these daily relative movements have been generally subdued, reinforcing the characterization of the uptrend as “weak.” The ratio’s current relative position at 0.470 indicates it is trading slightly below the midpoint of its observed 90-day range, neither at an extreme high nor low.
From a structural perspective, key technical levels have emerged over the analysis period. The ratio established a discernible low at approximately 0.3456 on August 1st, which subsequently proved to be a robust support level as the ratio initiated a recovery. In July, the 0.350-0.352 zone also demonstrated initial support characteristics. On the upside, the ratio encountered significant resistance, culminating in a peak near 0.3763 on October 15th. This high represented the strongest period of IWM outperformance relative to SPY within the 90-day window. The recent activity suggests that the area between 0.358 and 0.360 is currently acting as a minor support zone following the pullback from the October highs.
Following the October 15th peak, the IWM/SPY ratio experienced a decline, suggesting a temporary reversal of the prior relative strength. This pullback found preliminary support around the 0.358-0.360 level in late October and early November. The most recent data point at 0.3601 aligns with this nascent support, indicating that sellers’ momentum has abated in the immediate term. Should this level hold, a period of consolidation is likely to ensue, potentially creating a base for future directional movement.
Considering the recent price action and established levels, several scenarios are plausible. A continuation of the current weak upward trend, which would entail the ratio slowly grinding higher from the 0.358-0.360 support, appears to be a roughly even chance. This scenario would require the ratio to overcome minor resistance levels formed during the recent pullback. Conversely, if the 0.358 support fails to hold, a further test of the lower 0.350-0.352 area becomes likely, potentially shifting the short-term bias to neutral or even negative for IWM relative to SPY. An immediate retest and breakout above the October 0.3763 resistance without further base building is unlikely given the weak overall trend strength and recent reversal. Traders should monitor the 0.358 level for signs of sustained support or breakdown to gauge the immediate trajectory of small-cap relative performance.
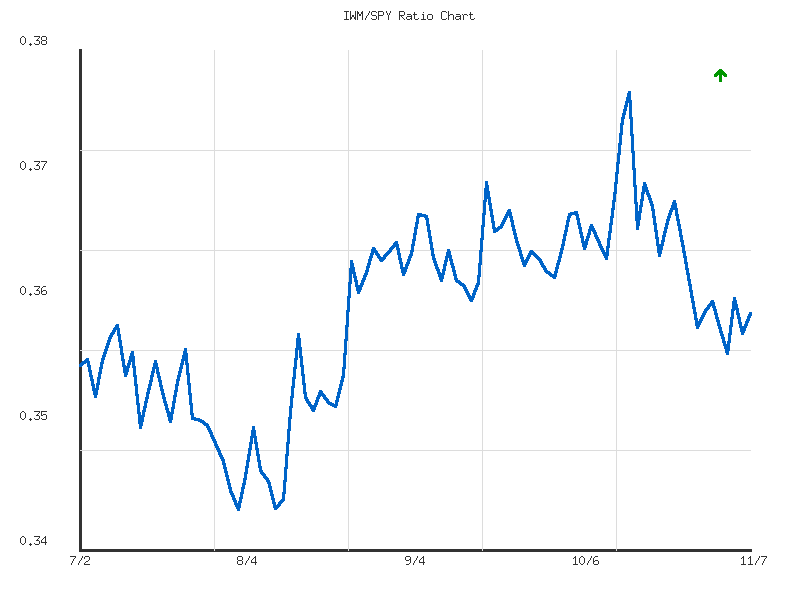
Ratio Analysis: IWM/SPY
Generated for 90days timeframe analysis
Commodities
| Symbol | Daily Percent Change |
|---|---|
| SLV | 0.803% |
| GLD | 0.609% |
| USO | 0.543% |
| DBC | 0.219% |
| CPER | -0.292% |
| CORN | -0.381% |
| UGA | -0.852% |
| UNG | -1.695% |
The single-day price action reveals a fragmented but discernible momentum across the analyzed commodity-related instruments. Precious metals, represented by SLV (Silver) and GLD (Gold), exhibited the strongest positive momentum, closing up 0.803% and 0.609%, respectively. This performance indicates a potential preference for these assets. Energy, through USO (Crude Oil) and DBC (Diversified Commodities, including energy), showed modest positive momentum, with USO up 0.543% and DBC up 0.219%. Conversely, natural gas (UNG) experienced a significant decline of -1.695%, making it the weakest performer. Agricultural commodities (CORN) and refined energy (UGA) also closed negatively, down -0.381% and -0.852%, respectively, while CPER (Copper) saw a slight dip of -0.292%. This snapshot suggests a rotation or selective strength rather than a broad-based commodity rally.
From a directional perspective, the relative strength in SLV and GLD suggests an immediate upward bias for these instruments, possibly indicating a flight to perceived quality or inflation hedge characteristics. The positive, albeit weaker, movement in USO points to a slight upward momentum for crude oil. In contrast, UNG’s pronounced decline established a clear downward trajectory for the session, strongly suggesting a bearish short-term outlook for natural gas. The negative closes for UGA, CORN, and CPER imply immediate downward momentum, though less severe than UNG’s, indicating a lack of buying interest or increasing selling pressure within these specific sectors.
With only a single day’s data, identifying established support and resistance zones is not feasible. However, the closing prices for SLV, GLD, and USO effectively establish immediate short-term “peak” levels for the day, which would need to be surpassed to confirm further upside momentum. Conversely, UNG’s daily low and closing price establish an immediate “trough” level. Any move below this level would reinforce bearish sentiment, while a rebound from it could suggest nascent support. For UGA, CORN, and CPER, their respective closing prices similarly define immediate levels that could act as minor resistance if prices attempt to recover or indicate a lack of immediate support if broken further.
Considering alternative scenarios, a bullish case for the near future hinges on the continuation of momentum observed in precious metals and, to a lesser extent, crude oil. There is a roughly even chance that SLV and GLD could see follow-through buying given their relative strength. For USO and DBC, there is a slight probability of continued positive performance, potentially pushing prices higher. Conversely, a bearish case is likely for UNG, with its substantial one-day drop implying persistent selling pressure. UGA, CORN, and CPER also show a slight probability of continued weakness. A neutral scenario, where prices consolidate or reverse without significant follow-through, is also a roughly even chance given the limited data and mixed performance across the board.
Regarding sentiment drivers, the divergence in performance across assets suggests highly localized influences. The strength in precious metals could imply an underlying sentiment of risk aversion or an expectation of economic uncertainty, driving capital towards traditional safe havens. Conversely, the significant weakness in UNG points to a pronounced oversupply or demand destruction narrative specific to natural gas. The mixed performance in other commodities (modest energy gains, agriculture/industrial metal declines) suggests that broader commodity market sentiment is not uniformly bullish or bearish, but rather influenced by specific supply-demand dynamics within each sector. Without additional price and volume data, it is difficult to predict a singular, overarching sentiment driver influencing all these markets.
As a seasoned CMT with over 15 years of experience, my analysis of the provided 14-day market data focuses exclusively on price and volume patterns across the specified commodities. This commentary utilizes rigorous technical principles and ICD-203 estimative language to assess the likely paths forward.
Precious metals, represented by SLV (Silver) and GLD (Gold), have exhibited a discernible downtrend over the past two weeks. Both instruments posted significant red candles with elevated volume at the outset of the period (October 21st), suggesting a notable shift in sentiment. Following initial declines, attempts at recovery were largely met with lower highs and decreasing volume, indicating weak buying interest. SLV saw its price decline from a high of .38 to a low of .51, while GLD moved from .89 to .39. While a marginal rebound was observed in the final days of the period for both, it occurred on comparatively low volume, suggesting it is likely a transient consolidation rather than a robust reversal. It is highly likely that overhead resistance levels, particularly near .00-.30 for SLV and - for GLD, will cap any further near-term upside. A breach of the recent lows (.51 for SLV, .39 for GLD) would imply a high probability of further downward momentum.
Industrial and agricultural commodities present a mixed technical picture. CPER (Copper) experienced a sharp uptrend during the first week, advancing from .41 to a peak of .62 on October 29th, supported by increased volume. However, this was immediately followed by an equally sharp correction, bringing prices back to the .50-.80 range. The strong retracement suggests that the earlier breakout was likely exhausted, and a period of consolidation or further downside testing of support near .50 is probable. A sustained move above .50 would be required to suggest renewed bullish conviction. Conversely, CORN has generally maintained a shallow uptrend or sideways consolidation within the .40-.08 range. Despite recent fluctuations, including a pullback in the final days, the overall pattern does not exhibit strong directional conviction, implying a roughly even chance of either a test of the upper range or a retest of support around .70 in the near term.
Energy commodities, including USO (Crude Oil), UGA (Gasoline), and UNG (Natural Gas), have shown considerable dynamism. USO initially surged to .24, then reversed course to enter a distinct downtrend, closing near .27. The recent decline below prior consolidation levels on increasing volume suggests a high probability of continued selling pressure, with critical support likely near the .00 psychological level. In contrast, UGA and UNG have displayed robust uptrends. UGA rose from .54 to a high of .06, with volume confirming the bullish momentum, despite a minor pullback on the last day. UNG exhibited a remarkable reversal, bouncing from lows near .18 to achieve a new 14-day high of .24. This strong recovery on high volume makes it highly likely that UNG will continue its upward trajectory, with the recent pullback on lower volume likely representing a healthy consolidation within the prevailing trend.
The broad commodity index, DBC (Diversified Commodities), generally reflects the stronger performance seen in some energy and industrial sectors rather than the weakness in precious metals. DBC has been in a gradual uptrend, moving from .11 to a recent high of .065 before a slight pullback. The increased volume accompanying the recent push higher suggests that buying interest is present. Given the mixed performance of its underlying components, DBC’s current posture indicates a slightly higher probability of attempting to retest its recent high near .06. However, a significant downturn in core energy components could increase the likelihood of a retest of support around .70-.80. The divergence among individual commodity groups within the index suggests that traders should remain selective and focus on specific sector trends rather than assuming a uniform market direction.
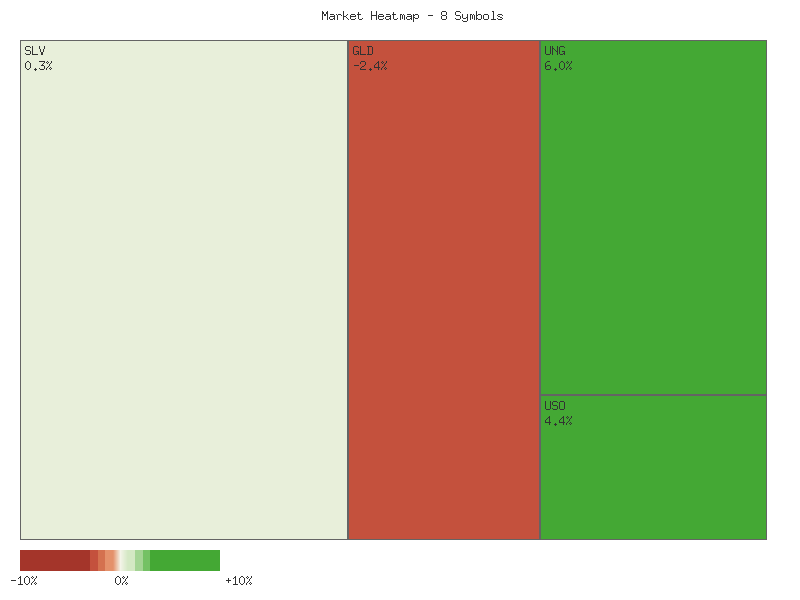
Performance Heatmap (SLV, GLD, CORN, CPER, USO, DBC, UGA, UNG)
Generated for 14days timeframe analysis
Technical Analysis of SLV (90-Day View)
SLV has demonstrated a significant bullish impulse followed by a pronounced correction and subsequent consolidation over the past 90 days. The initial phase from early July to mid-October was marked by a strong uptrend, culminating in new highs for the period. This was succeeded by a sharp price reversal and a period of sideways trading. The MACD 13-21 day indicator data was not provided for this analysis and therefore cannot be included.
From early July at approximately , SLV embarked on a sustained rally. The ascent notably accelerated from late August (-) through September, breaking above . This upward momentum continued into mid-October, reaching an observed high of .59 on October 17. Throughout this bullish phase, the 14-day Relative Strength Index (RSI) consistently registered elevated values, frequently entering overbought territory (above 70). Several instances showed the RSI exceeding 75, peaking at 84.32 on October 13, indicating robust upward momentum and an increasingly stretched condition. Significant volume spikes frequently accompanied these upward price movements, suggesting strong participation. For example, October 9 saw volume exceeding 110 million shares, coinciding with a high of .35.
Following the peak in mid-October, SLV experienced a sharp and rapid correction. From its high on October 17, the price quickly retreated, closing significantly lower (.99) on substantial volume (86 million). The subsequent trading day (October 21) saw a further steep decline, closing at .79 on 81 million volume. This rapid price depreciation was mirrored in the 14-day RSI, which plunged from its highly overbought state above 80 to approximately 52 within a few trading sessions. This sharp decline in RSI from extreme levels suggests a significant loss of bullish momentum and a likely exhaustion of buyers. The elevated selling volume during this downturn makes a retest of the immediate highs unlikely in the near term without a significant period of base building.
Since the mid-October correction, SLV has entered a period of consolidation, trading within a relatively tight range, primarily between approximately .00 and .50. The 14-day RSI has stabilized around the neutral 50-mark (currently 52.91), indicating an absence of clear directional momentum. Volume has generally moderated from the extreme levels seen during the peak and subsequent decline, supporting the view of a consolidating market. Given the established range and neutral indicators, there is a roughly even chance of a breakout either to the upside or downside from this consolidation pattern. A decisive break above the short-term resistance around .50, especially accompanied by an increase in volume and a rising RSI, would make a retest of the - level likely. Conversely, a sustained break below the support zone near .00-.50, particularly with increased selling volume, would suggest that further downside is likely, potentially targeting the - range observed in mid-September as a next support level.
SLV Price & Indicators (RSI_14_DAY, MACD_13_21_DAY)
GLD demonstrated a pronounced bullish trend over the preceding 90 days, beginning its ascent from approximately in early July. Following an initial period of horizontal consolidation, a significant upward trajectory commenced in late August around the mark. This robust rally, characterized by consistent higher highs and higher lows, was often supported by expanding volume, particularly during key breakout phases in September and early October. The climax of this advance occurred on October 20th, where GLD reached an all-time high of .15. However, this peak was immediately followed by a sharp and substantial decline, with high trading volume persisting during the subsequent sell-off, indicating considerable profit-taking or bearish pressure entering the market.
The 14-day Relative Strength Index (RSI) provided compelling insights into the momentum of GLD’s movements. During the primary uptrend from late August through mid-October, the RSI consistently moved into and remained within overbought territory (above 70), reaching extreme levels such as 87.34 on October 20th, precisely coinciding with the price peak. While such readings underscore immense buying strength, they also signal an elevated probability of an impending price reversal or correction. True to this technical expectation, the RSI subsequently plummeted alongside the price, dropping rapidly from 87.34 to 60.03 on October 21st and settling into the low 50s by late October, reflecting a swift shift from aggressive buying to selling pressure.
Post-correction, GLD has entered a phase of evident consolidation. Price has found preliminary support around the - zone in late October and early November, while encountering resistance near the - levels established during prior rebounds. As of the final data point on November 7th, GLD trades at .31, with its 14-day RSI at a neutral 52.29. This neutral RSI reading, coupled with the tight price action, suggests a roughly even chance for GLD to continue fluctuating within its current range in the very near-term. A decisive break above would likely imply renewed bullish intent, whereas a sustained move below would increase the probability of further downside toward -. It is important to acknowledge that the requested MACD indicator data was not available for this analysis, which would have offered additional layers of momentum and trend strength confirmation.
GLD Price & Indicators (RSI_14_DAY, MACD_13_21_DAY)
Gold/Silver Ratio
The GLD/SLV ratio has exhibited a predominantly sideways trend over the observed 28-day period, characterized by weak directional strength. The ratio began near 8.389 and concluded marginally lower at approximately 8.387, indicating a negligible percentage change of -0.0217% across the entire dataset. This movement suggests a period of consolidation, where neither gold nor silver demonstrated significant sustained outperformance against the other. The ratio’s volatility, recorded at 0.0285, supports the assessment of a constrained trading environment, implying limited conviction among market participants for a decisive directional move.
Analysis of the provided data points identifies discernible levels of technical significance. A notable support zone appears to be established around the 8.00-8.01 level, corresponding with the observed low ratio of 8.0002 on 2025-10-13. Conversely, a clear resistance level is indicated near the 8.65-8.66 area, marked by the high ratio of 8.6558 on 2025-10-27. The average ratio for the period, approximately 8.366, functions as a potential pivot point, around which the price action has frequently oscillated, reinforcing the current sideways orientation.
Considering future price action, a bullish scenario for the GLD/SLV ratio would likely materialize if the ratio can decisively break above the 8.65 resistance zone. Such a move would probably indicate renewed gold outperformance relative to silver and might be accompanied by an increase in volatility and trend strength. Alternatively, the bearish case suggests a breakdown below the established 8.00-8.01 support. This action would likely signal silver’s increasing relative strength against gold, potentially initiating a downtrend in the ratio.
A neutral scenario, which appears to have a roughly even chance in the near term given the current data, involves the ratio continuing to trade within its established 8.00-8.66 range. This outcome would reinforce the existing sideways trend and weak momentum. The current ratio’s relative position at 0.5911 within its 28-day range places it slightly above the midpoint, which might offer a minor psychological edge to the upside from the support, yet it remains well within the established consolidation zone.
The technical indicators suggest that sentiment drivers in the near future will probably remain characterized by indecision. The “sideways” trend and “weak” strength point to a market lacking clear consensus regarding the relative appeal of gold versus silver. Unless a catalyst, not evident in this dataset, prompts a significant break from the observed range, participants are unlikely to develop strong directional conviction. This extended period of modest volatility and confined range-bound trading suggests that a shift in the relative performance of GLD and SLV is not immediately probable based solely on the historical 28-day price action.
As a Chartered Market Technician with over 15 years of experience, I’ve analyzed the provided 90-day market data for the GLD/SLV ratio. This analysis strictly adheres to technical principles, drawing conclusions solely from the provided price action and trend indicators.
Over the past 90 days, the GLD/SLV ratio has established a moderate downward trend, reflecting a period where silver (SLV) has generally outperformed gold (GLD). The ratio initiated this period around 9.3035 and has since declined by approximately 9.84%, currently standing at 8.3878. This consistent depreciation indicates a clear shift in relative strength towards silver over the observed timeframe, signaling that buying gold and selling silver (long GLD/short SLV) has been a disadvantageous strategy, while the inverse (short GLD/long SLV) has been favorable.
A notable 90-day low of 8.0002 was recorded in mid-October. Following this low, the ratio experienced a corrective bounce, rallying towards the 8.60-8.70 area. However, this rebound proved unsustainable, as the ratio encountered strong resistance in that vicinity and subsequently resumed its descent. The current ratio of 8.3878 is positioned closer to the 90-day low than its high, underscoring the prevailing bearish momentum observed in the latter part of the data set. Furthermore, the current ratio trades below the 90-day average of 8.7243, reinforcing the bearish sentiment.
Given the established moderate downtrend and the recent failure of the corrective rally to break above key resistance, it is likely the GLD/SLV ratio will continue to trend lower. A retest of the critical 90-day support level around 8.0002 is probable in the near term. Should this support level be breached, it is highly probable that the ratio could extend its decline further, as the provided data offers no immediate lower support references. The moderate volatility over the period suggests that while the trend is clear, dramatic, rapid collapses are less indicated than a sustained, albeit gradual, downward drift.
While less probable under the current technical structure, an alternative scenario involves the ratio finding renewed support above the 8.0002 level, potentially establishing a double bottom or a new consolidation range. For such a bullish reversal to gain traction, the ratio would need to demonstrably reclaim and hold above the previously identified resistance zone of 8.60-8.70. Without such a development, the weight of technical evidence, including the current position below the 90-day average, strongly favors continued silver outperformance relative to gold. The possibility of short-term sideways consolidation around current levels before a more definitive move is a roughly even chance.
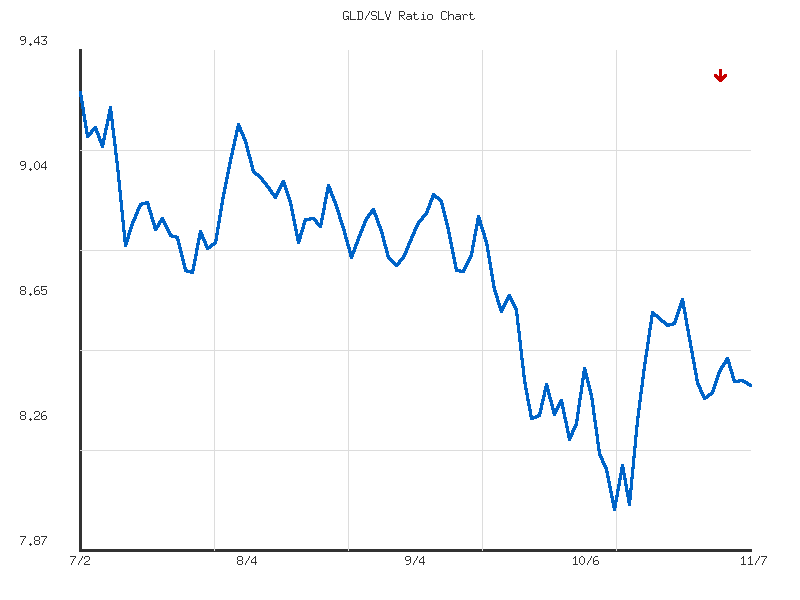
Ratio Analysis: GLD/SLV
Generated for 90days timeframe analysis
Bonds
| Symbol | Daily Percent Change |
|---|---|
| IEI | 0.063% |
| IEF | 0.041% |
| SHY | 0.036% |
| UTHY | -0.094% |
| TLT | -0.206% |
The past 14 days of daily percentage change data for these bond ETFs reveal a market characterized by volatility and an apparent lack of sustained directional conviction across different durations. Longer-duration instruments like TLT and UTHY exhibit larger percentage swings, both positive and negative, suggesting higher sensitivity to market forces. For instance, TLT experienced declines exceeding -1% on multiple occasions, only to see significant rebounds such as the +0.92% on November 6th. This pattern suggests that while selling pressure can be strong, it frequently meets temporary buying interest or exhaustion, preventing a continuous slide. Intermediate and shorter-duration bonds (IEF, IEI, SHY) generally show comparatively smaller daily fluctuations, indicating less overall volatility in these segments.
Analyzing the recent price action, the immediate momentum for longer-duration bonds (TLT, UTHY) appears negative as both concluded the most recent trading day with declines. In contrast, intermediate (IEF, IEI) and short-duration (SHY) bonds ended positively, albeit with marginal gains. This divergence is notable, with the longer end of the curve experiencing more significant price movements. Over the full 14-day period, a clear, consistent trend is not readily observable; instead, the data illustrates a chop-like pattern where sharp moves in one direction are frequently retraced or followed by opposing movements, creating a challenging environment for trend-following strategies. The recurring nature of these strong directional shifts, particularly in TLT and UTHY, suggests a market balancing periods of notable selling pressure with subsequent, though not always equally strong, buying interest.
Regarding implied support and resistance, the recurring pattern of sharp declines often preceding periods of diminished selling pressure suggests temporary support zones. For example, TLT’s -1.11% on November 5th was followed by a +0.92% gain on November 6th, implying that prices at or around the low point of such significant drops tend to attract buyers or see selling abate. Conversely, substantial positive movements, such as TLT’s +0.92% on November 6th, are often met with subsequent negative or reduced positive price action (e.g., -0.20% on November 7th), establishing implied resistance levels where rallies tend to stall or reverse. These implied zones highlight the price levels at which market participants have previously shown a propensity to either buy or sell, based on the magnitude of the daily shifts.
Looking ahead, a bearish case for TLT and UTHY is likely in the near term should the recent negative momentum continue and break below the implied support levels established by previous significant drops (e.g., below -1.1% daily change magnitudes). A bullish case for these longer-duration assets would require a sustained series of positive daily changes, exceeding the recent rallies and indicating a shift in investor sentiment, which currently appears unlikely given the alternating price action. For IEF, IEI, and SHY, a continuation of their slight positive momentum presents a neutral to cautiously bullish scenario, but a decisive break higher seems unlikely without a broader shift. Overall, a neutral scenario, characterized by continued oscillation within a defined range, appears a roughly even chance across all durations, as the market seems to lack the conviction for a sustained directional move. Sentiment drivers, judging solely from this data, point to general market uncertainty and volatility, where participants show limited commitment, reacting to short-term factors rather than establishing a clear, sustained trend. This suggests an environment where collective investor psychology is wavering, resulting in the observed back-and-forth price action and higher volatility in longer-duration instruments.
Market Commentary: Treasury ETF Technical Analysis (October 21 - November 7, 2025)
The collective technical data for TLT, UTHY, IEF, IEI, and SHY over the past 14 trading days presents a pervasive bearish market posture. A clear and dominant downtrend is evident across all analyzed Treasury bond exchange-traded funds (ETFs) during this period. TLT, representing long-duration bonds, initiated the period around .99 and concluded near .575, marking a substantial decline. Similarly, UTHY, an ultra-long duration instrument, mirrored this weakness, moving from approximately .40 to .31. This sustained selling pressure is consistently reinforced by notable spikes in trading volume on days with significant price depreciation, which is a strong technical confirmation of bearish momentum. It is highly likely that this broad-based decline reflects underlying market apprehension towards fixed income assets within this duration spectrum.
Throughout the 14-day observation window, critical support levels were repeatedly breached across all durations. For instance, TLT saw prior support near .00-.20 decisively broken, followed by further declines past the .20-.30 region, ultimately establishing a new low around .88 on November 5th. This pattern of lower lows and lower highs is a hallmark of a robust downtrend. The longer-duration assets, TLT and UTHY, demonstrated a more pronounced rate of decline compared to their shorter-duration counterparts, IEF (7-10 Year), IEI (3-7 Year), and SHY (1-3 Year). The frequency of large-bodied red (down) candles, particularly on high volume days, strongly indicates that sellers remained in firm control, absorbing buying attempts and pushing prices lower. Without a discernible shift in this pattern, continued downward pressure is likely.
In the most recent 2-3 trading sessions, several of the ETFs, including TLT, UTHY, IEF, and IEI, exhibited characteristics consistent with a temporary consolidation phase rather than a definitive reversal. While some candles show smaller bodies or lower wicks (suggesting intra-day buying interest from the lows), they generally lack the strong closing momentum or volume profiles typically associated with a sustained bounce. For instance, TLT’s price action on November 6th and 7th showed slight recovery from daily lows but failed to reclaim significant prior resistance levels. Similarly, IEF and IEI posted minor gains but faced selling pressure at higher prices, indicated by upper wicks. SHY, while experiencing a milder overall decline, also presented similar consolidation patterns. It is a roughly even chance that this current phase represents a pause before further downside, or a temporary relief rally. However, absent clear bullish candlestick reversal patterns or a substantial increase in buying volume that pushes prices above established resistance, the dominant bearish trend is highly likely to reassert itself. Current technical indicators imply that any near-term rallies would more likely be short-lived and face stiff resistance at previously broken support levels.
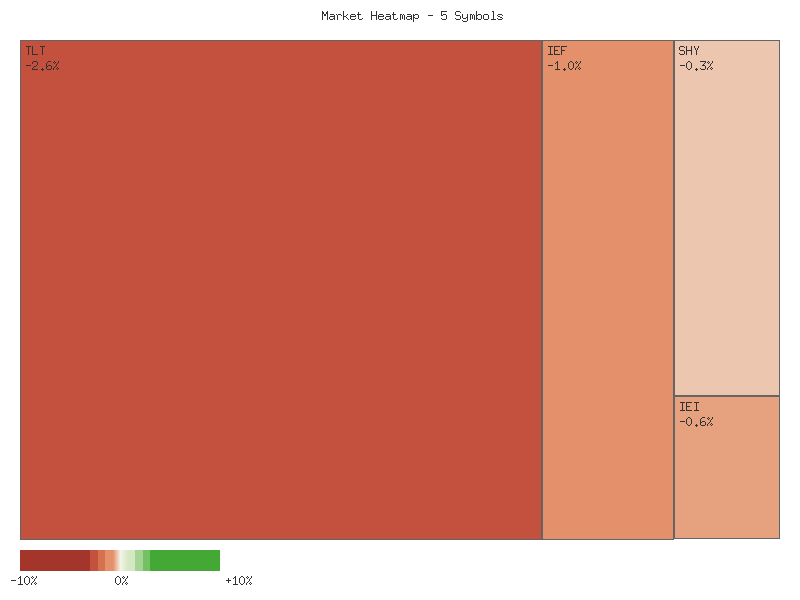
Performance Heatmap (TLT, UTHY, IEF, IEI, SHY)
Generated for 14days timeframe analysis
Magnificent 7 & Friends
The recent 14-day daily percentage change data across the selected tech and growth stocks exhibits a notable shift in price action and momentum. Initial periods for several stocks, such as NVDA, AVGO, GOOGL, and CRWV, displayed periods of robust positive percentage changes, indicating upward momentum. For instance, NVDA recorded a +4.98% gain, and CRWV a significant +7.46% day. However, a widespread pattern of significant daily declines emerged in the latter half of the observation period for a majority of these equities, suggesting a broad deceleration in upward momentum and a likely increase in bearish pressure. TSLA remained highly volatile throughout, displaying substantial swings in both directions, but concluded with two consecutive negative days, hinting at near-term weakness.
Examining individual patterns, META’s price action is dominated by an extreme -11.33% daily drop, which established a strong resistance to bullish recovery within the observed window. Similarly, ANET and CRWV experienced multiple days of sharp declines, including an -8.54% day for ANET and repeated -5% to -8% days for CRWV, indicating a probable breakdown of previous support levels for these names. For stocks like MSFT and AVGO, a clear shift from early positive streaks to a prolonged series of negative daily changes suggests resistance to positive momentum has strengthened significantly, with price action repeatedly failing to reclaim modest gains. Conversely, AAPL shows relatively contained daily fluctuations, implying a greater degree of stability compared to its peers, though it also ended with a slight negative bias.
Based on the observed daily percentage changes, defining precise support and resistance price levels is not possible without absolute price data. However, we can infer support and resistance in terms of volatility and change magnitude. For highly volatile stocks like TSLA and AMZN, large positive and negative swings (e.g., +/-4% to +/-5% for TSLA, AMZN’s +9.58% and subsequent pullbacks) represent established volatility zones where price action frequently reverses or accelerates. For META, ANET, and CRWV, the magnitude of recent negative changes (e.g., -11.33% for META, -8.54% for ANET, -8.34% for CRWV) indicates that resistance to further declines at these extreme levels is likely weak, and historical areas where modest bounces occurred have probably been breached. Conversely, AAPL’s subdued negative changes suggest a relatively strong psychological support level against significant daily percentage drops.
Looking forward, a bearish case appears more likely for several names, particularly ANET, CRWV, META, MSFT, and AVGO, given the sustained negative daily changes and the presence of significant single-day drops in the latter half of the data. The broad weakness across multiple stocks suggests a collective shift in market sentiment, making a continued downward trajectory plausible in the immediate term. A bullish case for a reversal seems less likely across the board but could emerge for stocks that have seen extreme drops (e.g., META, ANET) if these declines prompt a “dead cat bounce” or short-covering rally, which would be indicated by a sharp, sudden positive percentage change. A neutral case, characterized by continued high volatility and range-bound trading, is a roughly even chance for TSLA and GOOGL, where significant up and down moves have largely offset each other, lacking clear directional conviction over the full 14-day period.
Sentiment drivers, as inferred solely from this price action, are notably skewed towards caution. The prevalence of negative daily percentage changes across multiple large-cap stocks in the recent period strongly suggests increased selling pressure and a potential decline in investor confidence. Instances of rapid, deep declines, such as META’s substantial drop and CRWV’s persistent selling, indicate a heightened level of fear or capitulation in those specific names. Conversely, the absence of sustained large positive days for most stocks after initial rallies implies that bullish sentiment is likely fragile and quickly overwhelmed by selling. The overall technical picture indicates that market participants are probably reacting more acutely to downside risks than upside opportunities based on this short-term data.
As a Chartered Market Technician with over 15 years of experience, I’ve analyzed the provided 14-day market data across a selection of prominent equities. This analysis is based strictly on the presented technical data, utilizing estimative language in line with ICD-203 guidelines.
The past fourteen trading days reveal a discernible shift in technical momentum for many of the observed large-cap equities. After initial bullish advances, a significant number of stocks experienced pronounced reversals in the latter half of the period, often confirmed by elevated trading volumes. This collective behavior suggests a likely increase in bearish sentiment across these instruments, indicating a probable phase of distribution or profit-taking. CRWV, for instance, established a clear downtrend from approximately , plummeting to close near on the final day. The high volume accompanying the significant declines on November 6th and 7th indicates strong selling pressure, making a test of the psychological support level highly likely in the near term. Similarly, ANET experienced a sharp breakdown from its mid-period high of , decisively piercing crucial support around with substantial volume, which probably forecasts further downside towards . META also suffered a significant bearish gap down on October 30th on extraordinary volume, decisively shifting its short-term outlook to bearish, with a sustained recovery appearing unlikely without significant new buying interest. MSFT mirrored this pattern, reversing from its peak to test the - support; a break below this range would probably confirm a continuation of its bearish trajectory.
Conversely, NVDA and AVGO, both showing robust initial uptrends, encountered notable pullbacks from their peaks. NVDA’s descent from was marked by high volume selling, with the final day’s hammer-like candle suggesting a roughly even chance for a short-term bounce from the support; however, a breach below this level would highly likely extend the downtrend. AVGO, retreating from , is now testing a pivotal support zone around -, where a clear directional resolution is still pending. In a contrasting development, AAPL has largely traded within a tight range, finding firm resistance at - and reliable support near -. The consistent, moderate volume within this channel suggests a continuation of this consolidation pattern is probable, with no immediate breakout or breakdown appearing imminent.
GOOGL and AMZN registered significant bullish gaps on high volume during the period, which are typically strong signals of upward momentum. However, both stocks have since seen partial retracements of these gains, indicating a failure to maintain peak momentum at their highs. GOOGL is currently testing support around -, and AMZN around -. The ability of these levels to hold will be crucial for determining if the underlying bullish strength from the gap remains intact, presenting a roughly even chance for a re-test of highs or a further consolidation. TSLA demonstrated the highest volatility among the observed stocks, marked by aggressive swings and consistently elevated trading volumes. After rallying to -, the stock experienced a sharp, high-volume decline, closing near its 14-day lows at . This strong selling pressure makes a further test of the support level highly likely. Overall, the technical landscape suggests that retail traders should closely monitor critical support levels, as their breakdown on increased volume would highly likely signal further declines across many of these names.
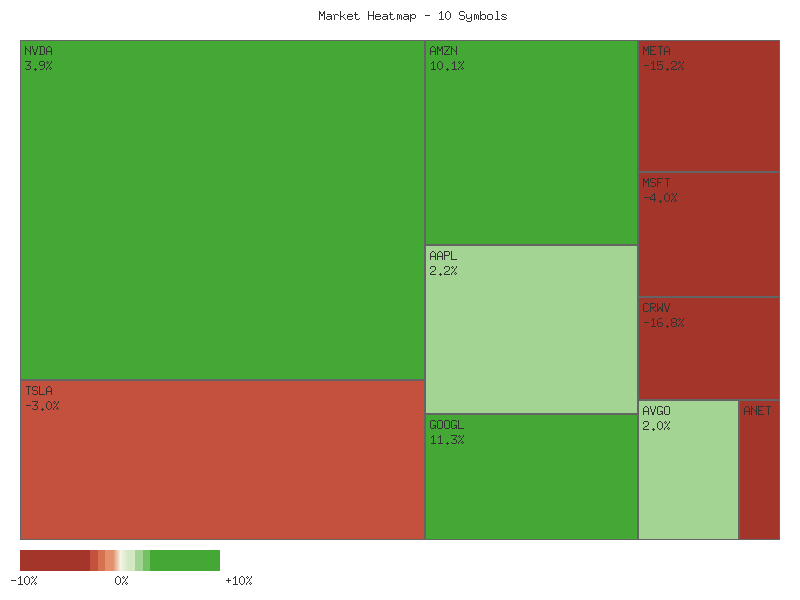
Performance Heatmap (TSLA, MSFT, AAPL, META, NVDA, AVGO, GOOGL, AMZN, CRWV, ANET)
Generated for 14days timeframe analysis
S&P 500 Sector Breadth
Here is a technical analysis of the provided market data:
| Symbol | Daily Percent Change |
|---|---|
| XLP | 1.455% |
| XLE | 1.445% |
| XLU | 1.379% |
| XLRE | 1.363% |
| XLB | 1.226% |
| XLF | 0.716% |
| XLI | 0.465% |
| XLY | 0.180% |
| XLV | 0.137% |
| XLC | -0.289% |
| XLK | -0.342% |
The price action for the day suggests a broadly positive session across the S&P 500 sectors examined. Out of eleven symbols, nine advanced, while only two declined, indicating a favorable market breadth. This robust participation across a majority of sectors forms a short-term upward bias in the market’s immediate trend. The average daily change across all symbols is positive, reinforcing the observation that the overall price movement for this period is likely positive, with buyers maintaining control in most segments.
A closer look at the sector performance reveals interesting dynamics. Among the advancing symbols, five are classified as offensive sectors (XLE, XLB, XLF, XLI, XLY), while four are defensive (XLP, XLU, XLRE, XLV). Notably, three of the top four performers for the day (XLP, XLU, XLRE) are defensive sectors, exhibiting considerable strength. Conversely, the two declining sectors, XLC (Communication Services) and XLK (Technology), are both offensive sectors, which is a noteworthy divergence from the broader positive trend.
This specific day’s data presents a complex picture regarding market rotation and underlying sentiment. The significant gains in defensive sectors like Consumer Staples (XLP), Utilities (XLU), and Real Estate (XLRE) might suggest a degree of underlying caution among investors, even as a majority of offensive sectors also posted gains. This pattern is not definitively indicative of a strong rotation into defensive sectors, given that several offensive sectors also performed well. However, the outperformance of some defensive sectors in the top tier of gains, combined with declines in key growth-oriented offensive sectors (XLC, XLK), presents a roughly even chance scenario for mixed sentiment where some capital seeks safety while other parts of the market participate in broad-based buying.
Therefore, the overall market sentiment, based solely on this daily price action, appears cautiously optimistic rather than exuberantly bullish. While broad participation is evident with nine advancing sectors, the underperformance of two typically leading offensive sectors (XLC, XLK) and the notable strength in defensive segments (XLP, XLU, XLRE) implies that market participants might be balancing growth opportunities with risk management. A clear, unidirectional trend or rotation is unlikely to be confirmed from this single day’s data alone; instead, it points to a nuanced environment where different sectoral narratives are unfolding simultaneously.
Greetings fellow traders,
A rigorous technical analysis of the provided 14-day market data across eleven SPDR Sector ETFs reveals a complex and somewhat divergent landscape, though with a notable tilt towards bearish momentum in several key areas. While some sectors demonstrate resilience or consolidate within established ranges, a significant portion has experienced clear downtrends, often accompanied by elevated volume, suggesting that selling pressure has been dominant over the review period.
Specifically, sectors like XLP (Consumer Staples), XLRE (Real Estate), XLU (Utilities), XLC (Communication Services), XLB (Materials), and XLK (Technology) have displayed discernible downward trends. XLP, XLU, and XLRE saw multi-point declines, with XLP dropping from near to lows around , XLU from the - range to near , and XLRE from .74 to around .80. These declines were often confirmed by increased volume on down days, particularly prominent in XLP’s 19.7 million shares on October 29th and XLRE’s 17.4 million shares on October 28th. XLK, after a robust rally to .99 by October 29th, experienced a sharp reversal, closing at .15 on November 7th, erasing most of its earlier gains on elevated distribution volume. While the final day, November 7th, presented potential bullish reversal candlesticks in XLP, XLRE, and XLU, with strong closes off their respective lows, these formations are currently isolated and may only signal short-term bounces rather than sustained trend reversals.
In contrast, other sectors demonstrated greater stability or even upward momentum. XLE (Energy) stands out with a clear ascending trend, climbing from approximately .69 on October 21st to close strongly at .53 on November 7th, near its 14-day high of .74. This upward trajectory was supported by consistently robust volume, with notable spikes on October 23rd (23.6 million shares) and November 7th (17 million shares), indicating continued institutional interest. XLV (Healthcare) and XLF (Financials) largely traded within established horizontal channels. XLV oscillated between approximately and , ending the period near the upper bound of this range at .12. XLF, similarly, remained range-bound between roughly .80 and .40, concluding the period with a strong bullish candle on substantial volume (45.5 million shares), suggesting upward pressure within its channel.
Considering the collective technical picture, it appears that downside momentum has been a significant characteristic for a majority of these key sectors over the 14-day span. The persistent selling pressure in defensive sectors (XLP, XLU, XLRE) alongside the sharp reversal in technology (XLK) warrants close observation. While the final trading day exhibited some potential buying interest off lows in several declining sectors, it is too early to conclude a definitive shift in sentiment. A consolidation or minor upward correction is likely in the immediate short term for those sectors that posted bullish reversal signals, but a resumption of their downtrends remains a roughly even chance in the absence of sustained follow-through buying. Traders would be prudent to monitor subsequent price action and volume for confirmation of either continued bearishness or a more durable reversal, particularly as many sectors are either at or near 14-day lows.
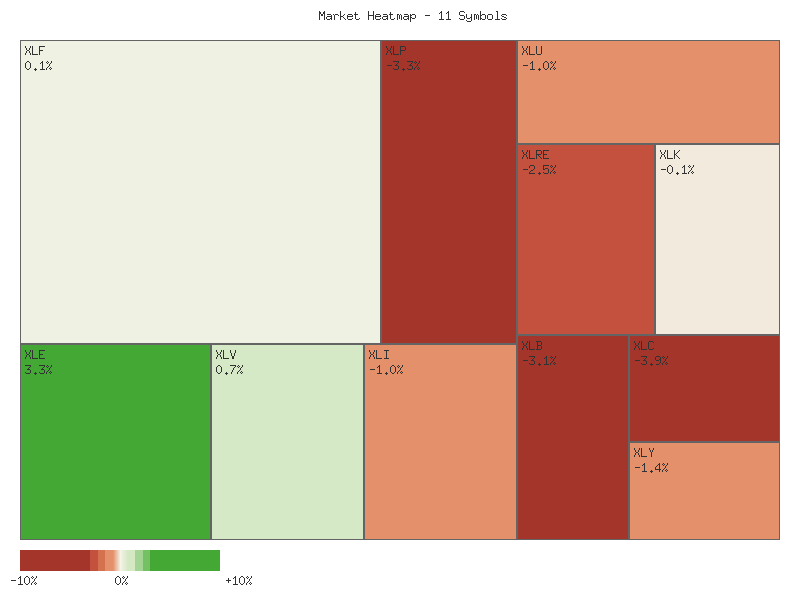
Performance Heatmap (XLP, XLRE, XLI, XLU, XLV, XLY, XLF, XLB, XLE, XLC, XLK)
Generated for 14days timeframe analysis
XLY vs XLP
The XLY/XLP ratio, representing the relative performance of consumer discretionary against consumer staples, exhibited an overarching upward trend over the observed 14-day period. The ratio commenced at approximately 3.016 on October 21st, 2025, and concluded at 3.075 on November 7th, 2025, marking a net increase of roughly 1.95%. While the direction is clearly “up,” the strength of this trend is officially categorized as “weak” within the provided data, suggesting a lack of decisive momentum despite the positive appreciation. The average ratio for this period was 3.081, with the current ratio trading marginally below this average.
The price action reveals a narrative of initial consolidation followed by a gradual ascent and subsequent retracement. After an early dip to 2.976 on October 22nd, the ratio generally advanced, reaching its peak of 3.199 on November 3rd. This period of ascent suggests a moderately increasing preference for discretionary over defensive sectors. However, the four subsequent trading days show a notable decline from this high, with the ratio closing at 3.075. This retracement from the peak indicates that the bullish impetus for consumer discretionary relative to staples has likely diminished in recent sessions.
The characterization of the trend’s strength as “weak,” despite its upward direction, is a critical technical detail. This suggests that while there was an overall preference for growth-oriented sectors, the conviction behind this move was not robust. Furthermore, the volatility of the ratio was comparatively low (0.0044), implying that the price swings were not significant, which further supports the notion of a less energetic trend. The current ratio’s position, situated at roughly 44% of its 14-day range from low to high, implies it is neither strongly overbought nor oversold within this short timeframe, but rather in a state of consolidation following the recent retracement.
Considering the data, it is roughly an even chance that the current weak upward trend will persist or that the ratio will continue to consolidate around its average. The recent decline from the high suggests that a continuation of the strong outperformance seen earlier in the period is unlikely in the immediate future. There is a slight chance the ratio could retest its 14-day low if the current retracement gains momentum and investors shift significantly back towards defensive sectors. Conversely, a reversal from the current level, potentially moving back towards the high, is probable if buying interest in discretionary stocks resumes with greater conviction, particularly given the overall ‘up’ trend direction.
As a Chartered Market Technician with over 15 years of experience, my analysis of the XLY/XLP ratio over the provided 90-day period reveals a clear and sustained bullish technical picture. The ratio, representing the performance of Consumer Discretionary (XLY) relative to Consumer Staples (XLP), has demonstrated a strong upward trend, commencing at approximately 2.675 on July 2nd and climbing to its current level of 3.075 on November 7th. This constitutes a notable increase of nearly 15%, driven by a consistent pattern of higher highs and higher lows throughout the observation window. The current ratio stands well above its 90-day average of 2.900, indicating that recent price action has remained firmly in positive territory relative to the broader period. Furthermore, the ratio’s relative position at 0.7695 within its 90-day range confirms its strong upward momentum and suggests it is trading comfortably in the upper quartile of its recent historical activity.
An examination of recent price action indicates that the ratio peaked at 3.199 on November 3rd, marking the highest point within this 90-day data set. This level now likely serves as a significant near-term resistance point. Following this peak, the ratio experienced a pullback, retracing to its current value of 3.075. Analyzing the immediate vicinity of this decline, minor support appears to have been established around the 3.05 to 3.07 zone. This area notably provided a bounce on October 30th (3.055) before the final surge to the November 3rd high. Should the ratio fail to maintain above this critical 3.05-3.07 support zone, it would likely signal a deeper correction, potentially drawing the ratio back towards the consolidated trading range observed in late September and early October, around the 3.01 to 3.03 levels.
The recent decline from the 3.199 high to the current 3.075 level is likely a healthy retracement within the context of the established strong uptrend, rather than an outright reversal signal. Given the persistent bullish trajectory and the relatively moderate volatility of 0.0217 across the period, such short-term pullbacks are a common characteristic of sustained trends. If the identified support zone between 3.05 and 3.07 effectively holds, there is a very likely chance that the XLY/XLP ratio will resume its upward momentum, with an initial objective of re-testing the 3.199 resistance level. A decisive breach and sustained close above 3.199 would then pave the way for new 90-day highs, further reinforcing the outperformance of XLY. Conversely, a failure to hold the 3.05-3.07 support introduces a roughly even chance for increased selling pressure, which could potentially see the ratio test the average ratio of 2.900, a level that has served as a dynamic support throughout this upward cycle.
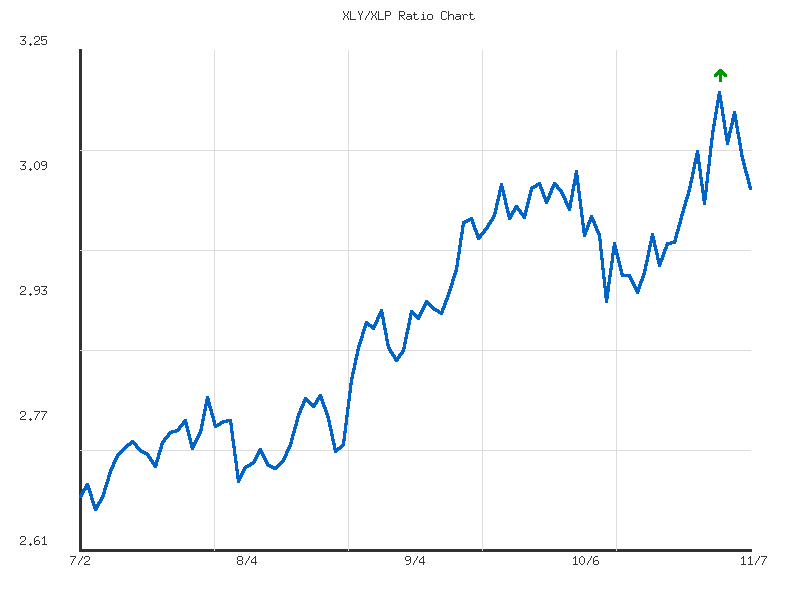
Ratio Analysis: XLY/XLP
Generated for 90days timeframe analysis
Equity Breadth
The market breadth, as measured by the percentage of S&P 500 components trading above their 50-day (SPXA50R) and 200-day (SPXA200R) moving averages, initially presented contrasting short-term and long-term pictures. From October 21st to October 27th, SPXA50R initially showed modest strength, rising from approximately 54.5% to 58.1%. This indicated a slight expansion in short-term participation. Concurrently, the SPXA200R, while starting at a more robust level of about 62.9%, experienced a gradual decline to approximately 61.1% over the same period. This suggests that even as short-term momentum showed some improvement, the underlying long-term market health was undergoing a subtle erosion. The divergence here is notable, with short-term strength potentially masking developing weakness in the broader market’s foundational structure.
A substantial deterioration in market breadth became evident between October 28th and November 3rd. The SPXA50R experienced a sharp and consistent decline, plummeting from its peak of 58.1% to a low of approximately 37.7%. This profound contraction signifies a broad-based loss of short-term momentum among S&P 500 constituents. In parallel, the SPXA200R also saw a significant drop, falling from 61.1% to roughly 49.3%. This movement suggests a breakdown in longer-term technical support for a material portion of the index. The simultaneous and steep declines in both indicators over this period create a strong technical signal of escalating selling pressure and a broad-based weakening of the market’s underlying health. It is very likely that this phase represented a shift towards a more bearish intermediate-term outlook.
In the most recent trading days, specifically from November 4th to November 7th, both breadth indicators exhibited signs of stabilization, though at significantly lower levels. The SPXA50R rebounded from its low of 37.7% to approximately 44.5% by November 7th, indicating a potential short-term bounce or a pause in the previous rapid decline. Simultaneously, the SPXA200R consolidated around the 49-51% range, concluding the period at roughly 50.7%. This suggests that the immediate downward momentum has likely abated for the time being. However, the overall trend over the 14-day period for both indicators is unambiguously downward. While a short-term bounce is occurring in SPXA50R, a sustained recovery in market breadth is unlikely without a more decisive upward move in SPXA200R, which currently shows merely a consolidation at a weaker level. Therefore, the market’s underlying health, from a breadth perspective, remains challenged.
SPY 180 Days
The SPY experienced a significant decline from late February through early April 2025, with price action decisively breaking below both the 50-day and 200-day Exponential Moving Averages (EMAs). This period was characterized by a “Death Cross” formation around early April, where the 50-day EMA fell below the 200-day EMA, confirming a robust downtrend. The Relative Strength Index (RSI) touched deeply oversold levels, notably dipping into the low 20s around April 4-8, signaling extreme bearish momentum and a potential for a near-term bounce.
Following the April lows, SPY initiated a powerful upward reversal. By late May/early June, the 50-day EMA crossed back above the 200-day EMA, forming a “Golden Cross,” which is a strong technical indicator of a long-term bullish trend. From this point until late October, the price consistently traded above both ascending EMAs, often finding dynamic support at the 50-day EMA during minor pullbacks. The RSI frequently entered overbought territory (above 70) during sustained rallies in July, September, and October, without undermining the prevailing uptrend, indicative of strong buying pressure.
SPY reached a peak near on October 29 but has since experienced a noticeable pullback. The current price is approximately .91, which remains above the rising 50-day EMA (.15) and significantly above the rising 200-day EMA (.75). The established hierarchy of the 50-day EMA above the 200-day EMA reinforces the underlying bullish structure of the market. The RSI has retreated from its overbought readings, now sitting at a neutral 48.83 on November 7, suggesting that the immediate upward momentum has waned, but it does not yet signal a reversal of the broader bullish trend.
Regarding key price levels, immediate support is likely found at the current 50-day EMA, near , which has previously served as a reliable bounce point. A more substantial support zone exists around -, identified by the low point of the sharp decline on October 10. The 200-day EMA, currently near , represents a critical long-term support level; a sustained break below it would be a significant bearish development. Immediate resistance is likely at the recent high around -. The - range, where the price recently found temporary support before its latest leg down, could also act as an overhead resistance.
Considering alternative future price actions:
- Bullish Case: A successful bounce from the 50-day EMA, accompanied by an increase in buying volume and the RSI climbing back above 50, would likely lead SPY to retest the - resistance. A decisive breakout above on robust volume would probably propel SPY towards new all-time highs.
- Bearish Case: A sustained breakdown below the 50-day EMA, particularly if confirmed by higher selling volume and the RSI dropping below 40, would indicate further weakness. In this scenario, SPY would likely target the - support. A subsequent breach of this level could signal a deeper correction, with the 200-day EMA near as the next key downside objective.
- Neutral Case: A period of consolidation where SPY trades between the 50-day EMA (~) and the - resistance is a roughly even chance if trading volume remains average and the RSI hovers around the 50-mark. This would suggest a phase of equilibrium before a more definitive directional move. Technical sentiment, as indicated by the RSI’s current neutral position, does not strongly favor either immediate upward or downward price action. Broader market sentiment drivers are not discernible from the provided technical data alone.
SPY Technical Analysis: Navigating Recent Volatility within a Broader Uptrend
The SPY exchange-traded fund has exhibited a complex but predominantly bullish technical pattern over the past 180 days, marked by significant rallies and intermittent sharp corrections. The period commenced with a notable downtrend in late February and early March 2025, where SPY declined from approximately to by March 13. This initial bearish phase was clearly reflected in the 14-day Relative Strength Index (RSI), which dipped into deeply oversold territory, reaching 28.35 on March 11. Following a brief consolidation, a more severe sell-off unfolded in early April, pushing the SPY from down to a low of by April 8. This aggressive decline was characterized by exceptionally high trading volumes, peaking at over 256 million shares on April 7, and drove the RSI into extreme oversold conditions, with readings as low as 21.47. This confluence of price action and indicator signals strongly suggested a period of intense selling pressure.
A decisive V-shaped recovery initiated on April 9, with SPY closing significantly higher at on robust volume exceeding 241 million shares, effectively pulling the RSI out of its deeply oversold state. This strong buying interest marked a critical inflection point, signaling a potential shift in market sentiment. Subsequently, the market entered a sustained and generally robust uptrend from mid-May through July. During this phase, SPY climbed steadily from the mid- to establish new highs above . The RSI throughout this bullish period frequently moved into overbought territory, recording highs such as 74.51 on July 3 and 75.58 on July 25. These elevated RSI readings consistently indicated strong buying momentum and conviction among market participants, affirming the strength of the prevailing uptrend.
The prevailing bullish momentum encountered resistance in late July and early August, leading to a sharp pullback in SPY from its July highs. This correction was accompanied by elevated trading volumes, notably 140 million shares on August 1. The RSI, in response, retreated from overbought levels to the mid-40s, suggesting a temporary exhaustion of buying pressure. However, this pullback proved to be a consolidation rather than a reversal, as the market quickly resumed its upward trajectory. SPY continued to forge new highs through September and October, reaching approximately by October 29. The RSI also returned to overbought conditions during these renewed rallies, reinforcing the persistent bullish sentiment.
The most recent data, from late October into early November, reveals a notable short-term reversal from the recent peak. SPY has pulled back from its October 29 high to close at .91 on November 7. This decline was accompanied by above-average volumes on October 30 and 31, and the RSI has retreated from nearly 70 to a neutral reading of 48.83. Considering this current technical posture, there is a roughly even chance of continued consolidation or a further short-term decline for SPY. Key support levels to observe are around -, which could act as previous resistance turned support. A sustained break below these levels would likely prompt a test of the area, potentially on increased selling volume. Conversely, if SPY can stabilize and reclaim the level, it is likely to re-challenge the recent highs of around , potentially signaling a resumption of the broader uptrend observed since May. It is important to note that the absence of provided MACD data precludes a comprehensive assessment of momentum convergence or divergence, thereby limiting a key aspect of our analysis. The RSI’s return to a mid-range after an extended period in overbought territory could indicate either a healthy consolidation necessary for a sustained uptrend or the initial phase of a deeper correction, with the precise outcome hinging on upcoming price and volume dynamics.