Daily Market Technical Analysis
Market breadth exhibits significant divergence, with small and mid-cap indices showing probable bullish reversals on increasing volume. Conversely, large-cap and technology-heavy indices, including QQQ, face likely sustained selling pressure, while SPY indicates a short-term pullback with a roughly even chance for further decline or consolidation. The VIX index likely encountered rejection at recent highs, suggesting moderating volatility. Commodities present a mixed picture: precious metals demonstrate strongly bullish momentum, yet natural gas and agriculture sectors face likely continued weakness. Treasury bonds suggest a probable yield curve steepening, with short-duration strength and likely continued long-duration weakness. Sector analysis points to defensive leadership, with Technology and Communication Services exhibiting very likely continued downtrends, indicating a rotation away from growth. Overall equity breadth recovered but remains finely balanced, presenting a roughly even chance of further consolidation.
Market Indices
Our analysis of the provided daily percentage change data for a selection of broad market ETFs reveals a nuanced picture of market breadth. The following matrix outlines the daily performance of each symbol, sorted in descending order:
| Symbol | Daily Percent Change |
|---|---|
| MDY | 1.153% |
| IJR | 0.851% |
| IWM | 0.516% |
| SPY | 0.100% |
| OEF | -0.177% |
| QQQ | -0.317% |
From this data, we observe that four out of the six symbols advanced for the day, while two declined. This suggests a roughly even chance of broader market support, with a slight tilt towards positive momentum as advancing symbols outnumber declining ones. However, the distribution of these changes across market capitalization segments provides additional insights. Mid-cap (MDY) and small-cap (IJR, IWM) segments exhibited notable positive daily performance, with MDY leading the group. In contrast, the large-cap segments, represented by SPY and OEF, showed more modest gains or slight declines. Specifically, SPY registered only a marginal increase, while OEF experienced a minor pullback. The technology-heavy QQQ recorded the largest daily decline among the group.
This divergence in performance is noteworthy. We estimate that the strong showing in mid-cap and small-cap segments, while indicative of some risk appetite, is somewhat counterbalanced by the subdued performance of larger-cap indices and the outright decline in the growth-oriented QQQ. Such a pattern could suggest a rotational dynamic within the market, where capital might be flowing out of large-cap and growth-oriented assets into other segments, such as mid and small caps. This could reflect a shift in investor preferences, or it might indicate that the underlying market strength is not uniformly distributed across all capitalization tiers. We judge it unlikely, however, that this single day’s data alone signifies a decisive long-term trend reversal, given the limited scope of the data.
Considering alternative scenarios, if the observed outperformance of mid- and small-cap indices were to persist over several consecutive sessions, alongside continued weakness in large-cap and technology-focused ETFs, it would highly likely signal a more robust shift in market leadership or an expansion of market breadth beyond a few dominant large-cap names. Conversely, if the minor declines in OEF and QQQ were isolated incidents and these indices quickly regained upward momentum, the current day’s performance might be interpreted as a brief pause or rebalancing within an otherwise stronger trend. We assess that the current technical picture, based solely on this data, suggests a market with uneven momentum, where a subset of assets is performing well, but overall market conviction, particularly in larger growth stocks, appears to be tempered.
Market Commentary: ETF Performance Analysis (2-Day View)
The market data for the past two days presents a mixed picture across various Exchange Traded Funds (ETFs), with a notable divergence in performance between market capitalization segments. The initial trading day (November 6th) was characterized by widespread bearish sentiment, as all observed indices—SPY, QQQ, IWM, IJR, MDY, and OEF—opened higher than their closes, signifying selling pressure throughout the session. Volume on this day was robust across the board, indicating conviction behind the selling activity.
However, the second trading day (November 7th) introduced a distinct shift. Small-cap and mid-cap indices, specifically IJR (S&P SmallCap 600 Growth) and MDY (S&P MidCap 400), demonstrated a probable bullish reversal. IJR experienced a strong day, opening lower but closing near its high, well above its prior day’s close, accompanied by a significant increase in volume. Similarly, MDY, despite lower volume, formed a strong bullish candle, also closing near its high and above the previous day’s close. IWM (Russell 2000) also registered a bullish candle on the second day, recapturing some of its prior session’s losses on increased volume, suggesting renewed buying interest in the small-cap segment.
Conversely, the larger capitalization and tech-heavy indices exhibited continued weakness or indecision. QQQ (Nasdaq 100) recorded another bearish day, closing lower than its open, lower than its previous close, and making a lower high and lower low, all on increased volume. This pattern is likely indicative of sustained selling pressure. SPY (S&P 500) presented an indecisive candle on Day 2, characterized by a wide range but ultimately closing only marginally above its Day 1 close, despite increased volume. This suggests a roughly even chance of either continued consolidation within a potential downtrend or a struggle between buyers and sellers for directional control. OEF (S&P 100) also showed persistent weakness, making a lower high and lower low on increased volume, although its close near the mid-point of the day’s range might hint at some intraday buying stabilizing the price after an initial decline.
Considering these divergences, it is probable that small and mid-cap segments might attempt to build on their recent strength, potentially testing resistance levels in the near term. The increased volume accompanying their bullish candles on Day 2 suggests underlying buying conviction. However, the continued bearish pressure in QQQ and the indecision evident in SPY and OEF make a broad, market-wide rally less probable in the immediate future without further confirming price action. There is a non-negligible chance that sustained weakness in the larger cap indices could eventually exert downward pressure on the recently resilient small and mid-cap segments. Traders should monitor these divergences carefully, recognizing that the current technical picture indicates a fragmented market dynamic rather than a unified trend.
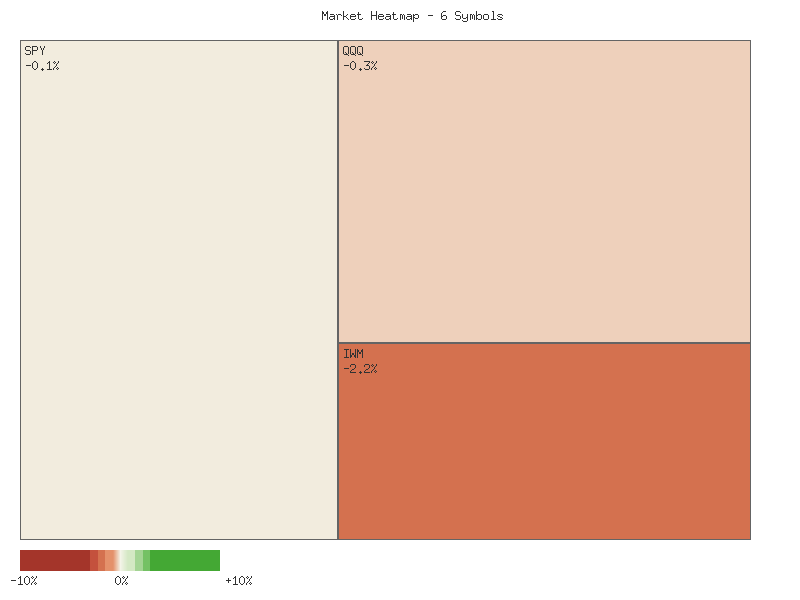
Performance Heatmap (SPY, QQQ, IWM, IJR, MDY, OEF)
Generated for 2days timeframe analysis
SPY Technical Analysis: November 7, 2025
The SPY ETF has demonstrated a robust uptrend over the past 90 days, advancing from approximately in early July to a peak near in late October. This sustained upward movement has been punctuated by several notable, yet temporary, pullbacks, which have subsequently reversed to drive prices to new highs. It is important to note that while MACD data was requested for this analysis, it was not provided in the market data set. Therefore, this commentary relies solely on an examination of price action, trading volume, and the 14-day Relative Strength Index (RSI). The overarching price pattern throughout the observed period consistently suggests a strong prevailing bullish sentiment, characterized by successive higher highs and higher lows.
Following a strong rally into late October, SPY established a new high of approximately .70 on October 29th. Subsequently, the ETF has experienced a multi-day decline, closing at .91 on November 7th. This recent price depreciation is accompanied by noticeably elevated trading volume, particularly on October 30th (75 million shares), October 31st (86 million shares), November 4th (72 million shares), November 6th (77 million shares), and most notably on November 7th (92 million shares). This increased volume during a period of declining prices suggests a likely increase in selling pressure. A similar high-volume sell-off was observed on October 10th, where SPY closed sharply lower at .02 on record volume for the period (156 million shares), establishing a significant short-term support level that subsequently held.
The 14-day Relative Strength Index (RSI) largely corroborated the price movements throughout the 90-day period. In late October, as SPY approached its peak, the RSI reached approximately 69.71, indicating strong momentum but without consistently registering extreme overbought conditions above 70, which could have flagged an imminent reversal with higher probability. However, the subsequent price decline has led to a notable drop in RSI from 69.71 to 48.83 by November 7th. The RSI moving below the 50-level signals a shift in short-term momentum, suggesting that bearish forces have gained at least a slight advantage. This bearish momentum shift, coupled with elevated volume on recent down days, implies that further near-term weakness is likely.
Given the recent price action, elevated selling volume, and the RSI dropping below the 50-level, a continuation of the short-term pullback is likely. Key support levels to observe include the - region, which previously acted as resistance and then minor support, and more significantly, the .02 low from October 10th. A sustained break below would increase the likelihood of SPY testing the level. An alternative scenario, though less likely given current momentum indicators, would involve SPY finding immediate support around the current - range, potentially leading to a period of consolidation or a renewed attempt to challenge the recent highs. However, the confluence of a sharp RSI decline and increasing volume on down days presents a roughly even chance for continued downward price pressure or at least a period of horizontal consolidation before any significant recovery materializes. A sustained close above would be required to suggest the bullish momentum is reasserting itself with higher probability.
SPY Price & Indicators (RSI_14_DAY, MACD_13_21_DAY)
Here is a technical analysis of QQQ over the past 90 days, based solely on the provided data:
QQQ exhibited a clear bullish trend during the initial period of the 90-day window, advancing from approximately in early July to highs around by late July. This upward momentum was interrupted by a sharp decline on July 31st and August 1st, where the price dropped notably on elevated volume, suggesting a probable shift in short-term sentiment. Following this correction, QQQ demonstrated resilience, resuming its ascent and reaching new highs near in mid-August. However, another significant pullback materialized between August 19th and 21st, again accompanied by heavy trading volume. The recurrent high-volume pullbacks during this period suggest that selling pressure was present at previous highs, making further upward continuation less certain without consolidation.
Despite the intermittent selling pressure, QQQ initiated another robust rally from late August through late September, culminating in a peak near . The Relative Strength Index (RSI), a momentum oscillator, consistently entered overbought territory (above 70) during these strong uptrend phases, specifically on July 3rd, July 17th, July 28th, September 19th, and September 22nd. Historically, such elevated RSI readings often indicate that an asset may be due for a pause or pullback, which largely correlated with subsequent price consolidations or minor corrections observed in the data. Conversely, during periods of significant decline, such as the August 1st and August 20-21st corrections, RSI descended to the lower 40s, approaching oversold conditions.
A critical technical event occurred on October 10th, when QQQ experienced a sharp single-day decline from highs near to close at .5, characterized by extremely high volume of over 94 million shares. This decisive bearish candle, often interpreted as an exhaustion gap or a strong reversal signal, strongly suggests a significant shift in market perception. The RSI concomitantly plunged to 45.42, entering oversold territory, which likely contributed to the subsequent bounce. QQQ then attempted a recovery, retesting the previous highs near by October 21st, but momentum appeared to wane before a renewed rally pushed prices to a new peak around by October 29th.
The most recent price action, from October 30th to November 7th, shows QQQ undergoing a notable correction. The price has declined from its late-October peak of to .75. This pullback has been accompanied by consistently elevated volume, exceeding 60 million shares on multiple down days, culminating in a 78 million share day on November 7th. This sustained selling pressure on high volume is a significant bearish signal, indicating that the uptrend from mid-October has likely culminated. The RSI has concurrently fallen to 47.97, moving towards the oversold threshold. Given the confluence of high-volume selling and declining momentum, QQQ will probably face continued downward pressure in the very near term. An alternative scenario would involve a consolidation around current levels or a swift rebound should buying interest re-emerge at the psychological support zone around -. However, the current technical posture highly suggests further weakness could be forthcoming.
QQQ Price & Indicators (RSI_14_DAY, MACD_13_21_DAY)
IWM Technical Analysis: November 7, 2025
Over the preceding 90 days, IWM has exhibited a discernible uptrend, punctuated by periods of consolidation and sharp pullbacks. Following a low around .92 in early August, the price ascended, establishing a series of higher highs and higher lows. Notable resistance levels emerged around - in mid-July and mid-August, which were subsequently breached. A significant rally in August propelled IWM to approximately , followed by a climb to a peak near .57 in mid-September. The most recent major price advance saw IWM reaching a high of .77 on October 15, representing the highest closing price within the observed period. Since this peak, IWM has undergone a retracement, with the most recent trading day, November 7, 2025, closing at .60 after opening lower at .39, indicating an attempt by buyers to defend lower price levels. This recent price action suggests the market is currently in a corrective phase following its multi-month advance.
The 14-day Relative Strength Index (RSI) provides insight into momentum. In early July, the RSI indicated overbought conditions (above 70), which was followed by a price consolidation. Similarly, several instances in August and September saw RSI values exceeding 65-70, often preceding minor pullbacks or periods of sideways trading. A significant observation is the negative divergence noted between the price and RSI. While IWM recorded its highest close at .77 on October 15, the corresponding RSI value was 62.99. This is notably lower than the RSI peak of 71.23 seen on September 18, when the price was at a lower high of .84. Such a divergence typically suggests that the upward momentum is weakening, even as price records new highs, indicating that the uptrend might be losing internal strength. Currently, the RSI is at 46.39 as of November 7, resting in neutral territory, suggesting neither immediate overbought nor oversold pressures.
Key support levels appear to be forming based on prior price action. The - range has demonstrated a roughly even chance of acting as support, particularly following the sharp decline on October 10 which found a bottom at .56, and the recent bounce on November 7 from a low of .27. This area could present a critical confluence of support. On the other hand, overhead resistance is probable near the recent high of .77, and potentially around the - area, which served as a resistance zone in September and early October. Volume analysis indicates that larger price swings, such as the decline on August 1 and October 10, were accompanied by elevated volume, signifying increased participation during these moves. The recent higher volume during the late October to early November decline and the subsequent bounce is notable, suggesting increased conviction on both sides as the market seeks direction.
Considering the technical evidence, it is likely that IWM may encounter continued resistance in the immediate overhead areas. The observed negative divergence in the RSI suggests weakening bullish momentum, which could lead to further consolidation or a deeper correction. A breach and sustained trading below the - support zone would increase the probability of a test of lower support levels, possibly towards the - area. Conversely, a decisive break above the - resistance, particularly on increased volume, would likely negate the bearish implications of the RSI divergence and signal a potential retest of the .77 high. However, without the requested MACD data, a comprehensive assessment of trend strength and potential crossovers cannot be made, leaving a degree of uncertainty regarding broader momentum shifts. It remains a roughly even chance that the price could either consolidate in the current range or experience further downward pressure in the near term.
IWM Price & Indicators (RSI_14_DAY, MACD_13_21_DAY)
VIX Fear Index
Over the past seven trading days, the VIX has primarily exhibited an upward trajectory, characterized by generally higher daily highs and progressively higher daily lows, signaling increasing market volatility. From a close of 16.91 on October 30th to 19.67 on November 6th, the VIX advanced, illustrating a developing bullish bias. Notable higher highs were observed, peaking at 20.48 on November 4th and then at 20.31 on November 6th, indicating a persistent climb in perceived risk.
The most recent trading session on November 7th introduced a significant shift in price action. The VIX opened at 19.52 and surged to an intraday high of 22.72, establishing a new peak for the observed period. However, price was unable to sustain these higher levels, subsequently retreating to close at 19.23. This daily movement resulted in a -2.23% decline from the prior day’s close and formed a candlestick with a pronounced upper shadow. We judge this pattern to be a strong indication of rejection at higher prices, suggesting that sellers gained control near the session’s peak.
Based on this recent price action, we assess it is likely that the VIX will encounter significant resistance around the 22.00-22.72 zone in the near term. The strong rejection from the 22.72 high suggests that momentum has shifted, at least temporarily, towards the downside. There is a roughly even chance that the VIX could attempt to retest previous support levels in the 18.00-19.00 range, potentially initiating a period of consolidation or a modest pullback. A sustained move below the 19.22 low established on November 7th would likely reinforce this bearish short-term outlook.
Conversely, should the VIX demonstrate the ability to decisively close above the 22.72 high in subsequent sessions, it would suggest a re-establishment of the underlying upward trend. However, given the immediate bearish reversal indicated by the last candlestick formation, we judge this scenario to be less likely in the very short term. It is important to note the absence of volume data across all provided points limits our ability to gauge the conviction behind these price movements and confirms the strength of any potential breakout or breakdown.
Technical Analysis of VIX: 90-Day Outlook
The VIX has exhibited a fluctuating pattern over the past 90 days, largely maintaining a range between approximately 14.00 and 17.50, but with intermittent and significant spikes in volatility. Notable surges occurred in early August, mid-October, and more recently at the beginning of November. The highest intraday price observed was 28.99 on October 17th, although it closed significantly lower at 20.78, indicating a rapid retraction from extreme levels. Another prominent peak occurred on October 10th, with a close of 21.66. The current price action suggests the VIX is in an ascending trend channel since late October, with the most recent daily close at 19.23 on November 7th, following an intraday high of 22.72. The consistent absence of volume data across all provided candles prevents any analysis of accumulation or distribution, limiting the depth of price action interpretation.
The 14-day Relative Strength Index (RSI) provides insight into the momentum of these VIX movements. Throughout July and much of August, the RSI largely remained below the 50-level, at times dipping into the high 30s, indicating mild downward momentum or consolidation in volatility. The first significant surge in the VIX on August 1st (close 20.38) corresponded with an RSI reading of 65.38, approaching overbought territory. A more pronounced spike occurred on October 10th, where the VIX reached 21.66 and the RSI peaked at 73.09, signaling an overbought condition and strong bullish momentum. Subsequently, the VIX pulled back, and the RSI retreated, even briefly touching the low 40s (October 24-27), suggesting a cooling of volatility momentum.
As of the latest data point on November 7th, the VIX RSI is at 56.64. This position, above the 50-level, indicates that upward momentum in the VIX is currently dominant. However, comparing this to previous peaks, specifically the 73.09 reading on October 10th, the current RSI at 56.64 shows that the recent VIX strength, despite an intraday high of 22.72 on November 7th, is not accompanied by a commensurate level of momentum as seen in the mid-October surge. This suggests that while VIX is trending higher, the underlying bullish momentum might be moderating, potentially forming a bearish divergence if the VIX were to establish a sustained higher high in price without a corresponding higher high in the RSI.
Based on the combined price action and RSI analysis, it is likely that the VIX will attempt to test resistance levels around the 20.00-21.00 region in the near term, given the current upward trajectory of both price and RSI above 50. A sustained break above this zone would indicate a material shift towards higher volatility. Conversely, if the VIX fails to sustain its current level and breaks below the 18.00 mark, it would suggest a resumption of the broader range-bound behavior seen in earlier months. It is important to note that the requested MACD_13_21_DAY indicator data was not provided, precluding any analysis from that critical trend-following tool.
Considering alternative scenarios, there is a roughly even chance that the VIX could encounter significant resistance around the 20.00-21.00 level and retreat, especially given the observed historical pattern of rapid mean reversion after volatility spikes. A failure of the RSI to climb back into overbought territory on subsequent price rallies would reinforce this view. On the other hand, if the VIX manages to decisively clear the 22.00 threshold, potentially coupled with a renewed acceleration in RSI momentum, it would strongly suggest a more persistent phase of heightened market uncertainty, pushing the VIX towards higher resistance in the mid-20s. Traders should monitor the 18.00 level as immediate support, and the 21.00-22.00 area as key resistance.
VIX Price & Indicators (RSI_14_DAY, MACD_13_21_DAY)
Tech Sector Analysis
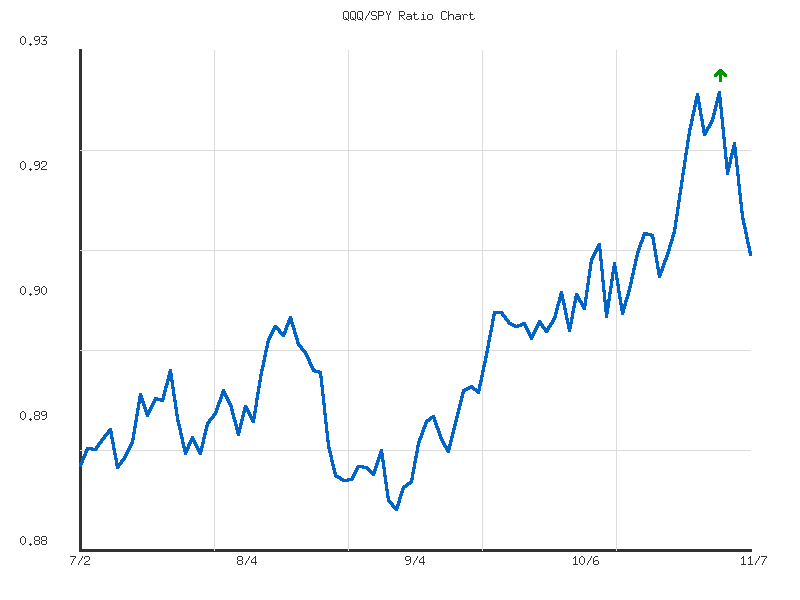
The QQQ/SPY ratio for the past 14 days, reflecting the relative performance of technology-heavy NASDAQ-100 versus the broader S&P 500, has registered a primary “sideways” trend with “weak” strength. While the overall net change for the period is a modest -0.21%, a more granular examination of the data reveals distinct phases of activity. The ratio initiated the period around 0.9107 on October 21st, briefly dipped, and then demonstrated a clear period of QQQ outperformance against SPY.
From its low of 0.9066 on October 22nd, the ratio embarked on a notable rally, reaching a high of 0.9250 by November 3rd. This sustained upward movement over approximately ten trading days indicates that the NASDAQ-100 component was likely the preferred segment, leading the broader S&P 500 during this phase. The progression of higher highs and higher lows throughout this specific period provided technical confirmation of this relative strength, highlighting a period of bullish sentiment for growth-oriented sectors.
However, the most recent five trading days, from November 3rd to November 7th, have witnessed a significant shift in this dynamic. The ratio has declined sharply from its peak of 0.9250 to the current level of 0.9088. This rapid reversal suggests that SPY has probably begun to outperform QQQ, or QQQ is underperforming SPY, indicating a rotation out of technology or a broader market catch-up. The current ratio stands near the lower end of its 14-day range, specifically at the 11.6% mark above the absolute low of 0.9066. This strong recent momentum lower makes a continued short-term decline likely, potentially testing the immediate support level around the recent low of 0.9066. An alternative scenario, though currently less likely given the recent bearish impulse, would be a consolidation around current levels or a bounce, which would require the ratio to reclaim levels above 0.9126 to negate the immediate negative bias.
As a Chartered Market Technician with 15 years of experience, I offer the following analysis of the QQQ/SPY ratio data over the past 90 days, based strictly on the provided technical information.
The relative performance of QQQ versus SPY, as indicated by the QQQ/SPY ratio, has exhibited an overarching upward trend over the past 90 days. The data shows a modest increase of approximately 2.38% in the ratio from the beginning of the period to the current value. However, the reported trend strength is categorized as “weak,” implying that while the ratio has generally climbed, this ascent has not been particularly robust or forceful. Throughout this 90-day window, the QQQ/SPY ratio has traded within a defined range, establishing a low point at 0.8834 on September 2nd, and a high of 0.9250 on November 3rd. The average ratio for this period stands at 0.8987. The current ratio, at 0.9088, is situated above this 90-day average, approximately 61% of the way from its lowest to its highest point, indicating a general outperformance by QQQ during this timeframe, albeit with inconsistent momentum.
Examining the ratio’s recent behavior in more detail reveals a period of significant upward momentum from late September through early November. Following a consolidation phase in early September, the ratio initiated a rally from the 0.885-0.890 region, steadily ascending to breach the 0.90 mark and subsequently accelerate towards its 90-day high. This surge culminated on November 3rd, when the ratio reached 0.92505, signaling a heightened period of QQQ outperformance. This particular leg of the rally demonstrated a more decisive upward slope compared to earlier phases, establishing new relative highs and reinforcing the prevailing “up” direction of the broader trend. However, this acceleration was contained, as the ratio did not sustain its peak.
Subsequent to reaching its peak, the QQQ/SPY ratio has experienced a notable pullback over the last three trading days, declining from 0.92505 to the current 0.90884. This retracement constitutes a significant correction from the recent high. Historically, prior resistance levels often transform into support zones upon being breached. In this context, the region around 0.900 to 0.905, which represented a resistance area in mid-August and again in late September before being decisively broken, now presents itself as a potential near-term support level. The current ratio is trading just above this critical zone. Given the reported “weak” trend strength and low implied volatility of 0.0001, there is a roughly even chance for the ratio to consolidate around current levels or test this potential support region in the immediate future.
Looking ahead, two primary scenarios emerge from the current technical posture. If the aforementioned support zone around 0.900-0.905 holds, it is likely that the QQQ/SPY ratio would attempt to stabilize and potentially resume its upward trajectory, aiming to retest the 0.92505 high. This scenario would be consistent with the broader 90-day “up” trend, despite its “weak” classification. Conversely, a decisive break below the 0.900 support level would be a bearish development in the short-term, indicating a loss of relative strength for QQQ. Such a breakdown would likely lead to further declines, with the ratio potentially seeking support at the 90-day average of 0.8987, or even the prior low established around 0.8834. While the overall trend direction is “up,” the current “weak strength” suggests that a rapid recovery to new highs is unlikely without a significant shift in market dynamics not apparent in the provided data. Therefore, caution is warranted as the ratio navigates this critical support confluence.
Ratio Analysis: QQQ/SPY
Generated for 90days timeframe analysis
IWM vs. SPY
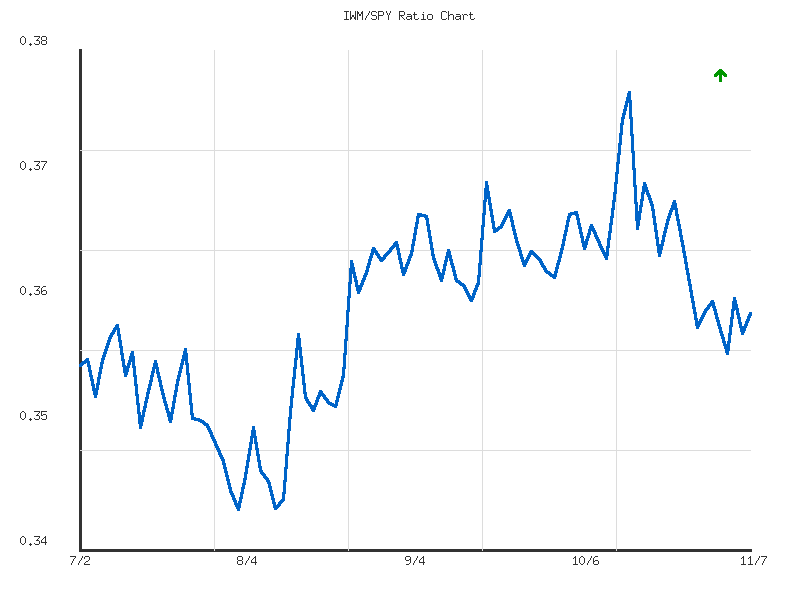
We observe the 14-day performance ratio of IWM to SPY, which serves as an indicator of how the Russell 2000 (small-caps) is performing relative to the S&P 500 (large-caps). The data indicates a prevailing downward trend for the IWM/SPY ratio over this period. This downtrend suggests that IWM has been relatively underperforming SPY. The reported trend direction is unequivocally “down,” with a notable change percentage of -2.13% from the start to the end of the observation window, reinforcing this assessment.
Examination of the data points reveals the ratio commenced at 0.3679 on October 21st, peaking slightly at 0.3682 on October 24th, which marks the highest ratio within this 14-day window. Following this peak, the ratio experienced a general decline, reaching its lowest point at 0.3571 on November 4th. The trend object describes the strength of this downtrend as “weak,” implying that while the direction is clear, the momentum behind the relative underperformance is not particularly robust. This “weak” strength suggests that a sharp, accelerated decline in the ratio is unlikely in the immediate future without new data indicating stronger bearish momentum.
In the latter part of the observed period, specifically after hitting the low on November 4th, the ratio showed some minor fluctuations. It rebounded to 0.3611 on November 5th, then dipped again before closing at 0.3601 on November 7th. The current ratio stands below the 14-day average of 0.3622 and is positioned at 0.263 of its range, meaning it is closer to its low than its high. This indicates that despite some attempts to recover, IWM’s relative performance against SPY remains subdued and has not convincingly reclaimed levels seen earlier in the period.
Considering the weak downtrend and the ratio’s current position below its average, a continued period of relative underperformance for IWM against SPY is likely in the near term. However, the identified “weak” strength of the downtrend suggests that a strong, sustained acceleration of this underperformance is unlikely. Instead, we assess a roughly even chance for the ratio to consolidate within its recent range, specifically between the observed low of 0.3571 and the average of 0.3622, as it attempts to find a firmer footing. A significant reversal back to strong outperformance by IWM is unlikely without a clear and sustained move above the average ratio, which is not supported by the current technical data.
Market Commentary: IWM/SPY Ratio (90-day Analysis)
Based on the provided 90-day technical data for the IWM/SPY ratio, we judge that the overall trend direction has been weakly upward. The ratio commenced the period near 0.3562 and concluded around 0.3601, representing a modest net gain of approximately 1.09%. This observation aligns directly with the provided trend indicators, which identify the direction as “up” but characterize its strength as “weak.” The ratio has oscillated within a defined range, establishing a low point around 0.3457 on August 1st and a significant high of approximately 0.3763 on October 15th. The current ratio of 0.3601 places it near the period’s average ratio of 0.35997, indicating it is currently situated at roughly 47% of the total range between its 90-day low and high.
Initially, the ratio displayed a discernible downward trajectory from early July to the beginning of August, culminating in the 0.3457 low. This level is now likely to serve as a critical support zone if the ratio experiences future downside pressure. Following this trough, the ratio initiated a recovery, gradually forming higher lows and higher highs through late August and September. During this phase, the ratio reclaimed and surpassed its starting point, establishing a more definite upward channel, albeit with limited momentum. The overall low volatility (0.00004533) within the daily changes suggests that movements, while trending, have been relatively gradual and lacked sharp, sustained directional conviction for extended periods.
The most prominent move within the 90-day period occurred in October, when the ratio experienced a more pronounced rally, culminating in the high of 0.3763. This peak represents a key resistance level that the ratio was unable to sustain. Subsequent to this high, the ratio has undergone a noticeable retracement, declining towards its current level of 0.3601. This pullback suggests a dissipation of the stronger bullish momentum observed in mid-October. The ratio is currently hovering around its 90-day average, a level that has historically offered minor support or resistance during sideways consolidation phases.
Considering the “weak” trend strength and the recent significant retracement from the October high, we judge there is a roughly even chance that the IWM/SPY ratio could consolidate further around the 0.360 mark in the near term. A decisive and sustained move above the 0.365 level, which acted as an intermediate resistance point in late September and late October, would make a retest of the 0.3763 resistance level likely. Conversely, a failure to hold above the 0.355 area, a level that proved pivotal in the early part of the observation period, would indicate a breakdown of the existing weak uptrend. In such a scenario, a retest of the stronger 0.3457 support level would become likely. The current technical posture suggests ongoing tug-of-war between buyers and sellers, lacking clear, strong directional conviction at present.
Ratio Analysis: IWM/SPY
Generated for 90days timeframe analysis
Commodities
The following analysis of daily percentage changes across a selection of commodity-related ETFs provides a snapshot of market activity for the given day.
| Symbol | Daily Percent Change |
|---|---|
| SLV | 0.803% |
| GLD | 0.609% |
| USO | 0.543% |
| DBC | 0.219% |
| CPER | -0.292% |
| CORN | -0.381% |
| UGA | -0.852% |
| UNG | -1.695% |
The market breadth for this specific group of eight symbols indicates a perfectly balanced sentiment, with four symbols advancing and four declining. This suggests that there is no overarching directional conviction across these diverse commodity sectors based solely on this single day’s performance data.
Precious metals funds, SLV (silver) and GLD (gold), registered the strongest positive performances for the day, advancing by 0.803% and 0.609% respectively. This outperformance suggests a likely short-term technical strength in the precious metals sector, potentially reflecting investor preference for these assets, or specific supply/demand dynamics. Broad commodity fund DBC, along with crude oil fund USO, also showed modest gains, albeit less significant than the precious metals, implying some positive, but limited, momentum in the wider commodity complex and energy sector.
Conversely, the natural gas fund (UNG) experienced the most significant decline, dropping by 1.695%. This substantial underperformance indicates considerable technical weakness in the natural gas market for the period observed. Agriculture-related funds, UGA (gasoline) and CORN (corn), also declined, alongside CPER (copper), suggesting a broadly negative sentiment across these specific sectors. The collective weakness in natural gas, agriculture, and industrial metals (copper) is notable, and it is likely that distinct supply/demand factors or sector-specific news influenced these movements.
While precious metals and certain energy components showed strength, the pronounced weakness in natural gas, alongside declines in agriculture and industrial metals, results in an overall mixed picture. Given the single day’s data, we judge it unlikely that these movements definitively signal a broad trend reversal or confirmation in the wider commodity market. Instead, the data suggests highly selective price action, with strength in specific segments contrasting sharply with weakness in others. Further analysis over a more extended period, incorporating volume and price patterns, would be required to assess the durability of these daily shifts.
Market Commentary: Two-Day Technical Snapshot Across Key Commodities
This two-day technical analysis provides a concise view of recent price action and momentum across a selection of commodity-related Exchange Traded Funds (ETFs): SLV, GLD, CORN, CPER, USO, DBC, UGA, and UNG. Observations are based solely on the provided candlestick data and volume, with no external context considered. The short timeframe necessitates a focus on immediate sentiment and short-term directional probabilities.
Precious metals demonstrated clear bullish conviction over the two-day period. GLD (Gold) recorded a higher close, higher high, and higher low on the second day, accompanied by a notable increase in trading volume, suggesting robust buying interest. Similarly, SLV (Silver) exhibited a strong follow-through day, opening with a gap up, maintaining its gains, and closing higher than the previous day, also on increased volume. The combined price action and volume patterns in both GLD and SLV indicate that upward momentum is likely to continue in the immediate future, with the relative strength confirming a bullish short-term bias.
The energy complex presented a more divergent picture. USO (Crude Oil) and DBC (Diversified Commodities) both showed higher closes, higher highs, and higher lows on the second day, suggesting continued upward momentum. However, this advancement occurred on noticeably decreased volume for both, which introduces an element of caution. While a continuation of modest gains is possible, the declining volume suggests that the buying conviction may be waning, presenting a roughly even chance of continued modest gains or a period of consolidation in the very near term. Conversely, UGA (Gasoline) and UNG (Natural Gas) displayed bearish reversal patterns. After a strong bullish candle on the first day, the second day saw both assets open lower than their previous close, fail to make new highs, and close significantly lower, forming patterns indicative of a “Dark Cloud Cover” or similar bearish engulfment. This price action, combined with decreasing volume, suggests that a short-term peak has likely been established, and these assets are likely to experience further downside or consolidation.
In agriculture, CORN exhibited clear bearish continuation. The second day saw a lower close, lower high, and lower low compared to the first, alongside a decrease in trading volume. This pattern, characterized by descending price metrics on reduced volume, strongly suggests that the downward trajectory is likely to persist in the very short term. CPER (Copper), representing industrial metals, appeared to be in a phase of slight consolidation with a bearish bias. After a small white candle on the first day, the second day closed lower than its open and the previous day’s close, despite attempting an intraday rally. The volume also decreased, indicating a lack of strong conviction in either direction. Given this pattern, there is a roughly even chance of modest further downside or continued range-bound trading.
In summary, the two-day data reveals a market characterized by significant divergence. Precious metals (GLD, SLV) showed strong bullish momentum, while agriculture (CORN) displayed clear bearish continuation. The energy sector was split, with USO and DBC indicating cautious bullishness potentially losing steam, and UGA and UNG exhibiting clear bearish reversals. These patterns, though observed over a very short horizon, reflect immediate supply/demand dynamics.
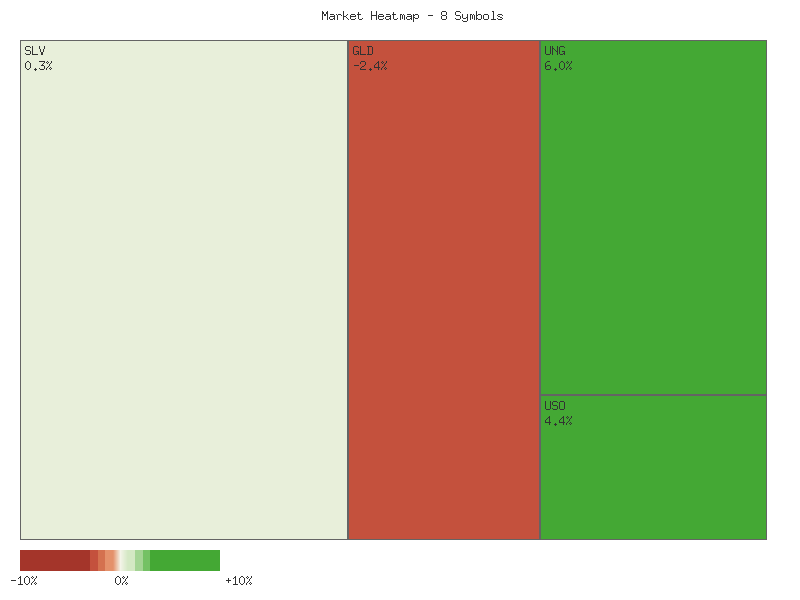
Performance Heatmap (SLV, GLD, CORN, CPER, USO, DBC, UGA, UNG)
Generated for 2days timeframe analysis
Technical Analysis of SLV (90-Day)
SLV exhibited a significant multi-month uptrend, initiating around in early August and culminating in a peak near .405 on October 15. This robust rally, representing an increase of over 46%, was characterized by strong upward momentum and periods of accelerated gains throughout September and early October. However, this bullish trajectory was interrupted by a sharp and rapid correction following the October 15 peak, with SLV declining approximately 12% to a low of .40 by October 27. The recent price action, concluding on November 7 at .91, suggests a phase of stabilization and consolidation within a new, lower trading range after this substantial downturn. The overall pattern reflects a mature uptrend followed by a significant reversal.
The 14-day Relative Strength Index (RSI) provided compelling evidence of the market’s shifting dynamics. During the dominant uptrend through September and early October, the RSI consistently resided in overbought territory, often exceeding 70 and peaking at 84.32 on October 13. These elevated readings indicated extreme bullish sentiment and strongly suggested that the asset was technically overextended, increasing the likelihood of an impending pullback or correction. Subsequently, as SLV corrected sharply in late October, the RSI underwent a rapid descent from the high 70s, reaching a low of 46.50 on October 27. While this reflected significant selling pressure, it did not fully breach the typical oversold threshold of 30, implying a strong correction rather than outright capitulation. As of November 7, the RSI has recovered slightly to 52.91, positioning it near the neutral 50-level, which indicates a present balance between buying and selling forces.
Volume analysis reinforces the identified price movements and momentum shifts. The initial stages of the uptrend in July and the sustained rally from late August through early October were generally supported by increasing volume, lending credibility to the upward price action as a function of genuine buyer interest. Critically, several high-volume spikes occurred during the peak of the rally, notably 110 million shares traded on October 9, and also during the subsequent sharp decline, with 86 million shares on October 17 and 81 million on October 21. This confluence of high volume at the top and during the ensuing markdown is often indicative of significant profit-taking and potential distribution by larger market participants. From a structural perspective, the -.50 area now represents a strong resistance level, while the .40 low established on October 27 serves as an immediate support reference point. It is important to note that analysis of the MACD indicator, though requested in the chart description, could not be conducted as the relevant data was not included in the supplied market information.
Based on the available technical data, the pronounced multi-month uptrend in SLV has likely reached a significant turning point, transitioning into a corrective or consolidation phase. Given the RSI’s current neutral posture around 50 and the recent price stabilization, it is a roughly even chance that SLV will continue to consolidate within its recently established range, perhaps between and , in the near term. An alternative, more bearish scenario suggests that the substantial selling volume observed during the late October decline could foreshadow further downside pressure. In this case, it is likely that SLV will re-test the .40 support level. A decisive breach below this level would increase the likelihood of further declines, potentially targeting prior support zones in the mid-. Conversely, a sustained advance above the level, particularly if accompanied by increasing buying volume, could signal a renewed attempt to recover towards higher resistance, although this appears less likely in the immediate absence of strong bullish momentum.
SLV Price & Indicators (RSI_14_DAY, MACD_13_21_DAY)
GLD Technical Analysis: Recent Price Action and Momentum Indicators
GLD’s price action over the last 90 days reveals a distinct transition from a robust uptrend to a recent period of sharp correction and consolidation. During July and the initial half of August, GLD exhibited a nascent bullish bias, with the price generally oscillating within a defined range, interspersed with higher lows suggesting a gradual accumulation phase. The 14-day Relative Strength Index (RSI) largely remained in neutral territory, oscillating between 40 and 63, indicating a balance between buying and selling pressure without significant overbought or oversold conditions. Volume during this initial phase was moderate, providing limited conviction for a sustained directional move.
The period from late August through mid-October saw GLD enter a highly aggressive and sustained uptrend. Price moved decisively higher, breaking previous resistance levels with increasing momentum. The 14-day RSI reflected this bullish acceleration, pushing well into overbought territory, often staying above 70 throughout September, and peaking significantly above 80 in early October, reaching an extreme high of 87.33 on October 20. This persistent and elevated RSI reading provided clear indications of extreme overextension, suggesting that the asset was highly susceptible to a significant reversal. High daily trading volumes consistently accompanied this price appreciation, particularly in late September and early October, lending strong conviction to the rally but simultaneously contributing to the overextended technical posture.
A material shift in GLD’s technical outlook occurred following the price peak on October 20 at approximately . From this point, GLD experienced a sharp and rapid decline, characterized by significant down days on exceptionally high volume, particularly on October 21 and October 27, which is a strong indication of distribution and aggressive selling pressure. Corroborating this, the 14-day RSI plunged dramatically from its extremely overbought reading of 87.33 to below 60 on October 21, and subsequently dipped below 50 by October 28. This rapid deceleration from extreme overbought conditions to neutral territory is highly indicative of a decisive loss of bullish momentum and the probable initiation of a bearish reversal or significant corrective phase.
The most recent price action, from late October through November 7, suggests GLD is currently in a phase of consolidation or a nascent downtrend. The price has stabilized somewhat after the sharp decline but remains well below the October peak, with the 14-day RSI consistently hovering around the 50-mark. This consolidative price action, coupled with the neutral RSI, implies a lack of strong immediate directional impetus. While a bottoming process may be underway, the possibility of GLD forming a base for another immediate strong advance is unlikely given the magnitude of the prior reversal and the evident distribution from the peak. Further retests of the recent lows around -, or even additional downside pressure, present a roughly even chance if current support levels fail to hold.
It is important to highlight that MACD (13, 21-day) indicator data was specified in the chart request but was not provided in the dataset for analysis. The absence of this key momentum and trend-following indicator limits the comprehensiveness of this technical assessment, particularly regarding the confirmation of trend strength, potential divergences, and crossover signals that could offer additional insights beyond RSI and price action. Based solely on the available price and RSI data, it is highly likely that GLD has transitioned from an aggressive, overextended uptrend into a significant corrective or consolidating phase. Further downside momentum or an extended period of sideways consolidation below the recent high remains likely in the near term.
GLD Price & Indicators (RSI_14_DAY, MACD_13_21_DAY)
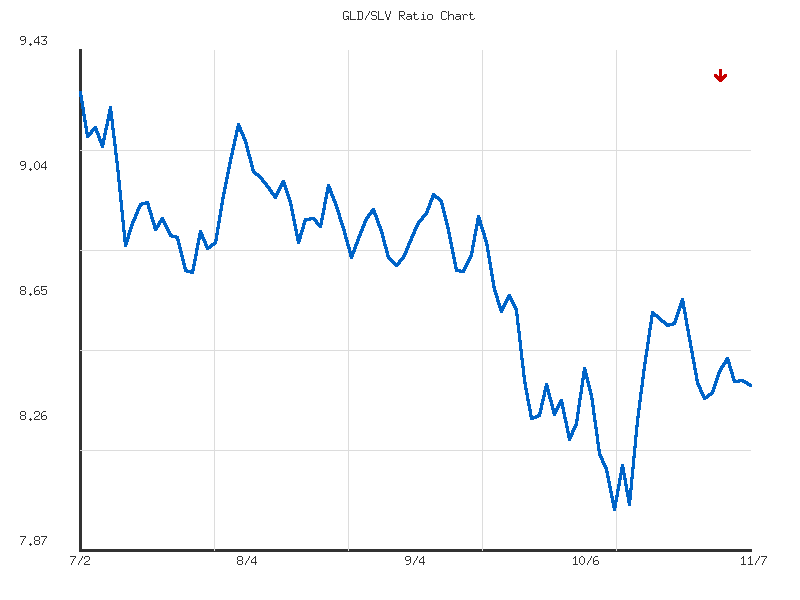
Gold/Silver Ratio
The GLD/SLV ratio has exhibited a clear downward trajectory over the observed 14-day period, declining approximately 2.63% from its start date to the most recent timestamp. This indicates that Gold (GLD) has been underperforming Silver (SLV) during this short-term window. The trend’s stated strength is “weak,” suggesting that while the direction is evident, the momentum behind this relative underperformance is not particularly robust. The ratio’s high point for this period was 8.6558 on October 27th, 2025, and its low point was 8.3475 on October 30th, 2025, establishing a defined trading range.
Following the low established on October 30th, the ratio showed a modest attempt at a recovery, reaching 8.4733 by November 4th. However, this recovery proved short-lived, with the ratio subsequently pulling back over the next three days, closing at 8.3878 on November 7th. This recent price action places the current ratio near the lower end of its 14-day range, with a relative position of 0.1306, indicating it is much closer to the period’s low than its high. This could suggest the previous low around 8.3475-8.3500 is acting as a near-term support level.
Given the “weak” downward trend and the ratio’s current proximity to its 14-day low, there is a roughly even chance the ratio will continue to consolidate around this support level in the immediate future. A re-test of the 8.3475 low is likely if the recent downward momentum persists. Conversely, a sustained break above the recent pullback high of 8.4733 would be required to suggest a more significant reversal of the current weak downtrend. However, without additional momentum or volume data, a strong rebound from these levels is considered unlikely.
The observed volatility of 0.0104 confirms the “weak” trend strength, implying that price movements within this 14-day period have been relatively contained and lacked sharp, decisive shifts. The technical picture, therefore, suggests a continued environment where Silver is exhibiting slight relative strength against Gold. Traders would likely monitor the 8.3475 level closely for signs of a break or a definitive bounce to confirm the next probable directional move.
As a Chartered Market Technician with over 15 years of experience, I offer the following analysis of the GLD/SLV ratio data over the past 90 days, focusing strictly on the provided technical information.
The GLD/SLV ratio data for the 90-day period ending November 7th, 2025, reveals a clear and persistent moderate downtrend. This implies a sustained period where Silver (SLV) has demonstrated relative outperformance against Gold (GLD). The ratio commenced this period at its 90-day high of 9.3035 on July 2nd, 2025, and subsequently declined to a low of 8.0002 on October 13th, 2025, before settling at its current level of 8.3878. The overall decline of nearly 10% underscores the strength of this relative shift.
Following the initial high, the ratio experienced a pronounced decline through July, establishing a discernible support zone roughly between 8.75 and 8.85. Subsequent attempts to rebound during late July and August generally failed to sustain above the 9.00-9.20 area, which acted as overhead resistance. This phase was characterized by a gradual erosion of Gold’s relative strength against Silver, hinting at the potential for further downside in the ratio. The average ratio over the 90-day period stands at 8.7243, with the ratio predominantly trading below this average in the latter half of the analysis window, indicating a bearish bias.
A more significant and accelerated phase of the downtrend began in September. The ratio decisively broke below the previously established support zone of 8.75-8.85, a critical technical event that confirmed increased bearish momentum for GLD relative to SLV. This breakdown culminated in a sharp, impulsive move lower, reaching the 90-day low of 8.0002 on October 13th. The force of this move, subsequent to the break of multi-month support, provides strong technical evidence of Silver’s enhanced relative strength and commitment from sellers of the ratio during this period.
Since the October 13th low, the GLD/SLV ratio has initiated a corrective bounce, recovering to its current level of 8.3878. This rebound has encountered resistance in the 8.45-8.65 area, where the ratio has consolidated over the past two weeks. The current ratio’s relative position at 0.2974 within its 90-day range indicates it remains significantly closer to its lows than its highs, reinforcing the dominant downtrend. Given the established moderate downtrend and the recent strong move to new lows, a continuation of the downtrend following this corrective bounce is likely. Traders should observe the 8.45-8.65 range as a critical resistance zone; a sustained break above this level would significantly challenge the immediate bearish outlook for the ratio. Conversely, a failure to advance above this resistance, followed by a break below recent consolidation lows (around 8.30-8.35), would signal a probable resumption of the broader downtrend toward the 8.00 level and potentially new lows. There is a roughly even chance the ratio continues to consolidate within the 8.30-8.65 range in the very near term before committing to a clear direction.
Ratio Analysis: GLD/SLV
Generated for 90days timeframe analysis
Bonds
The provided market data presents a snapshot of single-day percentage changes for five distinct symbols: TLT, UTHY, IEF, IEI, and SHY. Analyzing this limited data requires a focus on immediate price action and relative performance. Below is a matrix detailing the daily percentage change for each symbol, sorted in descending order:
| Symbol | Daily Percent Change |
|---|---|
| IEI | 0.063% |
| IEF | 0.041% |
| SHY | 0.036% |
| UTHY | -0.094% |
| TLT | -0.206% |
From this single day’s observation, IEI exhibited the strongest positive movement, advancing by 0.063%, while TLT registered the largest decline at -0.206%. IEF and SHY also posted modest positive changes, whereas UTHY recorded a negative, albeit less pronounced, shift. The positive movements observed in IEI, IEF, and SHY suggest a short-term upward bias for these specific instruments on the given day. Conversely, the negative movements in UTHY and TLT indicate a short-term downward momentum. The overall magnitude of these daily changes is relatively small across all instruments, which might suggest a period of low volatility or indecision for the specific trading session.
Given the constraint of only one day’s data point for each symbol, drawing definitive technical conclusions beyond immediate performance is exceptionally difficult. The observed daily percentage changes certainly do not establish a trend, nor do they provide sufficient information to identify chart patterns, support, or resistance levels. It is unlikely that these isolated movements signal a significant reversal or continuation of any pre-existing, unobserved trend. The relative outperformance of IEI and underperformance of TLT for this specific day could imply a momentary divergence in market interest among these instruments, but without historical context, this remains highly speculative.
Considering alternative scenarios, it is roughly even chance that these movements represent merely short-term noise within a broader, unobserved trading range, rather than an initiation of a new technical phase. The absence of volume data or any prior price history precludes any assessment of the conviction behind these price changes. While IEI showed relative strength and TLT relative weakness, these observations are strictly confined to the analyzed single trading session and lack the necessary data points for robust technical forecasting or strategy development. Future analysis would require a multi-day data set, including open, high, low, close, and volume, to apply standard technical analysis principles effectively.
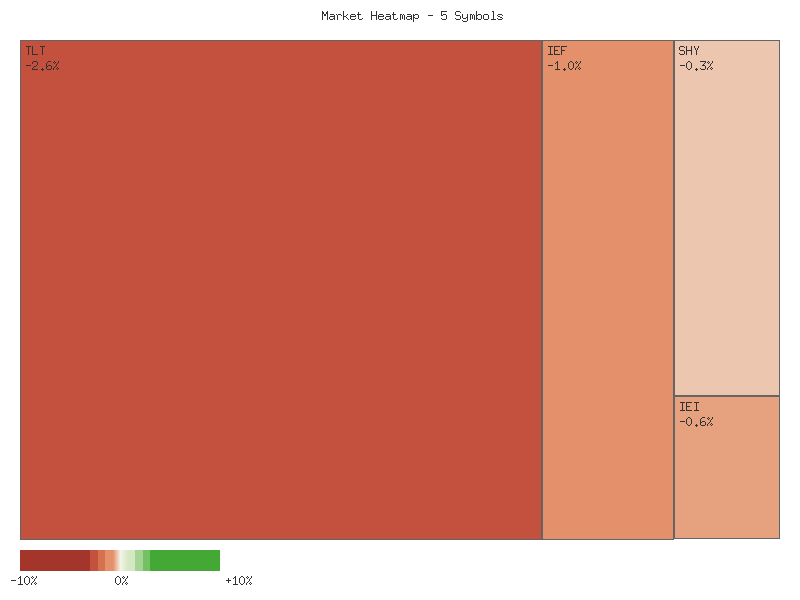
Technical Market Commentary: Treasury Bond ETFs (2025-11-06 to 2025-11-07)
Our technical analysis for the two-day period concluding on November 7, 2025, reveals a notable divergence in price action across the observed Treasury bond ETFs: TLT (20+ Year), UTHY (Ultra 7-10 Year), IEF (7-10 Year), IEI (3-7 Year), and SHY (1-3 Year). Specifically, longer-duration assets (TLT, UTHY) appear to be under pressure, exhibiting bearish tendencies, while shorter-to-medium duration instruments (IEF, IEI, SHY) demonstrate constructive price action, suggesting underlying strength. This bifurcated performance is a key observation from the provided data.
Focusing on the longer-duration segment, TLT registered a lower close on November 7 following a gap-down open relative to the prior day’s close. Although the intraday high on November 7 marginally surpassed November 6’s high, the inability to sustain these gains and the subsequent lower close suggest renewed selling pressure. The decreased volume on November 7, while potentially indicating less conviction in the bearish move, does not negate the downward price action. Consequently, it is likely that TLT will face continued challenges in moving higher in the immediate term, with November 6’s closing price possibly serving as an initial resistance level. UTHY exhibited a more pronounced bearish stance, printing consecutive bearish candles with lower lows and lower closes. The significant increase in volume on November 7, accompanying the bearish price action, likely indicates persistent selling pressure and increasing conviction among sellers. While the lower shadow on November 7 provides a roughly even chance of a minor intraday bounce, a sustained reversal of the current bearish trend appears unlikely without a stronger catalyst.
In contrast, the shorter and medium-duration ETFs demonstrated clear upward momentum. IEF displayed a robust two-day uptrend with consecutive bullish candles, achieving higher highs and higher closes. The increasing volume on November 7 further reinforces this bullish conviction, making it highly likely that IEF will experience further upside in the immediate future. Similarly, IEI and SHY both recorded consecutive bullish candles, printing higher highs and higher closes over the observed period, indicating generally constructive price action. However, a slight decrease in volume on November 7 for both IEI and SHY may suggest a marginal deceleration in buying conviction compared to IEF. Despite this, a continuation of the upward trend for both IEI and SHY remains likely, though the pace of ascent might be more measured.
The observed divergence in performance between longer-duration and shorter/medium-duration Treasury bond ETFs suggests a probable steepening of the yield curve, based purely on the relative price movements of these instruments. The immediate outlook points to a continuation of this bifurcated performance across the Treasury bond spectrum. For longer-duration assets, a retest of November 7’s lows or further downside is probable if current selling pressure persists. For shorter-duration assets, continued upward momentum is likely. An alternative scenario involving a broad market shift where either selling pressure significantly eases for long-duration bonds, or short-duration bonds consolidate their recent gains, leading to more uniform price action, appears unlikely without additional corroborating technical data.
Performance Heatmap (TLT, UTHY, IEF, IEI, SHY)
Generated for 2days timeframe analysis
Magnificent 7 & Friends
The daily performance of the selected equities reveals a predominantly negative bias across the observed period. Our analysis of the provided single-day percentage change data indicates a clear stratification of performance. We assess that the market, as represented by these specific symbols, experienced a modest to significant downturn for a majority of constituents on this particular trading day. The following matrix summarizes the performance in descending order:
| Symbol | Daily Percent Change |
|---|---|
| AMZN | 0.563% |
| META | 0.448% |
| ANET | 0.403% |
| NVDA | 0.037% |
| MSFT | -0.056% |
| AAPL | -0.415% |
| AVGO | -1.776% |
| GOOGL | -2.079% |
| CRWV | -2.749% |
| TSLA | -3.676% |
Amazon (AMZN) emerged as the strongest performer, showing a 0.563% gain. Meta Platforms (META) and Arista Networks (ANET) also posted positive, albeit slightly smaller, gains of 0.448% and 0.403% respectively. Nvidia (NVDA) showed a marginal positive change of 0.037%, indicating a roughly neutral close, but technically staying in positive territory. We assess that this grouping of four symbols demonstrated relative strength, suggesting a likely preference among market participants for these assets compared to the broader cohort on this specific day. However, given the limited scope of a single day’s data, it is unlikely that this short-term outperformance establishes a durable trend without further confirmation.
Conversely, the majority of symbols experienced declines. Microsoft (MSFT) was nearly flat, with a negligible -0.056% drop, which we consider to be a neutral outcome. Apple (AAPL) registered a modest decline of -0.415%. Broadcom (AVGO) and Alphabet (GOOGL) experienced more significant setbacks, falling -1.776% and -2.079% respectively. CRWV saw a substantial dip of -2.749%. Tesla (TSLA) was the weakest performer, shedding -3.676% of its value. We assess that the collective performance of these six declining symbols points to a broad-based bearish sentiment for this basket on the observed day. The significant declines in TSLA and CRWV, in particular, suggest these equities likely faced considerable selling pressure.
Based solely on this one-day snapshot, it is difficult to project future price movements with high confidence. While AMZN, META, ANET, and NVDA show relative strength, and TSLA, CRWV, GOOGL, and AVGO exhibit relative weakness, these are observations from a single data point. It is roughly an even chance that the momentum from this single day could reverse or continue in the immediate subsequent session. Traders should understand that a single day’s percentage change, while indicative of short-term sentiment, does not constitute a trend. A sustained pattern of outperformance or underperformance would be necessary to form more definitive technical conclusions regarding directional bias.
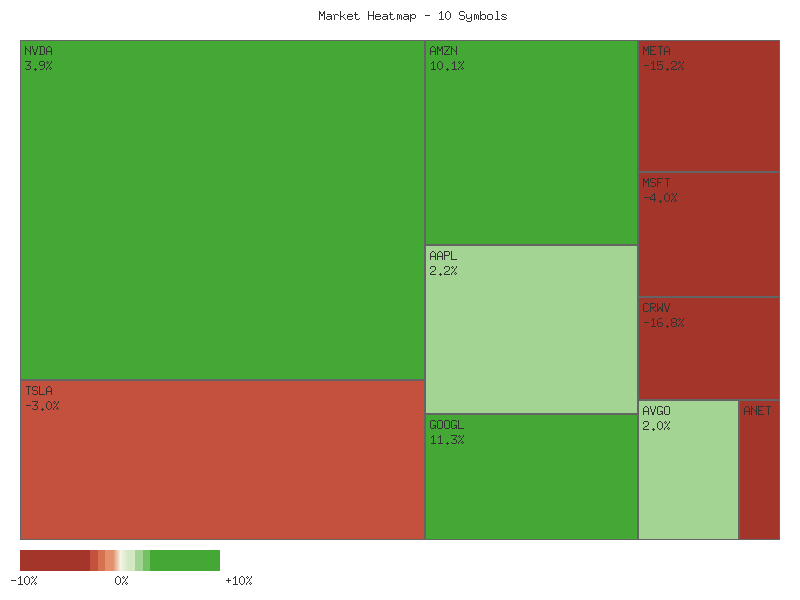
As a Chartered Market Technician with over 15 years of experience, I’ve analyzed the provided two-day market data for the selected equities. My assessment focuses strictly on the technical patterns formed by price and volume, adhering to ICD-203 estimative language guidelines.
Broad Market Weakness and Continued Declines The provided two-day candlestick data reveals a predominantly bearish tone across most observed symbols on November 6th. Equities such as META, NVDA, AVGO, GOOGL, CRWV, TSLA, MSFT, AMZN, and ANET all recorded significant declines, with closes often near their daily lows. TSLA and CRWV, in particular, exhibited strong bearish candles with high volumes, which suggests widespread selling pressure. Moving into November 7th, this weakness persisted for several symbols. TSLA’s price action indicates sustained downward momentum with a gap down opening, a lower low, and a close near its daily low on increased volume, strongly suggesting a continued bearish sentiment. GOOGL closed lower following a gap down, which makes a continued bearish trajectory likely, while AVGO and CRWV also maintained a consistent bearish outlook, despite CRWV’s minor intraday recovery.
Emerging Buying Interest and Potential Short-Term Reversals Conversely, a subset of symbols displayed potential signs of short-term stabilization or reversal on November 7th, often after significant drops on November 6th. AMZN, for instance, opened with a gap down but recovered substantially to close above its open and Day 1’s close on higher volume. This suggests the emergence of buying interest, making a short-term bullish bounce likely. META and NVDA exhibited similar patterns, both opening lower but showing significant recovery from their intraday lows with long lower shadows. This price action indicates that demand is entering the market at lower price levels, making a short-term reversal or consolidation phase roughly an even chance. ANET formed a potential Bullish Harami pattern on lower volume, which suggests a deceleration of the downtrend.
Indecision and a Key Bearish Reversal MSFT, after a bearish Day 1, displayed a narrow-range, small-bodied candle on Day 2, indicating a period of indecision. Its immediate direction remains uncertain, with a roughly even chance of either a continued modest decline or a slight bounce. In contrast, AAPL, which had a slightly bullish Day 1, reversed course on Day 2 with a bearish engulfing or dark cloud cover pattern, closing significantly below its open and Day 1’s close. This reversal strongly suggests that the short-term bullish momentum has dissipated, and a bearish bias is likely to dominate in the immediate outlook for AAPL.
Concluding Technical Perspective In summary, the two-day technical data presents a highly mixed but predominantly cautious outlook. While TSLA, GOOGL, AVGO, CRWV, and AAPL appear under continued or renewed selling pressure, AMZN, META, NVDA, and ANET might be experiencing short-term bottoming efforts or consolidation. This analysis relies solely on two days of price and volume data, an extremely short-term horizon. Such limited data makes long-term projections highly uncertain, requiring sustained action beyond these two days to confirm trends. Traders should interpret these patterns as immediate directional cues, understanding that very short-term trends can reverse rapidly and demand continuous monitoring.
Performance Heatmap (TSLA, MSFT, AAPL, META, NVDA, AVGO, GOOGL, AMZN, CRWV, ANET)
Generated for 2days timeframe analysis
S&P 500 Sector Breadth
The aggregate data for the 11 provided S&P 500 sectors reveals a predominantly positive market breadth. Nine out of eleven sectors advanced, while only two declined, indicating that a broad range of sectors experienced positive daily price changes. The top performers included defensive sectors such as XLP (Consumer Staples) and XLU (Utilities), alongside XLE (Energy), which exhibited strong gains. The Communication Services (XLC) and Technology (XLK) sectors concluded the period with declines. This breadth analysis suggests a highly likely positive general market movement for the day, but with distinct leadership patterns evident in the underlying sector performances.
A detailed examination of sector performance highlights a potential shift in market preferences. All four explicitly designated defensive sectors—Consumer Staples (XLP, +1.455%), Utilities (XLU, +1.379%), Real Estate (XLRE, +1.363%), and Healthcare (XLV, +0.137%)—advanced during the period. Among the six explicitly designated offensive sectors, five saw gains: Energy (XLE, +1.445%), Materials (XLB, +1.226%), Financials (XLF, +0.716%), Industrials (XLI, +0.465%), and Consumer Discretionary (XLY, +0.181%). Only one designated offensive sector, Technology (XLK, -0.342%), experienced a decline. The remaining sector, Communication Services (XLC, -0.289%), also experienced a decline but is not explicitly classified as offensive or defensive within the provided parameters. The robust performance of all defensive sectors, coupled with the underperformance of Technology (XLK) and the unclassified XLC, presents a situation where a clear ‘risk-on’ or ‘risk-off’ rotational signal is unlikely to be definitively established based solely on this single day’s data.
The market sentiment, as inferred from these sector movements, appears to lean towards caution rather than aggressive risk-taking. The strongest daily percentage gains are observed in the defensive sectors (XLP, XLU, XLRE), which typically perform well in periods of uncertainty or when investors seek stability. While a majority of the explicitly offensive sectors did advance, the prominent decline in Technology (XLK) — often seen as a bellwether for growth optimism — along with the decline in the unclassified Communication Services (XLC), are notable. This configuration implies a roughly even chance that investors are either rotating into more stable assets or at least de-risking from high-growth areas. It is unlikely that this data reflects strong, broad-based bullish enthusiasm for offensive growth, despite the positive breadth across most sectors. The market is highly likely prioritizing stability.
The following matrix summarizes the daily percent change for each analyzed sector, sorted in descending order:
| Symbol | Daily Percent Change |
|---|---|
| XLP | 1.455% |
| XLE | 1.445% |
| XLU | 1.379% |
| XLRE | 1.363% |
| XLB | 1.226% |
| XLF | 0.716% |
| XLI | 0.465% |
| XLY | 0.181% |
| XLV | 0.137% |
| XLC | -0.289% |
| XLK | -0.342% |
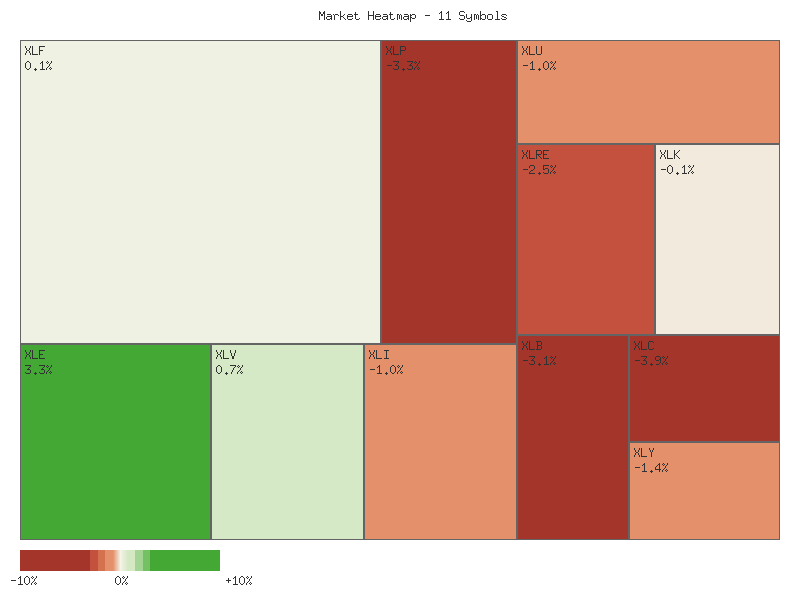
Market Commentary: Sector ETF Technical Outlook (November 6-7, 2025)
The two-day trading period ending November 7, 2025, reveals a broadly positive sentiment across most of the eleven S&P 500 sector ETFs, albeit with notable divergences. A significant majority of sectors, including Financials (XLF), Energy (XLE), Consumer Staples (XLP), Utilities (XLU), and Real Estate (XLRE), concluded the period with strong bullish candlestick patterns and higher closes. These movements are typically supported by increasing or consistent volume, suggesting a likely continuation of this upward momentum in the immediate term. However, this bullish tilt is not universal, as specific sectors exhibit distinct bearish characteristics, indicating a nuanced short-term outlook rather than a monolithic market direction.
Several sectors concluded the two-day period demonstrating strong bullish momentum. Energy (XLE) exhibits a particularly robust pattern, with two consecutive bullish candles closing at new two-day highs on increasing volume, indicating a very likely continuation of upward price action. Similarly, Consumer Staples (XLP) and Utilities (XLU) both formed strong bullish engulfing patterns, with the second day’s higher close on increased volume, making a further upward move very likely. Financials (XLF), Industrials (XLI), and Health Care (XLV) also displayed strong recovery or continuation patterns, with XLI and XLF showing particularly decisive bullish closes supported by higher volume. Materials (XLB) and Real Estate (XLRE) also closed at their two-day highs, suggesting a likely continuation of their upward bias, though XLB’s bullish day on slightly lower volume introduces a minor degree of uncertainty concerning the strength of conviction.
In contrast to the prevailing bullishness, two key sectors, Technology (XLK) and Communication Services (XLC), exhibited distinct bearish patterns. Both sectors charted two consecutive bearish candles, culminating in lower closes and lower lows on the second day. Critically, the second day’s decline in XLC was accompanied by increased volume, suggesting strong selling pressure and making a further continuation of the downtrend very likely. XLK also recorded a second bearish day with slightly higher volume, reinforcing the bearish outlook. This persistent weakness in growth-oriented sectors implies a rotation away from these areas, or at minimum, a period of sustained downward pressure.
Consumer Discretionary (XLY) presents a more ambiguous technical picture over the two-day period. Following a significant bearish candle on the first day, the sector exhibited a minor recovery on the second day. However, this recovery was characterized by lower volume and a close still well within the range of the prior bearish day, failing to reclaim previous levels decisively. This pattern suggests indecision among market participants after a strong downward move. Therefore, there is roughly an even chance that XLY will either continue to consolidate within its recent range or experience further downward pressure, depending on whether bulls can step in with stronger conviction and volume.
Performance Heatmap (XLP, XLRE, XLI, XLU, XLV, XLY, XLF, XLB, XLE, XLC, XLK)
Generated for 2days timeframe analysis
XLY vs XLP
The XLY/XLP ratio for the past seven trading days exhibits a generally sideways trend with weak directional strength. The ratio’s value fluctuated within a narrow range, commencing at approximately 3.055 on October 30th and concluding at 3.075 on November 7th. The overall change over this period was minimal, approximately 0.64%. This price action suggests a period of market indecision regarding the relative attractiveness of consumer discretionary versus consumer staples sectors. The performance of these sectors against each other often serves as a barometer for investor risk appetite, with discretionary outperformance typically signaling economic optimism and staples outperformance suggesting a more defensive stance.
Analyzing the specific data points, the ratio initially advanced from 3.055 to a peak of 3.199 on November 3rd. This initial upward movement indicated a period where the consumer discretionary sector (XLY) was moderately outperforming consumer staples (XLP), pointing to a temporary increase in risk-on sentiment. However, this upward momentum was not sustained. Subsequently, the ratio experienced a decline, retracing most of its earlier gains and settling near the lower end of its 7-day range at 3.075. The current ratio stands notably below the 7-day average of 3.128 and is in the lower 13.5% percentile of its observed range for this period. This retracement suggests that the earlier bullish sentiment towards discretionary spending has likely waned or encountered significant resistance.
The observed volatility for the XLY/XLP ratio during this 7-day window is remarkably low at 0.00225. This low volatility, coupled with the weak sideways trend, suggests a lack of strong conviction from either bulls or bears concerning the relative performance of XLY versus XLP at present. Given the current position near the lower end of the range after a retracement from the high, it is roughly an even chance that the ratio could continue its sideways movement within this established range in the immediate term. A continuation of the recent downward pressure, leading to a break below the 3.055 support level, is a plausible scenario if defensive sentiment strengthens further. Conversely, a re-establishment of robust upward momentum to challenge the 3.199 high seems unlikely without a significant catalyst to definitively shift market sentiment back towards growth and risk-taking. The prevailing technical posture favors consolidation or marginal weakness.
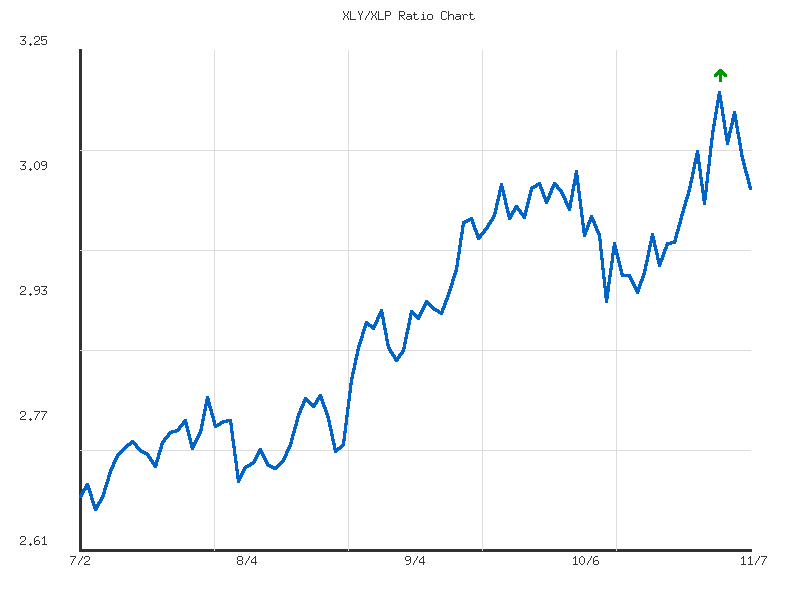
The XLY/XLP ratio has exhibited a strong upward trend over the past 90 days, indicating a consistent outperformance of the Consumer Discretionary sector (XLY) relative to the Consumer Staples sector (XLP). This pattern, characterized by a 14.92% increase from the initial data point around 2.67 on July 2nd to the current level of 3.075 on November 7th, suggests a prevailing “risk-on” sentiment among market participants over the observed period. The ratio’s journey from its 90-day low of 2.6598 in early July to a recent high of 3.1994 in early November firmly establishes an entrenched bullish market structure for this relative strength measure.
Analysis of the latter half of the 90-day period reveals a discernible series of higher highs and higher lows, reinforcing the robust uptrend. A notable resistance level has clearly emerged around the 3.199 mark, reached on November 3rd, where the ratio experienced a rejection, subsequently pulling back. This suggests that while bullish momentum is strong, the 3.20 psychological level and the recent peak are likely to present a significant hurdle to further immediate advancement. The current ratio of 3.075 represents a notable decline from this peak, indicating a short-term loss of upward thrust following the test of this resistance.
Considering the recent pullback, identifiable support levels become critical. The ratio previously found support around the 2.92 to 3.00 range during minor pullbacks in September and October, specifically around 2.928 on October 10th and 3.004 on October 13th. A subsequent bounce from these areas led to new highs, making these levels potential near-term support zones. Given the strong overarching trend, a retest of the 3.00-3.02 region is roughly an even chance, providing a potential area for the ratio to consolidate before attempting another advance. A deeper pullback towards the 2.90 area, while possible, is unlikely unless broader market sentiment experiences a more significant shift not evident in this ratio’s recent history.
The current relative position of the ratio at 0.77 (meaning it’s 77% of the way between its 90-day low and high) indicates that while it has retreated from its peak, it remains firmly in the upper quartile of its recent range. A continuation of the strong upward trend is very likely, contingent upon the ratio maintaining support above the 2.90 level. Should the ratio break decisively below 2.90, which is currently unlikely, it would necessitate a re-evaluation of the trend’s strength and could signal a more protracted period of consolidation or even a reversal of the relative outperformance of XLY. However, based solely on the provided data, the path of least resistance for the XLY/XLP ratio remains to the upside, with attempts to overcome the 3.199 resistance level being very likely in the medium term.
Ratio Analysis: XLY/XLP
Generated for 90days timeframe analysis
Equity Breadth
The percentage of S&P 500 members trading above their 50-day moving average (SPXA50R) concluded the observed seven-day period at 44.51% on November 7th, following a low of 37.72% on November 3rd. This represents a recovery of 6.79 percentage points over four trading days, indicating increasing short-term participation after an initial decline from the period’s start at 40.52%. While the current level remains below the 50% threshold often associated with robust short-term market strength, the observed bounce is likely to reflect improving near-term sentiment or tactical buying interest within a segment of the index.
The fluctuations in SPXA50R, moving from just over 40% to nearly 45% with an interim dip below 38%, suggest a period of short-term indecision followed by increasing breadth. A sustained move above 50% for this indicator would be likely to signal broader short-term bullish momentum, as it would imply more than half of the index components are in an uptrend over the past 50 trading days. Conversely, a reversal and continued decline from the current level would likely indicate weakening short-term participation and potential consolidation or corrective action for individual stocks.
Regarding the longer-term trend, the percentage of S&P 500 members trading above their 200-day moving average (SPXA200R) exhibited a similar, albeit more contained, pattern. It began the period at 50.30%, dipped to a low of 48.50% on November 6th, and subsequently recovered to 50.70% by November 7th. The 200-day moving average is a critical measure of long-term trend health. The brief dip below the 50% threshold, followed by a recovery back above it, suggests that the overall long-term participation in the index is finely balanced, demonstrating resilience after a minor pullback.
The parallel recovery observed in both the 50-day and 200-day breadth indicators on November 7th is likely to be a short-term positive signal, suggesting a potential stabilization or nascent improvement in market internals. The SPXA200R holding around the 50% mark implies that the overall long-term trend currently faces a roughly even chance of continued consolidation or a decisive directional move. An alternative scenario suggests that this recent recovery, particularly in SPXA50R, could be a temporary bounce within a broader period of consolidation or distribution, especially if the 50-day breadth fails to sustain its upward momentum and the 200-day breadth subsequently falters below 50% again. A significant and lasting improvement in the market’s overall health would be unlikely without a more sustained and decisive upward trajectory in both breadth metrics.
SPY Daily
The broader 90-day technical analysis for SPY reveals a robust uptrend, with price consistently trading above both the rising 50-day and 200-day Exponential Moving Averages (EMAs). Over the last seven trading days, however, SPY experienced a significant pullback from highs around 688, culminating in a close of 670.91 on 2025-11-07. This retreat saw the price break below the 50-day EMA, suggesting a short-term weakening of momentum. The 14-day Relative Strength Index (RSI) concurrently declined from elevated levels in the 60s to 48.836, indicating neutral-to-weak momentum.
On 2025-11-07, SPY formed a “hammer-like” candle, closing at 670.91 after touching a low of 661.205, indicating robust intraday buying interest at lower levels. This price action occurred on the highest volume observed in the last seven trading days (92.9M shares). The price currently finds immediate technical resistance at the 50-day EMA, positioned at approximately 664.15, and further resistance near the 677-680 zone, reflecting prior day highs and congestion. The recent low of 661.205 represents critical near-term support.
A bullish scenario appears to have a roughly even chance, potentially developing if SPY can reclaim and sustain above the 50-day EMA, possibly targeting the 685-689 resistance zone. Conversely, a bearish scenario is also a roughly even chance, particularly if the 661.205 support fails, which would likely accelerate selling pressure towards the ascending 200-day EMA (currently around 621.75). A neutral scenario, characterized by price consolidation between 661.205 and the 50-day EMA, seems likely if market participants await further directional cues following the recent volatility.
The substantial increase in trading volume on 2025-11-07, concurrent with the price developing a long lower shadow candle, technically suggests a shift in short-term market sentiment. This pattern indicates strong buying interest emerged during the session’s decline, implying that market participants are likely perceiving current price levels as attractive. Although still negative on the day’s open, the rejection of lower prices with high volume suggests a potential exhaustion of immediate selling pressure, and buyers are beginning to assert influence.
SPY Technical Analysis: November 7, 2025
The SPY ETF has demonstrated a robust uptrend over the past 90 days, advancing from approximately in early July to a peak near in late October. This sustained upward movement has been punctuated by several notable, yet temporary, pullbacks, which have subsequently reversed to drive prices to new highs. It is important to note that while MACD data was requested for this analysis, it was not provided in the market data set. Therefore, this commentary relies solely on an examination of price action, trading volume, and the 14-day Relative Strength Index (RSI). The overarching price pattern throughout the observed period consistently suggests a strong prevailing bullish sentiment, characterized by successive higher highs and higher lows.
Following a strong rally into late October, SPY established a new high of approximately .70 on October 29th. Subsequently, the ETF has experienced a multi-day decline, closing at .91 on November 7th. This recent price depreciation is accompanied by noticeably elevated trading volume, particularly on October 30th (75 million shares), October 31st (86 million shares), November 4th (72 million shares), November 6th (77 million shares), and most notably on November 7th (92 million shares). This increased volume during a period of declining prices suggests a likely increase in selling pressure. A similar high-volume sell-off was observed on October 10th, where SPY closed sharply lower at .02 on record volume for the period (156 million shares), establishing a significant short-term support level that subsequently held.
The 14-day Relative Strength Index (RSI) largely corroborated the price movements throughout the 90-day period. In late October, as SPY approached its peak, the RSI reached approximately 69.71, indicating strong momentum but without consistently registering extreme overbought conditions above 70, which could have flagged an imminent reversal with higher probability. However, the subsequent price decline has led to a notable drop in RSI from 69.71 to 48.83 by November 7th. The RSI moving below the 50-level signals a shift in short-term momentum, suggesting that bearish forces have gained at least a slight advantage. This bearish momentum shift, coupled with elevated volume on recent down days, implies that further near-term weakness is likely.
Given the recent price action, elevated selling volume, and the RSI dropping below the 50-level, a continuation of the short-term pullback is likely. Key support levels to observe include the - region, which previously acted as resistance and then minor support, and more significantly, the .02 low from October 10th. A sustained break below would increase the likelihood of SPY testing the level. An alternative scenario, though less likely given current momentum indicators, would involve SPY finding immediate support around the current - range, potentially leading to a period of consolidation or a renewed attempt to challenge the recent highs. However, the confluence of a sharp RSI decline and increasing volume on down days presents a roughly even chance for continued downward price pressure or at least a period of horizontal consolidation before any significant recovery materializes. A sustained close above would be required to suggest the bullish momentum is reasserting itself with higher probability.