Daily Market Technical Analysis
The market experienced broad-based bearish reversals on November 6th across major indices, including SPY, QQQ, and IWM, confirmed by increased selling volume. This pervasive weakness in market breadth across large, mid, and small-cap segments makes a continuation of downward pressure likely for most indices. The VIX is on a strong upward trajectory, highly likely to maintain its upward bias, signaling escalating market uncertainty. S&P 500 sector breadth significantly weakened, with Technology (XLK) and Consumer Discretionary (XLY) showing highly probable bearish continuations. Conversely, Energy (XLE) and Healthcare (XLV) display likely bullish continuation. Overall, this internal market fragility suggests a probable period of further downward pressure or consolidation, with select energy commodities also showing likely bullish strength.
Market Indices
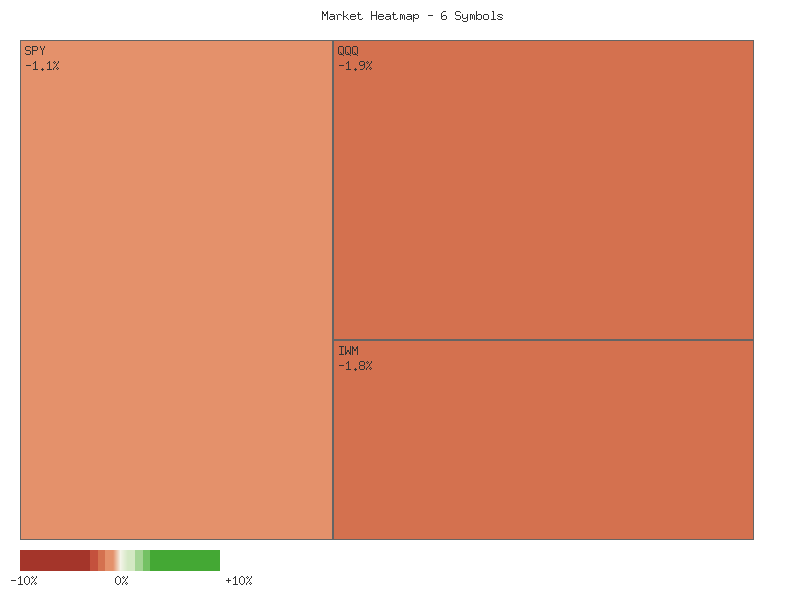
The provided daily percentage change data for a selection of exchange-traded funds (ETFs offers a snapshot of recent market activity. The following matrix illustrates the performance of each symbol, sorted by their daily percent change in descending order:
| Symbol | Daily Percent Change |
|---|---|
| MDY | -0.941% |
| SPY | -1.077% |
| OEF | -1.236% |
| IJR | -1.358% |
| IWM | -1.782% |
| QQQ | -1.861% |
An immediate observation from the data is that all six tracked symbols experienced negative daily percentage changes. This indicates a complete absence of advancing symbols, with all six (100%) declining over the observed period. This pervasive weakness in market breadth across these representative indices—covering large-cap (SPY, OEF, QQQ), mid-cap (MDY), and small-cap (IJR, IWM) segments—strongly suggests a broad market pullback rather than a sector-specific rotation or isolated event. The complete lack of positive performers makes it highly probable that underlying selling pressure was widespread.
Comparing the magnitude of declines, the tech-heavy Nasdaq 100 proxy (QQQ) and the small-cap Russell 2000 proxy (IWM) exhibited the most significant drops, declining by -1.861% and -1.782% respectively. This suggests that these segments were likely leading the market lower. Conversely, the mid-cap S&P 400 proxy (MDY) demonstrated the most relative resilience, with a decline of -0.941%, followed closely by the broad market S&P 500 proxy (SPY) at -1.077%. This divergence in the degree of decline, while all symbols are negative, could imply that segments such as mid-caps might possess a relatively stronger underlying technical posture, or perhaps were less overextended prior to this single-day move.
Given the uniform decline across all observed indices, the immediate outlook is likely for continued downward pressure or at least a period of consolidation, as there is no discernible strength to counter the selling. The relatively weaker performance of QQQ and IWM makes a continuation of their downtrends probable in the short term, assuming no immediate reversal catalysts. While a snap-back rally is always a possibility after a broad-based decline, the overwhelming bearish breadth for this period indicates that any rebound would need to demonstrate significant technical confirmation to negate the current negative momentum. The pervasive red across the board makes it unlikely that this single day’s action represents an isolated dip within a robust uptrend.
Technical Market Commentary: Two-Day Market Reversal
The provided two-day data for a selection of major market indices—SPY, QQQ, IWM, IJR, MDY, and OEF—reveals a notable and cohesive shift in market sentiment. The initial trading day, November 5th, exhibited predominantly bullish price action across all analyzed Exchange Traded Funds (ETFs). However, the subsequent trading day, November 6th, was characterized by a broad-based and decisive bearish reversal. This two-day pattern, transitioning from robust buying pressure to widespread selling, merits careful technical consideration for its potential implications for the near-term market direction.
On November 5th, all six observed ETFs displayed strong bullish characteristics. SPY, QQQ, IWM, IJR, MDY, and OEF each closed significantly above their respective opening prices, frequently settling near their daily highs. This consistent upward movement across market capitalization segments, encompassing large-cap (SPY, QQQ, OEF), mid-cap (MDY), and small-cap (IWM, IJR) exposures, strongly suggested a collective upward momentum driven by sustained buying pressure. The individual volume figures for this day, while varying across instruments, generally supported the conviction behind the price advances for each respective ETF.
The market narrative shifted dramatically on November 6th. For SPY, QQQ, IWM, IJR, and MDY, the day commenced with opens near or slightly below the prior day’s close, but subsequently experienced substantial and persistent selling pressure throughout the session. Each of these five ETFs closed significantly below their open prices and, critically, well below the previous day’s close, forming distinct bearish engulfing or strong bearish reversal candlestick patterns. Notably, this bearish price action was accompanied by a significant increase in trading volume for SPY, QQQ, IWM, IJR, and MDY compared to the prior day. This confluence of increased volume on a decisive down day for these major indices suggests a higher conviction among sellers and lends further technical weight to the bearish reversal. QQQ, in particular, registered a substantial increase in volume alongside a considerable decline from its open to its low and close, indicating significant downward force.
While the majority of indices followed this strong bearish reversal pattern with increased volume, OEF (tracking the S&P 100) presented a slightly different dynamic. OEF also formed a bearish candle, closing below its open and the prior day’s close, indicating a reversal. However, its trading volume decreased on November 6th compared to November 5th. This lower volume on OEF’s bearish move could suggest relatively weaker conviction among sellers in the very large-cap segment it represents, or possibly an exhaustion of sellers in that specific cohort, potentially pointing to some underlying resilience within its constituents compared to the broader market. Nevertheless, the broad-based bearish engulfing patterns seen in the other five indices, coupled with their higher volume, strongly suggest that overall market sentiment has turned negative in the immediate term. It is highly likely that these indices will experience continued downward pressure or at least face significant resistance to any immediate upward movement in the very near future. A short-term bounce from the lows is a roughly even chance, but it would require overcoming the substantial selling pressure and increased volume observed across most indices on November 6th.
Performance Heatmap (SPY, QQQ, IWM, IJR, MDY, OEF)
Generated for 2days timeframe analysis
SPY Technical Analysis: 90-Day Overview with RSI (14-Day)
This analysis of the SPY ETF covers the 90-day period from early July to early November 2025, utilizing candlestick price action and the 14-day Relative Strength Index (RSI). It is important to note that while MACD (13,21-day) was indicated in the chart request, the accompanying data did not include MACD values. Therefore, this analysis will solely rely on the provided price and RSI data, adhering strictly to the available information.
Over the initial two-thirds of the observation period, SPY exhibited a robust upward trend, characterized by a series of higher highs and higher lows. The price ascended from approximately in early July to a peak near by late October. During several stretches, particularly in mid-July, late July, mid-September, and early October, the 14-day RSI entered overbought territory (above 70). Historically, sustained periods above 70 can indicate strong bullish momentum, but they also frequently precede short-term pullbacks or consolidations. Notably, the RSI peaked above 75 in late July, coinciding with a two-day price decline on elevated volume, and again reached 73.70 in late September, before a subsequent minor dip.
A significant shift in momentum occurred on October 10th, when SPY experienced a sharp, high-volume sell-off, dropping from around to . This strong bearish candlestick was accompanied by the 14-day RSI plummeting from approximately 65 to 41.81, momentarily approaching oversold levels. While the market recovered substantially from this event, reaching a new high of .70 by October 29th, the momentum indicators suggest this upward drive may be exhausted. The RSI on October 29th reached 69.71, just shy of overbought, which could indicate a diminishing strength in the rally compared to previous overbought readings at new highs.
The most recent price action, particularly from late October through early November, indicates a probable short-term bearish reversal. Following the peak near on October 29th, SPY has shown clear downward momentum, with several consecutive bearish closes and declining daily highs. The price has retreated to .24 as of November 6th. Concurrently, the 14-day RSI has sharply declined from its late October high, falling to 48.17 on November 6th. This rapid decline in RSI, coupled with strong bearish candlesticks and comparatively high volume on down days (e.g., October 30th and November 4th, 6th), suggests an increasing dominance of sellers.
Considering the current technical posture, there is a likely chance that SPY will experience further downside in the immediate term. The sustained bearish price action since the late October peak, coupled with a declining RSI that has broken below the neutral 50 level, points to a continuation of this recent downward trend. An alternative scenario suggests a roughly even chance for a near-term bounce or consolidation if price approaches the previous support zone established around -, which corresponds to the low from the October 10th sell-off. However, a significant reversal back to bullish momentum would require SPY to reclaim levels above with conviction, which appears unlikely without a period of consolidation or a strong bullish catalyst not evident in the provided data. Traders should observe potential support levels around and , and monitor the RSI for any signs of a bounce from oversold conditions.
SPY Price & Indicators (RSI_14_DAY, MACD_13_21_DAY)
Technical Analysis of QQQ (July-November 2025)
QQQ’s price action over the last 90 days reveals a generally bullish trend, characterized by multiple upward impulses followed by periods of consolidation or modest retracements. From early July, QQQ ascended from the mid-, establishing a clear uptrend that peaked in late October around .01. Key bullish phases were observed in early July, mid-August through mid-September, and a notable accelerated rally in late October. Throughout these uptrends, volume activity often appeared robust on up days and subsided on consolidation days, although some significant downside moves (e.g., Oct 10th and the recent Nov 6th decline) were accompanied by higher volume, suggesting conviction in these movements. The sustained advance indicates strong underlying buying interest for much of the observed period.
The 14-day Relative Strength Index (RSI) provides further insight into the momentum behind these price movements. QQQ’s RSI frequently entered overbought territory (above 70) during strong rallies, specifically in mid-July (peaking at 73.11 on July 28th), late September (reaching 75.35 on September 22nd), and late October (hitting 71.73 on October 29th). These elevated RSI readings typically signaled stretched conditions, making subsequent pullbacks or consolidations likely. For instance, the July and September overbought conditions were followed by price dips and RSI corrections. Notably, while QQQ recorded its highest price point on October 29th (.01), the RSI reading (71.73) was lower than the September 22nd peak (75.35), which could suggest a potential bearish divergence where price made a new high, but momentum was not as strong, increasing the likelihood of an impending reversal.
Following the late October peak, QQQ experienced a sharp and notable decline. From its high, the price retreated significantly, closing at .69 on November 6th. This downward movement from late October was accompanied by a rapid decrease in the 14-day RSI from overbought levels, falling to 49.18 by November 6th. The sharp drop in RSI from above 70 to near the neutral 50-level, combined with notable increases in volume on down days (e.g., Oct 30th with 60M+ volume, Nov 4th with 58M+ volume, Nov 6th with 68M+ volume), collectively signals a loss of bullish momentum and increasing selling pressure. This technical configuration suggests that a short-term correction or a more sustained downtrend is likely underway.
Considering the recent price action and the behavior of the RSI, further downside or a period of consolidation appears highly likely in the immediate term. The bearish divergence observed between the October price high and the RSI peak, coupled with the swift descent from overbought territory on increased volume, suggests that the upward trend has at least temporarily exhausted itself. Support might be found around prior consolidation zones, potentially near the - range established in September. Conversely, a swift rebound to reclaim the recent highs without a preceding consolidation or a strong bullish reversal signal from the RSI (such as entering oversold territory below 30 and then bouncing) is unlikely. Instead, there is a roughly even chance of QQQ finding some temporary support and trading sideways to build a base before a clearer directional move emerges. Due to the absence of the requested MACD (13, 21-day) data in the provided market information, analysis based on this indicator cannot be performed.
QQQ Price & Indicators (RSI_14_DAY, MACD_13_21_DAY)
IWM Technical Analysis: Navigating a Critical Juncture Post-Uptrend
The IWM ETF has exhibited a clear upward trajectory over the observed 90-day period, commencing around the - range in early July and ascending to establish a series of higher highs, culminating near in mid-October. Initial resistance near - in July was eventually overcome, facilitating a significant advance. A notable breakout occurred in late August, propelling prices from a - consolidation zone to new highs near , which was supported by substantial trading volume, thereby establishing a robust intermediate-term bullish structure. Following this, IWM successfully breached the mark in September, ultimately peaking around .77 on October 15th, followed by a re-test high of .21 on October 27th. However, the most recent price action, particularly in late October and early November, indicates a significant retracement from these peaks, with the ETF closing at .36 on November 6th. The previously established support level around , which was tested and held in late September/early October, appears to be under renewed pressure, underscored by a notable increase in selling volume on several recent down days, such as October 29th and November 6th.
Analysis of the 14-day Relative Strength Index (RSI) provides further insights into momentum dynamics. During the initial uptrend in July, the RSI ascended into overbought territory (exceeding 70), signaling strong buying pressure. Subsequent price corrections typically saw the RSI retreat towards the 50-mark, often finding support before another upward move. A critical observation from the data is the development of a clear bearish divergence in October. While IWM’s price established a new high of .77 on October 15th and re-tested this level on October 27th, the corresponding RSI values (62.99 on October 15th and 58.76 on October 27th) were noticeably lower than the September 18th RSI peak of 71.23, which coincided with a price of .84. This pattern, where price makes higher highs but momentum (RSI) makes lower highs, likely indicates a weakening of underlying bullish momentum, increasing the probability of a price correction. The RSI has since declined to 44.49 on November 6th, placing it within the lower half of the neutral zone and trending downwards, approaching oversold conditions.
The confluence of recent price retracement and the bearish RSI divergence suggests that IWM’s established intermediate-term uptrend is at a critical juncture. The recent close at .36 on November 6th, characterized by a decline from its open and moderately high volume, probably reflects continued selling pressure. A sustained break below the immediate support around , which previously served as a consolidation area, would likely confirm a shift towards a short-term bearish bias, potentially leading to further retracement towards the - range, where previous significant support was established in late August and early September. Conversely, if IWM can stabilize and rebound from the current levels, indicating that the area holds as support, it presents a roughly even chance of re-establishing an upward trajectory towards the - resistance levels. However, given the bearish divergence on the RSI and the current downward momentum, a sustained recovery above the recent high without first consolidating or correcting further appears unlikely in the immediate term. Traders are advised to monitor volume patterns closely for indications of exhaustion in selling pressure or renewed buying interest.
IWM Price & Indicators (RSI_14_DAY, MACD_13_21_DAY)
VIX Fear Index
The VIX has exhibited a clear upward trend over the past seven trading days, transitioning from a range bound near 16.90 to significantly higher levels. Initial sessions displayed modest volatility within a contained range, with the close generally increasing from 16.92 on October 29 to 17.44 by October 31. This gradual ascent suggests an underlying shift in market sentiment, with a growing likelihood of increasing market uncertainty as indicated by the VIX’s behavior. The consistent higher closes through the initial part of this period established a foundation for subsequent volatility expansion.
A notable acceleration in upward momentum became evident on November 4, as the VIX closed strongly at 18.87, having reached an intraday high of 20.48. This decisive move pierced prior resistance levels, indicating a likely increase in perceived market risk. While November 5 saw a temporary retracement, with the VIX closing lower at 17.91 after opening higher, suggesting some profit-taking or indecision, the subsequent session on November 6 strongly reasserted the bullish sentiment. The VIX closed at 19.67, representing a significant daily gain of 9.83%, forming a robust bullish candle that notably engulfs the real body of the prior day, confirming renewed buying pressure.
The recent price action indicates that the VIX is in a strong uptrend. The high established on November 4 at 20.48 now functions as the immediate overhead resistance level. Given the powerful close on November 6, it is likely the VIX will attempt to test this level in the near term. Support appears to have been established around the 17.64 to 17.90 zone, marked by the lows of November 5 and 6, which acted as a spring point for the latest upward surge. A failure to penetrate 20.48 might lead to a retest of this support, though this outcome is currently less likely given the strong momentum.
Based on the provided data, the VIX appears to be in an established upward trajectory, driven by strong momentum in the latest session. The pattern of higher highs and higher lows, culminating in a nearly 10% daily increase, strongly suggests a continued expansion in market volatility. It is highly likely the VIX will maintain its upward bias in the immediate future, with a roughly even chance of encountering temporary resistance at the 20.48 level before potentially moving higher. A significant reversal of this trend would require a sustained break below the 17.64 support, an outcome that currently appears unlikely based solely on this dataset.
VIX Technical Analysis: 90-Day Review and Near-Term Outlook
Over the past 90 days, the Cboe Volatility Index (VIX) has demonstrated a recurring pattern characterized by sudden, sharp spikes in implied market volatility, typically followed by a reversion to lower trading ranges. From early July through much of August, the VIX largely oscillated within a relatively calm band between 14.00 and 17.50. However, this period of comparative tranquility was punctuated by notable volatility events, including a significant surge on August 1st that pushed the VIX to a high of 21.90, before receding. This underlying behavior suggests that while the VIX can maintain lower levels, it remains susceptible to rapid increases in response to perceived market risks, leading to an expanded trading range over the observed period.
The most recent price action reveals a fresh surge in volatility. After consolidating around the 15.50-17.00 area in late October, the VIX experienced a strong upward impulse starting on October 10th, reaching a peak of 22.94 by October 14th. While a subsequent retracement saw the index briefly test support near 15.62, the latest data point for November 6th indicates a renewed and significant upward move, with the VIX closing at 19.67 from an open of 18.36, after touching an intraday high of 20.31. This resurgence suggests increasing market anxiety is currently driving the index higher. Key technical levels indicate that the 20.00-22.94 region is likely to serve as a significant resistance zone for this renewed ascent, while the 15.50-16.00 area could act as a support level if a bearish reversal takes hold.
Analysis of the 14-day Relative Strength Index (RSI) corroborates the observed price action. During major VIX spikes, the RSI has consistently entered overbought territory, notably exceeding 65 on August 1st and registering above 73 on October 10th. These instances often signaled periods where VIX was poised for a potential, though not immediate, retracement. Conversely, during periods of VIX consolidation, the RSI typically resided in the neutral range of 40-55, occasionally dipping into the upper 30s. As of November 6th, the RSI has risen from approximately 43 in late October to nearly 58.75. This upward momentum in the RSI, while not yet indicating overbought conditions, strongly suggests increasing bullish sentiment for the VIX.
Considering the combined technical signals, it is likely that the VIX will continue to exhibit elevated levels or attempt to test higher resistance in the immediate term. The ongoing upward momentum, reflected in both recent price action and the climbing RSI, points to escalating market uncertainty. A re-test of the 20.00-22.94 resistance zone is likely if the current buying pressure persists; a sustained breakthrough above these levels would likely signal a more substantial increase in market fear. However, the VIX is known for its propensity for rapid reversals; consequently, there is a roughly even chance that the index could encounter significant resistance at these higher levels and begin to consolidate or retreat back towards the 16.00-17.00 range. It is important to note that the absence of MACD data from the provided set constrains our ability to offer a comprehensive assessment of momentum and trend strength from that perspective, thus introducing a degree of uncertainty regarding the potential duration of the current upward trajectory.
VIX Price & Indicators (RSI_14_DAY, MACD_13_21_DAY)
Tech Sector Analysis
The QQQ/SPY relative strength ratio, observed over the past 14 days, indicates a broadly sideways trend with weak underlying momentum. The ratio commenced at approximately 0.9109 on October 20th, subsequently establishing a short-term low of 0.9066 on October 22nd. This period saw a slight initial relative underperformance by the NASDAQ-100 compared to the S&P 500. The overall change percentage across the period is a minimal 0.1827%, reinforcing the technical assessment of a weak, consolidative pattern rather than a decisive directional move. The extreme low volatility of 0.000035 suggests that significant shifts in relative performance are unlikely in the very immediate term without a catalyst.
Following the October 22nd low, the QQQ/SPY ratio demonstrated a period of clear relative outperformance for the technology-heavy index, steadily climbing to reach a peak of 0.9250 on November 3rd. This sustained upward trajectory indicated that QQQ was advancing at a faster pace, or declining at a slower pace, than the broader SPY for much of this interval. However, this period of relative strength proved transient. In the final three observed data points, the ratio experienced a noticeable reversal, declining from its high to finish at 0.9126 on November 6th. This pullback suggests that the positive momentum for QQQ relative to SPY has dissipated.
The current ratio of 0.9126 sits below the 14-day average of 0.9163 and is significantly closer to the low of 0.9066 than the high of 0.9250, as indicated by its relative position of 0.3239 within the range. This positioning makes it likely that QQQ will continue to exhibit relative underperformance or at best, consolidate, in the immediate very near term. The previous peak around 0.9250 now likely acts as a resistance level, while the October 22nd low of 0.9066 could serve as a near-term support if the relative weakness persists. A retest of the lower bound of this sideways range is plausible if selling pressure intensifies.
While the technical indicators suggest recent relative weakness, it is important to consider alternative scenarios. There is a roughly even chance that the recent decline represents merely a natural pullback within the overall sideways consolidation, rather than the initiation of a sustained period of QQQ underperformance. Should the ratio find support around its current levels or slightly lower, a subsequent attempt to re-engage with the upper end of the established range, perhaps towards 0.9160 (the average) or 0.9200, remains conceivable. However, without fresh data confirming a renewed upward thrust, the path of least resistance in the immediate future appears to lean towards continued consolidation or slight relative weakness for QQQ against SPY.
Technical Commentary: QQQ/SPY Relative Strength (90-Day)
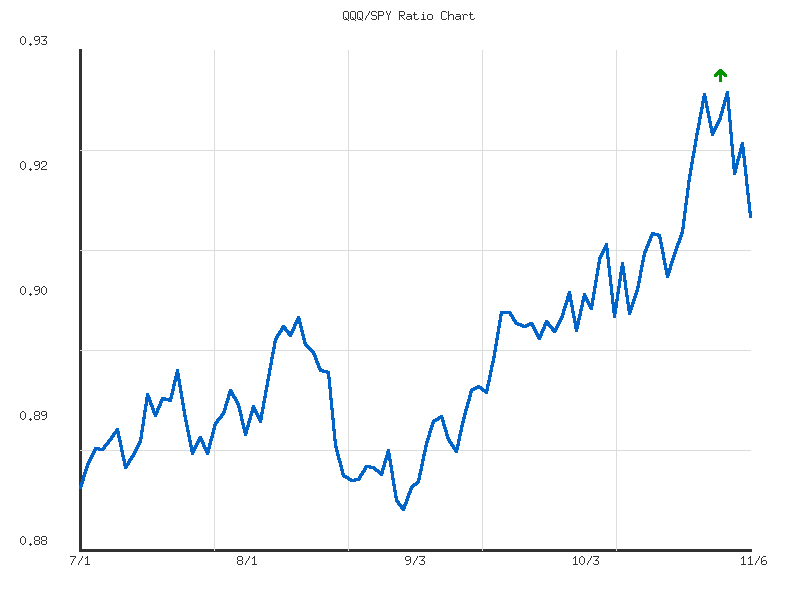
The QQQ/SPY ratio, observed over the past 90 days, demonstrates a clear upward trend, indicating sustained outperformance of the Nasdaq 100-tracking QQQ relative to the broader S&P 500-tracking SPY. Starting near 0.8856 in early July 2025, the ratio has ascended to 0.9126 by early November, marking a moderate increase of approximately 3.05% over the period. This consistent upward trajectory, characterized by relatively low volatility (0.0001029), suggests a methodical rather than erratic shift in market leadership towards growth-oriented sectors. The overall pattern depicts QQQ exhibiting stronger price appreciation or more resilient depreciation compared to SPY, a technical observation of market sentiment favoring the technology and growth heavy index.
Throughout the analysis period, distinct support and resistance levels have emerged. The ratio found initial strong support in the 0.883-0.890 range during July and early September, notably bottoming at 0.8834 on September 2nd. This level is likely to serve as a significant historical reference point should a deeper retracement occur. A key breakout occurred as the ratio advanced beyond the 0.890 threshold in August, which subsequently acted as a base for further ascent. The 0.900 level also developed into a critical psychological and technical support, with the ratio consolidating above it since late September, after an initial breach in August. On the upside, the ratio recently established a new high resistance level near 0.9250 on November 3rd.
Following its peak at 0.9250 on November 3rd, the QQQ/SPY ratio has experienced a noticeable pullback, declining to 0.9126 by November 6th. This retracement, approximately 1.35% from the high, indicates that the ratio is now positioned roughly 70% of the way from its 90-day low to its 90-day high. The relatively rapid decline from the recent peak suggests a likely profit-taking event or a temporary shift in relative strength. It is a roughly even chance that this decline will find support around the 0.900-0.910 zone, which acted as a resistance-turned-support level during its earlier ascent. A failure to hold these levels would make a deeper test of the mid-0.890s support levels likely.
Given the established moderate uptrend and the recent pullback from a multi-month high, we judge it likely that the QQQ/SPY ratio will attempt to re-establish upward momentum. The immediate challenge for the ratio is to consolidate above the 0.910 level. Should it successfully hold this area, a renewed push towards the 0.9250 resistance is likely in the near term. Alternatively, a sustained break below the 0.910 level would suggest that the recent high was more durable resistance, making a further decline towards the 0.900 support level or even the 0.895 level a roughly even chance. The overall trend remains positive, but the recent rejection from the 0.9250 level warrants caution, indicating that sustained outperformance may require renewed buying interest to overcome this new resistance.
Ratio Analysis: QQQ/SPY
Generated for 90days timeframe analysis
IWM vs. SPY
The IWM/SPY ratio, which provides insight into the relative performance of the Russell 2000 (small-cap) against the S&P 500 (large-cap), has exhibited a weak downward trend over the past 14 trading days. This trajectory indicates that small-cap equities have, on balance, underperformed their large-cap counterparts during this period. The ratio commenced at approximately 0.3697 on October 20th and concluded near 0.3586 on November 6th, marking a decline of nearly 3%. This consistent, albeit not rapid, shift suggests a preference for larger capitalization stocks within the market.
Analysis of the individual data points reveals the ratio experienced an initial decline from its high of 0.36967 on October 20th to 0.36439 by October 22nd. A subsequent, brief rebound lifted the ratio to 0.36829 by October 24th before a more sustained period of decline commenced. The ratio reached its 14-day low of 0.35718 on November 4th. The most recent observation places the ratio at approximately 0.3586, which is notably close to the lowest point of its recent range. This current relative position, at 0.1148 of the range from low to high, strongly suggests IWM is performing at the lower end of its short-term relative strength against SPY.
Given the established weak downward trend and the current ratio’s proximity to its 14-day low, it is likely that the relative underperformance of IWM against SPY will persist in the immediate short term. The observable patterns within this limited dataset do not suggest a strong impending reversal, favoring a continuation of the current trajectory. However, the “weak” strength designation for the trend implies that the momentum for this underperformance is not overwhelming, thus significant accelerations in either direction are unlikely without new market catalysts not reflected in this data.
An alternative scenario exists where the ratio finds support near its recent low of 0.35718. There is a roughly even chance that the weak downward trend could decelerate or pause around these levels, potentially leading to a period of consolidation or a modest rebound. This possibility is supported by the relatively low volatility metric (0.0000155) observed over the period, which indicates that daily fluctuations have been subdued. Such low volatility might contribute to a more gradual evolution of the trend or a more extended phase of sideways movement if support proves durable.
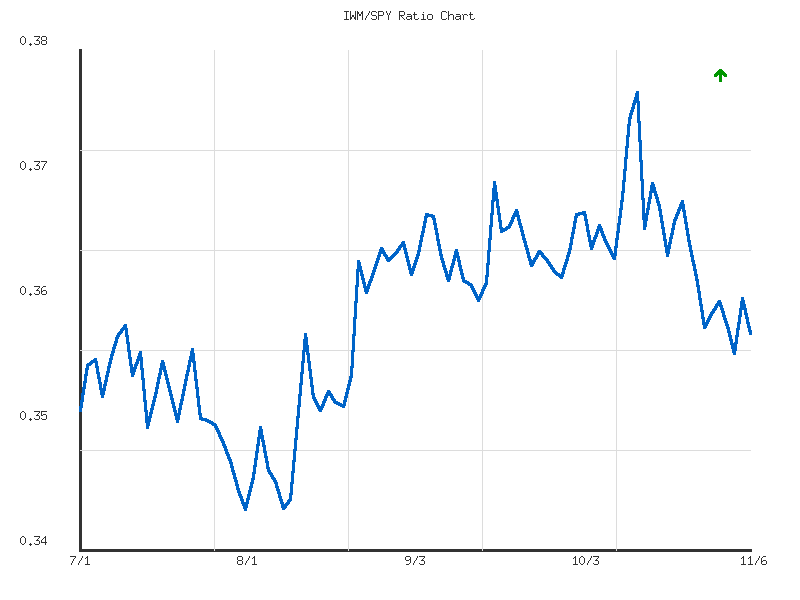
As a Chartered Market Technician with over 15 years of experience, we analyze the provided 90-day market data for the IWM/SPY ratio. This ratio fundamentally measures the relative performance of small-cap stocks (Russell 2000, represented by IWM) against large-cap stocks (S&P 500, represented by SPY). An increasing ratio indicates small-cap outperformance, while a decreasing ratio signifies large-cap outperformance.
Over the entire 90-day period, the data indicates an overall weak upward trend in the ratio, with a net change of approximately 1.6%. However, a closer examination reveals distinct phases of price action. During the initial month of July, the ratio experienced a general decline from approximately 0.353 to a low of 0.3456 by early August. This period likely indicates an environment where large-cap stocks were outperforming small-caps, suggesting a rotation towards larger, more stable market segments. The ratio found a significant base around the 0.3456 level, which appears to have acted as initial support.
Following the early August low, the IWM/SPY ratio initiated a robust rally, signifying a period of strong outperformance by small-cap stocks relative to large-caps. This upward momentum propelled the ratio from its August lows to establish a new 90-day high of 0.3763 on October 15. This peak likely represents a significant resistance level. The ascent was characterized by several higher highs and higher lows, breaking through intermediate resistance levels, such as the approximately 0.365 level seen in late August and the 0.370 level observed in mid-September. The strength of this rally suggests a strong shift in market sentiment towards riskier assets during that timeframe, with small-caps attracting significant capital relative to their larger counterparts.
Subsequent to the October 15 peak at 0.3763, the IWM/SPY ratio has experienced a notable reversal, trending downwards to its current value of 0.3586 as of November 6. This decline involved the ratio falling below its 90-day average of 0.35989, a technical development that often implies a shift in short-term sentiment. The most recent daily price action indicates that the ratio has failed to hold previous intermediate support levels established during the earlier rally. We assess that the ratio is likely to encounter support around the 0.358-0.356 region, which corresponds to consolidation levels observed in mid-August. A breach below this zone would likely intensify the current underperformance of IWM relative to SPY.
Considering the recent downtrend from the October high, we assess a roughly even chance of the ratio stabilizing at or above the 0.356 support area versus a continued decline towards the 0.351-0.352 region, which previously served as support in early July. A sustained move above the 0.360 level would likely alleviate immediate bearish pressure and indicate a potential re-stabilization or a shallow retracement. Conversely, a decisive break below 0.356 would unlikely be sustained without testing the deeper support around 0.345-0.347, marking a more significant shift to small-cap underperformance. The overall weak upward trend from the past 90 days indicates that while IWM has shown periods of strength, its ability to maintain sustained outperformance against SPY appears challenged in the current short-term horizon.
Ratio Analysis: IWM/SPY
Generated for 90days timeframe analysis
Commodities
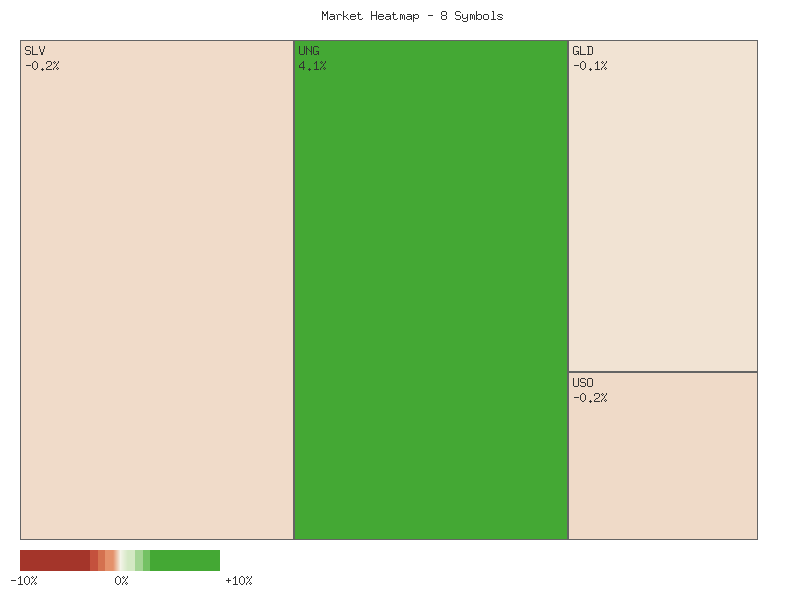
Here is an analysis of the provided market data:
| Symbol | Daily Percent Change |
|---|---|
| UNG | 4.075% |
| UGA | 2.711% |
| DBC | 0.110% |
| GLD | -0.123% |
| SLV | -0.183% |
| USO | -0.190% |
| CPER | -0.291% |
| CORN | -1.270% |
Analysis of the provided daily percentage changes for these commodity-related symbols indicates a mixed session with a slight bearish bias in market breadth. Of the eight symbols analyzed, three advanced while five declined, suggesting that a majority of these specific commodity ETFs experienced negative price action for the day. This distribution implies that buying pressure was concentrated in a minority of these assets, while selling pressure was more prevalent across the broader selection.
The most significant movements were observed in UNG (Natural Gas) and UGA (Gasoline), which recorded substantial advances of 4.075% and 2.711%, respectively. These represent strong, outlier performance within the given data set and strongly suggest concentrated bullish momentum in these specific energy commodities. This pronounced outperformance by a select few assets, amidst a generally declining group, indicates a highly selective market environment for this particular basket of commodities.
Conversely, CORN exhibited the most notable decline, falling by -1.270%, suggesting significant selling pressure in that agricultural commodity. The remaining declining symbols—CPER (Copper), USO (Crude Oil), SLV (Silver), and GLD (Gold)—showed more modest losses, ranging from -0.123% to -0.291%. These relatively small declines for these assets indicate either light selling pressure or a period of consolidation, where price action was largely contained. The PowerShares DB Commodity Index Tracking Fund (DBC) posted a marginal gain of 0.110%, aligning with the mixed sentiment observed across the broader group.
Considering the entirety of this limited dataset, while there were strong advances in natural gas and gasoline, the overall market breadth for these particular commodities leaned negative, with five out of eight symbols closing lower. This suggests a roughly even chance that sentiment for the broader commodity complex, as represented by this group, could be challenged in the immediate term, despite the clear strength in energy. However, given the limited scope of the data (single day, small number of symbols), it is difficult to definitively project broader trends; the observed action primarily highlights commodity-specific performance divergences rather than a unified market direction.
Technical Market Commentary: Short-Term Commodity ETF Analysis
Over the past two trading sessions, the commodity ETF landscape has presented a mixed but generally decelerating picture, with clear signs of divergence in short-term momentum across various assets. Our technical analysis, based purely on the provided candlestick patterns and volume data, indicates that while some energy-related instruments exhibit robust bullish signals, several precious metals and agricultural commodities are displaying patterns suggestive of impending bearishness or continued downward pressure.
A notable bullish development is observed in UNG (United States Natural Gas Fund). After an initial bearish session on Day 1, which showed significant selling pressure but also a long lower wick, Day 2 produced a strong bullish engulfing candle on substantially increased volume. This pattern, coupled with a gap-up opening, suggests a high likelihood of a short-term bullish reversal and continuation of upward momentum. Similarly, UGA (United States Gasoline Fund) demonstrates strong bullish conviction. Day 2 saw a significant gap-up and a robust close near its high, following a moderately bullish Day 1. While the reduced volume on Day 2 might raise questions about the conviction behind the move, the price action itself strongly suggests a likely continuation of the upward trend in the immediate future.
Conversely, a more bearish sentiment appears to be developing across several other key commodities. CORN (Teucrium Corn Fund) printed a distinct bearish engulfing pattern on Day 2, completely erasing the gains from a very bullish Day 1. This reversal, accompanied by slightly increased volume, makes a short-term downward movement highly likely. The precious metals complex, represented by SLV (iShares Silver Trust) and GLD (SPDR Gold Shares), also shows signs of weakness. Both experienced attempts to push higher on Day 2 but ultimately closed lower than their opens and Day 1’s closes, forming patterns resembling Dark Cloud Cover or bearish engulfing, especially for GLD. This indicates a roughly even chance of further downside or at least a period of consolidation.
Further bearish signals are evident in CPER (United States Copper Index Fund) and USO (United States Oil Fund). CPER, after a bullish Day 1, formed a bearish harami pattern on Day 2 with significantly decreased volume. This suggests a likely pause in the upward momentum, with a roughly even chance of a short-term reversal if buying interest does not return swiftly. USO, on the other hand, exhibited persistent bearishness over both days, with Day 1 seeing rejection from highs and Day 2 extending lower with increased volume. Although Day 2 closed slightly above its open, indicating some intraday buying at the lows, the overall two-day pattern suggests continued selling pressure and a high likelihood of further price depreciation.
Finally, DBC (Invesco DB Commodity Index Tracking Fund) presents a more indecisive picture. Both days show narrow trading ranges. Day 1 closed slightly lower than its open, while Day 2 closed slightly higher than its open but with a lower high and lower low than Day 1. While Day 2’s slightly higher close on increased volume could be interpreted as minor buying interest, the constricted range and overlapping candles suggest a roughly even chance of either minor upward continuation or a continued period of consolidation, lacking clear directional conviction based on these two days alone. However, an alternative scenario might suggest that increased volume on a relatively flat close indicates accumulation or distribution without a clear breakout.
Performance Heatmap (SLV, GLD, CORN, CPER, USO, DBC, UGA, UNG)
Generated for 2days timeframe analysis
CMT Technical Analysis for SLV (90-day period ending 2025-11-06)
The provided 90-day market data for SLV reveals a substantial uptrend from early July into mid-October 2025, followed by a significant retracement. Price action began the period around .73 and ascended to a peak of .33 by October 15th, representing a gain of approximately 47%. This bullish movement was often accompanied by increasing volume, particularly during strong upward thrusts like those seen on July 10-11, and September 25-29, suggesting robust buying interest. However, a sharp correction initiated around October 17th, with prices declining substantially from the peak, reaching a low around .40 by October 27th. The most recent daily candles suggest a period of consolidation or an attempt at stabilizing, with SLV trading between roughly .50 and .50, closing at .56 on November 6th.
Analysis of the 14-day Relative Strength Index (RSI) largely corroborated the price action. Throughout the strong uptrend from July to mid-October, RSI frequently entered overbought territory (above 70), peaking at 84.32 on October 13th. Such sustained readings indicate strong bullish momentum and persistent buying pressure during the ascent. Subsequent to the October 15th price peak, the RSI experienced a sharp decline, falling from highly overbought levels to as low as 46.51 on October 27th. This descent into the mid-40s likely reflected a significant loss of bullish momentum and potentially hinted at an oversold condition, especially after such a rapid prior advance.
Following the sharp decline, SLV’s RSI has rebounded somewhat, oscillating in the 47-55 range and closing at 51.18 on November 6th. This rebound from the lower 40s suggests that the immediate selling pressure may have abated, and the market is currently in a more neutral state, rather than being definitively oversold or overbought. The current RSI reading indicates that there is roughly an even chance of either a continued rebound or a further period of consolidation before a clearer trend emerges. A re-entry into overbought territory would be required to signal a resumption of the strong prior uptrend, while a decline below 30 would indicate significant renewed bearish momentum.
Considering the recent price and RSI behavior, SLV is presently attempting to find a new equilibrium after its significant rally and subsequent correction. The stock has demonstrated short-term resilience in holding above the .40 support established on October 27th. A move above the recent high of .56 (October 8th) would likely strengthen the case for a continued short-term rebound towards previous resistance levels around .50 to .00. Conversely, a decisive break below .40 would suggest that the bearish momentum could continue, making a retest of lower support levels, potentially around .00, likely. It is important to note that MACD data was requested in the chart title but was not provided, therefore, it could not be incorporated into this technical assessment.
SLV Price & Indicators (RSI_14_DAY, MACD_13_21_DAY)
GLD Technical Analysis: Post-Rally Correction and Consolidation
GLD’s 90-day price action reveals a dynamic period characterized by a robust mid-term uptrend followed by a significant correction and subsequent consolidation. From early July to mid-August, GLD exhibited largely sideways movement, fluctuating within a defined range, primarily between and . Volume during this initial phase was relatively moderate. A notable shift in sentiment occurred from late August, as GLD decisively broke out of this consolidation, initiating a strong, sustained rally that carried the price significantly higher, accompanied by increasing volume. This multi-week bullish impulse established a new higher trading regime for the asset.
The upward trajectory from late August culminated in a peak on October 20th at .15, marking a substantial appreciation in value over approximately two months. Throughout this powerful rally, the 14-day Relative Strength Index (RSI) consistently confirmed the bullish momentum, remaining largely in overbought territory (above 70) for extended periods in September and October. On October 20th, the RSI registered an extremely elevated reading of 87.33, signaling extended and potentially exhausted bullish conditions. Several days leading up to and including the peak observed high trading volumes, lending conviction to the strong price moves, but also potentially indicating capitulation buying near the top.
Following the October 20th peak, GLD experienced a sharp and rapid reversal. The price declined precipitously, with a significant gap down on October 21st, accompanied by exceptionally high volume (over 53 million shares). This confluence of a sharp price drop, high volume, and a prior overbought RSI reading strongly suggests a decisive shift in market dynamics and the likelihood of an exhaustion gap or island reversal pattern. The subsequent price action saw GLD continue its descent, ultimately finding some intermediate support in the range of - by late October and early November. The RSI, mirroring the price decline, rapidly moved out of overbought territory and has since stabilized around the neutral 50-mark, indicating a balance between buying and selling pressure without yet reaching oversold conditions.
As of early November, GLD appears to be consolidating after the sharp downturn. The price has established near-term support levels around -, observed on October 28th, October 29th, and November 4th. Overhead, prior trading ranges and minor peaks from the earlier rally, particularly around and (mid-October highs), are likely to act as immediate resistance levels. Given the stabilization of the RSI near 50 and the formation of a short-term trading range, there is a roughly even chance that GLD could continue to consolidate between approximately and in the immediate term. An alternative scenario involves a potential further downward retest of the support if buying interest wanes, which would likely open the door for a move towards the - range. Conversely, a sustained breakout above , supported by an increase in volume and a rising RSI, would suggest a likely re-establishment of short-term bullish sentiment.
GLD Price & Indicators (RSI_14_DAY, MACD_13_21_DAY)
Gold/Silver Ratio
The RATIO:GLD/SLV over the past 14 days exhibits a clearly defined sideways trend, characterized by weak strength. The ratio has fluctuated within a range spanning from a low of 8.348 on October 30th to a high of 8.656 on October 27th. The current ratio of 8.404 resides near the lower end of this observed range, at approximately 18% of its 14-day high-low spectrum. This suggests recent price action has favored SLV relative to GLD, bringing the ratio back towards its established support region. The overall change percentage of -0.52% over the period reinforces this slight downward bias within the broader consolidation.
Technical analysis of the ratio’s action indicates an immediate support level around the 8.348-8.398 region, which has been tested and held on multiple occasions. Resistance appears to be forming in the 8.60-8.65 zone, which capped the ratio’s upward movement. Given the weak trend strength and the current proximity to support, a continued consolidation within these established bounds is roughly an even chance. However, should the immediate support around 8.35 fail on a sustained basis, a further decline in the ratio, indicating a period of SLV outperformance, would become likely.
Conversely, for the ratio to exhibit renewed strength and suggest GLD outperformance, a decisive move above the 14-day average ratio of 8.487 would be necessary. Such a breakout would make a retest of the upper resistance zone around 8.65 likely. Without a clear and sustained breakout from this established sideways channel, significant directional conviction for either GLD or SLV relative to the other is unlikely to emerge. The relatively low volatility observed (0.0098) reinforces the expectation of continued range-bound behavior in the near term, with minor fluctuations favoring neither asset significantly until a more robust pattern develops.
GLD/SLV Ratio: 90-Day Technical Analysis Commentary
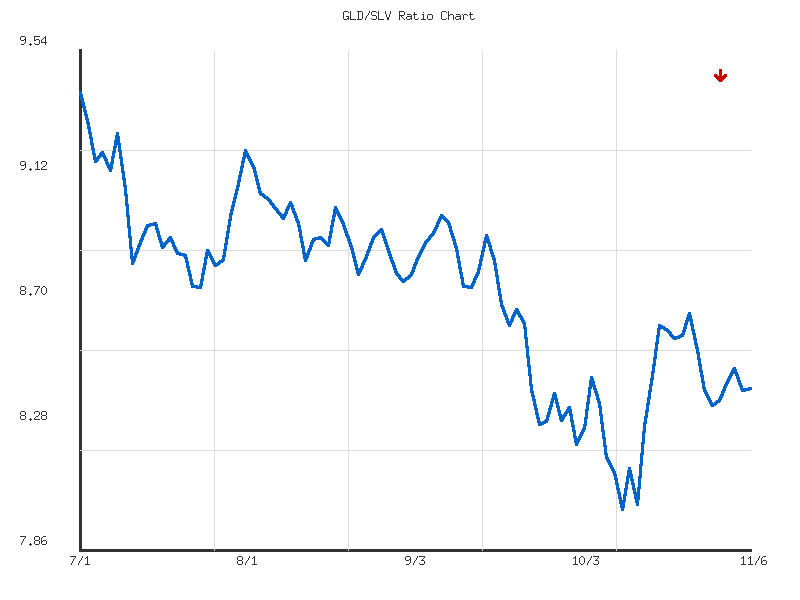
The GLD/SLV ratio has exhibited a pronounced downward trend over the observed 90-day period, commencing July 1, 2025, and concluding November 6, 2025. Technical data indicates a strong negative trajectory, with the ratio depreciating by approximately 10.56% from its peak of 9.396 on July 1st to its current level of 8.404. This sustained decline suggests a consistent outperformance of SLV relative to GLD throughout much of this timeframe. The average ratio over these 90 days stands at 8.735, positioning the current value significantly below the historical mean, further reinforcing the established bearish sentiment within this specific ratio.
Initial price action saw the ratio decline from its July 1st high, establishing a support zone around 8.74-8.75 during late July. After a brief rebound in early August toward the 9.20 area, which subsequently served as minor resistance, the downtrend reasserted itself with notable strength. This led to a decisive breach of the 8.75 support by mid-August. The descent accelerated through September, culminating in a fresh 90-day low of 8.000 on October 13th. This 8.00 level now represents a critical technical support, having halted the ratio’s steepest decline within the analysis period. The volatility metric of 0.0959 suggests a moderate degree of price fluctuation accompanying this trend.
Following the establishment of the 8.00 low, the ratio experienced a robust rebound, climbing to approximately 8.61 by October 21st. This sharp recovery from a significant low could be interpreted as an oversold bounce or the initial phase of a short-term reversal. However, subsequent price action into early November has shown the ratio trading largely within a consolidative range, primarily between 8.35 and 8.65. The ratio’s relative_position at 0.289 indicates it remains closer to its 90-day low than its high, suggesting that while the immediate downside momentum has abated, the broader bearish trend is not yet convincingly reversed. The inability to sustain gains above 8.65 on recent attempts indicates resistance around this level.
Looking forward, the immediate outlook presents a roughly even chance of either a sustained consolidation or a resumption of the broader downtrend. A clear break above the 8.65 resistance level would make it likely that the ratio could test the 8.75-8.80 area, potentially indicating a more substantial reversal of the 90-day trend. Conversely, a decisive move below the current range and the 8.35 level would make it likely to re-test the critical 8.00 support. A breach of the 8.00 low would be a strong bearish signal, implying a highly probable continuation of GLD’s underperformance relative to SLV beyond the observed 90-day data. Without additional data, a strong upside breakout beyond the 9.00 level appears unlikely in the short term.
Ratio Analysis: GLD/SLV
Generated for 90days timeframe analysis
Bonds
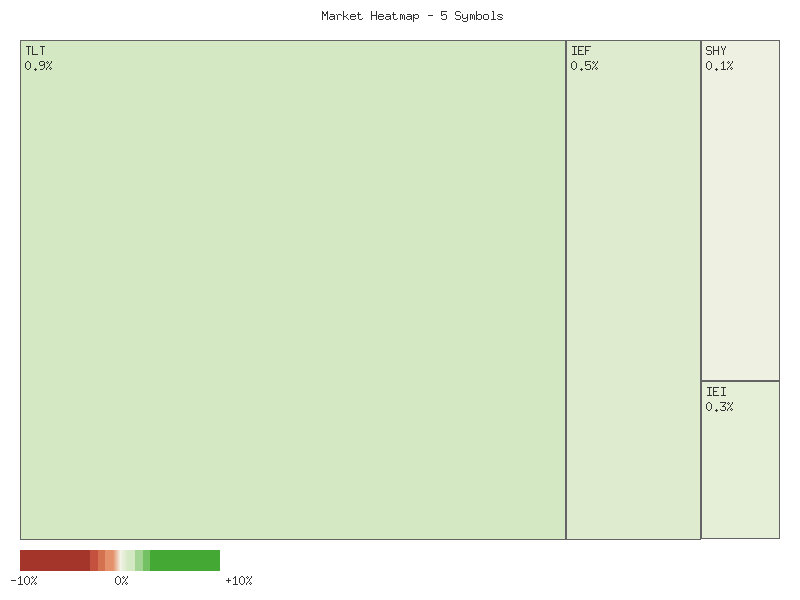
The provided market data for DAILY_PCT_CHANGE on 2025-11-06 indicates positive price movement across all observed Treasury bond ETFs. The daily percentage changes are presented below, sorted in descending order of performance:
| Symbol | Daily Percent Change |
|---|---|
| TLT | 0.922% |
| UTHY | 0.809% |
| IEF | 0.510% |
| IEI | 0.340% |
| SHY | 0.139% |
This data strongly suggests a generally bullish sentiment for fixed-income assets on the observed day, with all analyzed instruments concluding the session with gains.
A closer examination of the individual performances reveals a discernible pattern related to duration. Instruments with longer durations, such as TLT (20+ Year Treasury Bond ETF) and UTHY (a long-duration bond ETF), exhibited the most significant gains. TLT posted a 0.922% increase, while UTHY advanced by 0.809%. In contrast, shorter-duration instruments like SHY (1-3 Year Treasury Bond ETF) saw a more modest gain of 0.139%, with IEI (3-7 Year Treasury Bond ETF) and IEF (7-10 Year Treasury Bond ETF) falling between these extremes. This differential performance, where longer duration assets notably outperform shorter duration assets, is a key technical observation from this dataset.
Based on this singular day’s price action, it is likely that market participants exhibited a preference for extending duration within their fixed-income holdings. From a technical standpoint, this could imply an increasing demand for long-term bonds. However, without additional price and volume data over a longer period, or context from previous sessions, it is only a roughly even chance that this represents the initiation of a sustained trend favoring duration. An alternative scenario is that this movement could be an isolated event, representing a single-day rotation or rebalancing with no discernible follow-through in subsequent sessions. The confined data set limits broader trend extrapolation, but the relative strength in longer-duration assets is a notable technical characteristic for the session.
Market Commentary: Bond ETF Technical Analysis (November 5-6, 2025)
Over the two trading days observed (November 5th and 6th, 2025), a consistent pattern of price action emerged across the provided bond-related ETFs: TLT, IEF, IEI, SHY, and UTHY. November 5th was characterized by broadly bearish price action, with all instruments closing near their daily lows after opening generally flat. However, November 6th presented a significant reversal, as each ETF gapped up at the open and demonstrated strong bullish momentum throughout the day, closing near their respective daily highs. This collective recovery suggests a pervasive short-term shift in sentiment following the prior day’s decline. It is likely that this coordinated movement reflects a broad-based adjustment in market participants’ expectations for bond instruments within this limited timeframe.
Specifically, TLT, IEF, IEI, and SHY all exhibited clear bullish candles on November 6th, successfully recouping substantial portions, if not all, of the prior day’s losses. Each of these instruments gapped up at the open on November 6th relative to their November 5th closing prices, indicating strong overnight buying interest. Subsequent price action saw these ETFs trade higher, eventually closing significantly above their November 5th opens. While this price recovery is notable, it is also observed that the bullish price action on November 6th occurred on declining volume for TLT, IEF, IEI, and SHY compared to their respective volumes on November 5th. This decreasing volume during a rally, particularly following a bearish day with higher volume, introduces a degree of uncertainty regarding the durability of this newfound upward momentum. It suggests that while buyers were in control, the conviction behind this recovery might be moderate, making a sustained breakout less certain.
In contrast to the volume profiles of the larger bond ETFs, UTHY presented a similar two-day price pattern of an initial bearish day followed by a strong bullish recovery, opening with a gap up. However, UTHY’s bullish price action on November 6th occurred on increased volume compared to November 5th. While UTHY’s absolute trading volume remains significantly lower than the other listed ETFs, this relative increase in volume during its rally could be interpreted as a moderately stronger indication of conviction among its participant base for its upward move. This divergence in volume profile between UTHY and the other bond ETFs creates a roughly even chance that UTHY’s short-term bullish momentum may have slightly greater internal support compared to its peers, though its overall low liquidity could also lead to higher volatility.
Considering the aggregated two-day data, it is likely that bond prices, as represented by these ETFs, may experience further short-term upward pressure or consolidation at higher levels in the immediate future. The widespread bullish recovery, particularly the gap-ups, suggests that the market may have effectively shrugged off the previous day’s selling pressure. However, the decreased volume on the bullish day for the majority of these ETFs (TLT, IEF, IEI, SHY) makes it unlikely that this two-day pattern alone signifies a robust, sustained uptrend without further confirmation. An alternative scenario considers this as merely a short-term rebound within a broader sideways or potentially even downward trend, especially if subsequent trading days fail to maintain or build upon the increased prices with commensurate volume. Traders should monitor future price action and volume closely for signs of follow-through buying or renewed selling pressure to ascertain the true underlying directional bias beyond this brief period.
Performance Heatmap (TLT, UTHY, IEF, IEI, SHY)
Generated for 2days timeframe analysis
Magnificent 7 & Friends
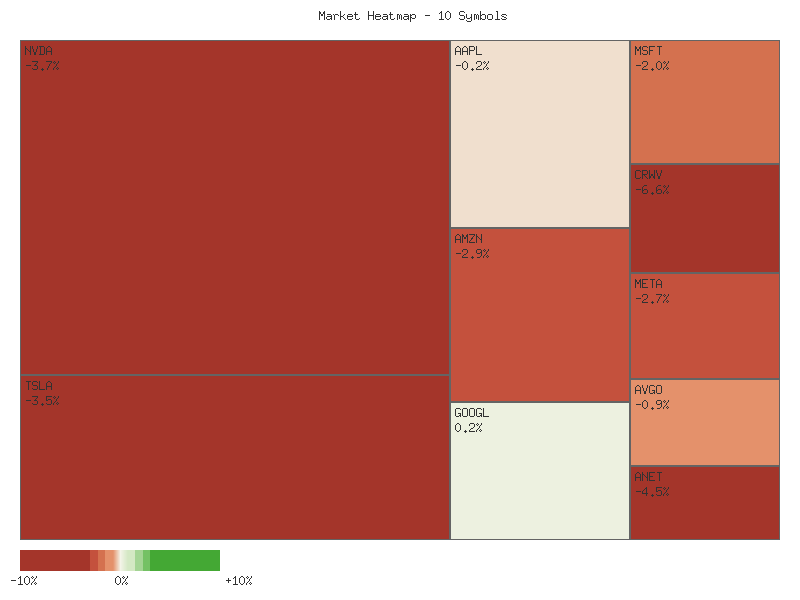
The daily performance across the selected equities for the observed period indicates a predominantly bearish sentiment for many of the listed assets, with limited exceptions. The following matrix illustrates the daily percentage change for each symbol, sorted from highest to lowest:
| Symbol | Daily Percent Change |
|---|---|
| GOOGL | 0.155% |
| AAPL | -0.152% |
| AVGO | -0.858% |
| MSFT | -1.984% |
| META | -2.675% |
| AMZN | -2.873% |
| TSLA | -3.537% |
| NVDA | -3.652% |
| ANET | -4.509% |
| CRWV | -6.555% |
Observation of the data suggests that only GOOGL posted a positive daily change, albeit a marginal one, making it the relative outperformer among this group for the period. Its positive, though small, increment suggests a minor bullish bias compared to its peers. AAPL experienced a negligible decline, nearly flat, which might indicate a degree of resilience relative to the broader negative trend seen in most other stocks within this specific dataset. AVGO also showed a relatively contained decline compared to the majority.
The majority of the observed assets concluded the period with negative performance, ranging from moderate to significant declines. MSFT, META, and AMZN recorded notable retreats, suggesting a likely broad-based selling pressure affecting major technology and growth names. While these declines are substantial, they are not the most severe within this peer group, possibly indicating a baseline bearish sentiment rather than isolated extreme weakness.
Further down the performance spectrum, TSLA, NVDA, ANET, and particularly CRWV demonstrated substantial daily losses. CRWV’s -6.555% decline is a highly significant move within a single trading day, suggesting strong bearish momentum or specific selling pressure for that asset. Similarly, ANET’s nearly -4.51% drop, along with NVDA’s -3.65% and TSLA’s -3.54% declines, are material and likely point to heightened negative sentiment or supply-side dominance for these individual securities during the observed period.
It is important to note that this analysis is based solely on a single day’s percentage change for each asset. While the relative performance ranking provides an immediate snapshot of comparative strength or weakness, it is improbable that this single data point can establish sustained trends or predict future movements with high confidence. A single day’s price action represents only a fraction of market behavior, and alternative scenarios, such as immediate reversals or continued consolidation, hold a roughly even chance in subsequent periods without additional supporting technical data like volume, historical price patterns, or indicator readings. Therefore, while we can identify the current relative momentum, drawing long-term conclusions from this limited dataset would be ill-advised.
Market Commentary: 2-Day Technical Outlook (November 5-6, 2025)
The overall technical landscape across the observed equities for the period spanning November 5th and 6th, 2025, points towards a prevailing bearish momentum. A significant majority of the analyzed stocks exhibited price action patterns indicative of strong selling pressure, often accompanied by increased trading volume, which typically serves to confirm the strength of price movements. This suggests that further downside across many of these constituents is more probable than not in the immediate term, with only a few exceptions displaying relative strength or ambiguous signals.
Several securities demonstrated particularly compelling bearish price action. NVDA, for instance, formed two consecutive large red candles, establishing lower highs and significantly lower lows, which was notably confirmed by a substantial increase in volume on the second day. This confluence of factors makes a continued price decline highly likely. Similarly, AMZN, CRWV, META, MSFT, and TSLA all displayed strong bearish patterns—either clear bearish engulfing formations or pronounced two-day bearish continuations—with increasing or substantial volume. For these symbols, further downward price movement is very likely in the immediate outlook. The increased volume on down days across these names suggests strong conviction among sellers and potential for continued weakness.
Other stocks, while bearish, present nuances. ANET showed two consecutive red candles, with the second day posting a significantly lower close after rejecting higher prices on Day 1. However, the volume on the second day slightly decreased, which could, under alternative scenarios, suggest that selling pressure might begin to wane in subsequent sessions, though the price action still indicates that further downside is likely. AVGO also formed a distinct bearish reversal pattern, akin to a Dark Cloud Cover, supported by an uptick in volume. This pattern makes further declines likely. In these cases, while bearish momentum is evident, a temporary consolidation or a modest bounce from potential support levels (not visible in this 2-day snapshot) has an unlikely chance but is not entirely out of the realm of possibility.
GOOGL stands out as a clear bullish outlier in this dataset. It printed two consecutive green candles, demonstrating higher highs and higher lows, crucially supported by increased volume on the second day. This robust price action suggests a continuation of its upward trajectory is very likely. Conversely, AAPL presents a more ambiguous technical picture. While the second day resulted in a red candle that closed marginally below the prior day’s close on increased volume, it simultaneously achieved a higher high and did not break the low of the first day. Given these mixed signals, a continuation of the prior day’s price level or a slight consolidation, potentially within the range of the two observed days, has a roughly even chance compared to a definitive bearish breakdown. Further observation beyond this 2-day window would be required to establish a clearer directional bias for AAPL.
Based solely on the provided 2-day candlestick and volume data, the immediate technical outlook for the majority of the analyzed stocks appears predominantly bearish. The prevalence of strong bearish patterns, especially when confirmed by increasing volume, implies that downward pressure will likely persist in the very short term. Retail traders should approach these names with caution, recognizing the potential for continued decline, while acknowledging the robust upward momentum present in GOOGL. The broader market signal from this specific dataset leans toward widespread weakness.
Performance Heatmap (TSLA, MSFT, AAPL, META, NVDA, AVGO, GOOGL, AMZN, CRWV, ANET)
Generated for 2days timeframe analysis
S&P 500 Sector Breadth
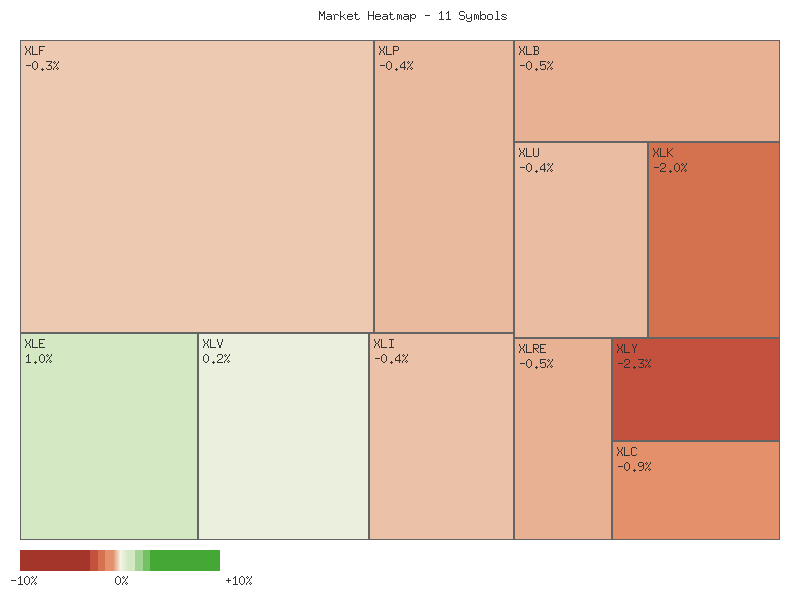
The daily percentage changes across the S&P 500 sectors on this particular day reveal a market exhibiting significant weakness in breadth. Of the eleven sectors analyzed, only two posted gains, while a substantial nine sectors recorded declines. This lopsided distribution of advancers to decliners indicates a notably negative market breadth, suggesting that selling pressure was widespread and impacted the majority of the market, rather than being concentrated in a few specific areas.
| Symbol | Daily Percent Change |
|---|---|
| XLE | 0.967% |
| XLV | 0.192% |
| XLF | -0.323% |
| XLI | -0.379% |
| XLU | -0.422% |
| XLP | -0.435% |
| XLRE | -0.501% |
| XLB | -0.505% |
| XLC | -0.895% |
| XLK | -1.993% |
| XLY | -2.317% |
Analyzing the performance of offensive versus defensive sectors, there is no clear indication of a broad rotation into defensive assets. Two sectors advanced: XLE (Energy), an offensive sector, and XLV (Healthcare), a defensive sector. However, the remaining three defensive sectors—XLU (Utilities), XLP (Consumer Staples), and XLRE (Real Estate)—all experienced declines, suggesting that capital was not broadly flowing into traditional safe havens. Furthermore, the majority of offensive sectors—XLF (Financials), XLI (Industrials), XLB (Materials), XLK (Technology), and XLY (Consumer Discretionary)—also saw negative performance, with XLY and XLK showing the most significant losses. This pattern indicates a generalized market pullback, rather than a strategic shift from offensive to defensive postures.
The overall market sentiment appears to be predominantly bearish based on this data. The two largest percentage declines occurred in XLY (Consumer Discretionary) and XLK (Technology), which are typically highly sensitive to economic growth and risk appetite. XLC (Communication Services) also experienced a notable decline. The fact that nine out of eleven sectors are down, coupled with the substantial retreats in key growth-oriented areas, suggests a risk-off environment. While XLE’s gain might indicate some rotation into commodities or value, the broad-based declines across both offensive and many defensive sectors imply that market participants are unlikely to be seeking out specific defensive plays as a collective, but rather pulling back broadly from equity exposure. It is a roughly even chance that the minor gains in XLE and XLV represent isolated strength rather than a nascent upward trend across their respective categories given the pervasive weakness elsewhere.
CMT Technical Commentary: S&P Sector ETF 2-Day Review (November 5-6, 2025)
The past two trading days present a largely divergent landscape across the S&P sectors, with several key ETFs exhibiting notable shifts in short-term momentum, while others display either a continuation of prior sentiment or a nascent reversal. Our analysis, based strictly on the provided candlestick and volume data, indicates a mixed outlook with a predominance of sectors showing likely bearish turns following initial strength. The brevity of the data horizon (two days) limits the scope to immediate tactical implications rather than long-term strategic shifts.
A significant portion of sectors concluded the two-day period with demonstrably bearish signals. The Technology sector (XLK) and Consumer Discretionary (XLY) are of particular note, as both formed substantial bearish engulfing patterns on Day 2. For XLK, a strong bullish candle on Day 1 was entirely negated by a large bearish candle on Day 2, which closed near its low and well below Day 1’s open. This price action was accompanied by a near doubling of trading volume, making a bearish continuation for XLK highly probable. Similarly, XLY also displayed a bearish engulfing pattern on Day 2, with increased volume, following a strong bullish Day 1, indicating a highly probable bearish continuation for this sector as well.
Beyond these pronounced reversals, several other sectors demonstrate a likely shift towards bearish momentum or a continuation of downward pressure. Communication Services (XLC) printed a bearish candle on Day 2, closing lower than Day 1’s close and open, signaling a likely bearish reversal. Financials (XLF), Utilities (XLU), Materials (XLB), Consumer Staples (XLP), and Real Estate (XLRE) all concluded Day 2 with lower closes, eroding or fully negating Day 1’s gains. Importantly, XLF, XLU, and XLB all saw increased volume accompanying their bearish price action on Day 2, which further suggests a likely continuation of bearish sentiment for these sectors. XLP and XLRE, despite slightly varied volume profiles, also showed consecutive lower closes, indicating a likely short-term downward continuation.
Conversely, the Energy sector (XLE) and Healthcare (XLV) appear to be maintaining or building bullish momentum. XLE concluded Day 2 with a higher close and a higher high on increased volume, following a relatively small-bodied Day 1 candle, suggesting a likely bullish continuation. Healthcare (XLV) also registered consecutive higher closes over the two days, with Day 2 closing higher than Day 1 on increased volume. This pattern indicates a likely bullish continuation for XLV, maintaining its upward trajectory observed within this brief period.
Finally, the Industrials sector (XLI) presents a less clear directional bias. Day 2 ended with a bearish close, retreating from Day 1’s gains, although the candle was not overtly powerful, and volume only slightly increased. This mixed signal, characterized by a pullback after a bullish day, implies that a short-term consolidation or a slight pullback is of roughly even chance. Traders seeking clear direction in XLI may await further data to confirm a definitive trend. Overall, the market exhibited significant intraday volatility and reversals for many sectors, emphasizing the need for cautious technical interpretation for the immediate future.
Performance Heatmap (XLP, XLRE, XLI, XLU, XLV, XLY, XLF, XLB, XLE, XLC, XLK)
Generated for 2days timeframe analysis
XLY vs XLP
The XLY/XLP ratio has largely exhibited a sideways trend over the preceding seven trading days, characterized by weak directional strength and a net decline of approximately 0.28% from the initial observation. The ratio’s activity has been confined within a defined range, establishing a low of 3.0555 on October 30th and a high of 3.1994 on November 3rd. The current ratio stands at 3.1142, which is notably below the period’s average ratio of 3.1350, suggesting a slight underperformance relative to its recent mean.
Analysis of the intraday movements reveals a initial dip from 3.1228 to the period’s low of 3.0555, followed by a robust rally that peaked at 3.1994. However, the ratio was unable to sustain this upward momentum, subsequently experiencing a decline to its current level. This pullback from the high indicates that upward conviction was not broadly maintained. The current relative position of 0.4076 within the 7-day range (where 0 is the low and 1 is the high) further underscores that the ratio is presently situated in the lower half of its recent trading band.
The observed “weak” strength of the “sideways” trend, combined with a relatively low volatility reading of 0.001812, strongly suggests a phase of consolidation rather than a clear directional commitment. While the ratio showed a strong bounce from its lows, the failure to hold gains above the average ratio after reaching the high point makes a sustained upward breakout improbable in the immediate term based solely on this limited data set. Conversely, despite the recent decline, the ratio has not yet decisively challenged the lower boundary of its 7-day range.
Given the current technical posture, there is a roughly even chance the XLY/XLP ratio will continue to oscillate within its established 3.0555 to 3.1994 range. A clear break above the 3.1994 level would be required to suggest a renewed bullish impulse, a scenario that appears unlikely given the most recent price action. Alternatively, a move below the 3.0555 support would indicate increasing bearish momentum and a potential shift in the sideways consolidation, which is also a tangible, albeit unconfirmed, possibility. Absent further data, the market appears to lack a strong directional catalyst for this ratio.
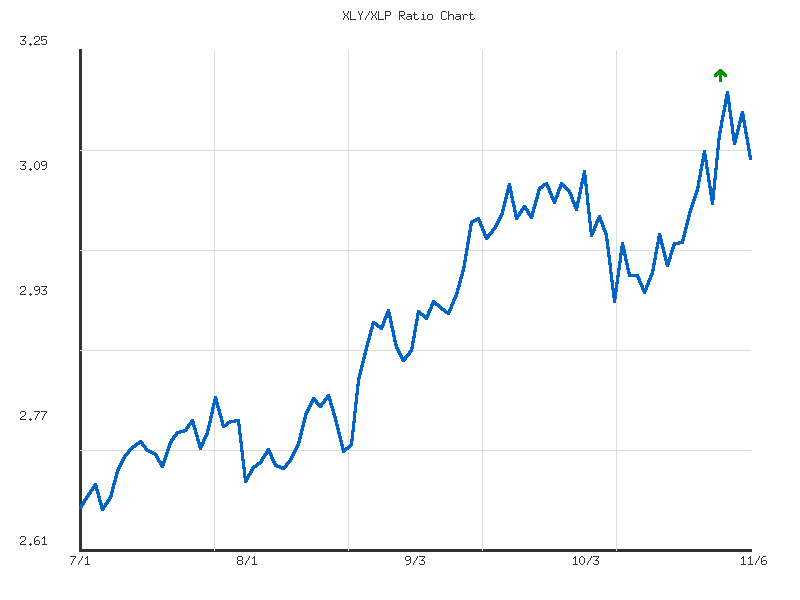
Technical Analysis: XLY/XLP Ratio (90-Day View)
The XLY/XLP ratio, representing the relative performance of the Consumer Discretionary sector (XLY) against the Consumer Staples sector (XLP) over the past 90 days, demonstrates a persistent and strong upward trend. This sustained outperformance by XLY indicates a clear preference for growth-oriented sectors over defensive ones within the market, as shown by the provided trend direction of “up” and strength of “strong.” Over this period, the ratio has increased by approximately 16.97%, moving from a low of 2.6598 to a recent high of 3.1994. The current ratio stands at 3.1142, which is notably above its 90-day average of 2.8954 and positioned at the upper end of its observed range, with a relative position of 0.8421. This robust upward trajectory suggests a continued optimistic market sentiment favoring risk-on assets in the observed timeframe.
Observing the recent price action, the ratio successfully climbed to its 90-day high of 3.1994 on November 3, 2025. This achievement extended the strong upward momentum observed since late August, where the ratio consistently recorded higher highs and higher lows. Following this peak, the ratio experienced minor pullbacks on November 4th and November 6th, settling at 3.1142. These retracements, while not invalidating the overall uptrend, might suggest the emergence of short-term resistance near the 3.20 psychological level. We judge that the sustained ability to push to new highs and maintain levels significantly above the 90-day average reinforces the bullish technical structure for this ratio.
Given the “strong” upward trend and the consistent formation of higher highs and higher lows, we assess it is likely that the XLY/XLP ratio will attempt to retest or exceed its recent 90-day high of 3.1994 in the near term. A decisive break above this resistance would signal a continuation of the powerful trend, indicating further outperformance of XLY relative to XLP. Traders might view any pullbacks towards the average ratio of 2.8954 as potential opportunities for re-engagement, provided that key support levels, such as the cluster of recent consolidation points around 3.05-3.08, hold firm. The observed volatility of 0.0220 suggests a relatively steady upward climb, implying that sharp, sudden reversals are unlikely without a significant break in the established trend structure.
However, an alternative scenario warrants consideration. Should the ratio fail to establish new highs and instead break below the immediate support levels, specifically the 3.05-3.08 range, it would signal a potential consolidation or a deeper retracement. A sustained move below the average ratio of 2.8954 would notably weaken the current strong bullish thesis, making a period of sideways trading or a more pronounced correction in the ratio a roughly even chance. In such a scenario, the market’s preference could be shifting, perhaps indicating profit-taking in discretionary names or a renewed interest in defensive staples. Close monitoring of the ratio’s interaction with the 3.1994 high and critical support levels is essential to gauge the evolving market dynamics.
Ratio Analysis: XLY/XLP
Generated for 90days timeframe analysis
Equity Breadth
Over the past seven trading days, the percentage of S&P 500 members trading above their 50-day moving average (SPXA50R) exhibited a notably volatile and ultimately declining trend. Starting near 41.72%, the indicator briefly advanced to 42.12% before experiencing a sharp downturn to 37.72%. While a partial recovery to 40.52% was observed mid-period, the final reading stood at 38.92%. This pattern suggests a likely weakening in the short-to-medium-term technical posture of individual S&P 500 components. The inability to sustain upward momentum and the subsequent decline indicate that a growing proportion of stocks are exhibiting short-term price pressure, suggesting a declining breadth for short-term rallies.
Concurrently, the percentage of S&P 500 members above their 200-day moving average (SPXA200R) also showed a significant deterioration in market breadth over the same period. Beginning at 49.90%, the indicator briefly edged higher to a peak of 51.09%, signifying that slightly more than half of the components were in long-term uptrends. However, following this peak, the SPXA200R declined consistently, closing the period at 48.50%. This sustained downturn from above the 50% threshold to below it renders it highly likely that the long-term technical health of the broader market, as represented by its individual constituents, is experiencing a contraction.
The combined observation of both SPXA50R and SPXA200R indicates a broad-based technical deterioration within the S&P 500. The SPXA50R’s choppy decline, particularly its consistent readings below 42%, coupled with the SPXA200R’s clear downward trajectory from above 50% to below it, points to a likely increase in selling pressure or a lack of buying conviction across a significant portion of the index. This pattern implies that the underlying strength supporting broad market advances is dissipating. Alternatively, should the market establish significant support at key levels outside the scope of this data, this observed contraction in breadth might represent a temporary consolidation phase before a potential recovery. However, based solely on the provided data, a continued weakening of breadth appears probable.
Given the trends observed in both indicators, the market breadth for the S&P 500 is notably weakening. The declining number of components trading above both their 50-day and 200-day moving averages suggests increasing internal market fragility. It is unlikely that the S&P 500 index itself could sustain a significant rally without an improvement in these breadth metrics. The current data makes it probable that the index components face headwinds, implying that any potential market strength might be concentrated in a narrower selection of stocks, or that the overall index may experience downward pressure or range-bound consolidation in the near term.
SPY Daily
The SPY experienced a significant shift in price action over the past seven trading days, following a period of sustained upward momentum. From October 27th through November 3rd, SPY maintained a general bullish trajectory, reaching a peak close of 685.24 on October 27th and a high of 689.70 on October 29th. However, the last three trading days, specifically November 4th and November 6th, show a marked decline. On November 4th, SPY closed at 675.31, a notable drop from 683.32, on increased volume of 72.16 million shares. After a modest rebound on November 5th to 677.54, the index closed at 670.24 on November 6th, again on increased volume (77.16 million), underscoring heightened selling pressure. This recent price behavior indicates a decelerating upward trend and a probable shift towards near-term bearish momentum.
Analyzing the Exponential Moving Averages (EMAs), SPY maintains a long-term bullish posture, with the 50-day EMA (663.87) consistently above the 200-day EMA (621.26), a ‘Golden Cross’ configuration that typically indicates an enduring uptrend. However, the recent price decline has brought SPY much closer to its 50-day EMA. The EMA_50_DAY has served as dynamic support during prior advances, but the current price of 670.24 is now only marginally above this crucial short-to-medium term indicator. This proximity suggests that this level will be a critical battleground for bulls and bears in the immediate future.
From a momentum perspective, the 14-day Relative Strength Index (RSI) corroborates the observed shift. Having been in bullish territory above 60 from October 28th to November 3rd, the RSI dropped sharply to 53.39 on November 4th and further to 48.17 on November 6th. The move below the 50-level is a significant technical development, signaling that average losses are now outpacing average gains over the 14-day period. This transition suggests a loss of bullish conviction and indicates that selling pressure is increasing.
For support and resistance, the recent high of 689.70 (October 29th) stands as a significant near-term resistance level. The 685 zone, tested and rejected in late October, also represents resistance. On the downside, the 50-day EMA at 663.87 is a key dynamic support. If this level is breached, a further decline is likely, with the next identifiable support potentially near the 650-655 range, where SPY saw previous consolidation in mid-October. The ultimate long-term support remains the 200-day EMA at 621.26, though a test of this level is considered unlikely in the very near term unless significant bearish catalysts emerge.
Considering future price action, a bearish scenario is roughly even chance with a neutral one. If SPY fails to hold the 50-day EMA at 663.87 on continued high volume, a sustained downward move towards the 650-655 area is likely. A neutral scenario is also roughly even chance; SPY could consolidate around the 665-675 range, finding temporary support at the 50-day EMA, as market participants digest the recent decline. The RSI’s position near 50 supports this possibility of indecision. A bullish scenario, involving a strong rebound from current levels to retest recent highs, is unlikely given the recent breakdown in momentum and increasing selling volume. For a bullish case to become likely, SPY would need to reclaim the 675-680 resistance zone with strong buying interest and rising RSI.
Current sentiment drivers are primarily linked to the erosion of recent bullish momentum. The observed sharp declines on elevated volume, coupled with the RSI falling below 50, indicate growing caution and profit-taking among market participants. This suggests a shift from an overconfident market to one where traders are more attuned to potential downside risks. The psychological impact of breaking key short-term support levels could further fuel bearish sentiment if the 50-day EMA is breached.
SPY Technical Analysis: 90-Day Overview with RSI (14-Day)
This analysis of the SPY ETF covers the 90-day period from early July to early November 2025, utilizing candlestick price action and the 14-day Relative Strength Index (RSI). It is important to note that while MACD (13,21-day) was indicated in the chart request, the accompanying data did not include MACD values. Therefore, this analysis will solely rely on the provided price and RSI data, adhering strictly to the available information.
Over the initial two-thirds of the observation period, SPY exhibited a robust upward trend, characterized by a series of higher highs and higher lows. The price ascended from approximately in early July to a peak near by late October. During several stretches, particularly in mid-July, late July, mid-September, and early October, the 14-day RSI entered overbought territory (above 70). Historically, sustained periods above 70 can indicate strong bullish momentum, but they also frequently precede short-term pullbacks or consolidations. Notably, the RSI peaked above 75 in late July, coinciding with a two-day price decline on elevated volume, and again reached 73.70 in late September, before a subsequent minor dip.
A significant shift in momentum occurred on October 10th, when SPY experienced a sharp, high-volume sell-off, dropping from around to . This strong bearish candlestick was accompanied by the 14-day RSI plummeting from approximately 65 to 41.81, momentarily approaching oversold levels. While the market recovered substantially from this event, reaching a new high of .70 by October 29th, the momentum indicators suggest this upward drive may be exhausted. The RSI on October 29th reached 69.71, just shy of overbought, which could indicate a diminishing strength in the rally compared to previous overbought readings at new highs.
The most recent price action, particularly from late October through early November, indicates a probable short-term bearish reversal. Following the peak near on October 29th, SPY has shown clear downward momentum, with several consecutive bearish closes and declining daily highs. The price has retreated to .24 as of November 6th. Concurrently, the 14-day RSI has sharply declined from its late October high, falling to 48.17 on November 6th. This rapid decline in RSI, coupled with strong bearish candlesticks and comparatively high volume on down days (e.g., October 30th and November 4th, 6th), suggests an increasing dominance of sellers.
Considering the current technical posture, there is a likely chance that SPY will experience further downside in the immediate term. The sustained bearish price action since the late October peak, coupled with a declining RSI that has broken below the neutral 50 level, points to a continuation of this recent downward trend. An alternative scenario suggests a roughly even chance for a near-term bounce or consolidation if price approaches the previous support zone established around -, which corresponds to the low from the October 10th sell-off. However, a significant reversal back to bullish momentum would require SPY to reclaim levels above with conviction, which appears unlikely without a period of consolidation or a strong bullish catalyst not evident in the provided data. Traders should observe potential support levels around and , and monitor the RSI for any signs of a bounce from oversold conditions.