Daily Market Technical Analysis
Market indices show a mixed, risk-on sentiment, with small and mid-cap indices exhibiting stronger bullish momentum while larger-cap counterparts face roughly even chances of sustained upside. Commodities present a strong divergence: precious and industrial metals are likely to continue bullish, contrasting with likely continued bearish pressure for energy assets. The VIX is likely to experience further downward pressure, indicating decreasing market apprehension. Technology (QQQ/SPY) demonstrates likely sustained relative strength, while Treasury bonds, particularly longer durations, face likely continued downward pressure. Despite S&P 500 offensive sectors showing likely bullish momentum and a risk-on rotation, overall equity breadth indicates a likely broad-based weakening in constituent trends, suggesting potential for narrowing market leadership.
Market Indices
Based on the provided daily percentage change data for a selection of broad market ETFs, the immediate technical picture suggests a universally positive, albeit varied, market session. The following matrix illustrates the performance:
| Symbol | Daily Percent Change |
|---|---|
| IJR | 1.677% |
| IWM | 1.455% |
| MDY | 0.686% |
| QQQ | 0.658% |
| SPY | 0.330% |
| OEF | 0.220% |
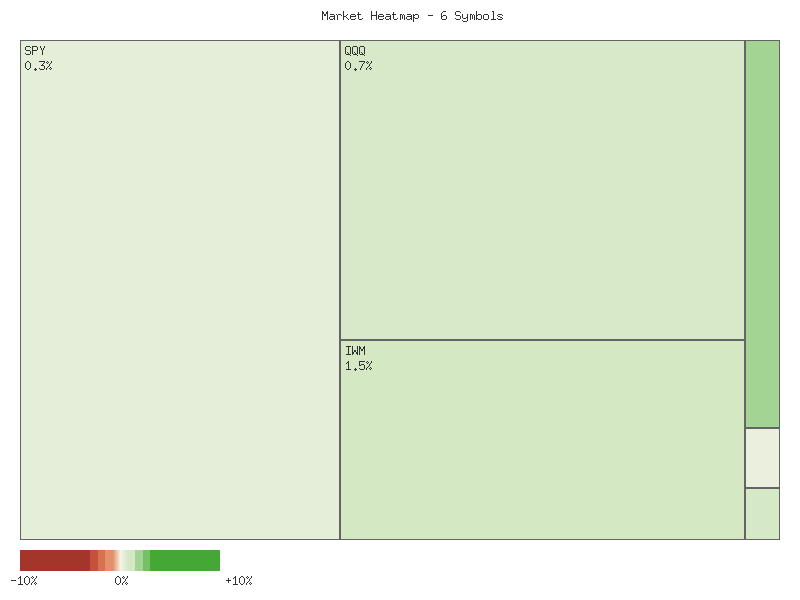
An analysis of market breadth, derived solely from this specific basket of symbols, indicates a strong positive bias for the session. All six evaluated ETFs, representing various market capitalization segments, registered positive daily percentage changes. This translates to six advancing symbols and zero declining symbols. Such unanimous positive movement among these diverse indices is likely to be interpreted by market participants as a sign of broad, although potentially shallow, market participation for this particular day.
The relative performance among these indices offers a nuanced view. Small-cap indices, specifically IJR (S&P SmallCap 600) and IWM (Russell 2000), exhibited the most significant gains, advancing by 1.677% and 1.455% respectively. This outperformance of smaller capitalization segments is a notable pattern. While a single day’s data does not establish a trend, such leadership from small-caps could suggest an increase in risk appetite among investors or a rotation into more cyclically sensitive areas of the market. However, it is also plausible that this simply reflects short-term sector-specific strength unrelated to a broader trend shift.
Conversely, the larger capitalization indices, SPY (S&P 500) and OEF (S&P 100), posted more modest gains of 0.330% and 0.220%, respectively. This indicates comparatively weaker relative strength for the largest market segments on this particular day. While the overall market breadth for these symbols is strongly positive, the differing magnitudes of change suggest that momentum may be more concentrated in certain areas of the market rather than uniformly distributed across all capitalizations. Future sessions will be necessary to confirm if this pattern of small-cap outperformance develops into a sustained trend or if it represents an isolated event.
CMT Market Commentary: Two-Day Sector Performance Analysis
The recent two-day market activity reveals a notable divergence in performance across various market capitalization segments, with small and mid-cap indices demonstrating more convincing bullish price action than their large-cap counterparts. On November 4th, several indices, including IWM, IJR, SPY, QQQ, and OEF, concluded with bearish candlesticks, signaling initial selling pressure. However, November 5th largely saw a reversal or recovery in most major indices. Analysis of the individual price and volume structures provides critical insights into the immediate market posture.
The small and mid-cap segments, as represented by IWM (iShares Russell 2000), IJR (iShares S&P Small-Cap 600), and MDY (SPDR S&P Midcap 400), collectively exhibited stronger bullish momentum. IWM registered a robust bullish close on November 5th, following a slightly bearish day. Crucially, this positive price action was accompanied by an increase in volume from 32.4 million to 37.0 million, which lends credence to the upward move. Similarly, MDY displayed consecutive bullish days, with November 5th’s stronger bullish candle supported by an increase in volume from 615,197 to 893,711. Given these confirming price and volume dynamics, it is likely that these segments will experience continued upside in the immediate term. For IJR, November 5th also presented a strong bullish candle, achieving a significantly higher close; however, this occurred on substantially lower volume (3.5 million from 7.9 million). While the price action is positive, the lack of volume confirmation introduces uncertainty, suggesting a roughly even chance of sustained upward momentum versus a period of consolidation.
Conversely, the large-cap indices, SPY (SPDR S&P 500), QQQ (Invesco QQQ Trust), and OEF (iShares S&P 100), presented a more mixed technical picture. SPY closed higher on November 5th, recovering from the previous day’s bearish close, but this bullish candle featured a lower low than the prior day and occurred on decreased volume (65.8 million from 72.2 million). This suggests a roughly even chance of continued upside versus further volatility or limited range-bound trading, as the conviction of buyers appears somewhat muted. QQQ, after a significant bearish candle on November 4th, executed a bullish reversal (piercing pattern variant) on November 5th, closing above the midpoint of the prior day’s real body. Nevertheless, this recovery also transpired on reduced volume (46.3 million from 58.6 million) and with a slightly lower high compared to the previous day. This scenario indicates a roughly even chance of continued recovery versus encountering resistance, with the declining volume raising questions about the strength of the short-term buying pressure.
OEF, representing the mega-cap segment, appeared particularly subdued. Following a small bearish candle on November 4th, November 5th presented a small bullish candle with a lower low and a marginal higher close. Critically, volume plummeted from 1.35 million to 417,528, which is an unlikely condition for a robust bullish continuation. The low volume combined with indecisive price action suggests that a strong upside move in OEF is improbable in the immediate future; a period of consolidation or further weakness is likely. The divergence in volume confirmation between small/mid-caps and large-caps suggests that any broader market strength may be predominantly driven by the former in the immediate forecast horizon.
Performance Heatmap (SPY, QQQ, IWM, IJR, MDY, OEF)
Generated for 2days timeframe analysis
SPY Technical Analysis: Navigating Recent Volatility within a Defined Uptrend
Over the 90-day period provided, the SPY has demonstrated a robust underlying uptrend, characterized by a series of higher highs and higher lows. From late June, the price action largely advanced, establishing new peaks consistently into October. Notably, a significant peak was recorded in late October around the 687-688 range, marking the highest point within this dataset. This sustained upward trajectory suggests that bullish sentiment has predominantly controlled price direction over the past three months. The overall price structure indicates that market participants have been willing to accumulate the asset on dips, supporting the continued ascent.
The 14-day Relative Strength Index (RSI) has been instrumental in signaling short-term momentum shifts within this uptrend. We assess that the RSI frequently registered overbought conditions, typically above the 70 threshold, during periods of strong price appreciation (e.g., late July, mid-September, late October). Historically, these instances were often followed by either a period of consolidation or a modest price pullback, allowing the RSI to reset towards more neutral territory. This pattern suggests it is likely that momentum was temporarily exhausted after sustained rallies, leading to profit-taking or a decrease in immediate buying pressure.
A particularly noteworthy event was the sharp price correction on October 10, when the SPY experienced a significant single-day decline from 671.16 to 653.02. This downturn was accompanied by an exceptionally high trading volume, which stood out significantly from the preceding and subsequent days. Concurrently, the 14-day RSI plunged from nearly 66 to approximately 41.81, indicating a dramatic shift in short-term momentum and entering near-oversold territory. The confluence of a sharp price drop, high volume, and a rapid RSI decline makes it highly likely that significant selling pressure, perhaps a liquidation event, occurred on this day. While this could be interpreted as a healthy correction within the broader uptrend, allowing the indicator to reset, it also serves as a reminder of the potential for more pronounced selling pressure.
As of the latest data point (November 5), the SPY has experienced a noticeable pullback from its late-October highs. Following the strong rally into late October, where the RSI again pushed into overbought territory, the subsequent price decline has brought the RSI down to a neutral reading of 55.36. This current RSI level suggests that neither bulls nor bears hold a dominant short-term momentum advantage at this specific juncture, providing room for either renewed upward movement or further consolidation. We assess there is a roughly even chance of continued consolidation or a further modest pullback in the near term, particularly if immediate buying interest does not materialize to drive prices higher from current levels. Conversely, if strong buying interest resumes, the RSI’s current neutral position allows for a renewed advance, making a retest of recent highs likely without immediate overbought constraints. Due to the absence of MACD data in the provided dataset, we are unable to incorporate this indicator into our analysis.
SPY Price & Indicators (RSI_14_DAY, MACD_13_21_DAY)
QQQ Technical Analysis: Navigating a Bullish Trend with Volatility
QQQ has demonstrated a persistent upward trend over the past 90 days, characterized by significant rallies interspersed with sharp, high-volume pullbacks. This analysis relies exclusively on price action and the 14-day Relative Strength Index (RSI) for QQQ, as no MACD data was provided for interpretation.
The period from late June through July saw QQQ exhibit strong bullish momentum, advancing from approximately to a peak near . Throughout July, the 14-day RSI frequently registered in overbought territory, with readings consistently above 70 and peaking at 73.11 on July 28. This sustained high RSI indicated strong buying pressure and conviction. However, this robust rally concluded with a notable two-day price correction on July 31 and August 1, where QQQ declined from .54 to .88. This downturn was accompanied by the highest trading volumes observed up to that point (64.6 million and 69.4 million shares respectively), suggesting a significant shift in short-term sentiment. The RSI concurrently plunged from 65.47 to a more neutral 48.26, confirming a substantial loss of immediate upward momentum.
Following the early August correction, QQQ entered a phase of stabilization and renewed ascent through August and September. After consolidating briefly around the - price range, QQQ resumed its upward trajectory, pushing higher through September. A minor pullback occurred in mid-August, with QQQ falling from approximately to , and RSI retreating from 63.85 to 47.05. However, this was quickly absorbed, leading to a strong rally that propelled QQQ to .71 by October 6. During this leg of the uptrend, the RSI once again signaled overbought conditions, notably reaching 75.35 on September 22 and 71.57 on October 2, underscoring the renewed bullish strength. Volume spikes during the August and early September pullbacks suggested periods of increased selling pressure that were ultimately overcome by buying interest.
The most recent trading activity, spanning from early October to early November, introduced significant volatility. QQQ experienced a sharp, single-day decline of approximately 3.47% on October 10, dropping from .70 to .50. This significant price movement was met with the highest trading volume of the entire 90-day data set, registering 94.41 million shares. Concurrently, the RSI plummeted from 69.27 to 45.42, unequivocally signaling a substantial loss of bullish momentum and a potential shift in trend. Despite this sharp correction, QQQ demonstrated remarkable resilience, quickly staging a strong recovery to reach a new high of .77 by October 29. This rapid rebound was again accompanied by the RSI re-entering overbought territory at 71.73, indicating the underlying strength of the bullish sentiment.
However, the final days of the provided data show QQQ pulling back from this recent high. From October 30 to November 5, QQQ has retreated from .77 to .29. This recent decline has been supported by elevated trading volumes on several days (e.g., Oct 30, Oct 31, Nov 4), suggesting active selling interest. The 14-day RSI has concurrently decreased from an overbought reading of 71.73 to a more neutral 57.17. This confluence of price action, volume, and RSI movement indicates that a continued short-term correction or consolidation is likely for QQQ. A key support level to monitor for a potential bounce is around , corresponding to the October 24 close, an immediate prior high before the last leg up. If this level fails to hold, a deeper test of the - range appears likely. An alternative scenario suggests that if QQQ can stabilize above and the RSI holds above 50, there is roughly an even chance that buying interest will resume, potentially leading to a retest of the - resistance area. However, given the recent downside volume and the RSI’s descent from overbought conditions, a further pullback before a sustained rally becomes likely.
QQQ Price & Indicators (RSI_14_DAY, MACD_13_21_DAY)
Technical Analysis of IWM (90-Day View)
Over the past 90 days, IWM has exhibited a discernible uptrend, characterized by a consistent pattern of higher highs and higher lows, suggesting likely underlying bullish sentiment for the instrument. Beginning near .79 in late June, the price ascended to establish new multi-month highs around .77 on October 15th and .21 on October 27th. This sustained ascent indicates robust buying pressure. Notably, significant corrective phases, such as the sharp dip to .34 on August 1st and the decline to .56 on October 10th, were consistently met with strong buying interest, propelling IWM to subsequent rallies and new peaks. Volume analysis corroborates these price movements, with elevated trading volume frequently accompanying both strong upward surges and significant downward corrections. This increased volume during pullbacks, particularly those that ultimately found support, is likely indicative of strong demand absorbing supply and healthy market participation. Most recently, IWM peaked in late October, followed by a pullback to .99 on November 4th, and a partial rebound to .72 by November 5th. This recent price action implies a potential short-term consolidation or minor corrective phase within the broader uptrend.
The 14-day Relative Strength Index (RSI) has demonstrated its utility as a momentum indicator, reliably signaling overbought conditions (above 70) preceding price pullbacks. Specifically, RSI readings of 71.57 on July 3rd and 71.23 on September 18th were each followed by short-term price declines, suggesting it is very likely that extreme RSI values above 70 correspond to temporary exhaustion in upward momentum. Following the most recent price downturn, RSI dipped to 44.93 on November 4th before recovering to 50.30 by November 5th. This current mid-range RSI indicates a neutral momentum posture, neither signaling immediate overbought nor oversold conditions from this indicator alone. From a price structure perspective, key support appears to have formed around the level, representing the recent low, with a more significant support zone around -, anchored by the strong bounce from the October 10th decline. Overhead resistance is evident in the - range, where IWM encountered selling pressure after reaching its recent peaks.
Considering the observed technical data, a critical limitation of this analysis is the absence of data for the 13-21-day MACD indicator, which could have provided additional clarity regarding trend strength, momentum crossovers, and divergence signals. Despite this limitation, the current technical posture suggests two probable scenarios for IWM in the near term. It is likely that IWM will attempt to consolidate above the support level, with a potential retest of the - resistance zone as the current rebound from the November 4th low gains traction. Conversely, given the neutral RSI and the recent rejection from new multi-month highs, there is a roughly even chance that IWM could experience a deeper pullback towards the more significant support area of -, particularly if buying volume diminishes from current levels. A sustained breakdown below the level would very likely signify a shift to a short-term bearish outlook, challenging the robustness of the broader 90-day uptrend. Traders should monitor the and - levels closely for signs of continued support or breakdown.
IWM Price & Indicators (RSI_14_DAY, MACD_13_21_DAY)
VIX Fear Index
The VIX demonstrated an evident upward trajectory over the initial four trading days, climbing from a close of 16.42 on October 28th to a peak close of 17.44 on October 31st. This period was characterized by consistent upward price action, signaling increasing volatility expectations. However, by November 3rd and 4th, price action suggested emerging selling pressure; despite VIX opening at higher levels (18.06 and 19.73 respectively), both sessions closed below their respective opens, forming red candles. The high of 20.48 observed on November 4th represented the apex of this recent advance, showing an exhaustion in upward momentum as sellers emerged.
The trading session on November 5th provided strong confirmation of a potential reversal in the VIX’s short-term trend. The VIX opened at 19.37 but experienced a sharp decline, closing at 17.91, representing a daily decrease of -5.087%. This significant bearish candle, opening near the previous day’s high and closing substantially lower, strongly indicates a shift in market sentiment. We judge that this price action, particularly the decisive rejection of higher levels and the strong close below the prior day’s closing price, is likely to signify the end of the immediate upward movement.
Given the pronounced bearish candle and significant percentage decline on November 5th, we judge that the VIX is likely to experience further downward pressure in the near term. The pattern of VIX opening higher but failing to sustain those gains on consecutive days, culminating in a sharp retreat, suggests that the prior volatility spike has exhausted itself. An alternative scenario involves a period of consolidation around the 17.91 level or a retest of the 17.00-17.20 range, which aligns with prior support/resistance levels from late October to early November. We assess there is a roughly even chance for such consolidation versus an immediate continuation of the downtrend. A rapid retest of the recent highs above 19.00 is unlikely without new market catalysts.
VIX Technical Analysis: Recent Dynamics and Outlook
The VIX has exhibited significant volatility over the past 90 days, characterized by sharp spikes followed by rapid declines. The index began the period around 17.00, surging to a high of 21.90 on August 1st before swiftly retracing. A more pronounced escalation occurred between October 10th and 17th, where the VIX surged from approximately 16.36 to an intraday high of 28.99, closing at 20.78. This extreme upward movement, coupled with the immediate retraction from the high, suggests strong upward pressure followed by rapid profit-taking or decreased systemic fear. Subsequent to this peak, the VIX swiftly descended to the 16.00-17.00 range by late October, consistent with its tendency for mean reversion after sharp spikes. More recently, from late October into early November, the VIX showed a gradual upward drift from 15.79 to 18.87, before a slight decline to 17.91 on November 5th. Key support appears around the 14.50-15.00 zone, observed in late July and mid-August. Resistance is less clear, but the 19.00-20.00 area has seen selling pressure.
The 14-day Relative Strength Index (RSI) provides insight into VIX’s momentum. During the August 1st spike, RSI climbed to 65.38, indicating strong momentum. The major VIX surge on October 10th drove RSI into clearly overbought territory, reaching 73.09. Historically, VIX tends to pull back after such high RSI readings, and indeed, the index declined rapidly thereafter. From October 20th to 27th, RSI corrected sharply from the low 60s down to 43.49, reflecting VIX’s retracement. As of November 5th, the RSI stands at 52.14. This reading is above the neutral 50-level, suggesting positive momentum but not overbought. The absence of consistently oversold RSI readings (below 30) throughout the 90-day period indicates that prolonged periods of extreme market complacency have been uncommon in this dataset.
Based on the combined analysis of VIX price action and RSI, a continuation of the VIX’s pattern of volatile surges followed by retracements is likely in the near term. The VIX’s current position around 17.91, coupled with a neutral-to-bullish RSI of 52.14, suggests immediate extreme market fear is not present. However, given the history of swift spikes observed, a rapid increase in volatility from current levels cannot be dismissed as unlikely. Specifically, should the VIX break above the 19.00-20.00 range, it would signal a likely re-escalation of market apprehension, potentially targeting prior highs. Conversely, a decline below the 16.00 area would likely indicate decreasing market uncertainty, with a roughly even chance of testing the 14.50-15.00 support zone. It is crucial to acknowledge a significant limitation: the MACD (13,21-day) indicator data was not provided. The absence of MACD, vital for assessing trend strength and potential reversals, limits the comprehensiveness and robustness of these conclusions. Without this additional momentum confirmation, confidence in predicting prolonged trend directions is somewhat diminished, necessitating careful monitoring of future developments.
VIX Price & Indicators (RSI_14_DAY, MACD_13_21_DAY)
Tech Sector Analysis
Analysis of the RATIO:QQQ/SPY:14days data reveals that the technology-heavy NASDAQ-100 (QQQ) has demonstrated a period of relative outperformance against the broader S&P 500 (SPY) over the past fourteen trading days. The overall trend direction for the QQQ/SPY ratio is upward, indicating that QQQ has generally appreciated more, or depreciated less, than SPY during this interval. The ratio initiated this period around 0.9089 on 2025-10-17, briefly dipped to a low of 0.9066 on 2025-10-22, and then proceeded to rally significantly, reaching a high of 0.9250 on 2025-11-03. This sustained upward movement suggests that market participants have been favoring growth-oriented, technology-centric assets relative to the broader market.
Despite the discernible upward trend, the data explicitly categorizes the trend strength as “weak.” This characterization is notable, as a 1.20% increase in the ratio over 14 days, while positive, might not translate into strong conviction buying of QQQ relative to SPY. The low volatility recorded (0.00003787) supports the notion of a relatively stable upward drift rather than aggressive, high-momentum outperformance. Such a combination—an upward direction with weak strength—often implies that while the underlying preference for QQQ exists, it is not robust enough to suggest an impending acceleration in outperformance. The current ratio of 0.9199 sits at approximately 72% of its range between the 14-day low and high, indicating it remains elevated.
Following the peak on 2025-11-03, the ratio experienced a modest retracement to 0.9169 on 2025-11-04, subsequently recovering slightly to 0.9199 on 2025-11-05. This recent price action introduces some uncertainty regarding the immediate continuation of QQQ’s outperformance. Given the “weak” trend strength and the recent minor pullback from the high, it is roughly an even chance that the ratio could consolidate in the near term, potentially fluctuating around its 14-day average of 0.9160. A continuation of strong, unabated outperformance by QQQ in the immediate future appears less likely, as the recent dip suggests some profit-taking or a temporary shift in relative sentiment.
Conversely, a more significant breakdown below the recent low of 0.9169 seems unlikely without additional technical confirmation, such as increased selling volume or a more pronounced downward movement in subsequent sessions. The overall upward trajectory, albeit weak, suggests that dips in the ratio might attract renewed interest in QQQ relative to SPY. Traders should monitor whether the ratio can surpass its recent high of 0.9250, which would likely signal a reassertion of QQQ’s relative strength and potentially lead to further, albeit still likely moderate, outperformance.
Technical Analysis: QQQ/SPY Relative Strength Ratio (90-Day)
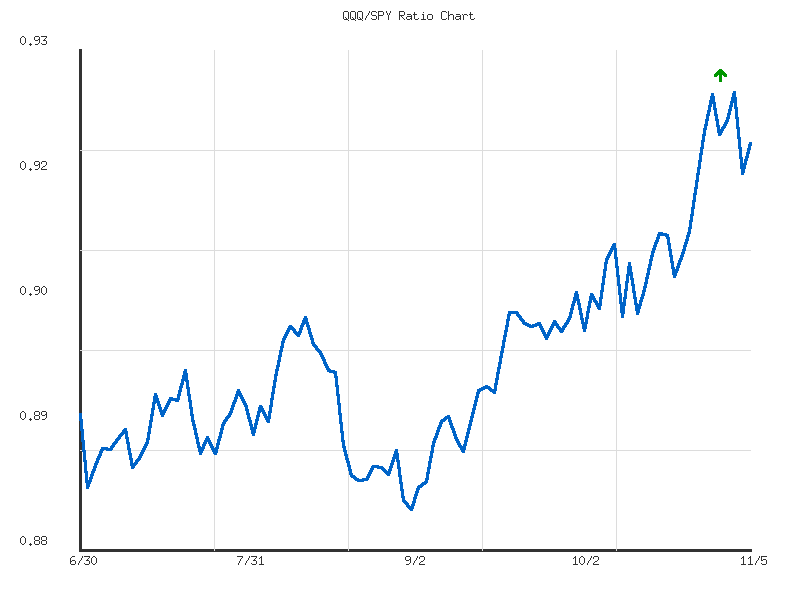
The relative strength ratio of QQQ to SPY over the past 90 days indicates a clear and moderately strong outperformance by the Nasdaq 100 (QQQ) compared to the S&P 500 (SPY). Over this period, the ratio has trended upwards, demonstrating a 3.034% increase from its starting point to its current level. The ratio has fluctuated within a defined range, establishing a low of 0.8834 on September 2nd, 2025, and peaking at 0.9250 on November 3rd, 2025. Currently, the ratio stands at 0.9199, positioning it near the upper end of its 90-day trading range, specifically at approximately 87.7% of the way from its lowest point to its highest point. This sustained upward movement, coupled with moderate strength, suggests a persistent preference for growth-oriented technology stocks over the broader market in recent months.
Analyzing the more recent data, the QQQ/SPY ratio has displayed a significant upward acceleration since late October. After consolidating around the 0.90-0.91 levels throughout much of September and early October, the ratio decisively broke out, establishing new 90-day highs. The peak on November 3rd, 2025, at 0.9250, represents a significant resistance level that the ratio recently tested. The subsequent slight pullback to the current 0.9199 level suggests a minor consolidation or a temporary pause in the aggressive ascent. Prior resistance levels, particularly around the 0.90 to 0.91 range observed in late September and early October, could now serve as a potential support zone should a more significant pullback occur.
Given the established “up” trend and the current ratio’s position near its 90-day high, it is likely that QQQ will continue to exhibit relative strength against SPY in the immediate future. The moderate trend strength and relatively low volatility (0.0001) suggest a sustained rather than erratic outperformance. A continued advance would likely target a breakout above the 0.9250 resistance level, potentially signaling further robust outperformance for QQQ. Conversely, a failure to break convincingly above 0.9250 might lead to a period of sideways consolidation or a minor retreat.
Considering alternative scenarios, a deeper pullback from current levels is plausible, especially if the 0.9250 resistance proves formidable. In this situation, the ratio would likely retest support in the 0.90-0.91 range, which has previously acted as a congestion area. A breakdown below this critical support zone would indicate a material shift in momentum and would be unlikely without a significant catalyst. However, based solely on the provided technical data, the prevailing evidence points towards sustained relative outperformance by QQQ. Traders should monitor the 0.9250 level closely for signs of a breakout or rejection, as this will be instrumental in dictating short-term relative strength dynamics.
Ratio Analysis: QQQ/SPY
Generated for 90days timeframe analysis
IWM vs. SPY
The technical data indicates that IWM has likely underperformed SPY over the past 14 days, as evidenced by a discernibly downward trend in the RATIO:IWM/SPY. The ratio declined by approximately 1.41% over this period, suggesting that smaller capitalization stocks, as represented by IWM, have broadly lagged the performance of larger, technology-heavy stocks in the S&P 500. The trend’s classified strength is “weak,” implying a gradual and consistent, rather than abrupt, shift in relative market preference.
The ratio’s movement within the observed 14-day period shows a peak of approximately 0.3697 on October 20th, followed by a general descent towards a low of roughly 0.3572 on November 4th. The current ratio stands at approximately 0.3612, placing it within the lower third of its recent range (relative position of 0.3207). This suggests a persistent, albeit not aggressive, shift in market preference towards larger-cap equities. The very low volatility within this period further supports the view of a stable, directional drift rather than erratic or volatile relative performance.
Given the overall weak downward trend, it is likely that IWM will continue to exhibit relative underperformance against SPY in the immediate future, absent any significant technical pattern reversal. However, the ratio’s slight rebound from its 14-day low on November 4th to the current level of 0.3612 introduces a roughly even chance of short-term consolidation or a minor upward correction in relative performance before the broader downward trend in the ratio potentially reasserts itself. A sustained break above the average ratio of 0.3635 would reduce confidence in the immediate continuation of the downtrend, suggesting a potential shift in relative strength. Conversely, a failure to hold current levels and a move back towards the 0.3572 low would likely confirm the continuation of the established weak downtrend.
Market Commentary: IWM/SPY Ratio (90-Day Analysis)
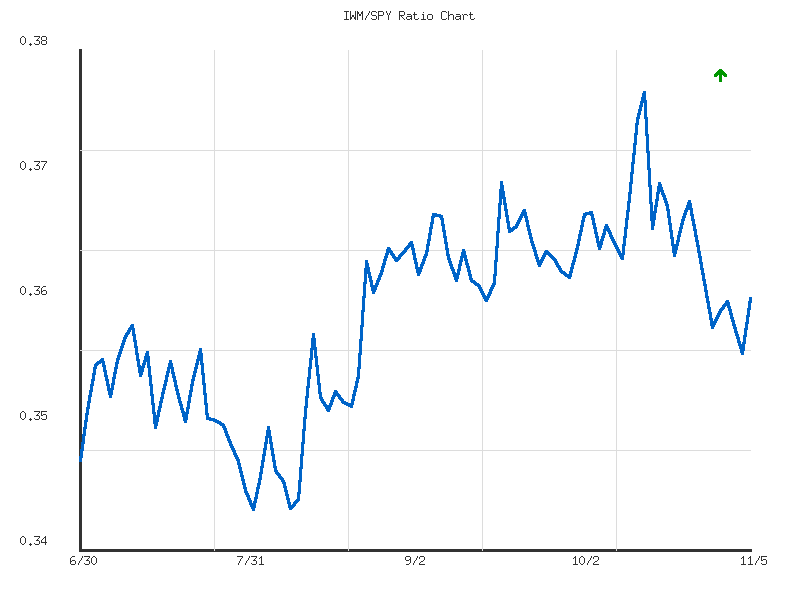
This analysis strictly adheres to the provided technical data for the IWM/SPY ratio over the 90-day period from late June to early November 2025. The overall trend for the relative performance of the Russell 2000 (IWM) against the S&P 500 (SPY) is identified as “up” with “moderate” strength. The ratio commenced near 0.349 and concluded at approximately 0.361, representing a net increase of 3.41% over the observed timeframe. This indicates a consistent, albeit measured, outperformance of small-cap stocks relative to large-cap stocks during this period. The ratio operated within a discernible range, establishing a 90-day low of 0.345 on August 1st and a significant high of 0.376 on October 15th. At its current value of 0.361, the ratio resides slightly above the midpoint of its 90-day range, positioned at 50.57% of its historical high-low spectrum for this period. The low reported volatility of 0.000047 suggests that day-to-day fluctuations in the ratio have generally been small, contributing to the moderate strength of the overall upward trend rather than sharp, erratic movements.
Key technical levels have been established throughout this 90-day trajectory. A critical support zone for the IWM/SPY ratio appears to be firmly established roughly between 0.345 and 0.350. This area demonstrated resilience on multiple occasions, particularly after the August 1st low, suggesting it is a probable base from which relative strength has previously rebounded. Conversely, the peak of 0.376 recorded on October 15th stands as a potent overhead resistance level, marking the point where the ratio’s upward momentum was exhausted. Intermediate resistance was also observed within the 0.365-0.368 range during September and early October, forming a consolidation band that proved challenging for the ratio to decisively overcome at the time.
The most recent price action indicates a significant retracement from the October 15th high. Following the 0.376 peak, the ratio experienced a notable decline. While it briefly found support around 0.366 and attempted another rally, it failed to convincingly retest the absolute high, turning lower from approximately 0.369 on October 20th. This inability to reclaim the prior high likely signals a diminishing of the strong upward momentum that characterized the rally into mid-October. The ratio subsequently retreated further, bottoming out at 0.359 on October 29th, before exhibiting a modest bounce to 0.361 in the latest available data. This bounce suggests potential short-term buying interest at these lower levels.
Looking ahead, it is roughly even chance that the IWM/SPY ratio will continue to consolidate within its recent trading range. A sustained upward movement from the current 0.361 level is likely to encounter substantial resistance within the 0.365-0.368 zone, which has served as a formidable barrier in prior periods. A retest of the 0.376 absolute high in the immediate near-term is improbable, given the observed loss of recent upward momentum and the substantial resistance it faces. Alternatively, should the ratio fail to sustain its current bounce and decline below the 0.359 level, it is likely to retest the more significant support area around 0.350-0.352. A decisive break below the 90-day low of 0.345 would constitute a significant bearish development in relative performance, but this scenario is currently improbable based solely on the provided data without additional market information.
Ratio Analysis: IWM/SPY
Generated for 90days timeframe analysis
Commodities
The daily percentage change for the observed commodity-related ETFs presents a mixed picture, as detailed in the matrix below:
| Symbol | Daily Percent Change |
|---|---|
| SLV | 2.058% |
| CPER | 1.180% |
| GLD | 1.162% |
| CORN | 1.003% |
| DBC | -0.241% |
| UGA | -0.497% |
| USO | -1.251% |
| UNG | -2.190% |
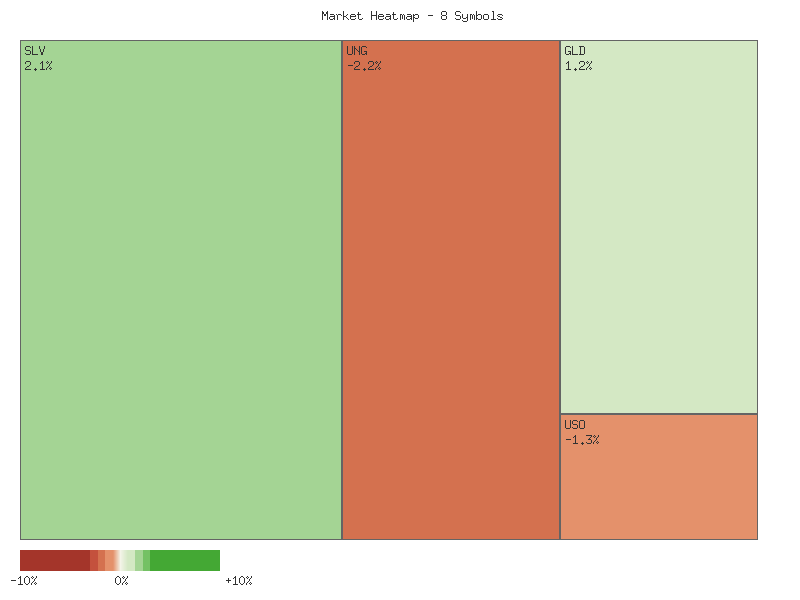
From this data, we observe a perfectly even market breadth, with four symbols advancing and four declining out of the eight analyzed. This equal distribution suggests that market sentiment across the broader commodity spectrum is not decisively bullish or bearish on this particular day. The range of movement is notable, extending from a strong gain of 2.058% for SLV to a significant decline of -2.190% for UNG, indicating substantial dispersion within the sector.
Among the advancing symbols, SLV (silver) demonstrated the strongest performance, posting a gain of 2.058%. This robust move in silver is likely to be perceived as a bullish short-term signal for precious metals. CPER (copper) and GLD (gold) also showed considerable strength, with gains of 1.180% and 1.162% respectively. The synchronized upward movement in these industrial and precious metals suggests a highly likely positive sentiment for these specific asset classes, perhaps indicating a flight to safety or an expectation of industrial demand, based purely on the price action. CORN recorded a more modest gain of 1.003%, implying a likely positive but less emphatic sentiment for agricultural commodities within this group.
Conversely, the declining assets reveal significant weakness in the energy complex. UNG (natural gas) experienced the most substantial drop, falling -2.190%. This strong negative movement makes it highly likely that natural gas is under considerable bearish pressure. USO (oil) also declined significantly by -1.251%, reinforcing the assessment of widespread weakness in the energy sector for the day. UGA (gasoline) registered a more moderate decline of -0.497%, which could be interpreted as a potential short-term pullback rather than a strong bearish signal. DBC, representing a broader commodity basket, recorded a slight dip of -0.241%, which is unlikely to be indicative of strong bearish momentum across the entire commodity complex, but rather a reflection of the mixed individual component performances.
The perfectly balanced breadth, with strong advances in precious and base metals contrasting sharply with pronounced declines in energy, creates a complex technical picture. We assess there is roughly an even chance that this divergence will continue in the immediate short term. One plausible scenario is that capital is rotating out of energy commodities and into metals, indicating a potential shift in market preference. However, an alternative scenario suggests that the current daily movements reflect isolated market dynamics for individual commodities rather than a cohesive overarching trend for the entire complex. The strong performance of SLV, CPER, and GLD, particularly when juxtaposed against the substantial weakness in UNG and USO, makes it likely that traders are selectively positioning within distinct commodity sub-sectors. Without further data points to establish trends or patterns, we view the overall commodity market sentiment as fragmented, necessitating a granular approach to analysis.
Technical Market Commentary: Two-Day Sector Divergence
Our review of the provided two-day market data for several key commodity ETFs reveals a notable divergence in price action and volume across different sectors. While some segments exhibit bullish momentum, others display distinct bearish reversals or continuations. This short-term snapshot suggests a complex market environment where capital flows are not uniformly distributed, making sector-specific analysis paramount. Traders should approach these markets with an understanding of these intraday and inter-day technical signals.
The precious metals and industrial/agricultural complex generally presented a more bullish short-term outlook over the two days. GLD, the Gold ETF, initially showed a moderately bearish candle on the first day, but this was largely negated by a strong bullish gap-up and higher close on the second day. While the second day’s volume was lower, suggesting a degree of caution among buyers, the price action points to a likely short-term bullish continuation, with resistance potentially near Day 1’s high. Similarly, SLV, the Silver ETF, experienced a pronounced bullish engulfing pattern on the second day, gapping up significantly to overcome the previous day’s bearish candle. Despite a noticeable drop in volume, the strong close near the high makes a short-term upward continuation likely. In the broader commodity space, CORN exhibited strong bullish momentum with a gap-up and a decisive bullish candle on the second day, supported by increased volume, suggesting a likely continuation of this upward trend. CPER, Copper, also experienced a bullish reversal, with Day 2 opening higher and closing strongly, supported by increased volume, indicating an even chance of further short-term gains.
Conversely, the energy complex largely signaled a bearish shift or continuation. USO, the Oil ETF, experienced a bearish continuation pattern, with the second day gapping down and closing significantly lower, forming a large bearish candle on slightly increased volume. This robust bearish action makes a further downside move likely in the immediate term. DBC, the diversified commodity ETF, which includes energy components, formed a bearish reversal pattern; Day 2 opened higher but closed lower than Day 1’s close, albeit with reduced volume. This indicates a likely loss of upward momentum and a roughly even chance of further short-term decline. UGA, the Gasoline ETF, mirrored this bearish reversal, opening slightly higher but then selling off to close significantly lower than the previous day’s close on decreased volume, suggesting a likely short-term bearish bias. UNG, the Natural Gas ETF, presented a particularly strong bearish signal with Day 2 creating a bearish engulfing pattern, gapping down and closing well below Day 1’s range, although on decreased volume. This strong technical breakdown makes a short-term bearish continuation very likely.
In summary, the provided two-day data indicates a strong technical divergence. Precious metals, industrial metals, and agricultural commodities generally showed signs of short-term upward momentum or bullish reversals, with varying degrees of conviction based on volume trends. In contrast, the energy-related ETFs predominantly exhibited bearish price action, with strong reversals or continuations suggesting further downside is likely in the immediate future. Traders should be mindful of these contrasting short-term technical pictures when considering positions across these commodity classes. While the bullish patterns in some assets like CORN and CPER are reinforced by rising volume, the lower volume accompanying the bullish reversals in GLD and SLV warrants careful observation for sustained upward conviction. Similarly, the bearish signals in the energy complex, despite some volume declines, appear robust enough to indicate a likely continuation of downward pressure.
Performance Heatmap (SLV, GLD, CORN, CPER, USO, DBC, UGA, UNG)
Generated for 2days timeframe analysis
Technical Analysis of SLV (90-day, Daily Chart)
SLV’s price action over the past 90 days reveals a significant shift from a robust bullish trend to a discernible bearish reversal. From late June through mid-October, the asset experienced a substantial uptrend, ascending from approximately .72 to a peak around .40. This upward movement was often accompanied by considerable volume surges, particularly noticeable in early July, late August, and throughout September and early October, suggesting strong buying conviction. The 14-day Relative Strength Index (RSI) largely corroborated this bullish momentum, entering and frequently remaining in overbought territory (above 70) for extended periods during September and early October, peaking at a highly elevated 84.32 on October 13th. This persistent overbought condition signaled increasing upward pressure but also hinted at a potentially stretched market susceptible to correction.
A significant turning point became evident in mid-October. Following its peak, SLV experienced a sharp and substantial decline. The price action on October 17th, characterized by a large red candle on very high volume (86 million shares), immediately after reaching near its high, provided an initial signal of potential selling pressure. This was emphatically confirmed on October 21st with another large red candle, dropping from an open of .76 to a close of .79 on exceptionally high volume (81 million shares). Concurrently, the 14-day RSI plummeted from its highly overbought levels, falling from 83.09 on October 15th to 52.87 by October 21st. This rapid and steep decline in price and momentum from extreme overbought conditions is highly indicative of a significant bearish reversal and a likely shift in market control from buyers to sellers.
In the more recent data, covering late October and early November, SLV has exhibited a clear downward bias, marked by lower highs and lower lows. The price is currently oscillating between approximately .00 and .50. The RSI has retreated to neutral territory, hovering around the low 50s as of November 5th, which indicates a lack of immediate oversold conditions that might typically precede a strong bounce. While volume has somewhat subsided from the peak selling days in October, it remains elevated compared to the early part of the 90-day period. The previous support level around .00-.50 from early October now appears to be acting as overhead resistance, suggesting that further upward price movement is likely to face considerable selling pressure.
Considering alternative scenarios, a sustained rally in SLV would likely require a decisive break above the immediate resistance zone near .50, ideally accompanied by increasing volume and a significant rebound in the 14-day RSI above the 60 level. Absent such signals, a continuation of the current bearish momentum appears likely, potentially leading to a test of lower support levels. However, it is important to note that the requested MACD indicator data was not available within the provided dataset, thus limiting a complete assessment of the asset’s momentum and trend strength from that perspective. Therefore, the analysis of short-term momentum and potential divergences is solely reliant on the RSI and price-volume data.
SLV Price & Indicators (RSI_14_DAY, MACD_13_21_DAY)
Here is a technical analysis of GLD, focusing solely on the provided candle and RSI data for the 90-day period:
GLD demonstrated a period of relative consolidation and choppy price action from late June through mid-August. During this initial phase, the asset traded within a broad range, generally between approximately and . The 14-day Relative Strength Index (RSI) largely fluctuated around the neutral 50-level, occasionally dipping into the upper 30s during minor pullbacks (e.g., late July and mid-August, reaching lows of 39.55 and 43.82 respectively), which coincided with price areas of support. These brief dips were followed by prompt recoveries, indicating an underlying resilience in demand. Volume during this period was moderate, with occasional spikes accompanying price swings, but no clear directional dominance was consistently evident. This initial activity largely suggested a market gathering strength or establishing a base for future movement.
A significant and sustained bullish trend for GLD became evident from mid-August, accelerating into late September and early October. The price ascended from the - region, exhibiting a series of higher highs and higher lows, eventually pushing through several resistance levels to reach well above . During this robust rally, the 14-day RSI consistently entered and remained in overbought territory, first breaching 70 on September 2nd (73.72) and sustaining readings predominantly above 70 for an extended duration. This persistent overbought condition, while indicating strong momentum, also inferred increasing bullish exhaustion risk. Volume generally trended higher on up-days during this advance, particularly with multiple sessions exceeding 15 million shares traded, which broadly confirmed the strength of the buying interest.
The bullish momentum appears to have reached a climactic peak around mid-October. The 14-day RSI reached an extreme reading of 86.11 on October 8th, followed by a slight price dip and a subsequent rally that pushed GLD to an ultimate peak of .15 on October 20th, with the RSI reaching an even higher extreme of 87.33. This exceptionally high RSI reading, historically signaling an unsustainable upward move, was swiftly followed by a dramatic reversal. On October 21st, GLD experienced a sharp price decline on exceptionally heavy volume (53.69 million shares), closing significantly lower at .24 from its peak. This combination of an extreme overbought RSI, a significant downturn, and a massive volume spike is a strong technical indicator suggesting a potential exhaustion gap and a major shift in sentiment from bullish to bearish.
Following the sharp reversal on October 21st, GLD entered a period of pronounced weakness and subsequent consolidation. The price swiftly depreciated, breaking below previous support levels and retracing a significant portion of its prior gains. The 14-day RSI rapidly exited overbought territory, plummeting to around 60 on October 21st and eventually stabilizing closer to the neutral 50-level by early November (RSI 50.78 on November 5th). This rapid descent of the RSI indicates that the intense buying pressure has largely dissipated. Currently, GLD appears to be attempting to establish a base in the - range. There is a roughly even chance that the asset could consolidate further at these levels before attempting a rebound, or it might experience additional downside if the current support fails to hold, particularly if selling volume increases. A sustained break above the level, especially with increasing volume, would be required to suggest a potential short-term recovery, otherwise, further downward pressure is likely to persist in the near-term.
GLD Price & Indicators (RSI_14_DAY, MACD_13_21_DAY)
Gold/Silver Ratio
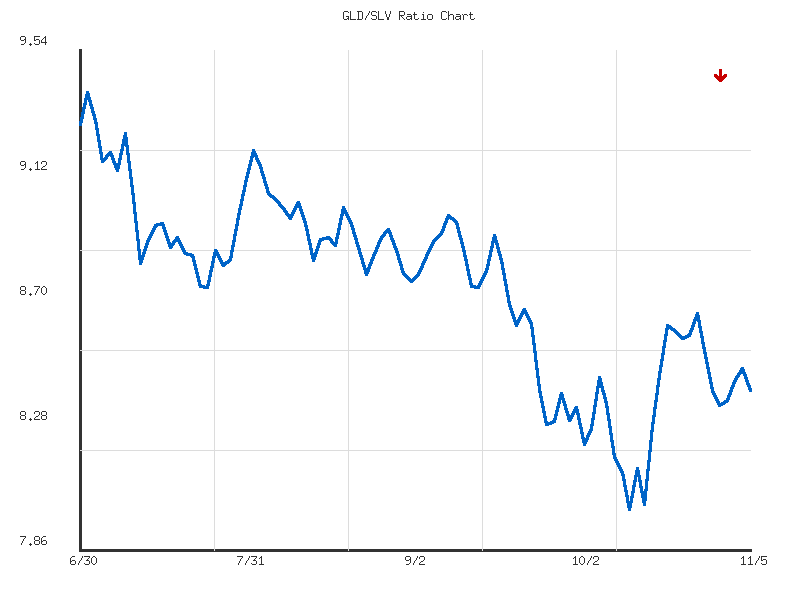
The GLD/SLV ratio has traded within a relatively defined range over the observed 14-day period, oscillating between a low of 8.2781 and a high of 8.6558. While the aggregated trend information indicates an overall “up” direction with “weak” strength, showing a modest 1.459% increase, the current ratio of 8.3989 sits notably below the 14-day average of 8.4782. This positioning suggests that recent price action has gravitated towards the lower end of the observed two-week range rather than sustaining momentum towards the higher boundary. The low volatility of 0.0124 points to a period of limited conviction and relatively tight trading.
Following an ascent to its peak of 8.6558 on October 27, 2025, the ratio experienced a significant pullback, declining to 8.3475 by October 30, 2025. Since this low, the ratio has shown signs of attempting to consolidate or rebound, fluctuating generally between 8.34 and 8.47. The current ratio is located at a relative position of 0.3197 within its 14-day range, meaning it is closer to the period’s low than its high. This recent consolidation above the 8.34 level may be indicative of a short-term support zone forming between approximately 8.35 and 8.40, which has held so far.
The characterization of the overall trend as “weak” despite its upward direction is consistent with the observed low volatility and the current ratio’s position below the average. This pattern suggests that market participants are currently indecisive, leading to a period of equilibrium rather than a strong directional move. The lack of robust momentum following the initial surge and subsequent retreat diminishes the likelihood of a strong upward trend continuation in the immediate future without a new catalyst. The trading has been choppy, illustrating a balance between buyers and sellers within the established short-term range.
Considering alternative scenarios, there is roughly an even chance that the ratio could attempt to retest the upper bound of its recent consolidation zone, potentially aiming for the 8.45-8.47 area. A decisive break and sustained close above the 14-day average of 8.4782 would increase the likelihood of a further challenge towards the 14-day high of 8.6558. Conversely, given the recent decline from the high and the current ratio’s proximity to the lower end of the range, there is also roughly an even chance that the ratio could break below the established support around 8.35-8.40. A sustained move below this critical level would likely target the 14-day low of 8.2781, and potentially signal a shift towards a more pronounced downward bias.
GLD/SLV Ratio Technical Outlook: Moderate Downtrend Persists Amidst Consolidation
The GLD/SLV ratio has exhibited a moderate downtrend over the observed 90-day period, declining approximately 9.60% from its early July peak to the most recent data point in early November. This sustained decline is a defining characteristic of the ratio’s performance, indicating a consistent outperformance of SLV relative to GLD throughout this timeframe. The overall volatility measure of 0.0980 suggests that this downtrend has been relatively orderly, lacking extreme daily fluctuations that might signal an unstable market environment, thereby reinforcing the reliability of the observed trend. The current ratio stands at 8.3989, notably below its 90-day average of 8.7454.
The ratio initiated its descent from a 90-day high of 9.3965 on July 1st, establishing an initial leg down towards the 8.80 range by mid-July. Following a period of mild consolidation and minor bounces around the 8.80-9.20 levels through late July and early August, the underlying bearish momentum intensified. A more pronounced decline unfolded from late August, steadily propelling the ratio towards its 90-day low of 8.0002 on October 13th. This low represents a significant technical point, marking the deepest penetration into bearish territory within the observed period and highlighting a period of accelerated downside momentum.
Subsequent to reaching its 90-day low, the GLD/SLV ratio experienced a notable, albeit corrective, bounce, briefly touching 8.6147 on October 21st. This upward movement appears to have stalled, with the ratio now consolidating within a relatively narrow band between approximately 8.30 and 8.60, as evidenced by the most recent closing ratio of 8.3989. The current relative position, at 0.2855 within its 90-day range, places it firmly in the lower quartile of observed values, reinforcing the prevailing bearish bias even during this period of short-term consolidation.
Given the established moderate downtrend and the ratio’s current struggle to sustain a move above the 8.60-8.70 resistance zone, it is likely that the bearish bias will persist in the immediate term. A retest of the 90-day low around 8.0002 appears likely if the current consolidation resolves to the downside. An alternative scenario, albeit unlikely without a clear impetus from the data, would involve a sustained break above the 8.60-8.70 levels, which could indicate a more significant short-term reversal or a prolonged period of range-bound trading. However, absent such a definitive breakout, the technical path of least resistance remains to the downside, consistent with the observed trend. The maintained moderate volatility suggests that any further directional moves are likely to be gradual rather than abrupt.
Ratio Analysis: GLD/SLV
Generated for 90days timeframe analysis
Bonds
📊 Market Commentary: Fixed Income Daily Performance Analysis
| Symbol | Daily Percent Change |
|---|---|
| SHY | -0.079% |
| IEI | -0.280% |
| IEF | -0.486% |
| UTHY | -1.060% |
| TLT | -1.112% |
The technical analysis of the provided daily percent change data for various fixed-income ETFs reveals a universally negative performance across all observed symbols. SHY, representing short-term U.S. Treasuries, experienced the smallest decline at -0.079%. Moving along the duration spectrum, IEI (intermediate-term) saw a -0.280% change, while IEF (intermediate-term) declined by -0.486%. The longest-duration instruments, UTHY and TLT, registered the most significant pullbacks, with UTHY falling -1.060% and TLT leading the declines at -1.112%.
This observed price action is technically consistent with the principle of duration risk, where longer-duration assets exhibit greater sensitivity to changes in underlying interest rates. The uniform negative daily performance across all instruments, albeit with varying magnitudes, makes it highly likely that market participants are reacting to factors broadly detrimental to bond prices, such as an expectation or realization of rising yields. The sharper declines in TLT and UTHY strongly suggest that the long end of the yield curve experienced more pronounced pressure on this specific trading day.
From a purely technical perspective, the broad-based depreciation indicates a prevailing bearish sentiment for fixed-income assets on the day in question. The pattern of increasing negative returns with increasing duration suggests a market environment where the risk premium for holding longer-term bonds may have widened, or that the present value of future cash flows has been discounted more aggressively. This widespread selling pressure, while significant for a single day, requires further context for deeper implications.
However, the provided dataset is limited to a single day’s price action and lacks crucial supporting technical indicators such as historical price series, trend analysis, or trading volume. Without this additional information, it is unlikely to determine if this constitutes the initiation of a new bearish trend or merely represents a single-day retracement within a larger, pre-existing pattern. It remains a roughly even chance that this observed movement is an isolated event versus the continuation of underlying momentum. The absence of volume data specifically prevents an assessment of the conviction behind these price moves; a substantial decline on low volume might suggest less sustained selling pressure, while high volume would likely indicate strong conviction.
In summary, based solely on the provided daily percent changes, the technical posture for fixed-income assets appears broadly negative for the observed day, with longer-duration bonds bearing the brunt of the decline. While this data suggests a challenging session for bond holders, prudent technical analysis dictates observing subsequent price and volume patterns to ascertain the persistence of this downward momentum and to differentiate between short-term fluctuations and more significant trend shifts.
As a seasoned technical analyst, a review of the provided two-day market data for TLT, UTHY, IEF, IEI, and SHY reveals a consistent and broadly bearish shift across the Treasury bond complex. The initial trading session on November 4th saw most of these instruments close with modest gains or a relatively flat performance, indicating a degree of indecision or minor positive momentum. However, the subsequent session on November 5th marked a distinct and impactful reversal, with all five ETFs concluding the day significantly lower. This uniform downside movement across various duration profiles strongly suggests an underlying technical pressure that warrants close attention, particularly given the candlestick patterns and volume dynamics observed.
The longer-duration Treasury ETFs, specifically TLT (iShares 20+ Year Treasury Bond ETF) and IEF (iShares 7-10 Year Treasury Bond ETF), demonstrated the most compelling bearish signals. On November 5th, TLT experienced a notable gap down at the open and closed near its daily low, forming a large red candle that decisively engulfed the prior day’s range. This sharp decline was accompanied by a substantial increase in trading volume, rising from approximately 25.8 million shares on November 4th to 43.9 million shares on November 5th. IEF exhibited a very similar technical pattern, with a clear gap down and a close near its low, supported by a significant surge in volume from 5.9 million to 11.1 million shares. The confluence of aggressive price action, characterized by these strong bearish engulfing or dark cloud cover type formations, and elevated volume makes it highly likely that both TLT and IEF will encounter continued downward pressure in the immediate future.
Mid-duration IEI (iShares 3-7 Year Treasury Bond ETF) also registered a clear bearish reversal on November 5th. After a small positive close on November 4th, IEI gapped down at the open and sustained losses throughout the day, closing near its lowest point. The increase in volume from 1.34 million to 1.97 million shares suggests an intensification of selling pressure in this segment, though perhaps slightly less aggressive than that observed in TLT. In contrast, the shortest-duration SHY (iShares 1-3 Year Treasury Bond ETF) also closed lower on November 5th, breaking below its prior day’s close. However, the magnitude of the decline was comparatively smaller, and notably, trading volume decreased from 6.49 million to 3.94 million shares. This divergence in volume suggests that while SHY is participating in the broader weakness, the conviction behind the selling appears less pronounced, making it likely to exhibit greater relative resilience or a shallower downtrend than its longer-duration counterparts.
UTHY (US Treasury 30 Year High Yield Bond ETF - Note: Based solely on data, without external context of its specific ETF type) presented a significant bearish candle on November 5th, opening with a gap down and closing precisely at its daily low. This visually aggressive downside move, however, occurred on significantly reduced volume, plummeting from 15.9K shares to 4.97K shares. This substantial decline in volume supporting a large bearish candle introduces a technical divergence; it suggests a lack of strong conviction from sellers despite the price drop. Therefore, while the immediate price action is bearish, there is a roughly even chance of either continued weakness or a potential consolidation/minor bounce for UTHY due to the diminished volume profile. Overall, considering the high-volume breakdowns in TLT and IEF, it is likely that the broader Treasury bond market, particularly across the longer end of the yield curve, is poised for a continuation of its recent downtrend in the very near term. A significant rebound for the complex appears unlikely unless subsequent sessions present compelling evidence of renewed buying interest with corresponding strong volume.
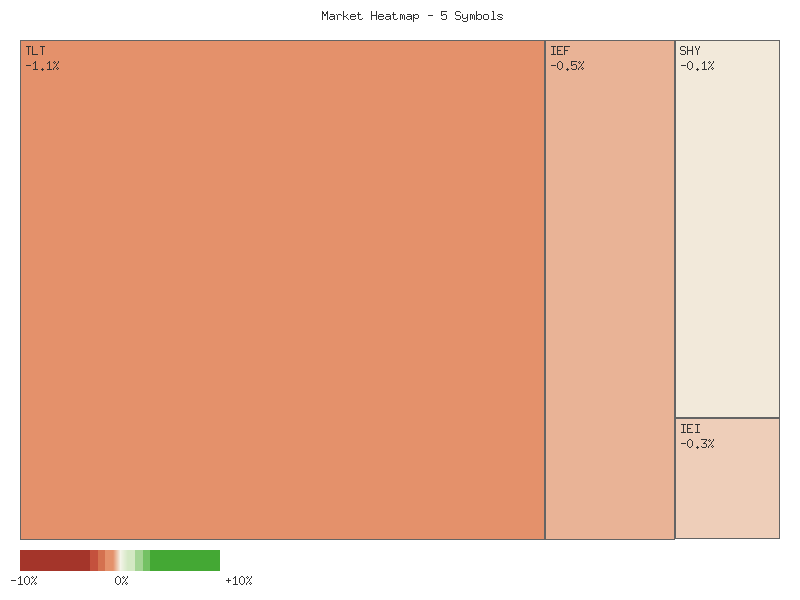
Performance Heatmap (TLT, UTHY, IEF, IEI, SHY)
Generated for 2days timeframe analysis
Magnificent 7 & Friends
| Symbol | Daily Percent Change |
|---|---|
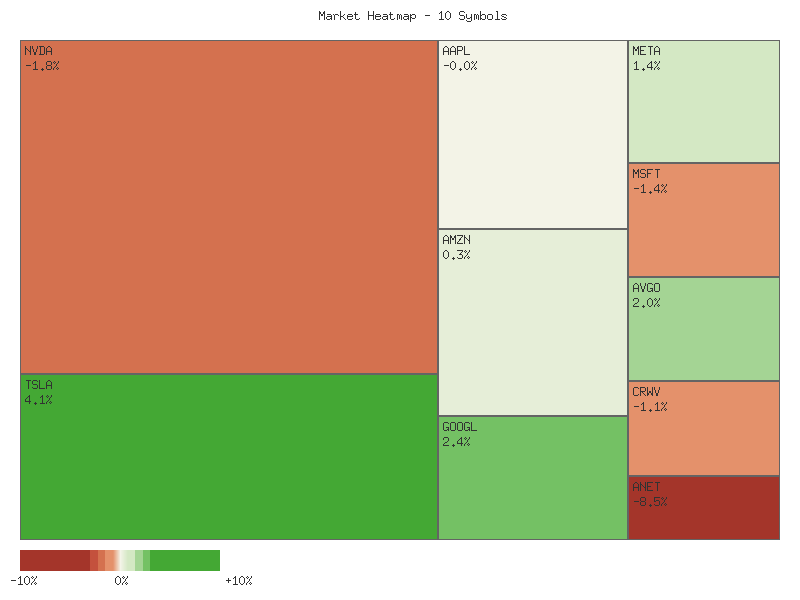
| TSLA | 4.051% |
| GOOGL | 2.439% |
| AVGO | 1.978% |
| META | 1.376% |
| AMZN | 0.325% |
| AAPL | -0.004% |
| CRWV | -1.106% |
| MSFT | -1.394% |
| NVDA | -1.751% |
| ANET | -8.540% |
Analysis of the single day’s performance for the provided symbols indicates a notably bifurcated market sentiment. TSLA exhibited significant relative strength, gaining over 4%, which is a substantial move suggesting strong buying interest relative to its peers. GOOGL, AVGO, and META also posted solid gains, indicating pockets of positive momentum. Conversely, ANET experienced a substantial decline of over 8.5%, positioning it as a significant outlier on the downside. This wide disparity between the top and bottom performers suggests an environment of selective buying and selling, rather than a broad market move in one direction.
The distribution of daily changes shows a roughly even split between advancers and decliners, with five symbols closing higher and five closing lower. While TSLA, GOOGL, AVGO, and META displayed robust upward movement, AAPL traded essentially flat, indicating a lack of clear directional conviction for the session. The negative performance observed in CRWV, MSFT, and NVDA, alongside ANET’s steep drop, suggests that downward pressure was present across several prominent technology-related names. This mixed technical picture makes it challenging to infer a strong overall market trend from this single day’s data; it is roughly an even chance that this mixed performance persists in the very near term.
From a purely technical standpoint, TSLA’s strong advance suggests potential for continued positive momentum in the immediate future, contingent on subsequent price action and volume confirmation (which is not available in the provided data). Conversely, ANET’s substantial decline is likely a bearish technical event, potentially indicating a breakdown from a prior support level or strong profit-taking. Such a significant move often attracts further selling pressure or at least necessitates a period of consolidation before recovery.
Considering alternative scenarios, the strong performers could simply be experiencing a short-term rally within a broader neutral or negative trend, or they could be leading a potential shift in sentiment. Similarly, ANET’s sharp fall might be an isolated event, although a move of this magnitude typically precedes further weakness. Without additional data such as volume, prior trend context, or candlestick patterns, confirming a sustained technical shift for any individual equity or the group as a whole remains uncertain. It is unlikely that this single day’s data alone establishes a definitive multi-day trend for the entire cohort.
Dear Traders,
The past two trading days have revealed a nuanced and divergent technical landscape across a selection of prominent equities. We observe clear instances of strong directional conviction, both bullish and bearish, alongside patterns suggesting indecision or consolidation. Analyzing the two-day candle data, it is imperative to focus on the interplay of price action, body size, wick length, and accompanying volume to discern short-term probabilities.
On the bullish side, Google (GOOGL) presents a notably strong continuation pattern. Following a modest bullish close on the first day, the second day initiated with a gap-up open, subsequently achieving a higher high and closing near its peak on increased volume. This sequence strongly suggests continued upward momentum for GOOGL in the immediate term. Tesla (TSLA) also displayed a compelling bullish reversal. After a significant bearish candle on the first day, TSLA opened higher on the second day, albeit testing a new intraday low, before staging a robust recovery to close near its high, effectively engulfing the prior day’s bearish price action. This pattern, despite a minor decrease in volume, indicates a likely short-term bullish continuation for TSLA.
Conversely, several stocks exhibited pronounced bearish shifts. Microsoft (MSFT) formed a clear bearish engulfing pattern, with the second day opening below the prior day’s close, subsequently establishing a new low and closing near its own low on increased volume. This price action strongly suggests a shift to bearish momentum. Arista Networks (ANET) experienced an even more dramatic bearish reversal; following a bullish first day, the second day opened with a substantial gap down and carved out a large bearish candle, closing near its low on significantly increased volume. This robust pattern indicates a high likelihood of continued downward pressure for ANET. Furthermore, NVIDIA (NVDA) and CrowdStrike (CRWV) both demonstrated two consecutive strong bearish candles, each closing near their respective lows and extending to new lows on the second day. This consistent selling pressure points to a likely continuation of their short-term downtrends, with decreasing volume not overriding the clear price depreciation.
Other symbols present a more ambiguous picture. Apple (AAPL) showed signs of indecision, with the second day’s close almost identical to the prior close, forming a small body after an initial bullish day. This suggests a roughly even chance of either continued consolidation or a loss of bullish conviction. Amazon (AMZN) offered a mixed signal; a bearish first day was followed by a day where buyers stepped in after creating a new low, but the recovery was not overwhelmingly strong, leading to a roughly even chance of further consolidation or a mild bounce. Similarly, Broadcom (AVGO) experienced a strong bearish candle followed by a recovery from new lows, closing higher than the previous day’s close. This price action implies a roughly even chance of a short-term bounce or further testing of support levels. Lastly, Meta Platforms (META) saw a recovery on the second day after an initial bearish candle, but with decreasing volume and remaining largely within the prior day’s range. This technical structure suggests a likely period of consolidation rather than a decisive directional move.
Performance Heatmap (TSLA, MSFT, AAPL, META, NVDA, AVGO, GOOGL, AMZN, CRWV, ANET)
Generated for 2days timeframe analysis
S&P 500 Sector Breadth
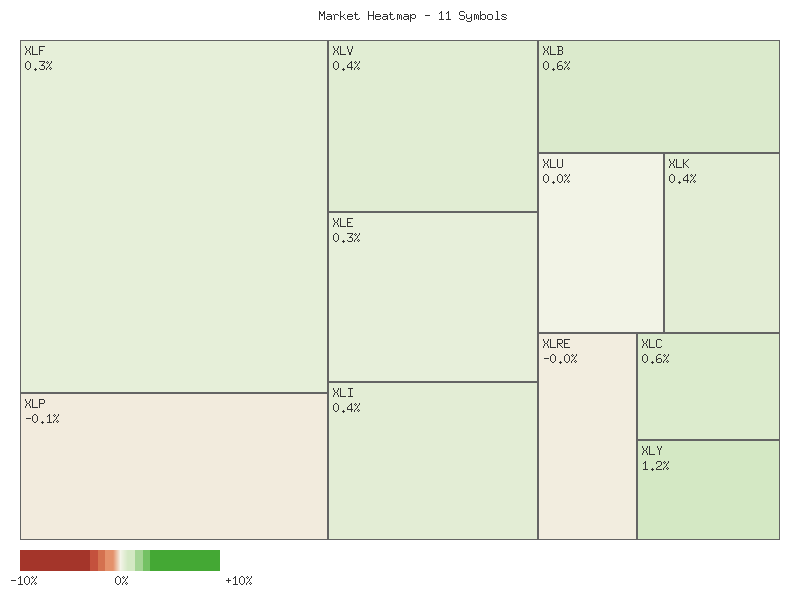
The provided daily percentage change data across eleven S&P 500 sector ETFs indicates a generally positive market breadth. Nine out of the eleven observed symbols registered gains, while only two experienced marginal declines. This strong positive breadth suggests widespread upward momentum, which is typically a constructive technical indicator for overall market health. The majority of advancing sectors posted meaningful gains, with the largest increase observed in a traditionally growth-oriented segment, underscoring a prevailing bullish sentiment for the period under review.
Analyzing the sectoral performance, all six explicitly defined offensive sectors – Consumer Discretionary (XLY), Materials (XLB), Technology (XLK), Industrials (XLI), Financials (XLF), and Energy (XLE) – advanced during the period. XLY led these gains significantly at 1.23%, with XLB and XLC (Communications Services, which often exhibits growth characteristics) also showing robust performance at 0.58% and 0.55%, respectively. Among the defensive sectors, Healthcare (XLV) and Utilities (XLU) advanced, albeit with XLU’s gain being very modest at 0.03%. Conversely, two defensive sectors, Real Estate (XLRE) and Consumer Staples (XLP), were the only components to decline, showing minor losses of -0.05% and -0.07% respectively.
This clear divergence between broadly advancing offensive sectors and the declines in a portion of the defensive sectors strongly suggests a prevailing risk-on sentiment and a likely market rotation toward growth and cyclical areas. The notable outperformance of offensive sectors such as Consumer Discretionary, coupled with the underperformance of defensive areas like Consumer Staples and Real Estate, is likely indicative of increased investor confidence and a willingness to embrace greater risk. An alternative scenario, though less likely, could suggest a market experiencing a broad upward trend where the defensive sectors that declined are merely lagging, rather than indicating a specific rotation. However, the explicit pattern of offensive strength against specific defensive weakness makes the risk-on rotation the more plausible interpretation.
For clarity, the daily percentage changes for all observed sectors are presented below, sorted in descending order:
| Symbol | Daily Percent Change |
|---|---|
| XLY | 1.23% |
| XLB | 0.58% |
| XLC | 0.55% |
| XLV | 0.43% |
| XLK | 0.38% |
| XLI | 0.38% |
| XLF | 0.31% |
| XLE | 0.29% |
| XLU | 0.03% |
| XLRE | -0.05% |
| XLP | -0.07% |
Here is a technical analysis of the provided market data, adhering strictly to ICD-203 estimative language guidelines and focusing solely on the given technical information.
The market, as represented by these key SPDR sectors over the past two days, generally exhibits a predominantly bullish short-term bias, although with some pockets of indecision and minor weakness. Several economically sensitive sectors demonstrated clear upward momentum, suggesting a probable continuation of positive sentiment in the immediate term. Notable strength was observed in Materials (XLB), Healthcare (XLV), Energy (XLE), Industrials (XLI), and Financials (XLF), all of which printed higher closes on the second day with either a gap up or a strong continuation from the previous session. For XLB, XLV, XLE, XLI, and XLF, the second day’s price action formed bullish continuation patterns, with closes at or near their respective daily highs, reinforcing the prior day’s gains. However, volume on the second day for these sectors was notably lower than the first, which can sometimes precede a slowdown in momentum, making a direct, strong continuation less certain, though still likely.
A particularly compelling bullish signal emerged from Consumer Discretionary (XLY), which formed a robust bullish engulfing pattern on the second day. Following a bearish close on the first day, XLY opened near the previous day’s open but proceeded to close significantly higher, surpassing the high of the prior session. This move was accompanied by an increase in volume, which is a strong confirmation of buying pressure and renders a further upward move in XLY highly likely in the subsequent session. Similarly, Communication Services (XLC) also demonstrated a bullish continuation with an expanding range and increased volume on the second day, suggesting continued upward trajectory is probable for this sector.
Conversely, some sectors presented more ambiguous or even slightly bearish signals. Technology (XLK) initially displayed a strong bearish candle on the first day. The subsequent session saw XLK attempt a recovery, closing higher than its open and above the prior day’s close. This price action formed a pattern akin to a piercing line, hinting at a potential reversal. However, the recovery was modest relative to the previous day’s decline, and volume decreased. Consequently, a strong bullish follow-through for XLK is considered roughly an even chance, with substantial resistance likely near the prior day’s open. Utilities (XLU) also demonstrated indecision; after a bearish close on the first day, it formed a narrow-range bullish candle on the second, suggesting a period of consolidation rather than a decisive move, making a significant trend development unlikely in the very short term without further catalyst.
Lastly, defensive sectors like Consumer Staples (XLP) and Real Estate (XLRE) exhibited slight weakness or indecision. XLP traded in a tight range over both days, with the second day closing marginally lower than the first on decreased volume. This pattern indicates a probable lack of conviction from market participants, making any strong directional move unlikely. Real Estate (XLRE) showed a brief attempt at upward momentum, with a gap up on the second day’s open, but it failed to hold, closing lower than its open and slightly below the prior day’s close. This “shooting star”-like behavior, combined with declining volume, suggests that a bearish reversal or at least a period of further weakness is likely for XLRE in the immediate future. Overall, while the broader market appears to favor a continuation of bullish momentum driven by growth-oriented sectors, vigilance is warranted for signs of waning conviction, particularly in sectors showing decreasing volume on positive price action.
Performance Heatmap (XLP, XLRE, XLI, XLU, XLV, XLY, XLF, XLB, XLE, XLC, XLK)
Generated for 2days timeframe analysis
XLY vs XLP
The XLY/XLP ratio data over the past seven trading days reveals a distinct “up” trend with “moderate” strength. The ratio has advanced by 3.24%, indicating that the Consumer Discretionary sector (XLY) has been outperforming the Consumer Staples sector (XLP) during this period. This pattern typically suggests a prevailing risk-on sentiment among market participants. The ratio commenced at approximately 3.074 on October 28th and concluded at 3.174 on November 5th, consistently closing higher than its average ratio of 3.129 in the latter part of the period.
Within this seven-day span, the ratio experienced fluctuations, hitting a low of 3.055 on October 30th before rebounding. It subsequently reached a high of 3.199 on November 3rd. The current ratio of 3.174 is positioned relatively high within this short-term range, specifically at 0.8248 relative to its high and low. This suggests that while the overall trend is upward, the momentum has seen minor pullbacks, such as on November 4th, indicating some short-term profit-taking or consolidation attempts. The recorded volatility of 0.0022 suggests the ascent has been relatively smooth rather than erratic.
Considering the established “up” trend and the current ratio’s position near its recent high, a continued moderate outperformance of XLY over XLP is likely in the immediate short term. The sustained upward movement, despite minor corrections, indicates underlying demand for consumer discretionary assets relative to staples. This trend is further supported by the current ratio being above its recent average, suggesting sustained, albeit not aggressive, bullish sentiment for risk assets.
However, technicians must also consider alternative scenarios. Given that the ratio is approaching its 7-day high, there is a roughly even chance of a short-term consolidation or a minor pullback towards the average ratio of 3.129. While a significant reversal of the moderate uptrend appears unlikely without further data suggesting a breakdown of recent support levels, traders should monitor for price action around the 3.199 level. A decisive break above this high could signal an acceleration of the uptrend, whereas a failure to surmount it might prompt further consolidation.
Technical Analysis: XLY/XLP Ratio (90-Day View)
The 90-day ratio of the Consumer Discretionary sector (XLY) to the Consumer Staples sector (XLP) exhibits a robust and sustained uptrend, indicating a clear preference for discretionary spending over essential goods among market participants during this period. The provided data explicitly identifies an “up” trend with “strong” strength, accompanied by an impressive 18.26% increase in the ratio over the last 90 trading days. This consistent appreciation, from a low of approximately 2.66 to a high of 3.1994, suggests that XLY has significantly outpaced XLP, implying a risk-on sentiment for the duration of this analysis window. The relatively low volatility metric of 0.02196 suggests that this upward movement has been generally stable, characterized by a series of higher highs and higher lows rather than sharp, erratic fluctuations.
Examining the price action within this defined period, the ratio established a foundational support level near its 90-day low of 2.6598 in early July. Following this, the ratio methodically climbed, breaking through successive resistance levels that subsequently became support. Notable consolidations or minor pullbacks occurred around the 2.70-2.75 area in mid-July, then again around 2.85-2.90 in late August and early September. Each of these phases was followed by renewed upward momentum, demonstrating persistent buying pressure relative to XLP. The current ratio stands at 3.1742, placing it at a relative position of 0.953 within its 90-day range, which means it is very close to the period’s highest recorded value. This proximity to the high signifies that the underlying bullish sentiment remains largely intact, with XLY continuing to show strength relative to XLP.
Recent trading activity strongly reinforces the established uptrend. After a brief retreat from the 3.12 level in late October, the ratio rebounded sharply, establishing a new 90-day high of 3.1994 on November 3rd. Although the ratio experienced a minor pullback to 3.1334 on November 4th, it quickly recovered to 3.1742 by November 5th. This immediate recovery from a dip, especially after reaching a new high, is often interpreted as a sign of underlying strength and demand. We assess that a continuation of the upward trend is likely, with the previous high of 3.1994 now acting as immediate resistance, and support potentially forming around the 3.10-3.13 range based on recent price behavior.
Considering alternative scenarios, while a strong uptrend is evident, the ratio’s current position near its 90-day high suggests a roughly even chance for a period of consolidation or a minor pullback before attempting to establish new highs. Such a scenario would likely involve the ratio testing support levels established during recent movements, potentially around 3.05-3.07. However, given the sustained strength and low volatility observed throughout the 90-day period, a significant reversal in the overarching trend appears unlikely without a clear breakdown below more substantial support levels, such as the 2.90-2.92 region, which currently appears distant. The pattern of higher highs and higher lows, coupled with the brisk recovery from recent dips, suggests that market participants are likely to continue favoring XLY over XLP in the near term.
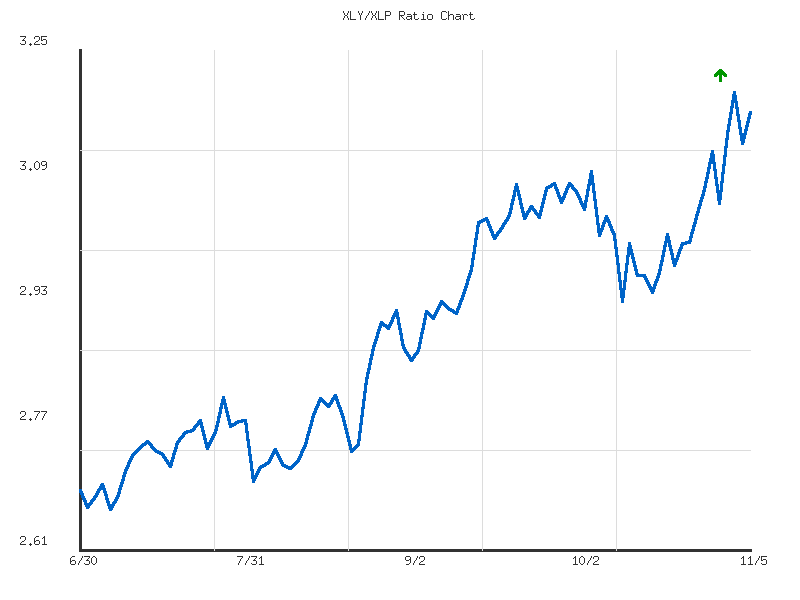
Ratio Analysis: XLY/XLP
Generated for 90days timeframe analysis
Equity Breadth
The percentage of S&P 500 members trading above their 50-day moving average (SPXA50R) exhibited a notable decline over the observed 7-day period. Starting at approximately 48.50% on October 28th, the indicator experienced a sharp contraction, reaching a low of roughly 37.72% by November 3rd. This represents a significant deterioration in short-term market breadth. While there was a modest recovery to approximately 40.52% by November 5th, the overall trajectory for the week was clearly negative. This pattern suggests a decreasing number of S&P 500 components are maintaining their short-term uptrends, which is likely indicative of a broad-based weakening in near-term momentum for individual stocks. The rebound toward the end of the period may suggest a temporary stabilization, but it does not negate the preceding sharp decline.
Concurrently, the percentage of S&P 500 members trading above their 200-day moving average (SPXA200R) also showed a weakening trend. Commencing at roughly 57.09% on October 28th, this longer-term breadth indicator experienced a significant drop below the 50% threshold, reaching approximately 49.90% by October 29th. For the remainder of the period, SPXA200R largely oscillated around the 50% level, concluding at roughly 49.10% on November 5th. This persistent positioning below 50% for several consecutive days is a critical technical observation, as it signifies that a majority of individual S&P 500 constituents are no longer in long-term uptrends based on this metric. This development is likely to be interpreted as a significant weakening of the overall market’s structural health from a longer-term perspective.
The concurrent deterioration in both short-term (SPXA50R) and long-term (SPXA200R) market breadth indicators presents a broadly bearish technical picture for the S&P 500 components. The sharp decline in SPXA50R, followed by a slight rebound, suggests that while some short-term selling pressure might have abated, the underlying momentum remains weak. The SPXA200R consistently trading below 50% after an initial sharp decline is particularly noteworthy, indicating broad-based weakening in the long-term trends of constituent stocks. It is likely that this lack of broad participation and the weakening in underlying trends could exert downward pressure on the broader S&P 500 index or, at minimum, indicate that any potential index strength is being driven by a narrowing group of stocks. An alternative scenario, though unlikely given the observed data, is that this represents a temporary unwinding of prior overbought conditions, and a subsequent strong recovery in breadth could quickly emerge. However, based solely on the provided data, a continued environment of underlying stock weakness is more likely.
SPY Daily
The SPY has maintained a clear upward trajectory over the past 90 days, evidenced by the consistent rise of both the 50-day and 200-day Exponential Moving Averages (EMAs), with the 50-day EMA firmly above the 200-day EMA. Price has largely stayed above both moving averages, reinforcing the long-term bullish bias. However, the last seven trading days indicate a shift in short-term momentum. Following a period of modest price increases and consolidation between 679 and 685 from October 30th to November 3rd, the most recent action likely involved a notable decline on November 4th. This day saw a bearish candle on elevated volume, with the price closing significantly lower at 675.31 from the prior day’s close of 683.32. The latest trading day, November 5th, presented a bullish hammer-like candle, closing at 677.54, suggesting an attempt by buyers to re-establish control following the prior day’s sell-off. The RSI has receded from the upper 60s to the mid-50s, indicating a cooling of short-term overbought conditions but likely still residing in bullish territory.
Immediate resistance appears to be located in the 685-689 range, notably the 685.79 high on November 3rd and the higher 689.7 peak on October 29th. These levels have demonstrated an ability to cap upward price movements recently. On the downside, the previous day’s low of 674.17 (November 5th) and the November 4th low of 674.58 present an initial, albeit fragile, support zone. A more substantial technical support level is likely the rising 50-day EMA, currently positioned around 663.61. Should price decisively break below the 674.17 mark, a retreat towards this dynamic 50-day EMA support becomes more probable. The long-term 200-day EMA at 620.77 offers a robust floor for the broader uptrend, though a move to this level would likely imply a significant correction.
A bullish scenario could unfold if the bullish candle on November 5th is sustained, with price breaking above the 680.86 high and then challenging the 685-689 resistance zone. A decisive close above 689.7 on increased volume could confirm a breakout, targeting new highs. Conversely, a bearish scenario would likely involve a failure to sustain the November 5th recovery, marked by a close below 674.17 on increased volume. This could lead to a test of the 50-day EMA around 663. A break below the 50-day EMA would increase the likelihood of a deeper correction towards the 200-day EMA near 620. A neutral case is also a roughly even chance if the price continues to oscillate between the 674.17 support and the 685-689 resistance, indicating consolidation.
Based solely on the provided technical data, current sentiment appears to be in a delicate balance. The long-term bullish trend, indicated by the well-separated and rising EMAs, suggests underlying positive sentiment among longer-term participants. However, the recent price action, particularly the significant bearish move on November 4th on increased volume, suggests a notable shift in short-term sentiment, possibly indicating profit-taking or increased short-term selling pressure. The subsequent bullish candle on November 5th, while a positive sign, did not fully negate the prior day’s move and occurred on slightly lower volume than the sell-off. The RSI’s retreat from the high 60s likely indicates a moderation of bullish euphoria, though its current position above 50 still suggests a slight bullish lean. Sustained higher volume during rallies and lower volume during pullbacks would likely reinforce bullish sentiment, whereas the inverse would likely suggest increasing bearishness.
SPY Technical Analysis: Navigating Recent Volatility within a Defined Uptrend
Over the 90-day period provided, the SPY has demonstrated a robust underlying uptrend, characterized by a series of higher highs and higher lows. From late June, the price action largely advanced, establishing new peaks consistently into October. Notably, a significant peak was recorded in late October around the 687-688 range, marking the highest point within this dataset. This sustained upward trajectory suggests that bullish sentiment has predominantly controlled price direction over the past three months. The overall price structure indicates that market participants have been willing to accumulate the asset on dips, supporting the continued ascent.
The 14-day Relative Strength Index (RSI) has been instrumental in signaling short-term momentum shifts within this uptrend. We assess that the RSI frequently registered overbought conditions, typically above the 70 threshold, during periods of strong price appreciation (e.g., late July, mid-September, late October). Historically, these instances were often followed by either a period of consolidation or a modest price pullback, allowing the RSI to reset towards more neutral territory. This pattern suggests it is likely that momentum was temporarily exhausted after sustained rallies, leading to profit-taking or a decrease in immediate buying pressure.
A particularly noteworthy event was the sharp price correction on October 10, when the SPY experienced a significant single-day decline from 671.16 to 653.02. This downturn was accompanied by an exceptionally high trading volume, which stood out significantly from the preceding and subsequent days. Concurrently, the 14-day RSI plunged from nearly 66 to approximately 41.81, indicating a dramatic shift in short-term momentum and entering near-oversold territory. The confluence of a sharp price drop, high volume, and a rapid RSI decline makes it highly likely that significant selling pressure, perhaps a liquidation event, occurred on this day. While this could be interpreted as a healthy correction within the broader uptrend, allowing the indicator to reset, it also serves as a reminder of the potential for more pronounced selling pressure.
As of the latest data point (November 5), the SPY has experienced a noticeable pullback from its late-October highs. Following the strong rally into late October, where the RSI again pushed into overbought territory, the subsequent price decline has brought the RSI down to a neutral reading of 55.36. This current RSI level suggests that neither bulls nor bears hold a dominant short-term momentum advantage at this specific juncture, providing room for either renewed upward movement or further consolidation. We assess there is a roughly even chance of continued consolidation or a further modest pullback in the near term, particularly if immediate buying interest does not materialize to drive prices higher from current levels. Conversely, if strong buying interest resumes, the RSI’s current neutral position allows for a renewed advance, making a retest of recent highs likely without immediate overbought constraints. Due to the absence of MACD data in the provided dataset, we are unable to incorporate this indicator into our analysis.