Daily Market Technical Analysis
The broader market indices (SPY, QQQ) and growth-oriented equities exhibit pervasive bearish momentum, with significant declines confirmed by increased volume for most major names, suggesting a highly likely continuation of downside pressure. S&P 500 sector breadth likely indicates a shift towards defensive positioning, as Financials and Health Care show resilience while Technology and Energy sectors face strong downside pressure. The VIX is in a clear upward trend, likely reflecting increasing market apprehension and further volatility. In commodities, precious and industrial metals are experiencing very likely strong selling pressure, contrasting with likely continued robust bullish momentum in Natural Gas. Longer-duration bonds show price gains with a roughly even chance for consolidation due to declining volume, while shorter-duration bonds likely continue their upward bias with stronger conviction. Overall, investors should likely anticipate continued equity market weakness, particularly in growth sectors, with defensive strategies and select commodity plays showing more probable resilience.
Market Indices
The following technical analysis is based exclusively on the provided daily percent change data for the specified index ETFs.
| Symbol | Daily Percent Change |
|---|---|
| MDY | -0.859% |
| IJR | -1.195% |
| SPY | -1.172% |
| OEF | -1.275% |
| IWM | -1.711% |
| QQQ | -2.040% |
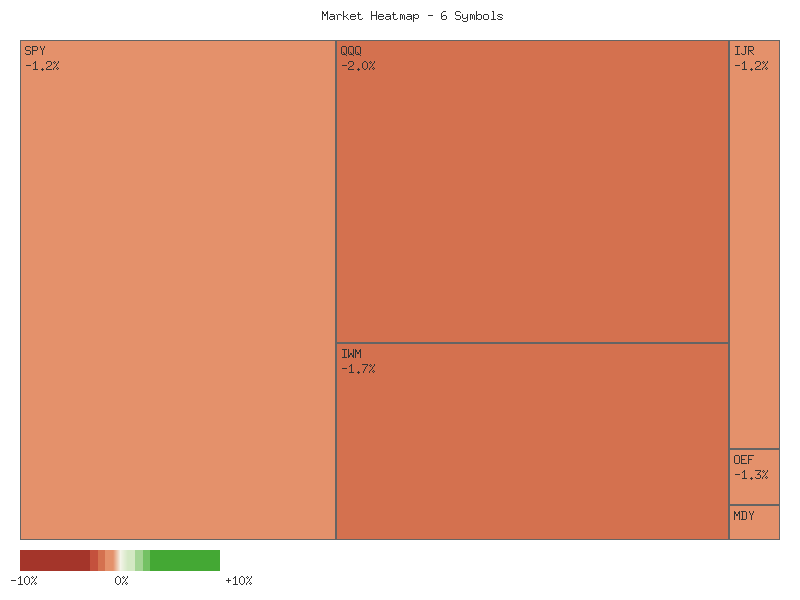
An analysis of the provided daily percentage changes reveals a uniformly negative performance across all six tracked broad market indices. All symbols concluded the observed period with declines, ranging from -0.859% for MDY (S&P MidCap 400) to -2.040% for QQQ (Nasdaq 100). This pervasive weakness across market capitalization segments—from small-caps (IJR, IWM) to mid-caps (MDY) and large/mega-caps (OEF, SPY, QQQ)—is a notable technical observation.
Regarding market breadth for the observed period, the data indicates zero advancing symbols against six declining symbols. This represents a breadth of 0 out of 6 for advancing issues, which is a significant indicator of widespread selling pressure. The complete absence of any positive performance across these diverse segments of the equity market makes it highly probable that market participants were engaged in broad-based risk reduction. Such uniform declines typically suggest that the underlying market sentiment for the given day was overwhelmingly negative, making a counter-trend move or significant buying strength in specific areas unlikely.
From a relative performance perspective, the MDY index exhibited the least severe decline at -0.859%, suggesting a marginal degree of relative resilience in mid-capitalization stocks compared to other segments. Conversely, the QQQ index experienced the largest decline at -2.040%, indicating that large-cap growth and technology-heavy sectors were likely under the most substantial pressure. The small-cap indices, IWM and IJR, also saw considerable drops of -1.711% and -1.195% respectively, reflecting significant weakness in the smaller end of the market capitalization spectrum.
The synchronized nature of these declines across various market segments makes it probable that this represents a broad market downturn rather than isolated sector-specific weakness. While it is conceivable that such movements could precede a shift in market leadership, the absence of any advancing symbols makes an immediate bullish rotation unlikely. The data more strongly suggests a prevailing risk-off sentiment. Traders would likely view this technical picture as indicative of a short-term bearish environment, where further declines are a distinct possibility unless subsequent data suggests a reversal.
Market Commentary: Two-Day Technical Snapshot
The provided two-day market data, spanning November 3rd and 4th, 2025, for a selection of key Exchange Traded Funds (ETFs) including SPY, QQQ, IWM, IJR, MDY, and OEF, offers a discernible technical picture largely indicative of increased bearish sentiment across most market segments. For SPY (S&P 500), QQQ (Nasdaq 100), IWM (Russell 2000), and OEF (S&P 100), the price action on both days suggests a notable shift towards selling pressure. Day one for these major indices concluded with closes near the lower end of their daily range, followed by a significant gap down at the open of day two. This second day saw these ETFs establish lower highs and lower lows, ultimately closing significantly below their prior day’s close. This two-day pattern, characterized by a gap down followed by a strong bearish candle, is highly likely to be interpreted by technicians as a continuation signal for further downside in the immediate term, suggesting existing support levels have been decisively broken.
Adding conviction to the bearish outlook for these core indices (SPY, QQQ, IWM, OEF) is the accompanying volume data. The second day of selling pressure was observed on notably increased volume compared to the first day for SPY, QQQ, IWM, and OEF. This rise in volume alongside declining prices suggests that selling interest intensified and conviction among bearish participants strengthened. From a technical perspective, increased volume on a down move typically validates the price action, indicating that the move is not merely an anomaly but a more robust shift in supply and demand dynamics. Therefore, it is likely that these segments will continue to face selling pressure, with rallies facing considerable resistance at the recently established lower highs.
While the broader market depicted significant weakness, the mid-cap (MDY) and small-cap value (IJR) segments exhibited slightly nuanced patterns, though ultimately succumbing to the selling pressure. MDY notably closed bullishly on day one, indicating some initial resilience. However, on day two, it experienced a gap down and a strong bearish close, aligning with the broader market’s decline. Interestingly, this downside move in MDY occurred on lower volume compared to day one, which presents an alternative scenario: the selling, while present, may not be as aggressive or as conviction-driven as seen in the larger-cap indices. Similarly, IJR, after closing near its high on day one, also gapped down and closed lower on day two with slightly decreased volume. This divergence in volume could suggest a roughly even chance that these segments might stabilize sooner than the broader market, or at least experience less aggressive continuation of the selling pressure. Conversely, it is also plausible that this lower volume simply represents a temporary lull before these segments catch up to the broader bearish trend.
In conclusion, the overarching technical picture for the provided two-day period points to a high likelihood of continued downside for the major market indices represented by SPY, QQQ, IWM, and OEF, validated by increasing volume on down moves. Traders should be aware that the lows established on November 4th will represent critical short-term support levels, and any breach below these points would likely lead to an extension of the bearish trend. While MDY and IJR demonstrated minor differences in volume characteristics during their declines, indicating a potential for less conviction in their respective downtrends, it is highly likely they will remain influenced by the broader market’s direction. A significant reversal in sentiment would almost certainly require a convincing close above the highs of November 4th on strong volume, which is not indicated by the current data.
Performance Heatmap (SPY, QQQ, IWM, IJR, MDY, OEF)
Generated for 2days timeframe analysis
SPY Technical Analysis: 90-Day Outlook (as of 2025-11-04)
The provided 90-day technical data for SPY reveals a pronounced overall uptrend, punctuated by notable pullbacks and subsequent recoveries. From late June to early November, SPY advanced significantly from the low to recent highs near , demonstrating consistent upward momentum. Key price action included a strong rally in July, followed by a sharp, high-volume decline on August 1st to .72. This correction proved temporary, as SPY resumed its ascent through August and into September, establishing new highs. A second significant high-volume drop occurred on October 10th, plunging from .11 to .02, which temporarily challenged the bullish structure. However, the subsequent recovery to new all-time highs in late October around suggested strong underlying buying interest. The latest price action shows SPY pulling back from these late October highs.
Analysis of recent price movements indicates a period of consolidation following the late October surge. After reaching a peak near on October 29th, SPY has seen three consecutive trading sessions of declines, closing at .31 on November 4th. This current pullback is marked by decreasing volume on the last trading day compared to the prior two decline days, which might suggest a reduction in selling pressure, though it is not conclusive. Immediate support levels appear to be forming around the - range, near the low established on November 4th. A more substantial support zone is likely situated around the level, coinciding with the low point of the October 10th significant drop. Resistance will almost certainly be encountered at the recent all-time high of .70.
The 14-day Relative Strength Index (RSI) provides additional insight into momentum. Throughout the 90-day period, RSI frequently entered overbought territory (above 70), notably in late June, late July, mid-September, and early October. These instances were often followed by short-term price consolidations or minor pullbacks, confirming RSI’s utility in identifying periods of extended buying momentum that tend to precede temporary relief. The sharp price decline on October 10th was mirrored by a significant drop in RSI from 65.75 to 41.81, indicating a rapid loss of bullish momentum. As of November 4th, the RSI stands at 53.39, having cooled from near-overbought levels (69.71 on October 29th). This neutral-to-mildly bullish reading suggests that there is now sufficient room for SPY to initiate another leg higher without immediately encountering overbought conditions, should buying interest return.
It is important to note that the requested MACD (13, 21-day) data was not provided in the market data. Consequently, this analysis cannot incorporate momentum signals from the MACD, limiting a comprehensive view of trend strength and potential crossovers. Based solely on the available price and RSI data, the prevailing trend remains upward. Given the recent pullback and the reset in RSI from overbought conditions, it is likely that SPY will attempt to retest the recent highs in the - range in the near term. A sustained break above this resistance would make further upward movement probable. Alternatively, if the current support around fails to hold, a retest of the stronger support zone around is possible, which could suggest a deeper correction. A breach of the level would significantly shift the short-term outlook to a more bearish stance, making a more substantial decline likely.
SPY Price & Indicators (RSI_14_DAY, MACD_13_21_DAY)
QQQ Technical Analysis (90-Day Period Ending November 4, 2025)
Over the 90-day period under review, QQQ largely maintained a robust bullish trend, advancing from approximately in late June 2025 to a peak near in late October. This sustained ascent was interrupted by two notable pullbacks: the first in early August, seeing QQQ drop from around to approximately . A second, sharper but brief, decline on October 10th involved a significant gap down from to , accompanied by elevated volume. QQQ swiftly recovered from this dip, however, pushing to new highs. The most recent data point on November 4th shows a pronounced bearish candle, with QQQ closing at .215, down substantially from .11, also on above-average volume. This recent price behavior suggests a material shift in immediate market dynamics and a likely increase in selling pressure.
The 14-day Relative Strength Index (RSI) provided critical momentum signals throughout the period. From late June through July, the RSI consistently resided in overbought territory (above 70), often peaking around 75. This extended overbought period typically foreshadows a consolidation or pullback, and indeed, the RSI subsequently dropped sharply into the high 40s by early August, accurately preceding and confirming the corresponding price correction. For much of August, the RSI traded predominantly within the neutral range of 50-65, indicating relatively balanced buying and selling pressures during QQQ’s sideways consolidation.
As QQQ resumed its upward trajectory from September into October, the RSI again ascended, re-entering overbought territory (mid-70s) by mid-September and in early October, thereby validating renewed bullish trend strength. The sharp price decline on October 10th prompted an immediate and dramatic plunge in RSI from near 70 to approximately 45, indicating an abrupt loss of short-term momentum. QQQ and its RSI demonstrated resilience, with RSI quickly recovering into the 60s and 70s as price established new highs, peaking around 71.73 on October 29th. Crucially, the November 4th data reveals a significant drop in RSI from 65.55 to 54.77 in a single session, marking a rapid deterioration of momentum from previously elevated levels.
Considering the confluence of price action and RSI, it is highly likely that QQQ will experience further downward pressure in the immediate future. The substantial bearish candle on November 4th, reinforced by increased volume and the sharp drop in RSI from overbought conditions, strongly suggests a short-term top has either formed or is in the process of forming. A probable initial support level for QQQ is anticipated around the - range, which previously served as both a consolidation floor and a bounce point. An alternative scenario, though currently less probable, involves QQQ finding immediate support and initiating a swift recovery. This would require a rapid reversal in both price and RSI, potentially negating the current bearish signals, but present evidence leans towards continued weakness.
It is important to note that while the analysis request specified MACD (13, 21-day) data for inclusion, this particular indicator’s specific values were not provided within the raw market data. Consequently, a technical analysis incorporating the MACD indicator cannot be performed or presented in this commentary.
QQQ Price & Indicators (RSI_14_DAY, MACD_13_21_DAY)
Technical Analysis of IWM (90-day timeframe)
Over the past 90 days, IWM has exhibited a predominant bullish trend, marked by significant rallies and subsequent periods of consolidation or moderate pullbacks. Initial price action from late June into early July showed a clear ascent, establishing a foundation around the - range. Following a brief correction in late July and early August, the instrument experienced robust upward movements in mid-August, pushing into the , and then again in mid-September, reaching highs around . The most recent notable peak occurred in mid-October, when prices briefly ascended to approximately -. This sustained upward trajectory suggests that buyers have generally maintained control throughout the period under review.
The 14-day Relative Strength Index (RSI) provides insight into the momentum shifts underpinning IWM’s price movements. Throughout the 90-day period, the RSI frequently entered overbought territory (above 70), notably in early July (71.57), mid-August (67.21), late August (67.43), mid-September (71.23), and early October (68.07). These instances were typically followed by pullbacks or consolidations, indicating a healthy process of momentum resetting rather than a sustained reversal. Conversely, the RSI dipped towards oversold conditions (below 30) only once, reaching 41.36 in early August. This period, along with a drop to 44.97 in mid-October, marked points where bullish momentum was significantly reduced, often preceding renewed rallies.
Currently, IWM’s price action shows a decline from its October 27th high of .30 to .21 on November 4th. This roughly 3.6% decrease is accompanied by a significant drop in the 14-day RSI from around 58-60 to 44.93. The weakening in RSI suggests that bullish momentum has notably waned in the very short term. There is a roughly even chance that this bearish momentum could lead to further price weakness, potentially testing previous support levels, such as the area around - that served as a bounce point in late September. However, it is also plausible that this represents a healthy correction within the broader established uptrend, especially given that the RSI is not yet in deeply oversold territory. The historical pattern of IWM bouncing when RSI reaches the mid-40s (early August, mid-October) increases the probability of a rebound from current levels.
In conclusion, the 90-day technical data for IWM paints a picture of overall bullishness, punctuated by cyclical momentum shifts. The recent price and RSI decline suggests a near-term weakening of this momentum, indicating a possible deeper correction or a pause in the rally. A continuation of the downtrend is possible, particularly if the RSI breaks below 40. Conversely, a rebound is also possible, especially if the - price zone acts as robust support. The absence of MACD data in the provided dataset limits the ability to analyze potential trend strength and reversal signals based on moving average crossovers. Traders would likely focus on IWM’s interaction with the - support level in the coming sessions; a sustained breach below this level would likely indicate further downside potential, while a bounce and a sustained move above would suggest a resumption of the prior bullish momentum.
IWM Price & Indicators (RSI_14_DAY, MACD_13_21_DAY)
VIX Fear Index
The VIX has been in a clear upward trend over the past seven trading days, with the closing price advancing from 15.79 to 18.87. This sustained ascent in the volatility index suggests that we judge the market’s expectation of future price fluctuations to be increasing. The daily data indicates a pattern of higher highs and higher lows across most sessions, reinforcing the strength of this established upward momentum. The 9.58% increase recorded on 2025-11-04 is particularly noteworthy, signifying a substantial surge in implied volatility within a single session, which is highly likely to draw attention to underlying market sentiment.
Despite the strong daily percentage change, the candle formation on 2025-11-04 presents a nuanced picture. Although the VIX closed significantly higher than the previous day’s close, the candle itself was a red body (open 19.73, close 18.87), indicating that the index opened higher than it closed for the day. Moreover, the presence of a notable upper wick, reaching an intraday high of 20.48 before closing at 18.87, suggests that early session strength faced resistance or profit-taking pressures. A similar pattern was observed on 2025-11-03, where the VIX also formed a red candle with an upper wick, albeit with a lower closing price than the subsequent day.
Considering these recent price actions, we assess a roughly even chance of the VIX experiencing some form of short-term consolidation or a temporary deceleration in its ascent, despite the overarching bullish trend. The rejection of higher prices intraday over the past two sessions, as indicated by the red candles and upper wicks, could signal emerging supply. However, the continued ability of the VIX to close higher than the preceding day’s close on 2025-11-04 keeps the primary uptrend intact. The absence of volume data prevents us from validating the strength of these price movements, limiting our ability to confirm the conviction behind either the rally or the intraday pullbacks.
Based on the available technical data, we judge it likely that the VIX will continue to exhibit an upward bias in the immediate term, supported by the persistent pattern of higher closes over the observed period. Nevertheless, the recent candle formations, particularly the upper wicks and red bodies on 2025-11-03 and 2025-11-04, introduce a moderate probability of increased intraday volatility and potential short-term pullbacks or sideways movement before any further significant leg up. Traders might observe increased choppiness or efforts to retest lower support levels within the rising channel, before a clearer directional move emerges.
Greetings, traders. This technical analysis focuses solely on the provided 90 days of VIX candle data and the 14-day Relative Strength Index (RSI).
Over the 90-day period, the VIX has demonstrated pronounced oscillatory behavior, characteristic of the ‘fear index’. Initial trading in late June around 16.30 consolidated within a 14.50-17.50 range through much of July. Notable surges occurred in early August (closing at 20.38, intraday high 21.90) and early September (peaking at 17.17, intraday high 19.38), each followed by retracements. The most significant volatility expansion transpired in mid-October, where the VIX surged, closing at 21.66 on October 10th, reaching an intraday high of 22.94 on October 14th, and an extreme peak of 28.99 on October 17th before closing notably lower at 20.78 that day. Since this peak, the VIX generally declined until late October, finding support near 15.60, before a renewed ascent to 18.87 on the final day of the dataset (November 4th). This pattern suggests the VIX frequently reverts to a baseline below 17 but is susceptible to sharp, though often temporary, upward spikes.
The 14-day Relative Strength Index (RSI) has largely corroborated VIX price movements, offering insight into momentum shifts. During periods of consolidation, such as in July and much of September, the RSI consistently remained within the neutral zone, typically between 40 and 55. The significant VIX surges observed on August 1st and October 10th corresponded directly with the RSI entering overbought territory, recording values of 65.38 and 73.09, respectively. Notably, after the October 10th peak, the RSI retreated into the 60-64 range even as the VIX recorded its highest intraday peak on October 17th. This suggests a potential loss of upward momentum on a closing basis despite intraday extremes. The subsequent VIX retracement saw the RSI drop to approximately 43.49 by October 27th, indicating a release of prior overbought conditions. The most recent data point (November 4th) shows the RSI at 56.74, indicating strengthening upward momentum, though not yet in overbought territory. Historically, VIX reversals are likely shortly after the RSI crosses above the 70 threshold, making such levels a useful heuristic for potential short-term peaks.
A complete technical assessment would typically integrate the Moving Average Convergence Divergence (MACD) indicator to assess trend strength, direction, and potential reversals through crossovers and divergences. However, the MACD (13, 21-day) data was not provided for this analysis, precluding its inclusion and thus limiting the comprehensiveness of our momentum and trend assessment. Based solely on the available VIX price action and RSI, the immediate outlook points to increasing volatility. The VIX has shown recent upward movement, closing at 18.87 with an RSI of 56.74. This indicates strengthening upward momentum without being overbought, suggesting it is likely that the VIX will continue to test higher levels, potentially challenging the 19-20 resistance range in the near term. An alternative scenario suggests VIX could encounter significant resistance around the 19-20 level, particularly if the RSI approaches the 65-70 threshold, which has historically preceded pullbacks within this dataset. Should this resistance hold, a retracement to the 16-17 zone is a roughly even chance, especially if bearish candlestick patterns emerge near these prior highs. Conversely, a decisive break above the 20-22 range, supported by sustained RSI momentum, would likely indicate a more significant and durable increase in market volatility. The current technical posture, however, suggests an increased probability of short-term upward movement for the VIX.
VIX Price & Indicators (RSI_14_DAY, MACD_13_21_DAY)
Tech Sector Analysis
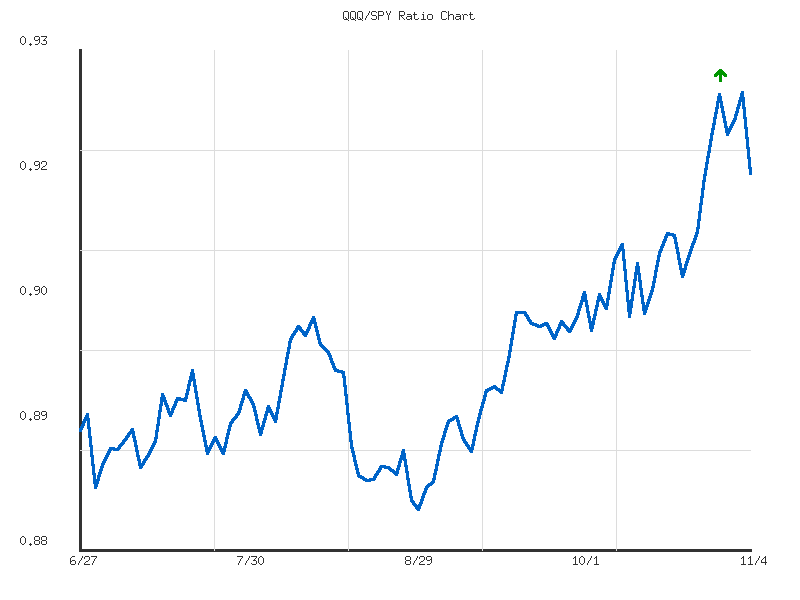
The QQQ/SPY ratio, which measures the relative performance of the NASDAQ-100 against the S&P 500, has displayed an overall upward trajectory over the provided 14-day period. This suggests a general tendency for the technology-heavy NASDAQ-100 (QQQ) to outperform the broader S&P 500 (SPY) during this timeframe. The ratio commenced at approximately 0.905 on October 15th, rising to its current level of about 0.917 on November 4th, reflecting a net increase of approximately 1.28% and confirming the stated ‘up’ direction in the trend analysis.
However, the accompanying trend strength is officially characterized as “weak.” This assessment is reinforced by the ratio’s specific price action: after an initial modest ascent from 0.905 to 0.910 and a subsequent dip to 0.906 around October 22nd, the ratio then advanced more resolutely to a peak of approximately 0.925 on November 3rd. Critically, the most recent data point shows a distinct decline from this peak, settling at 0.9169 on November 4th. This late-period reversal indicates a potential loss of upward momentum and suggests that the outperformance has not been robust or consistently strong.
Considering the “weak” trend strength and the observed retreat from the recent high, it is roughly even chance that the current upward bias in QQQ’s relative performance will persist without further significant challenges in the immediate term. A retest and sustained break above the recent high at 0.9250 appears unlikely in the very short term without a renewed, more decisive surge in relative strength. Conversely, the recent decline presents a plausible alternative scenario where the ratio consolidates or experiences a further decline towards its 14-day average of 0.9150. A more significant breakdown below this average could potentially target the lower end of the observed range, near 0.905, suggesting a period where SPY may begin to show relative strength.
Technical Analysis: QQQ/SPY Ratio (90-Day View)
The QQQ/SPY ratio has exhibited an observable upward trend over the past 90 days, moving from approximately 0.891 at the beginning of the period to its current level around 0.917. This upward trajectory, reflected by a 2.87% increase from the starting point, indicates that QQQ has generally outperformed SPY during this timeframe. However, the provided trend analysis classifies this upward movement as “weak.” This suggests that while the direction of outperformance is clear, the underlying momentum may not be consistently robust, implying the trend’s slope is not particularly steep, or it has been punctuated by notable pullbacks and consolidations. The ratio’s average value for the period stands at 0.8979, with the current ratio being comfortably above this average, at the 80th percentile of its 90-day range, which points to a strong relative positioning within the observed window.
Reviewing the raw data, the ratio initially fluctuated in a narrow band around the 0.89-0.895 level through July, with a notable dip to 0.8856 on July 1st. A more defined ascent commenced in early August, propelling the ratio to a peak of 0.9025 by August 12th. This peak was followed by a significant correction, establishing the period’s low at 0.8834 on September 2nd. This price action suggests that the 0.883-0.885 zone has functioned as a critical support area, successfully preventing further downside relative underperformance. The subsequent rebound from this September low has been more sustained, driving the ratio to progressively higher levels, culminating in the 90-day high of 0.9250 on November 3rd. The overall movement resembles a broad ascending channel, albeit with the observed “weak” trend strength.
In the most recent segment of the data, the QQQ/SPY ratio has demonstrated strong upward momentum, breaking past prior resistance levels around 0.902-0.903 (observed in mid-August and late September). The move from the 0.900 level in early October to the recent peak of 0.925 on November 3rd signifies an acceleration of QQQ’s outperformance relative to SPY. However, the latest data point, November 4th, shows a slight retracement to 0.9169 from this new high. This immediate pullback, while minor in magnitude, suggests a potential for short-term consolidation or profit-taking after the rapid ascent. Despite this minor dip, the ratio remains significantly above its average and near its 90-day high, indicating that the prevailing bullish sentiment for QQQ relative to SPY is likely still intact.
Considering the weak overall trend strength despite the recent upward acceleration, there are two primary scenarios for the immediate future. It is likely that the ratio will either attempt to re-test the recent high around 0.925 or enter a period of consolidation. A sustained break above 0.925 would indicate a strengthening of the relative uptrend, making it very likely that QQQ’s outperformance continues to accelerate into new territory. Conversely, a failure to reclaim this level, coupled with further downward pressure, would suggest a period of consolidation is probable. In such a scenario, the previous highs around 0.902-0.905 would serve as the first critical support zone. A break below this support, especially if it approaches the 0.895 level, would considerably diminish the probability of continued QQQ outperformance in the near term, indicating a roughly even chance of reversal or a protracted sideways movement.
Ratio Analysis: QQQ/SPY
Generated for 90days timeframe analysis
IWM vs. SPY
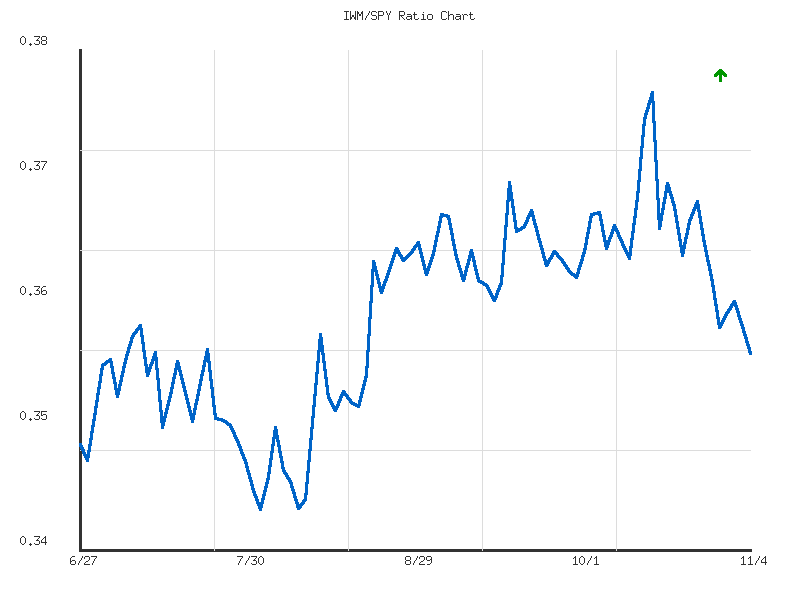
The RATIO:IWM/SPY over the past 14 days indicates a period of sustained underperformance by the Russell 2000 (IWM) relative to the S&P 500 (SPY). We judge the trend direction to be unequivocally downward, with a stated “moderate” strength. This downward trajectory reflects a significant shift in market leadership, where larger-cap equities have demonstrably outperformed smaller-cap names within this specific timeframe.
The ratio commenced at its 14-day peak of approximately 0.3763 on October 15th and concluded at its 14-day low of roughly 0.3572 on November 4th, representing a decline of 5.09%. The provided volatility measure is exceptionally low, which suggests a relatively consistent and orderly decline rather than a highly erratic or choppy price action. This supports the classification of the trend as “moderate” in strength, implying sustained pressure rather than sporadic weakness. There were brief attempts at stabilization or minor bounces, for instance around October 23rd-24th, but these were insufficient to reverse the prevailing downward momentum.
Based solely on the observed data, we believe it is likely that the IWM/SPY ratio will continue to exhibit relative weakness, with IWM underperforming SPY in the immediate future. The current ratio being at the absolute low of the 14-day period, coupled with the consistent downtrend and moderate strength, provides no immediate technical indication of a reversal. While there is always a roughly even chance of a short-term technical bounce from an oversold condition within any trending market, the absence of any discernible reversal pattern in this specific dataset diminishes that probability for a sustained shift. A continuation of the current downward pressure is the most likely scenario we can infer from the provided technical data.
CMT Technical Analysis: IWM/SPY Ratio (90-Day View)
The provided 90-day data for the IWM/SPY ratio, spanning from late June to early November, suggests an underlying weak uptrend. The ratio began this period around the 0.350 level, subsequently reaching a peak near 0.376 on October 15th, before pulling back to its current level of approximately 0.357. This overall upward trajectory, however, is characterized by its “weak” strength, as indicated by the marginal 1.93% increase over the entire observation window. The ratio’s activity has been contained within a range defined by a low of 0.3456 (August 1st) and the aforementioned high of 0.3763. Currently, the ratio is positioned near the lower end of this 90-day range, with a relative position of 0.375, indicating it is closer to its historical low for this period.
Examining the price action more closely, the ratio initially demonstrated a period of accumulation or consolidation between late June and early August, generally moving within the 0.345-0.359 range. A notable surge occurred in mid-August, propelling the ratio above 0.36, establishing what appears to be a new base of support in the 0.360-0.362 area during September. This price behavior, marked by generally higher lows through early October, tends to reinforce the assessment of a weak underlying uptrend despite intermittent pullbacks. The overall volatility for the period is quite low, implying that while the trend is upward, movements are likely to be gradual rather than abrupt.
More recent data points suggest a shift in short-term dynamics. Following the peak at 0.3763 on October 15th, the ratio has experienced a discernible decline, eroding approximately 5.1% of its value to the current 0.3571. This decline has positioned the current ratio below the 90-day average of 0.3596, implying that recent performance of IWM relative to SPY has been less favorable than its average over the last three months. The ratio appears to be testing a potential support zone around the 0.357-0.359 area, which roughly corresponds to resistance levels observed in early August and September.
Considering alternative scenarios, there is a roughly even chance that the ratio could either find support around the current levels and resume its weak uptrend, or continue its downward trajectory. If the 0.357 support zone fails to hold, the next probable area of interest would be closer to the 0.345-0.350 range, near the 90-day low. Conversely, a sustained move back above the 0.360 level would likely suggest the continuation of the weak uptrend. Given the “weak” trend strength and recent underperformance against the average, monitoring for a clear re-establishment of higher lows or a definitive breakdown below key historical support is warranted.
Ratio Analysis: IWM/SPY
Generated for 90days timeframe analysis
Commodities
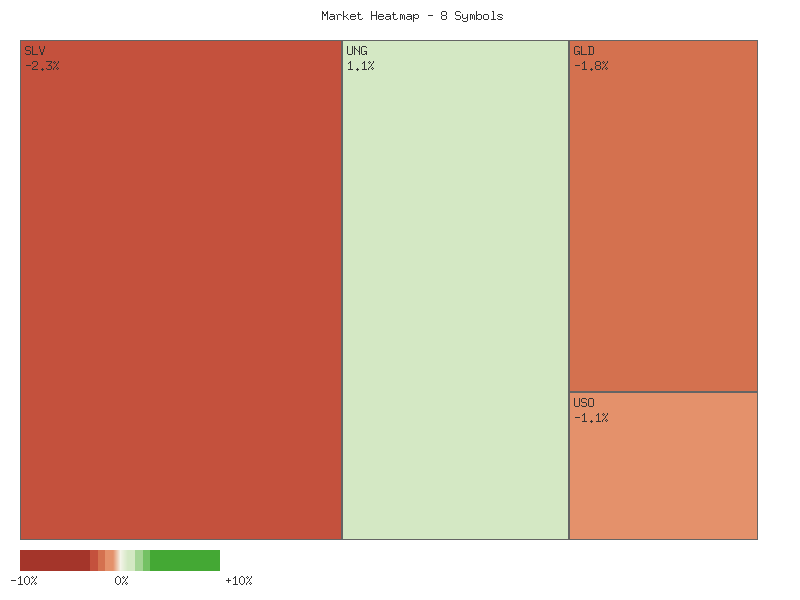
The daily performance of the selected commodity-related instruments for the observed period presents a clear picture of broad-based weakness. Out of eight symbols, two advanced while six declined, indicating a decisively negative market breadth. The strongest performers were UGA and UNG, representing gasoline and natural gas respectively, while CPER (copper) and SLV (silver) exhibited the most significant declines.
| Symbol | Daily Percent Change |
|---|---|
| UGA | 1.506% |
| UNG | 1.126% |
| CORN | -0.512% |
| DBC | -0.738% |
| USO | -1.127% |
| GLD | -1.781% |
| SLV | -2.285% |
| CPER | -2.336% |
The positive movement in UGA (1.506%) and UNG (1.126%) suggests a likely pockets of strength within the energy sector, particularly for gasoline and natural gas. This divergence from the broader commodity complex, which was predominantly negative, is plausible to be driven by specific supply/demand dynamics within these sub-sectors rather than a general market upswing. Their performance offers a contrasting narrative to the overall bearish sentiment.
Conversely, the pronounced declines in CPER (-2.336%), SLV (-2.285%), and GLD (-1.781%) indicate a very likely strong selling pressure in industrial and precious metals. The magnitude of these moves suggests these assets were particularly vulnerable during the session. This widespread weakness in metals almost certainly reflects a short-term bearish sentiment among market participants concerning these specific commodity classes.
The remaining symbols – CORN (-0.512%), DBC (-0.738%), and USO (-1.127%) – also experienced declines, albeit less severe than the metals. DBC’s movement, representing a broad commodity index, reinforces the overall negative sentiment, making it likely that the general commodity market experienced a down day. While UGA and UNG showed resilience, the preponderance of declining assets implies that any broad-based bullish thesis for commodities as a whole on this specific day would be considered unlikely. Considering alternative scenarios, it is conceivable that the strength in gasoline and natural gas could be a precursor to a broader commodity recovery, though current breadth data does not support this with high confidence. A continuation of these divergent trends would be necessary to form a more robust technical conclusion.
Market Commentary: Two-Day Technical Snapshot of Key Commodities
This analysis provides a rigorous technical assessment of selected commodity exchange-traded products over the past two trading days, focusing strictly on price action and volume data. The overall technical posture appears to be predominantly bearish across several key sectors, with notable exceptions indicating specific market dynamics. The short-term timeframe necessarily limits the scope of any longer-term directional forecasts, but distinct patterns are evident.
Precious metals funds, specifically SLV (Silver) and GLD (Gold), exhibited clear bearish momentum over the observed two-day period. Both instruments closed lower for two consecutive days, with the second day’s closing price significantly below the first day’s close. This sustained decline was notably accompanied by a material increase in trading volume on the second day for both SLV and GLD. This confluence of declining prices and rising volume is a strong technical signal, suggesting that a continuation of this downward price trajectory is likely in the immediate future. Similarly, CPER (Copper) also displayed two consecutive bearish candles, with the second day opening significantly lower than the prior close and continuing its descent, accompanied by increasing volume. This indicates robust selling pressure for copper, and a further downward price movement is likely.
In the energy complex, USO (Oil Fund) and DBC (Broad Commodity Fund) both presented patterns indicative of a shift in short-term sentiment. While the first day for both showed bullish closes, the second day witnessed a clear bearish reversal, with prices closing significantly lower than their respective opens and below the prior day’s open. For USO, the second day’s close was below its first day’s open, and for DBC, the second day’s close was also markedly lower than the first day’s open. However, this bearish price action occurred on declining volume for both USO and DBC, which suggests that while downward pressure has emerged, the conviction behind this selling may be less robust compared to the previous day’s buying interest. A continuation of downward pressure or a period of consolidation is likely, although a swift rebound cannot be entirely ruled out due to the softer volume on the bearish day.
Conversely, UNG (Natural Gas) stands out with a distinctly bullish short-term trend. The fund posted two consecutive strong bullish candles, closing higher on both days, with the second day making a higher high and a higher low than the first. Crucially, this upward price movement was confirmed by increasing trading volume on the second day, reinforcing the strength of the buying pressure. Based on this robust price and volume action, a continuation of the uptrend for UNG is likely. In contrast, UGA (Gasoline) showed a pattern of narrow-range trading, with small-bodied candles over both days and declining volume. This indicates market indecision and a roughly even chance of continued sideways consolidation or a minor directional move in either direction. CORN also displayed mixed signals, with a bullish first day followed by a bearish second day on significantly lower volume, implying a potential loss of bullish conviction but also limited bearish follow-through. A period of continued indecision or minor fluctuations is roughly even chance for CORN.
Performance Heatmap (SLV, GLD, CORN, CPER, USO, DBC, UGA, UNG)
Generated for 2days timeframe analysis
Market Commentary: SLV Technical Analysis (90-Day View)
The provided 90-day technical data for SLV reveals a significant shift in price trajectory from a robust uptrend to a more complex, potentially corrective phase. From late June to mid-October, SLV experienced a notable advance, moving from approximately .50 to a peak near .59. This ascent was punctuated by several periods of strong bullish momentum, often corroborated by substantial spikes in trading volume, particularly observed in July, September, and early October. The price action established a probable resistance zone around the .30-.60 area in mid-October, following which SLV initiated a sharp and relatively rapid decline. This downturn saw the price retract considerably, reaching approximately .50 by late October and early November. The recent price activity appears to be attempting to consolidate within the .50-.00 range, though the pattern of lower highs and lower lows since the mid-October peak generally suggests a probable shift in the immediate short-term trend towards a more bearish or neutral bias. Elevated volumes during the initial phase of this decline further suggest robust selling pressure.
Analysis of the 14-day Relative Strength Index (RSI) largely corroborated the price movements. During the strong uptrend, the RSI frequently moved into overbought territory (above 70), peaking at 84.32 on October 13th, concurrent with the overarching price peak. A potential bearish divergence might have formed around mid-October; while the price made its final upward push, the RSI showed early indications of weakening momentum, declining from its peak even as price attempted new highs. Subsequent to the price peak, the RSI experienced a sharp descent, moving from highly overbought levels into the mid-40s by late October. The current RSI reading of 47.35 (as of November 4th) is situated in the lower half of the neutral range (30-70). This indicates that the intense bearish momentum observed immediately after the peak has likely abated somewhat, but it does not yet signal an oversold condition that would typically precede an imminent, strong upward rebound. The RSI is presently trending downwards, which aligns with the observed bearish price action.
Considering the combined evidence from price action and the 14-day RSI, SLV has demonstrably transitioned from a sustained bullish trend to a corrective or consolidative phase. The establishment of a key resistance zone around .30-.60, coupled with the sharp descent from overbought RSI levels, strongly suggests that the immediate price trajectory is likely to be either sideways or downward. The current price of approximately .76, with the RSI at 47.35, implies that while the most acute selling pressure may have passed, there is no clear technical indication of an impending strong reversal to the upside. A plausible near-term scenario involves SLV continuing to consolidate around the - range, with a roughly even chance of testing lower support levels, potentially toward the mid-, if renewed bearish sentiment emerges. Alternatively, should the price successfully establish a more definitive base around current levels and begin to show constructive price action, a retest of the - resistance area might be possible. However, a sustained upward rally would likely require the RSI to develop a clear upward trend and break decisively above the 50-60 threshold. It is important to note that the analysis of the MACD indicator was not possible as the corresponding data was not provided.
SLV Price & Indicators (RSI_14_DAY, MACD_13_21_DAY)
GLD Technical Analysis (90-Day View)
GLD’s price action over the last 90 days depicts a robust uptrend that culminated in a significant peak, followed by a sharp correction. From around in late June, GLD experienced a sustained rally, establishing a clear ascending channel and propelling it to a peak close of .15 on October 20th. This impressive upward movement was characterized by generally rising lows and highs. However, following this peak, the price initiated a rapid decline, shedding approximately 10% by October 27th, closing at .01. The most recent data point on November 4th shows GLD at .321, indicating persistent downward pressure. Near-term price resistance is likely in the - range, derived from previous lows and open prices in late October. Conversely, initial support could be around the current trading levels, specifically the low set on October 28th at .12.
The 14-day Relative Strength Index (RSI) provided clear indications of accelerating momentum during the bullish phase. The RSI consistently traded above the 50-level from early August, frequently entering overbought territory (above 70) throughout September and October. Notably, the RSI reached an extreme high of 87.33 on October 20th, coinciding with the price peak. This extended period in overbought conditions signals that the asset was highly susceptible to a correction. Post-peak, the RSI plunged significantly, dropping below the 50-level on October 27th and continuing its descent to 47.37 by November 4th. This cross below 50 strongly suggests a shift in short-term momentum to the downside, implying that bearish sentiment is likely gaining traction. There is no MACD data provided, precluding its analysis.
Volume analysis offers further insights into the recent price movements. The rally into September and early October was accompanied by increasing average daily volumes, with significant spikes on days such as October 8th (27.7M shares) and October 17th (61.8M shares) as the price approached its highs. Crucially, the major downturn from the October 20th peak was also met with elevated volumes, particularly on October 21st (53.6M shares) and October 27th (23.6M shares). This suggests that the sell-off was accompanied by strong conviction from sellers. Recent volumes around the - level have been moderate, not yet indicating capitulation or strong accumulation that would precede a reversal.
Based on the technical data, a continuation of the near-term downtrend for GLD is likely. The price has broken decisively from its peak, the RSI has firmly moved into bearish territory below 50, and the initial phase of the decline was confirmed by significant selling volume. While the current price is approaching potential minor support established in late October, the absence of a clear bullish reversal pattern or a strong rebound in RSI suggests that this support may be tested further. An alternative scenario, where GLD finds robust support around - and initiates a bounce, is less likely without a clear shift in momentum indicators or compelling candlestick formation. Should current support fail, a test of the - zone, where prices consolidated in early October, becomes a plausible downside target.
GLD Price & Indicators (RSI_14_DAY, MACD_13_21_DAY)
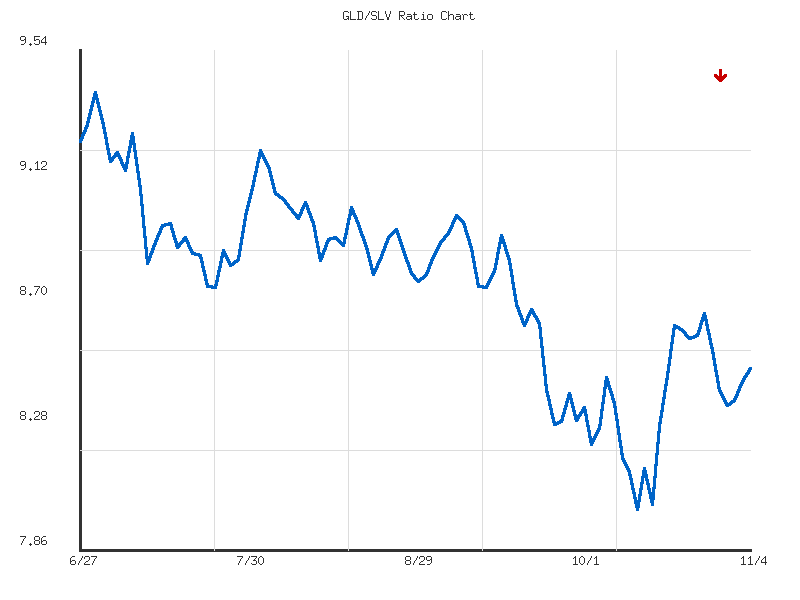
Gold/Silver Ratio
The GLD/SLV ratio has exhibited an “up” trend of moderate strength over the observed 14-day period, registering a 5.71% increase from its initial point. This upward trajectory indicates a prevailing outperformance of Gold (GLD) relative to Silver (SLV) within this specific timeframe. The ratio commenced at approximately 8.0155 on October 15th, advanced to a period high of 8.6558 on October 27th, and concluded the period at 8.4733. The low volatility of 0.0265 suggests that while the trend was consistent, the price movements were not excessively erratic. The current ratio of 8.4733 sits above the 14-day average of 8.4508, implying that recent price action has been marginally stronger than the period mean.
The initial phase of the period saw a pronounced upward impulse, with the ratio advancing swiftly from its starting point to 8.6147 by October 21st. This rapid ascent suggests strong buying interest in GLD relative to SLV during that particular week. Following this initial surge, the ratio entered a phase of consolidation and continued to edge higher, ultimately reaching its observed peak of 8.6558 on October 27th. This peak established a clear, albeit short-term, resistance level for the ratio within the 14-day window.
Subsequent to the October 27th peak, the ratio experienced a notable decline, retreating to 8.3475 by October 30th. This movement represented a distinct, short-term reversal of the prior upward momentum. The ratio then appears to have found tentative support around this 8.34 level, initiating a recovery phase that carried it to the final observed value of 8.4733. This most recent bounce suggests that the selling pressure encountered post-peak might be abating, with buyers potentially stepping in at lower levels. The current position at 0.7149 relative to the period’s range (71.49% from the low to the high) implies that the ratio is presently situated in the upper quartile of its recent trading range.
Considering the moderate upward trend and the recent recovery from the October 30th low, it is likely that the GLD/SLV ratio may attempt to retest the previous resistance established around the 8.65 level. However, given the recent sharp pullback from that high, there is a roughly even chance of further consolidation or a retest of the 8.34 support before any sustained upward move. A failure to hold above the average ratio of 8.4508 in the near term would likely increase the probability of a test toward the 8.34 support. Conversely, a decisive break above 8.55 would likely signal renewed bullish conviction, setting the stage for a potential challenge of the 8.65 high.
GLD/SLV Ratio Analysis: Moderate Downtrend Persists with Potential for Further Weakness
The GLD/SLV ratio has been in a demonstrable downtrend over the observed 90-day period, indicating a consistent outperformance of SLV relative to GLD. The technical data confirms a “down” direction with “moderate” strength, evidenced by an approximate 8.24% decline from its peak of 9.396 on July 1st to its current reading of 8.473 as of November 4th. This decline has established a clear pattern of lower highs and lower lows, which is a hallmark of a bearish trend. The current ratio stands significantly below the 90-day average of 8.754, suggesting the bearish momentum has been persistent rather than episodic, with the path of least resistance likely remaining to the downside.
Following the initial peak, the ratio found temporary support near 8.74 in late July, which subsequently transformed into a resistance level during several rallies throughout August. After failing to sustain levels above 9.0 in early August, the ratio experienced a more pronounced decline, eventually breaking through the 8.7-8.8 support zone in late August and early September. This breakdown strongly reinforced the downward trajectory. The ratio later established a new 90-day low at 8.000 on October 13th. The current value of 8.473 places it roughly a third of the way up from this absolute low towards the absolute high of the observed range, suggesting a recent but perhaps transient appreciation from the bottom.
The bounce from the 8.000 low to the current 8.473 ratio could represent either a short-term corrective rally within the broader downtrend or the nascent stages of a more significant reversal. Given the established “moderate” downward trend and the consistent pattern of lower highs and lows, a continuation of the downtrend is likely. Should the ratio fail to establish a higher low above the 8.000 mark, or if it encounters significant resistance around the prior short-term high of 8.61 (observed on October 21st) and fails to breach it, it is highly likely that the ratio will retest the 8.000 low. A sustained break below 8.000 would signal further depreciation of GLD relative to SLV, with no clear technical support levels immediately visible in the provided 90-day data.
Conversely, for a bullish reversal to be considered, the ratio would need to consolidate above its current levels and begin forming a pattern of demonstrably higher lows and higher highs. Specifically, a break and sustained close above the 8.61 resistance, followed by a successful test and hold above the 8.8-8.9 region (which acted as resistance in August), would offer a roughly even chance for a more significant upward correction. However, without such confirming price action, the overall technical picture indicates that the dominant trend for the GLD/SLV ratio remains bearish. The moderate volatility of 0.099 suggests that movements are generally orderly, rather than erratic, which supports the identification of these discernible trends and key levels.
Ratio Analysis: GLD/SLV
Generated for 90days timeframe analysis
Bonds
| Symbol | Daily Percent Change |
|---|---|
| TLT | 0.245% |
| UTHY | 0.236% |
| IEF | 0.130% |
| IEI | 0.084% |
| SHY | 0.036% |
The provided data indicates that all observed bond ETFs (TLT, UTHY, IEF, IEI, SHY) registered positive daily percentage changes during the specified period. TLT, tracking long-term Treasuries, exhibited the strongest gain at approximately 0.245%, closely followed by UTHY (ultra-long Treasury ETF) at roughly 0.236%. This suggests a broad upward bias across the fixed-income sector on this particular day. The uniform positive movement, albeit modest, suggests a technically constructive environment for bond prices.
A clear hierarchy of performance is evident, directly correlating with the implied duration of each instrument. The longest-duration ETFs, TLT and UTHY, demonstrated superior relative strength, achieving the highest percentage increases. Intermediate-term Treasuries (IEF) recorded a respectable gain of approximately 0.130%, while shorter-to-intermediate-term instruments (IEI) advanced by roughly 0.084%. The shortest-duration ETF, SHY, posted the most modest increase at about 0.036%.
This pattern of performance, where longer-duration bond ETFs significantly outperform their shorter-duration counterparts, is likely indicative of decreasing long-term interest rate expectations or an increased demand for duration exposure. Such a technical dynamic typically reflects market participants moving further out on the yield curve, potentially anticipating future easing cycles or seeking yield in a low-growth or risk-off environment. The pronounced spread in gains across the duration spectrum provides a robust technical signal in this regard.
An alternative scenario, though unlikely given the consistent duration-based performance differential, would be if these were isolated, unconfirmed price movements not reflective of broader market sentiment toward interest rates. However, the precise ordering of gains by duration reduces the probability of random fluctuations being the sole driver. The current technical evidence strongly suggests that the market is favoring longer-term fixed income assets, implying a technical predisposition towards lower long-term yields. This observation warrants monitoring for confirmation through subsequent trading sessions.
Here is a technical analysis of the provided market data:
Overall, the provided two-day candlestick data for TLT, UTHY, IEF, IEI, and SHY indicates a prevailing short-term bullish sentiment across this segment of the bond market. All five instruments concluded the two-day period with higher closing prices, suggesting an immediate upward bias. However, a deeper technical examination reveals distinct patterns in volume dynamics that warrant specific attention when assessing the likelihood of continuation or potential reversal. This analysis focuses solely on the provided price and volume data, adhering strictly to technical principles without external context.
For the longer-duration instruments, specifically TLT (20+ Year Treasury Bond ETF), IEF (7-10 Year Treasury Bond ETF), and IEI (3-7 Year Treasury Bond ETF), the technical picture presents a nuanced upward trajectory. Each exhibited two consecutive bullish candlesticks, with the second day closing higher than the first. However, a critical observation is the decreasing volume on the second day for all three of these ETFs (TLT volume from 39.8M to 25.8M; IEF from 7.9M to 5.9M; IEI from 2.1M to 1.3M). This pattern of rising prices on contracting volume suggests that the buying conviction behind these moves may be weakening. Therefore, while continued upward movement is possible, a significant acceleration of the trend is unlikely in the immediate term without a resurgence of buying interest, as evidenced by increasing volume. A consolidation phase or a minor retracement is a roughly even chance for these instruments if this volume divergence persists.
In contrast, the shorter-duration instruments, UTHY and SHY, displayed a more technically robust short-term bullish setup. UTHY, despite its smaller volume profile, showed two consecutive bullish candles with an increase in volume on the second day (from 10.3K to 15.9K). This volume expansion supporting the price advance likely indicates strengthening buying interest, suggesting a likely continuation of its upward momentum. Similarly, SHY, representing the 1-3 Year Treasury Bond ETF, exhibited very tight price action but also recorded two consecutive higher closes, crucially supported by an increase in volume on the second day (from 5.3M to 6.4M). Despite the minimal absolute price movement, the increasing volume behind these higher closes points to a likely continuation of this subtle upward bias in the immediate term, albeit within a constrained range.
The divergence in volume patterns across the spectrum of bond durations warrants careful consideration. While all ETFs displayed short-term bullish price action, the varying degrees of conviction, as indicated by volume, suggest differing near-term probabilities. For the longer-duration funds (TLT, IEF, IEI), the price-volume divergence makes a sustained, strong push higher unlikely, and a period of consolidation or a slight pullback is possible or even likely in the very immediate term. Conversely, the more robust volume confirmation in SHY and UTHY points to a likely continuation of their respective, albeit modest, upward trajectories. Overall, the technical landscape for these bond ETFs, based on the provided two-day data, leans bullish in the short run, but with an observable weakening of conviction in longer-duration assets compared to their shorter-duration counterparts.
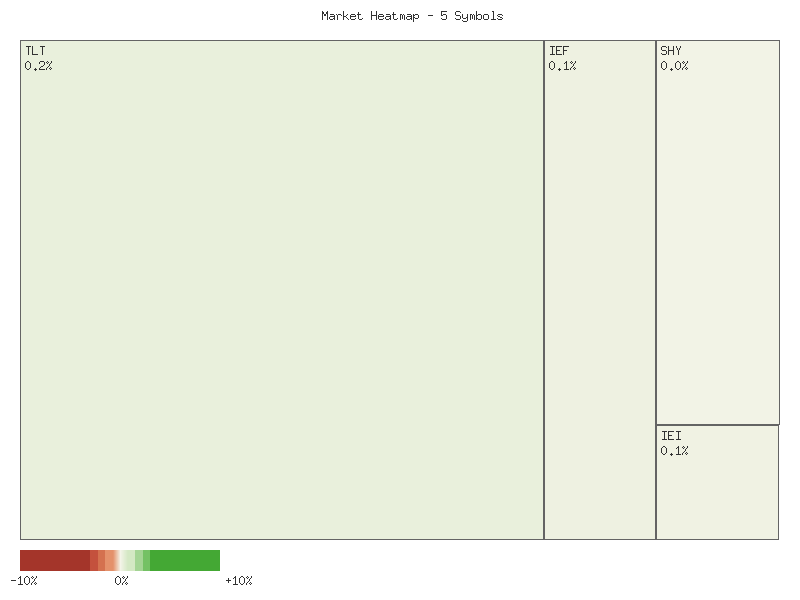
Performance Heatmap (TLT, UTHY, IEF, IEI, SHY)
Generated for 2days timeframe analysis
Magnificent 7 & Friends
The daily performance of the selected equities indicates a predominantly negative sentiment for the observed period. As demonstrated in the matrix below, only one out of ten instruments closed in positive territory, while the majority experienced declines, some quite significant. This distribution suggests that selling pressure was pervasive across this specific subset of the market.
| Symbol | Daily Percent Change |
|---|---|
| AAPL | 0.439% |
| MSFT | -0.522% |
| META | -1.629% |
| AMZN | -1.826% |
| GOOGL | -2.178% |
| ANET | -2.595% |
| AVGO | -2.986% |
| NVDA | -3.959% |
| TSLA | -5.148% |
| CRWV | -8.345% |
Among the observed instruments, AAPL exhibited notable relative strength, being the sole gainer for the day with a modest increase of 0.439%. This performance makes AAPL an outlier, indicating a probable underlying buying interest or resilience relative to its peers. MSFT also displayed comparative strength, registering the smallest decline among the negative performers at -0.522%. This suggests that while not immune to the broader selling, MSFT demonstrated a degree of support that was absent in most other names. For these two, a continuation of relative stability or strength is likely if broader market conditions do not deteriorate significantly.
Conversely, CRWV was the most significant underperformer, registering a substantial daily decline of -8.345%. This steep fall signals strong selling pressure and is likely to indicate a breach of recent support levels or a reaction to specific company-related news not provided in this dataset. Following CRWV, TSLA and NVDA also experienced considerable declines of -5.148% and -3.959% respectively. Such pronounced single-day drops often suggest a loss of technical momentum, making a continued downward movement likely in the near term, absent other technical factors like oversold conditions or immediate support levels, which cannot be assessed from this limited data.
The clustering of declines for META, AMZN, GOOGL, ANET, and AVGO, ranging from -1.629% to -2.986%, points to a general bearish tone across a significant portion of this technology-oriented group. This suggests a broad, albeit not extreme, liquidation in these names. While a continuation of this negative momentum is likely, it is also a roughly even chance that these instruments could experience a short-term bounce, particularly if the broader market finds support. However, without additional context such as trading volume, price levels relative to moving averages, or identified support/resistance, assessing the probability of a reversal remains uncertain.
Market Commentary: Technical Outlook for Select Equities (2025-11-03 to 2025-11-04)
This analysis provides a technical perspective on the provided two-day price and volume data for a selection of equities. The overall market sentiment, as inferred from these specific data points, appears to have shifted notably bearish, with several major names exhibiting strong downward momentum.
A significant portion of the analyzed stocks, including NVDA, CRWV, AVGO, META, and ANET, displayed clear bearish continuation patterns. Each of these symbols posted two consecutive bearish candles, with the second day often opening significantly lower and closing near its daily low, indicating robust selling pressure. CRWV and AVGO are particularly notable, showing large bearish candles with increased volume on the second day, suggesting a high probability of further downside momentum in the immediate term. NVDA and ANET also saw increased volume alongside their declines, reinforcing the bearish conviction. For META, while both days were bearish with a gap down on the second day, a slight decrease in volume might suggest selling pressure could temper in the very near future, though the price action remains decidedly bearish.
Conversely, AAPL presented a potential bullish reversal signal. Following a bearish day one with a long lower shadow, day two opened lower but recovered to close higher than day one’s close, forming a bullish candle with increased volume. This pattern, resembling a Piercing Line or a Bullish Engulfing variant, suggests a roughly even chance of a short-term rebound or stabilization. Similarly, MSFT, while experiencing two bearish days, saw a contained decline on day two with slightly decreased volume. Its day two close was higher than its open, indicating some intra-day buying interest, which might stabilize the price in the immediate future, although the overall two-day trend remains downward.
TSLA and GOOGL provided strong bearish reversal patterns following a bullish or relatively contained day one. TSLA exhibited a bearish engulfing pattern, where a strong bullish candle on day one was entirely overshadowed by a larger bearish candle on day two, accompanied by increased volume. This suggests a likely shift to a bearish trend. GOOGL formed a pattern akin to a Dark Cloud Cover, with day two opening lower than day one’s close and closing significantly into day one’s bullish body, indicating a strong probability of bearish continuation. AMZN also showed bearish continuation, with two consecutive bearish candles and a gap down on day two. However, the significantly decreased volume on AMZN’s second bearish day might imply a potential reduction in selling intensity, although the price action remains bearish.
In summary, the prevailing technical signals from this two-day data set indicate a strong bearish bias across most of the analyzed equities. While AAPL shows a potential for a short-term bullish counter-move and MSFT may exhibit some stabilization, the majority of the symbols, particularly NVDA, CRWV, AVGO, META, and ANET, are experiencing significant downward pressure with a high probability of further declines. The volume profiles generally support these directional biases, with increased volume often accompanying bearish moves, adding conviction to the technical signals observed. Traders should exercise caution and likely anticipate continued volatility.
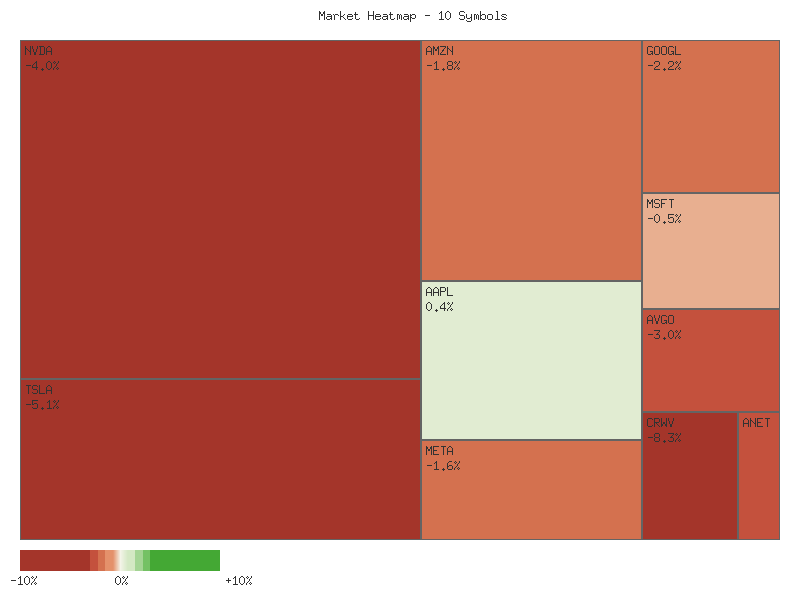
Performance Heatmap (TSLA, MSFT, AAPL, META, NVDA, AVGO, GOOGL, AMZN, CRWV, ANET)
Generated for 2days timeframe analysis
S&P 500 Sector Breadth
The market breadth for the observed S&P 500 sectors on the given day suggests a predominantly negative bias. Of the eleven sector ETFs analyzed, four registered positive daily changes, while seven recorded declines. This ratio of advancing to declining symbols indicates that overall market momentum, as reflected by these major sectors, was likely to the downside. The relatively narrow positive breadth signals a cautious environment, with positive performance concentrated in fewer areas.
Drilling into specific sector performance, the advancing sectors include Financials (XLF) with a 0.518% gain, Health Care (XLV) up 0.409%, Consumer Staples (XLP) higher by 0.357%, and Real Estate (XLRE) gaining 0.306%. On the other hand, the declining sectors saw significant losses, led by Technology (XLK) which fell 2.674%, followed by Consumer Discretionary (XLY) down 1.713%, Industrials (XLI) decreasing by 1.140%, and Energy (XLE) losing 1.112%. Communication Services (XLC), Materials (XLB), and Utilities (XLU) also posted declines, ranging from -0.704% to -0.381%.
An assessment of market rotation between offensive and defensive sectors indicates a likely shift towards defensive positioning. Of the four advancing sectors, three (XLV, XLP, XLRE) are classified as defensive, with Financials (XLF) being the sole advancing offensive sector. Conversely, among the seven declining sectors, six (XLK, XLY, XLI, XLE, XLC, XLB) are offensive, with Utilities (XLU) being the only defensive sector to decline. This pattern strongly suggests that market participants are likely seeking relative safety, reducing exposure to growth-oriented and economically sensitive sectors.
The overall market sentiment, based on the observed sector performance, appears to be one of cautiousness or risk aversion. The clear outperformance of defensive sectors and the broad-based decline across multiple offensive sectors, including the steepest drops in Technology and Consumer Discretionary, lend strong support to this interpretation. While the single advancing offensive sector (XLF) indicates some selective strength, its impact on the broader sentiment is improbable to outweigh the collective decline in the high-beta sectors. A reversal of this sentiment would likely necessitate a material shift in capital flows towards sectors such as Technology and Consumer Discretionary.
| Symbol | Daily Percent Change |
|---|---|
| XLF | 0.518% |
| XLV | 0.409% |
| XLP | 0.357% |
| XLRE | 0.306% |
| XLU | -0.381% |
| XLB | -0.470% |
| XLC | -0.704% |
| XLE | -1.112% |
| XLI | -1.140% |
| XLY | -1.713% |
| XLK | -2.674% |
Technical Market Commentary: SPDR Sector ETFs (November 3-4, 2025)
The provided two-day technical data for the SPDR Sector ETFs reveals a highly diversified and, in many instances, bifurcated market sentiment. While certain sectors demonstrate resilience or even strong bullish reversal signals, a significant portion of the market, particularly growth and cyclical-oriented sectors, appears to be under considerable selling pressure. This divergence suggests that market participants are likely re-evaluating risk exposure, leading to selective capital allocation rather than a broad-based move. Therefore, a continuation of this sector-specific performance divergence appears probable in the immediate term.
Several sectors are exhibiting clear bearish momentum, characterized by consecutive lower closes and significant downside volume. Technology (XLK) and Energy (XLE) show particularly strong downside conviction. XLK experienced a substantial gap down on Day 2, closing significantly lower with increased volume, which strongly suggests that further downward pressure is likely. Similarly, XLE’s Day 2 candle, opening with a notable gap down and closing lower on increased volume, points to a probable continuation of its decline. Industrials (XLI), Materials (XLB), Communication Services (XLC), and Consumer Discretionary (XLY) also recorded consecutive lower closes, often accompanied by opening gaps down, indicating that a continuation of this bearish trend is probable for these groups.
Conversely, a few sectors demonstrate notable bullish resilience or potential reversal signals. Health Care (XLV) stands out, posting two consecutive higher closes with increasing volume, which strongly indicates a likely continuation of its upward momentum. Financials (XLF) presents an equally compelling bullish case, as Day 2 saw a strong rally from an open gap down, closing above Day 1’s close on significantly increased volume. This price action, resembling a bullish engulfing or piercing pattern, strongly suggests that a bullish reversal is probable for XLF. Real Estate (XLRE) also recorded two consecutive higher closes, but the decreasing volume on Day 2 slightly tempers the conviction, presenting a roughly even chance of sustained upward momentum or a period of consolidation.
Consumer Staples (XLP) and Utilities (XLU) exhibit more mixed or neutral technical postures over the observed two-day period. XLP saw an initial dip followed by an indecisive Day 2 close on slightly increased volume, suggesting that consolidation is likely rather than a clear trend. XLU, after an initial bullish Day 1, reversed on Day 2 to close lower, on decreased volume. This indicates a loss of upward momentum, and there is a roughly even chance for either a pullback or further consolidation. This technical divergence within traditionally defensive sectors could point to a broader lack of overarching market conviction or ongoing rotational shifts beneath the surface.
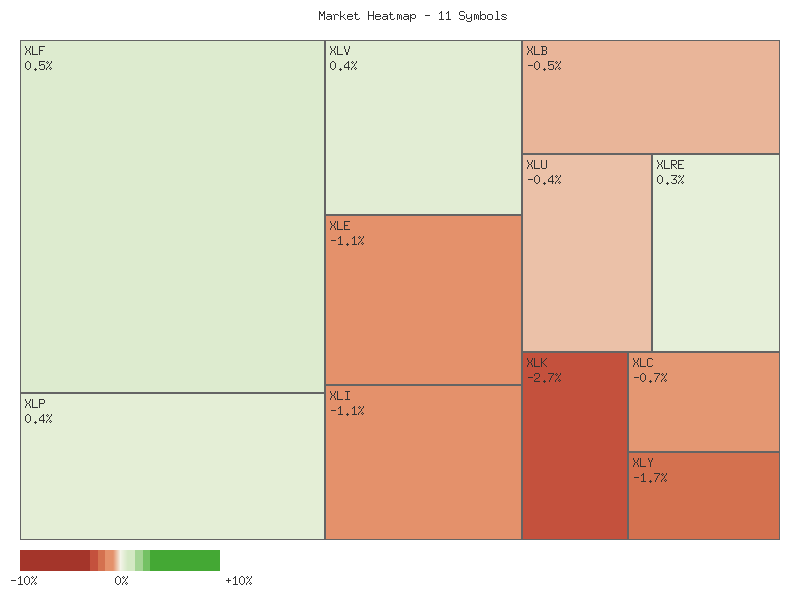
Performance Heatmap (XLP, XLRE, XLI, XLU, XLV, XLY, XLF, XLB, XLE, XLC, XLK)
Generated for 2days timeframe analysis
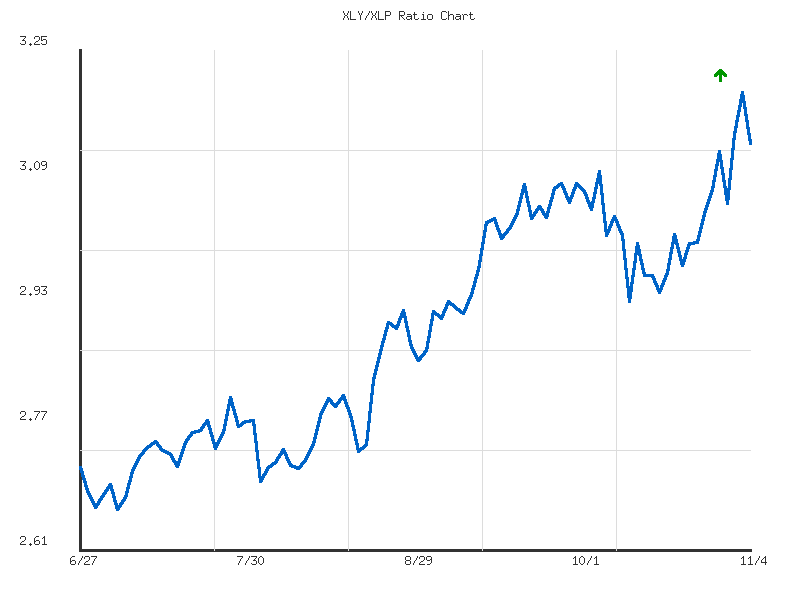
XLY vs XLP
The RATIO:XLY/XLP over the past seven days exhibits an overall upward trend, reflecting Consumer Discretionary (XLY) outperformance relative to Consumer Staples (XLP). This upward movement registered a 2.97% gain from the low of 3.043 to the current ratio of 3.133. Despite the overall positive direction, the provided data indicates the trend strength is “weak.” This suggests that while XLY has gained ground against XLP, the conviction behind this outperformance may be limited, or the gains have not been sustained uniformly across the period. The ratio closed above its 7-day average of 3.110, which likely indicates sustained interest in the discretionaries sector over staples within this narrow timeframe.
Analyzing the specific price action, the ratio climbed from its low to a peak of 3.199 on November 3rd, marking a new short-term high. However, the subsequent trading day (November 4th) observed a decline, closing at 3.133. This lower close following a new high, particularly when considering the “weak” trend strength, suggests roughly an even chance of short-term momentum reversal or a period of consolidation. While the overall upward trajectory remains intact from the start of the period, the inability to hold the highest level likely implies some profit-taking or a temporary shift in sentiment against XLY’s outperformance.
The observed volatility for this 7-day period is relatively low at 0.00266, indicating that the fluctuations, despite making new highs and experiencing pullbacks, were not exceptionally sharp. The current ratio of 3.133 sits above the average but below the peak, at a relative position of 0.577. If the upward trend were to reassert itself with stronger conviction, it is likely the ratio would challenge the recent high of 3.199. Conversely, should the recent pullback extend, it is likely to seek support around the average of 3.110. A break below this average would suggest a shift toward XLP outperforming XLY, which is unlikely given the overall “up” trend over the 7 days, but possible if the “weak” trend strength persists.
Greetings to fellow traders. We are analyzing the 90-day performance of the XLY/XLP ratio, representing the relative strength of the Consumer Discretionary sector (XLY) against the Consumer Staples sector (XLP). The provided data, spanning from late June to early November 2025, reveals a clear and strong uptrend in this ratio. Starting at approximately 2.71 on June 27, the ratio has advanced by an unquestionable 15.47% to its latest recorded value of 3.1334 as of November 4. This persistent upward movement, characterized by a series of higher highs and higher lows, unequivocally signals a market preference for growth-oriented discretionary spending over defensive, essential consumption. The explicit “strong” trend strength reinforces a predominant bullish sentiment for XLY relative to XLP over this intermediate-term horizon. The current ratio notably trades above its 90-day average of 2.8855, further confirming the robust upward momentum.
Examining the price action more closely, the ratio established a significant low at 2.6598 on July 7, which now functions as a key foundational support level within this uptrend. As the rally progressed, the ratio sequentially breached notable resistance points, initially consolidating around the 2.75 mark in late July before demonstrating a decisive break above 2.80 in mid-August. Momentum continued building, pushing the ratio beyond the 2.90 level and, critically, surpassing the psychological 3.00 threshold in mid-September. Most recently, the ratio achieved a new 90-day high of 3.1994 on November 3. However, it subsequently experienced a modest pullback to 3.1334 on November 4. This latest movement places the ratio at a relative position of 0.8777 within its 90-day range, indicating its proximity to the historical peak of this period. This minor retraction from the absolute high could plausibly suggest short-term profit-taking or a phase of consolidation after a significant upward thrust.
Considering the established “strong” uptrend and the recent attainment of a new 90-day high, a continuation of the upward trajectory for the XLY/XLP ratio is likely over the immediate term. The underlying bullish momentum appears robust, implying that the ratio will probably re-test the recent high of 3.1994. A successful and sustained breach of this level would very likely open the path for further upside extension, as there is no discernible overhead resistance based solely on the provided 90-day data. Conversely, given the slight pullback from the recent peak and its elevated relative position, there is a roughly even chance of the ratio entering a period of consolidation or undergoing a modest retracement towards immediate support levels, perhaps around the 3.05-3.10 area. A more substantial and sustained pullback that would seriously challenge the strong bullish outlook would require a decisive break below the 3.00 level, an event that currently appears unlikely given the pronounced strength of the established trend.
Ratio Analysis: XLY/XLP
Generated for 90days timeframe analysis
Equity Breadth
The SPXA50R, which gauges the percentage of S&P 500 members trading above their 50-day moving average, exhibits a clear and concerning downtrend over the observed seven-day period. Commencing at approximately 58.08% on October 27th, the indicator experienced a sharp decline, falling below the critical 50% threshold on October 28th to 48.50%. This downward momentum largely persisted, reaching a low of roughly 37.72% on November 3rd, before a slight recovery to 38.12% on November 4th. This significant contraction, from nearly three-fifths of constituents supporting the short-term trend to less than two-fifths, strongly suggests a weakening in overall short-term market breadth. It is likely that this trend indicates diminishing participation in upward movements and an increasing vulnerability to downside pressures within the index components.
In parallel, the SPXA200R, tracking the percentage of S&P 500 members above their 200-day moving average, also demonstrates a bearish pattern during the same timeframe. Beginning at approximately 61.08% on October 27th, this longer-term breadth indicator similarly declined, breaching the 50% level on October 29th, settling at 49.90%. While there was a modest, temporary recovery to around 51.09% by October 31st, the indicator subsequently retreated, closing the period at approximately 49.90% on November 4th. This consistent decline, culminating with the indicator just below the 50% mark, implies that a majority of S&P 500 components are now trading below their long-term average, which is generally a concerning signal for the sustained health of a broader uptrend. The inability to hold decisively above 50% suggests a probable erosion of long-term technical strength across a substantial portion of the index.
The synchronized deterioration observed in both the SPXA50R and SPXA200R indicators provides a compelling technical signal of weakening market breadth within the S&P 500. The SPXA50R’s sharp fall into the high 30s highlights pervasive short-term weakness, while the SPXA200R’s descent and close below 50% underscore a more fundamental erosion of buying interest and long-term technical support. Given these distinct patterns of decline, it is plausible that the S&P 500 itself may encounter increasing headwinds, as fewer individual constituents are contributing to potential upside momentum. An alternative scenario, though considered less likely due to the consistent downward trend over seven days, might involve these declines representing a sharp but brief period of profit-taking or reallocation before a swift and broad market recovery. However, without additional data indicating stabilization or a clear reversal, the current technical posture strongly points to continued underlying weakness, suggesting that downside risk for the broader market is likely increasing.
SPY Daily
The SPY’s recent price action, particularly over the last seven trading days, suggests a potential shift in momentum from a strong bullish trend to a more cautious or even bearish outlook. On 2025-11-04, SPY closed at 675.31, representing a significant decline from the prior day’s close of 683.32. This bearish engulfing-like candlestick, characterized by an open near the previous day’s close and a close near the day’s low, coupled with an uptick in volume to 72,160,051, provides a compelling technical signal of immediate selling pressure. The Relative Strength Index (RSI) for 2025-11-04 registered 53.39, indicating a notable drop from its elevated levels earlier in the week, suggesting a significant cooling of short-term buying enthusiasm.
Observing the past seven days, from 2025-10-27 through 2025-11-04, SPY initially showed strong upward momentum, peaking with highs near 689.70 on 2025-10-29. This level approximately marks an immediate resistance zone. However, a pronounced bearish reversal emerged on 2025-10-30, as price closed sharply lower at 679.83 with increased volume, creating a clear lower high relative to the prior days. Subsequent attempts to recover on 2025-10-31 and 2025-11-03 were met with relatively lower volume and failed to reclaim prior highs, suggesting limited conviction from buyers. The significant drop on 2025-11-04, closing well below the previous two days’ lows, reinforces the narrative of increasing selling interest. Both the 50-day EMA (663.04) and 200-day EMA (620.20) are still trending upwards and remain significantly below the current price, indicating that the overarching longer-term trend for SPY is likely still bullish, despite recent short-term weakness.
Considering future price action, several scenarios appear plausible. A bullish case would require SPY to rebound strongly from current levels, perhaps finding support near the 674.58 low of 2025-11-04, and then attempting to retest the 687-689 resistance area. This outcome is unlikely in the immediate term, given the recent selling strength. A more likely bearish scenario involves continued downward pressure, breaking below the 674.58 level. Such a move would likely target the rising 50-day EMA, currently around 663.04, which could act as dynamic support. A sustained break below this EMA would strongly indicate a further deterioration in the short-to-medium term trend. Alternatively, a neutral case, indicating a roughly even chance, might see SPY consolidate in the 670-680 range, with the market digesting the recent losses before committing to a clear direction. This could occur if buyers are present enough to prevent a rapid decline but lack the impetus for a substantial rally.
Sentiment, based purely on this technical data, appears to be shifting from strong optimism to a degree of apprehension. The sharp reversal from the recent highs (near 689.70) on increased volume on 2025-10-30, followed by the decisive downward movement on 2025-11-04 with higher volume, signals a loss of confidence among market participants. The retreat of RSI from near-overbought conditions into the mid-range further supports the view that the prior robust buying momentum has diminished. Should prices continue to decline on increasing volume and the RSI fall into oversold territory, it would highly suggest that bearish sentiment is gaining dominance in the near term.
SPY Technical Analysis: 90-Day Outlook (as of 2025-11-04)
The provided 90-day technical data for SPY reveals a pronounced overall uptrend, punctuated by notable pullbacks and subsequent recoveries. From late June to early November, SPY advanced significantly from the low to recent highs near , demonstrating consistent upward momentum. Key price action included a strong rally in July, followed by a sharp, high-volume decline on August 1st to .72. This correction proved temporary, as SPY resumed its ascent through August and into September, establishing new highs. A second significant high-volume drop occurred on October 10th, plunging from .11 to .02, which temporarily challenged the bullish structure. However, the subsequent recovery to new all-time highs in late October around suggested strong underlying buying interest. The latest price action shows SPY pulling back from these late October highs.
Analysis of recent price movements indicates a period of consolidation following the late October surge. After reaching a peak near on October 29th, SPY has seen three consecutive trading sessions of declines, closing at .31 on November 4th. This current pullback is marked by decreasing volume on the last trading day compared to the prior two decline days, which might suggest a reduction in selling pressure, though it is not conclusive. Immediate support levels appear to be forming around the - range, near the low established on November 4th. A more substantial support zone is likely situated around the level, coinciding with the low point of the October 10th significant drop. Resistance will almost certainly be encountered at the recent all-time high of .70.
The 14-day Relative Strength Index (RSI) provides additional insight into momentum. Throughout the 90-day period, RSI frequently entered overbought territory (above 70), notably in late June, late July, mid-September, and early October. These instances were often followed by short-term price consolidations or minor pullbacks, confirming RSI’s utility in identifying periods of extended buying momentum that tend to precede temporary relief. The sharp price decline on October 10th was mirrored by a significant drop in RSI from 65.75 to 41.81, indicating a rapid loss of bullish momentum. As of November 4th, the RSI stands at 53.39, having cooled from near-overbought levels (69.71 on October 29th). This neutral-to-mildly bullish reading suggests that there is now sufficient room for SPY to initiate another leg higher without immediately encountering overbought conditions, should buying interest return.
It is important to note that the requested MACD (13, 21-day) data was not provided in the market data. Consequently, this analysis cannot incorporate momentum signals from the MACD, limiting a comprehensive view of trend strength and potential crossovers. Based solely on the available price and RSI data, the prevailing trend remains upward. Given the recent pullback and the reset in RSI from overbought conditions, it is likely that SPY will attempt to retest the recent highs in the - range in the near term. A sustained break above this resistance would make further upward movement probable. Alternatively, if the current support around fails to hold, a retest of the stronger support zone around is possible, which could suggest a deeper correction. A breach of the level would significantly shift the short-term outlook to a more bearish stance, making a more substantial decline likely.