Daily Market Technical Analysis
The market exhibits significant divergence, with large-cap growth (QQQ) showing a likely continuation of its bullish trend and roughly even chance of new highs, while small and mid-caps (IWM, MDY) face likely continued headwinds. Broader market breadth indicators (SPXA50R, SPXA200R) are highly likely signaling pervasive short and long-term weakness. Commodities present a bifurcated trend, with energy and agriculture likely to appreciate, contrasting with likely continued downside for industrial metals and silver. Fixed income markets are likely to experience further downtrends across all maturities, marked by bearish gaps. The Consumer Discretionary (XLY) to Consumer Staples (XLP) ratio indicates likely continued risk-on outperformance.
Market Indices
The provided daily percent change data for a selection of key index ETFs offers insights into the market’s immediate internal dynamics. The performance on the day in question is summarized as follows:
| Symbol | Daily Percent Change |
|---|---|
| QQQ | 0.483% |
| OEF | 0.197% |
| SPY | 0.185% |
| IJR | 0.183% |
| MDY | -0.057% |
| IWM | -0.333% |
Analyzing market breadth from this limited sample of six broad market ETFs, four symbols (QQQ, OEF, SPY, IJR) recorded positive daily returns, while two symbols (MDY, IWM) experienced declines. This ratio of 4 advancing symbols to 2 declining symbols suggests a moderately positive underlying tone for the day. However, a key observation is the concentration of the advances, primarily in large-cap growth (QQQ) and broader large-cap indices (OEF, SPY). This pattern could indicate a degree of narrowness in market participation, where upward momentum is not uniformly distributed across all market capitalization segments.
The strongest outperformance was clearly observed in QQQ, representing the NASDAQ 100, which posted a robust gain of 0.483%. This leadership from technology and growth-oriented large-caps is often seen when investors favor companies with strong fundamentals or perceive them as more resilient. The broader large-cap benchmarks, SPY (S&P 500) and OEF (S&P 100), also registered modest gains, reflecting a general stability within the larger market components. Conversely, small-cap (IWM) and mid-cap (MDY) segments lagged, with IWM experiencing the largest decline at -0.333% and MDY seeing a slight dip of -0.057%. The positive performance of IJR (small-cap growth) within the small-cap complex is an interesting divergence from IWM’s broader small-cap weakness.
This divergence, where large-cap indices lead while small and mid-caps generally lag, likely indicates a market environment with selective capital flows. It is possible that investors are rotating towards perceived quality or larger market capitalization segments, or it could simply reflect profit-taking in more volatile areas. Such a pattern, if sustained, might imply that the market’s upward trajectory is being driven by fewer, larger components, which could eventually raise concerns about the sustainability of a broader rally. An alternative scenario is that the modest declines in IWM and MDY represent a minor, short-term consolidation following prior strength, and do not necessarily portend a widespread market downturn. Without additional data such as volume accompanying these price changes, the probability of these alternative scenarios holding true is roughly even.
Given the observed data, it is likely that the market is experiencing a period where established leaders, particularly in the growth-oriented large-cap space, are favored. This selective strength could persist in the immediate term. Traders might interpret the consistent outperformance of QQQ and the relative weakness in the small and mid-cap segments as a signal to prioritize larger, more liquid assets. The overall absence of severe, widespread declines suggests that market health is not critically compromised; however, the pockets of weakness in the small and mid-cap indices are notable and merit continued technical monitoring for any signs of broadening weakness or potential reversal.
As a Chartered Market Technician with over 15 years of experience, I’ve rigorously analyzed the provided 2-day candlestick data for key equity ETFs (SPY, QQQ, IWM, IJR, MDY, OEF). The technical patterns indicate a market exhibiting mixed to predominantly bearish signals when examining price action and volume. There appears to be a divergence in sentiment across market capitalization segments, with large-cap indices attempting to establish short-term support, while several mid- and small-cap segments displayed notable weaknesses. This implies underlying selling pressure, which appears to be gaining traction in key areas.
Focusing on the large-capitalization indices, both SPY and QQQ formed two consecutive bearish candles, closing below their respective opening prices. For SPY, Day 2 registered a marginally higher high, low, and close compared to Day 1. QQQ exhibited a similar pattern of higher highs, lows, and closes on Day 2. The decrease in volume for both on Day 2, coupled with the higher lows and closes within bearish candle bodies, suggests a roughly even chance of short-term support being tested, or a lack of strong conviction from sellers at these levels, potentially indicating a waning in aggressive downside pressure. OEF also produced two bearish candles; however, Day 2 showed a higher low and close on significantly increased volume, which could potentially signal a subtle shift in demand or a consolidation.
In contrast, the mid- and small-cap segments presented clearer bearish indications. MDY exhibited a strong bearish reversal, with Day 2 forming a significantly bearish candle following a bullish Day 1. Crucially, Day 2’s low breached Day 1’s low, and it closed lower than Day 1’s close, all supported by increased volume. This confluence makes it likely that selling pressure is escalating for mid-caps, potentially solidifying a bearish reversal pattern. IWM also transitioned from a bullish Day 1 to a bearish Day 2. Its lower low and lower close on Day 2, accompanied by reduced volume, suggests a fair probability of continued immediate-term downside due to a loss of upward momentum. IJR was the only index with two bullish candles, with Day 2 closing higher on substantially higher volume. Nevertheless, the notable lower low established on Day 2 by IJR introduces uncertainty, suggesting a roughly even chance that this rally could be challenged despite the strong close.
In summary, the aggregated technical data points to a cautious outlook for the near-term. The persistent bearish candle formations in the large-cap indices (SPY, QQQ, OEF) suggest that upward momentum remains challenged. More definitive bearish shifts are evident in MDY and IWM, where lower lows and lower closes, especially on increased volume for MDY, indicate increasing selling conviction. While IJR showed some relative strength, its lower low on Day 2 tempers outright bullishness. Given these patterns, it is likely that the market, particularly the mid and small-cap segments, will face continued headwinds. An alternative scenario is a potential short-term rebound for large-caps if the higher lows and closes seen on Day 2 prove to be more robust support; however, the overall technical structure warrants a cautious stance.
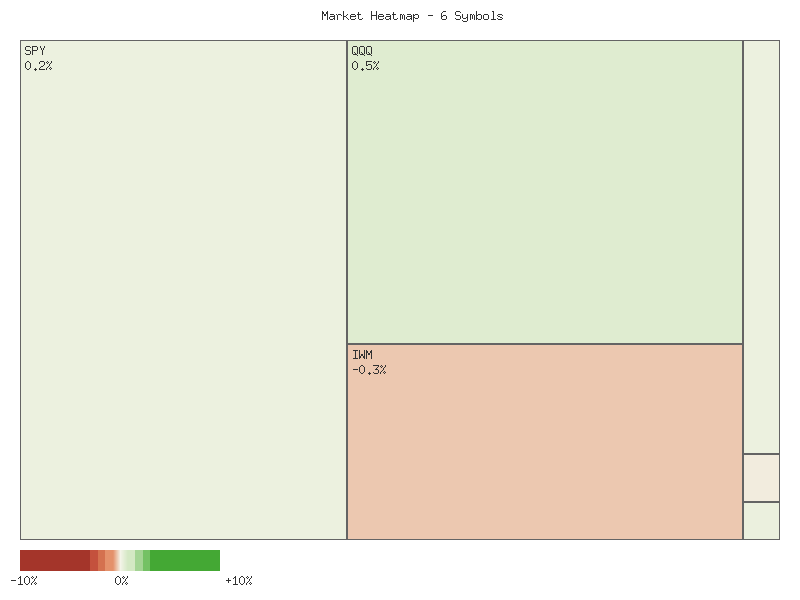
Performance Heatmap (SPY, QQQ, IWM, IJR, MDY, OEF)
Generated for 2days timeframe analysis
SPY Technical Analysis: 90-Day Outlook
Over the past 90 trading days, SPY has exhibited a pronounced bullish trend, advancing from the low to the high . This upward trajectory has been characterized by consistent higher highs and higher lows, indicative of sustained buying pressure. Notable price action includes two significant, high-volume pullbacks, specifically around July 31st/August 1st and October 10th. These sharp corrections, while substantial in magnitude, did not invalidate the overarching uptrend, with prices quickly recovering to establish new highs. The latest price action shows SPY at approximately , having experienced a minor pullback from recent all-time highs near , suggesting a period of short-term consolidation or minor correction might be underway following the robust rally. Key support levels appear to be emerging around the mid- and the level from the October 10th rebound.
The 14-day Relative Strength Index (RSI) provides valuable insight into momentum. During the initial phase of the 90-day period (late June to late July), RSI frequently entered overbought territory above 70, peaking near 75, which strongly indicated an accelerated bullish momentum. The sharp price declines in early August and mid-October were accurately reflected in corresponding dramatic plunges in RSI, falling to 47.66 and 41.81 respectively, effectively resetting the momentum oscillator. These resets likely provided opportunities for new buying interest. Following these corrections, RSI generally recovered, often trading in the 50-70 range, signifying strong but less overheated momentum. Most recently, RSI approached the overbought threshold again in late October, climbing to near 69, before moderating to its current reading of 62.62. This moderation aligns with the recent price pullback and suggests that while bullish momentum is still present, the immediate buying fervor has eased slightly.
A comprehensive momentum analysis is constrained by the absence of MACD data in the provided dataset. While the price action and RSI offer substantial clues about market sentiment and trend strength, the lack of MACD prevents an evaluation of its signal line crossovers, histogram movements, and potential divergences, which could either confirm the observed trends or signal underlying shifts in momentum not evident from RSI alone. Therefore, conclusions drawn solely from price and RSI must acknowledge this limitation, as the full picture of trend and momentum health cannot be completely assessed without all requested indicators.
Considering the technical evidence, a continuation of the bullish trend for SPY appears likely in the near term, particularly if the current minor pullback finds support around the - range. Should this support hold, SPY will likely retest the recent high near , and a breakout above this level could lead to further upward price discovery. An alternative, less likely scenario, would involve a deeper correction. A sustained break below the - level, coupled with a further decline in RSI below the neutral 50-mark, could indicate a shift towards more bearish momentum. Such a move might test the more significant support levels around -, areas where SPY previously found strong buying interest. Traders might monitor volume on any potential future declines, as the high volume seen during past significant down days could portend a stronger move if selling pressure intensifies.
SPY Price & Indicators (RSI_14_DAY, MACD_13_21_DAY)
Market Commentary: QQQ Technical Analysis (June – November 2025)
The Invesco QQQ Trust (QQQ) has exhibited a sustained upward trend over the observed 90-day period, commencing in late June and concluding near its multi-period highs in early November. Price action initiated around and ended near , representing a substantial advance. Key support appeared around the mid- following a notable pullback in early August, accompanied by elevated volume (69.4M shares) which suggested strong underlying interest. Another significant correction occurred in early October, where QQQ retreated sharply from to on exceptionally high volume (94.4M shares). This robust selling pressure suggested a potential exhaustion or capitulation event; however, this dip was subsequently bought, and the broader uptrend resumed with renewed momentum. More recently, QQQ rallied from late October to a peak at .01 on October 29, before a minor pullback to .05 and then a recovery to .11 by November 3. Volume during the most recent ascent has been consistently above average, lending credibility to the strength of the rally following the October 10th sell-off. The current price stands near multi-period highs, with recent selling days showing elevated volume relative to some preceding rally days, which warrants observation.
The 14-day Relative Strength Index (RSI) for QQQ has frequently ventured into overbought territory (>70) during this 90-day period, notably in early July (72-73), late July (70-73), mid-September (71-75), and late October (70-71). Historically, these overbought readings have often been followed by, or coincided with, minor price pullbacks or consolidations. For instance, the July 31st overbought reading of 71.91 preceded a significant two-day price drop. Similarly, the peak RSI of 75.35 on September 22nd was followed by a multi-day decline in QQQ. The sharp price decline on October 10th caused the RSI to plunge from 69.27 to 45.42, indicating a substantial loss of short-term upward momentum and approaching oversold conditions, which typically precedes a bounce. Currently, the RSI is at 65.55 as of November 3rd. While not yet overbought, it remains comfortably above the 50-level, signifying ongoing bullish momentum for the short term. No clear bearish divergences (higher price highs with lower RSI highs) are immediately evident, with RSI generally correlating with price movements.
Considering both the robust price action and the RSI indicator, the overarching trend for QQQ remains decidedly bullish. The strong rally from the October 10th lows has definitively re-established upward momentum, evidenced by sustained higher highs and higher lows in price, supported by volume during accumulation phases. The current RSI reading of 65.55 suggests that there is still some capacity for further upward movement before becoming excessively overbought, implying a likely continuation of the rally in the immediate near-term. However, the consistent pattern of prior overbought RSI readings (above 70) preceding short-term price pullbacks makes it likely that if QQQ continues its ascent and RSI exceeds 70 again, a period of consolidation or a minor correction could follow. A roughly even chance exists for QQQ to test new all-time highs in the coming days, given the recent momentum. Conversely, a failure to decisively surpass the October 29th high of .01, coupled with a decline in RSI below 60, would unlikely invalidate the broader uptrend but would strongly suggest a near-term pause or reversal. A breakdown below the recent low of .05 (October 30th) would increase the probability of a deeper pullback, potentially towards the - range, where price found prior resistance and support. This analysis is based solely on the provided price and RSI data; the absence of MACD data limits the comprehensive assessment of momentum shifts and potential crossovers, which could offer additional insights.
QQQ Price & Indicators (RSI_14_DAY, MACD_13_21_DAY)
IWM Technical Analysis: November 3, 2025
Over the past 90 days, IWM has exhibited a discernible uptrend, characterized by a series of higher highs and higher lows, despite several intermittent pullbacks. The price surged from approximately in late June to a recent peak near in mid-October. This sustained upward trajectory, supported by generally active volume throughout the period, suggests a prevailing bullish sentiment among participants. However, significant volume spikes have also accompanied notable downward price movements, indicating active selling pressure at critical junctures.
A significant event occurred on October 10th, where IWM experienced a sharp decline on exceptionally high volume, nearly 70 million shares. This volume spike on a down day is a clear indication of substantial selling pressure. Despite this notable selling, the market demonstrated resilience, quickly rebounding to establish a new all-time high of .77 by October 15th. However, this subsequent rally to new highs occurred on comparatively lighter volume than the October 10th sell-off, raising questions about the underlying conviction supporting the rebound. Following this peak, IWM has entered a modest pullback phase, with the most recent close at .41. Notably, recent down days (October 17th, 22nd, 29th, 30th) have generally recorded higher volume than adjacent up days, particularly on October 29th (55 million shares), suggesting increasing selling pressure on declines. This pattern makes a continuation of short-term downward momentum likely.
The 14-day Relative Strength Index (RSI) has historically provided useful insights, frequently reaching overbought levels (above 70) during strong rallies. On July 3rd and September 18th, RSI values above 71 were followed by clear price pullbacks, indicating that overbought conditions have previously served as reliable signals for short-term corrections. The sharp decline on October 10th effectively reset the RSI, pushing it to 44.97, moving it out of potentially overextended territory. Currently, the RSI is positioned at 51.07. This neutral reading suggests a roughly even chance for either an upward or downward move in the immediate term, as momentum alone does not offer a strong directional bias. A continued decline in RSI below the 50-level would highly likely signal strengthening bearish momentum, while a rebound above 60 would indicate renewed buying pressure.
Considering the recent price action and volume dynamics, it is likely that IWM may experience further downward pressure in the very near term. Immediate support appears to be forming around the - range, observed through the lows of October 22nd and 24th, and October 31st. A decisive break below this level would highly likely target the - zone, which served as a bounce point after the significant October 10th sell-off. Conversely, if IWM finds robust support and manages to close above , a retest of the - resistance zone would become likely. However, given the previous strong reaction to the level and recent high-volume selling, breaking decisively above this resistance would require a significant surge in buying conviction. Therefore, a period of consolidation around current levels or a slight retracement is more likely than an immediate strong directional move in either direction.
It is important to note that the provided data did not include the MACD indicator values. Therefore, analysis regarding convergence/divergence and crossovers for the MACD could not be incorporated into this assessment.
IWM Price & Indicators (RSI_14_DAY, MACD_13_21_DAY)
VIX Fear Index
The VIX data over the past seven trading days indicates a notable shift in implied volatility, initially showing a decline followed by a period of increasing volatility before a recent pullback. Following a low point reached on October 27th at 15.62, the VIX embarked on an upward trajectory, closing higher for three consecutive days through October 29th. This upward movement culminated in an intraday high of 18.54 on October 31st, marking a significant increase in market trepidation during this short span. The sustained ascent from the 15.60 area to the 17.44 close on October 31st suggests a likely increase in perceived market risk over this period.
The most recent trading session on November 3rd introduces a potential shift in this upward momentum. The VIX opened with a gap up to 18.06, reaching an intraday high of 18.83, but subsequently closed at 17.22, representing a daily percentage decrease of approximately 1.26%. This candlestick formation, characterized by a higher open followed by a lower close and a significant upper shadow from the intraday high, presents a bearish signal, potentially analogous to a shooting star or hanging man pattern when observed after a period of ascent. This pattern suggests that buyers attempted to push prices higher but faced strong selling pressure, leading to a close near the lower end of the day’s range. It is roughly even chance that this specific candlestick formation represents a near-term top for the VIX.
Given the price action, a likely scenario is a continued consolidation or a short-term retracement for the VIX. The prior lows around the 15.60-15.70 range could act as a significant support zone if the VIX were to decline further, while the recent highs near 18.80 are likely to function as immediate resistance. A decline below the 17.00 level would add weight to the bearish candle’s implications, making further downside more likely in the very near term. Conversely, a decisive move above the 18.80 level would negate the bearish signal, suggesting that the recent selling pressure was merely transient and that the underlying upward momentum in volatility is resuming.
Alternative scenarios must be considered due to the short timeframe of data. While the November 3rd candle suggests a potential reversal, it is possible that the VIX is merely pausing before another leg higher, especially given the preceding strong upward move from the 15.62 low. A consolidation phase above 17.00 for several days, without breaching the 18.80 resistance, could precede either a further decline or a renewed attempt at higher levels. The current data makes a sharp and immediate rebound to significantly higher levels (e.g., above 19.00) appear less likely in the immediate future without further bullish price action to negate the November 3rd bearish close.
As a Chartered Market Technician, I have analyzed the provided 90 days of VIX market data, including daily candle information and the 14-day Relative Strength Index (RSI). It is important to note at the outset that the requested MACD indicator data was not provided in the given market information, precluding any analysis based on that particular momentum oscillator. All conclusions herein are strictly derived from the available VIX price action and RSI data.
Over the past 90 days, the VIX Index has primarily operated within a fluctuating range, characterized by swift, sharp spikes in volatility that tend to revert relatively quickly. From late June through late July, the VIX largely consolidated, trading between approximately 15.00 and 17.50. A notable surge occurred on August 1st, pushing the VIX to a close of 20.38, with an intraday high of 21.90. This period of elevated volatility was relatively short-lived, as the VIX retreated throughout August and September, finding temporary support around the 14.20-14.30 range. This pattern suggests a market that experiences periodic, intense bursts of fear or uncertainty, but with underlying conditions that tend to normalize these extreme movements.
The 14-day RSI largely corroborated the VIX’s price movements. During the initial consolidation phase in June and July, the RSI mostly hovered below the 50-level, indicating neutral to bearish momentum. The August 1st spike in VIX saw the RSI reach 65.38, signifying strong upward momentum but not yet entering the traditional overbought territory (typically above 70). Following this peak, the VIX’s retreat was mirrored by a corresponding decline in the RSI, which returned to the 40-50 range. This correlation between VIX price and RSI movement suggests that the RSI has been an effective, albeit not always a leading, indicator of VIX momentum and subsequent reversals within this timeframe.
A more significant volatility event unfolded in mid-October. The VIX demonstrated a strong upward move, with a close of 21.66 on October 10th, and an intraday high reaching nearly 29.00 on October 17th. During this period, the 14-day RSI surged, reaching 73.09 on October 10th, definitively entering overbought territory. Historically, such elevated RSI readings for the VIX have often preceded pullbacks. Consistent with this observation, the VIX subsequently declined, closing at 17.22 on November 3rd, and the RSI also retreated to 49.66. The current RSI value of 49.66 suggests a roughly even chance of short-term upward or downward momentum, as it sits near the equilibrium point of 50, providing no strong directional bias at this immediate juncture.
Considering the established patterns, it is highly likely that the VIX will continue its mean-reverting behavior within the observed 90-day range. The resilience demonstrated by the market to pull the VIX back down after both August and October spikes suggests that extended periods of extreme volatility are unlikely without new catalysts. The 14.20-14.30 level has acted as a support zone, while the 22-29 region has marked resistance during significant surges. Given the present RSI value and the VIX’s recent retreat from its October highs, a further consolidation or a test of the 15.00-16.00 range in the near term is probable. An alternative scenario would involve the VIX establishing a new, higher baseline above the 17.00 level; however, the persistent mean-reversion observed in the data makes this outcome appear unlikely in the immediate short-term without new, unforeseen market stressors.
VIX Price & Indicators (RSI_14_DAY, MACD_13_21_DAY)
Tech Sector Analysis
The relative performance of QQQ versus SPY over the past 14 days indicates an observable upward trend in the QQQ/SPY ratio, suggesting QQQ has been outperforming SPY during this period. The ratio commenced near 0.9030 on October 14th and concluded at approximately 0.9251 on November 3rd, marking a net increase. This ascent in the ratio implies that the technology-heavy NASDAQ-100 constituents, represented by QQQ, have garnered stronger investor interest or demonstrated superior price appreciation compared to the broader market as reflected by the S&P 500, represented by SPY. The calculated total change percentage of 2.44% further supports this observation of QQQ’s relative strength.
Upon closer examination of the ratio’s price action, we observe a series of higher highs and higher lows, reinforcing the uptrend. Noteworthy pullbacks occurred, such as the decline from 0.9109 on October 21st to 0.9067 on October 22nd, and a more significant drop from 0.9249 on October 29th to 0.9209 on October 30th. Despite these intermittent retractions, the ratio consistently rebounded to establish new highs, culminating in the period’s highest ratio of 0.9251 on the last day of the provided data. The provided volatility figure of 0.000053 suggests relatively stable movement within the trend, without extreme day-to-day fluctuations that might indicate significant indecision or sudden reversals.
While the trend direction is definitively upward, the technical analysis notes its strength as “weak.” This characterization is critical, as it suggests that the observed outperformance, while present, may lack the robust momentum typically associated with strong, conviction-driven moves. A “weak” trend could imply that the upward trajectory might be more susceptible to consolidation or even reversal should market conditions shift. Given the current ratio is at its high for the period (relative_position: 1), there is a roughly even chance of either continued modest appreciation or a minor pullback in the immediate short-term, especially given the “weak” trend strength which rarely sustains sharp upward movements indefinitely.
Considering alternative scenarios, if the “weak” trend strength persists or deteriorates, it is unlikely that QQQ will significantly extend its outperformance against SPY in the immediate future without a re-acceleration of momentum. A continuation of the current weak trend might lead to the ratio oscillating around its recent highs, possibly forming a minor topping pattern or entering a sideways consolidation phase before attempting another breakout. Conversely, a confirmed strengthening of the trend, not presently evident in the provided data, would likely involve a more rapid and sustained increase in the ratio, signaling a renewed, stronger preference for growth-oriented or technology stocks. However, based solely on the provided data and the “weak” trend strength, a substantial acceleration in QQQ’s relative outperformance appears to be of lower probability.
As a CMT with extensive experience in technical analysis, I have thoroughly reviewed the provided 90-day data for the QQQ/SPY ratio. This ratio serves as a key indicator of the Nasdaq 100’s relative strength against the S&P 500. Over the analyzed period, the ratio has exhibited a clear upward trend, moving from approximately 0.8927 to its current value of 0.925057. This current level represents the highest point observed within the 90-day timeframe, indicating that QQQ has maintained a moderate outperformance relative to SPY, with a total increase of 3.62% in the ratio. The consistent upward trajectory, culminating in a new high, suggests an environment favoring technology and growth-oriented stocks compared to the broader market.
The price action within this 90-day window reveals distinct phases. Initially, after minor fluctuations in late June and early July, the ratio established a notable low of approximately 0.8834 on September 2nd. This level has since acted as a significant technical support, as the ratio did not retest or break below it. Following this low, the ratio entered a more sustained upward momentum, gradually climbing above the 0.89 and 0.90 thresholds. The latter part of the period, particularly throughout October, demonstrates an acceleration in this outperformance, with the ratio progressively achieving higher highs and higher lows, reinforcing the bullish technical posture.
Given the current momentum and the ratio closing at its 90-day high, it is likely that QQQ’s relative outperformance against SPY will continue in the immediate future. The sustained move higher, especially the acceleration observed in late October, points to ongoing demand for Nasdaq-indexed assets. However, after such a strong ascent to new highs, a period of consolidation or a minor pullback is a roughly even chance. Such a scenario would represent profit-taking or a re-equilibration before a potential further leg up. A sharp reversal from current levels, without preceding signs of weakening momentum or support breaks, is unlikely based solely on this dataset.
The overall trend strength has been categorized as moderate, which aligns with the observed 3.62% increase over 90 days, indicating a steady rather than parabolic advance. Furthermore, the provided volatility figure for the period is notably low. This suggests that the upward progression of the QQQ/SPY ratio has been relatively orderly, with contained fluctuations around its established trend, rather than exhibiting sharp, erratic price swings. This low historical volatility, coupled with the new 90-day high, technically supports the expectation of continued relative strength for QQQ, although traders should remain vigilant for any signs of momentum divergence from the current high point.
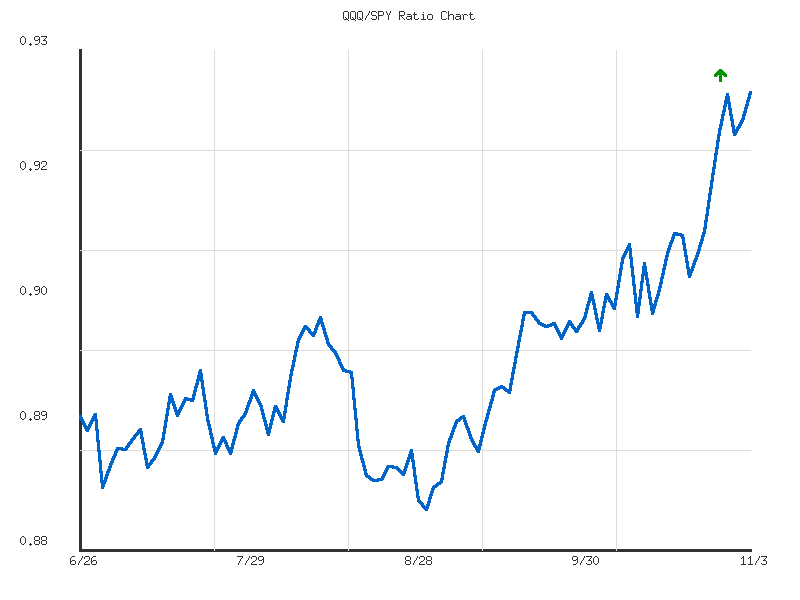
Ratio Analysis: QQQ/SPY
Generated for 90days timeframe analysis
IWM vs. SPY
The analysis of the RATIO:IWM/SPY over the provided 14-day period reveals a clear pattern of relative underperformance by the Russell 2000 (IWM) compared to the S&P 500 (SPY). The ratio initiated at approximately 0.3743 on October 14th, 2025, and concluded at 0.3591 on November 3rd, 2025, marking a moderate downtrend. This decline represents a total change of -4.0598% in IWM’s relative strength against SPY during this timeframe. The average ratio for the period was 0.3658, with a high of 0.3763 and a low of 0.3590. The persistent downward trajectory indicates that, on balance, large-cap equities represented by SPY have been absorbing a greater share of market capital than the small-cap segment, IWM, over these fourteen trading days.
The current ratio of 0.3591 is notably close to the 14-day low of 0.3590, suggesting sustained pressure on IWM’s relative performance. This proximity to the lowest point of the observation period indicates that the small-cap index concluded the period in a position of significant relative weakness. The volatility of the ratio, recorded at 0.00002637, is quite low. This low volatility, coupled with the consistent downtrend, implies that the underperformance has been relatively steady and not characterized by sharp, erratic swings. Such a consistent decline without significant intra-period bounces typically reinforces the underlying trend direction, suggesting limited buying interest in IWM relative to SPY within this specific window.
Given the established moderate downtrend and the current ratio’s position near the lower bound of its 14-day range, it is likely that IWM will continue to exhibit relative underperformance against SPY in the immediate future. The lack of any discernible technical reversal patterns within the provided data further supports this outlook. While a short-term bounce or period of consolidation around current levels remains a roughly even chance, any significant reversal, implying IWM outperforming SPY, is unlikely without a clear technical catalyst, such as the ratio breaking above its recent average or establishing a higher low. Traders should recognize the prevailing directional bias and consider its implications for sector rotation or asset allocation decisions, focusing on the current technical weakness in small caps relative to large caps based purely on this data.
CMT Technical Analysis: IWM/SPY Ratio (90-Day View)
The IWM/SPY ratio has displayed a weak upward trend over the past 90 days, as indicated by a net change of 2.01% from late June to early November. The ratio commenced the period around 0.352 and currently stands at 0.3591. This overall trajectory suggests a slight outperformance of small-cap equities (IWM) relative to the broader market (SPY) across the entire observation window. However, this long-term perspective belies significant volatility within the period, with the ratio establishing a low of 0.3456 in early August and a high of 0.3763 in mid-October. The current ratio is marginally below the 90-day average of 0.3596, signaling a recent shift in the balance of buying and selling pressure.
A closer examination of recent price action reveals a distinct shift in momentum. Following a strong rally that culminated in a peak of 0.3763 on October 15th, the IWM/SPY ratio has undergone a substantial retracement, declining approximately 4.5% to its current level of 0.3591. This sharp and persistent decline strongly suggests that short-term momentum has transitioned from bullish to bearish. The ratio’s inability to sustain levels above 0.365 in late October, followed by a breach of the 90-day average, indicates that sellers have likely gained control in the near term. The 0.3763 level is now firmly established as a significant overhead resistance, and it is highly unlikely that the ratio will retest this peak without a considerable period of consolidation or a robust shift in sentiment.
Looking ahead, the immediate focus for the ratio will likely be on identifying potential support zones. The prior resistance area around 0.362-0.364, which previously offered a ceiling in September and early October, could now act as initial resistance in the event of any rebound. More critically, historical data shows the ratio has found support in the range of 0.350-0.352 during July. A decline to this region is a roughly even chance given the current bearish momentum and the recent breakdown from higher levels. Should this support fail to hold, the low established in early August around 0.3456 would represent the next significant technical floor. A drop to this extreme lower bound is unlikely in the immediate short-term unless the selling pressure accelerates meaningfully.
While the short-term technical picture for the IWM/SPY ratio suggests continued weakness, an alternative scenario involving a sustained reversal would likely necessitate a decisive move back above the 90-day average of 0.3596. This would then need to be followed by a retest and successful breach of the 0.362-0.364 resistance band to invalidate the current bearish lean. Failure to regain these levels would further corroborate the short-term bearish outlook. Given the current trajectory and the ratio’s position below its average, it is likely that the IWM/SPY ratio will continue to either consolidate or drift lower towards the 0.350-0.352 support zone in the coming sessions. A significant upward rebound from current levels is possible, but unlikely to materialize without first establishing a clear, confirmed bottom.
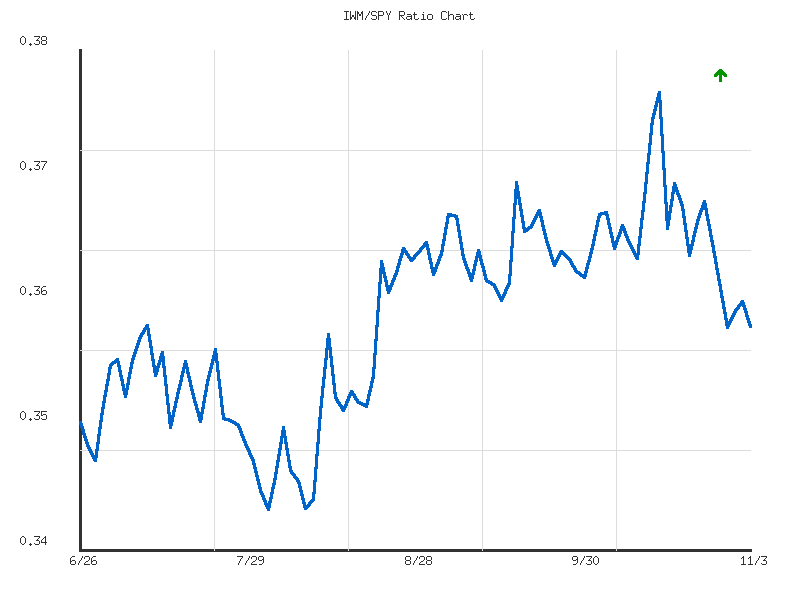
Ratio Analysis: IWM/SPY
Generated for 90days timeframe analysis
Commodities
| Symbol | Daily Percent Change |
|---|---|
| UNG | 3.925% |
| UGA | 1.229% |
| CORN | 0.931% |
| DBC | 0.721% |
| USO | 0.248% |
| GLD | 0.209% |
| SLV | -0.568% |
| CPER | -0.888% |
An analysis of the daily percentage changes across these eight commodity-related instruments reveals a general upward bias in today’s session, yet with notable divergences. UNG, representing natural gas, led the advances with a significant 3.925% gain, suggesting strong upward momentum for this specific energy commodity. UGA (gasoline), CORN (corn), and DBC (a broad commodity index) also posted respectable gains, reinforcing a positive sentiment across various energy and agricultural sectors. USO (oil) and GLD (gold) exhibited more modest gains, indicating a less pronounced, but still positive, directional bias in those specific areas.
The market breadth for this specific basket of commodities appears moderately positive. Six of the eight symbols advanced, while only two declined, yielding an advance-decline ratio of 3:1. This pattern suggests that a majority of the observed commodity sectors experienced positive price action. It is likely that this broad positive participation, particularly from energy and agricultural commodities, reflects a generalized, though not universal, bullish sentiment within these specific market segments for the analyzed period.
Despite the prevailing positive breadth, the performance of SLV (silver) and CPER (copper) presents a notable contrast. SLV declined by 0.568%, and CPER, an industrial metal, experienced the largest decline at -0.888%. This divergence between the strength in energy and agriculture, and the weakness in industrial metals and silver, suggests that the underlying market dynamics are not uniformly supportive across all commodity sub-sectors. It is likely that specific pressures are weighing on industrial and certain precious metals, even as other segments demonstrate strength.
Considering the distinct performance, it is roughly even chance that the observed price action indicates a rotation of capital within the commodity complex rather than a broad-based, unified move. While the strong performance in natural gas (UNG) and other energy/agricultural commodities points to particular strength in those areas, the underperformance of CPER and SLV makes it unlikely that this strength is currently uniform across all materials or precious metals. This selective strength warrants continued observation for further confirmation of sector-specific trends.
As a CMT with extensive experience, my analysis of the provided two-day market data for various commodity-linked ETFs reveals a bifurcated technical landscape, with clear divergences in short-term momentum. Price and volume dynamics indicate distinct patterns across different assets, suggesting that a unified directional bias across the entire commodity complex is not currently warranted.
Several commodity instruments present discernible bullish patterns. The Invesco DB Commodity Index Tracking Fund (DBC), the US Gasoline Fund (UGA), the US Natural Gas Fund (UNG), and the Teucrium Corn Fund (CORN) all exhibit upward momentum. DBC recorded two consecutive bullish closes, with the second session displaying a higher high, higher low, and a stronger close on increased volume, strongly suggesting a high probability of continued upward price action. Similarly, UGA and UNG both demonstrate robust advances, characterized by significantly higher closes and substantial volume increases for UGA, alongside sustained high volume for UNG, indicating a high probability of further price appreciation. CORN also confirms this upward trend with two bullish candles and increasing volume on the second day.
Conversely, the iShares Silver Trust (SLV) and the United States Copper Index Fund (CPER) show emerging bearish technicals. SLV registered two consecutive bearish candles, achieving lower lows and lower closes. While the second day’s volume decreased, which could suggest a potential short-term waning of selling pressure, the predominant price action indicates a likely continuation of the downtrend. CPER exhibits a more pronounced bearish shift; after a mildly bullish first day, the second session formed a strong bearish candle that erased the prior day’s gains and closed near its session low on increased volume. This pattern suggests a roughly even chance of further downside or at least a significant test of support levels in the immediate term.
The technical picture for the US Oil Fund (USO) and the SPDR Gold Shares (GLD) appears more ambiguous, indicating periods of consolidation or indecision. USO recorded two narrow-range candles; the second day’s slightly bullish close, while positive, occurred on significantly lower volume. This suggests a roughly even chance of either a continuation of this tight consolidation or a potential near-term price reversal, as conviction appears to be lacking on both sides of the market. GLD’s price action shows an initial bearish day followed by a small, contained bullish candle on substantially lower volume. Despite the second day’s close being marginally positive relative to its open, it failed to overcome the prior day’s bearish sentiment. This suggests a likely period of consolidation or indecision, with no strong directional conviction evident from the provided data.
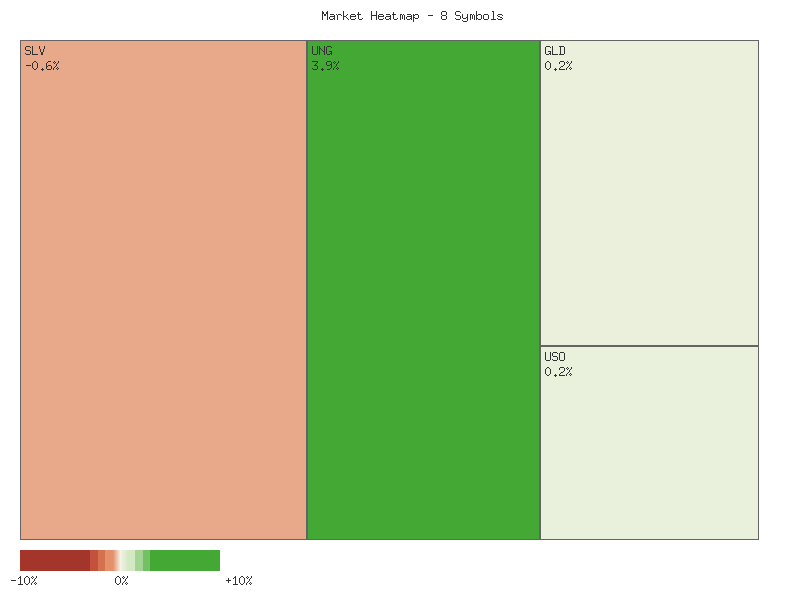
Performance Heatmap (SLV, GLD, CORN, CPER, USO, DBC, UGA, UNG)
Generated for 2days timeframe analysis
Technical Analysis of SLV (90-Day View)
SLV exhibited a pronounced uptrend over the past 90 days, advancing from approximately in late June to a peak of .405 on October 15. This rally was characterized by periods of strong upside momentum and noticeable volume expansion. However, a significant reversal commenced mid-October, with SLV declining sharply to the current level of .76 as of November 3. This recent price action likely indicates a shift in market sentiment, moving from a sustained bullish phase to a corrective or potentially bearish phase. The magnitude of the recent decline suggests that the prior upward momentum may have exhausted, raising the probability of further downward pressure in the near-term.
The 14-day Relative Strength Index (RSI) provides further insight into momentum dynamics. During the initial and middle stages of the uptrend (July, September, early October), the RSI frequently entered and sustained itself within overbought territory (above 70), at times exceeding 80 (e.g., 84.32 on October 13). This highly probable sustained overbought condition signaled strong buying interest, yet also increased the probability of an eventual pullback due to stretched momentum. The subsequent sharp decline in price from mid-October was accompanied by a rapid decrease in the RSI from highly overbought levels, falling to 52.87 by October 21 and settling around 52.16 by November 3. This sharp decline from extreme overbought territory suggests a significant loss of buying momentum and increased selling pressure.
Volume analysis reinforces the observed price action. Periods of substantial price gains, particularly in July and September, coincided with noticeable increases in trading volume, indicating conviction behind the rallies. The peak in price on October 15 was followed by a day of very high volume (86 million shares) on October 17 during a significant price drop, and another on October 21 (81 million shares) as SLV sold off further. This increased volume on down days during the recent reversal is a key technical signal, suggesting that institutional or substantial selling may be occurring. This pattern of high volume accompanying price declines increases the probability that the mid-October peak could represent a significant resistance level for the near-term.
Considering the current technical posture, there is a moderate probability that SLV may continue its corrective phase. The breakdown from the prior highs with elevated volume, coupled with the RSI falling from overbought levels, suggests that sellers retain control in the immediate term. The area around , representing prior resistance and now approximate current price, could act as a minor pivot point. A sustained move below this level would likely indicate further weakness, with the possibility of testing the support levels around the - range from late September. Conversely, a re-establishment of bullish momentum would probably require SLV to reclaim and hold above the recent decline’s starting point, around , which appears unlikely in the near-term given the current momentum. It is important to note that MACD data was not provided for this analysis, limiting a comprehensive view of trend strength and reversals from that specific oscillator.
SLV Price & Indicators (RSI_14_DAY, MACD_13_21_DAY)
GLD has exhibited a dynamic trading pattern over the past 90 days, transitioning from a period of consolidation to a significant rally, culminating in a sharp correction. Initially, GLD traded largely range-bound in July, roughly between and , before initiating a sustained uptrend in late August. This bullish phase gained considerable momentum through September and into mid-October, pushing the asset to a peak near .15 on October 20th. This impressive ascent was supported by generally increasing volume during key breakout periods, reinforcing the strength of the move. However, following this peak, GLD experienced an abrupt and significant decline, retracing substantially to approximately .89 by the end of the provided data, indicating a clear shift in market sentiment.
The 14-day Relative Strength Index (RSI) provides critical insight into the momentum shifts during this period. Throughout the primary uptrend from late August to mid-October, the RSI consistently moved into and remained within overbought territory, frequently registering above 70. Multiple readings soared even higher, reaching 86.11 on October 8th and peaking at an extreme 87.33 on October 20th. While these elevated RSI levels confirm the powerful bullish momentum driving GLD’s price appreciation, such extreme overbought conditions inherently increase the likelihood of a significant price correction, as the asset becomes stretched relative to its historical performance.
The sharp reversal in price from the October 20th peak was immediately corroborated by a dramatic plunge in the 14-day RSI. The indicator fell precipitously from its peak of 87.33, dropping below 60 on October 21st and continuing to decline into the low 50s by the end of the data series, settling at 52.66 on November 3rd. This rapid exit from deeply overbought conditions into a more neutral zone (roughly 45-55) strongly suggests that the intense buying pressure has largely dissipated. The current RSI reading, while not oversold, signifies a market that has lost its prior bullish impetus, and a further move below the 50-level would likely indicate increasing bearish momentum. The requested MACD (13,21-day) data was not provided, therefore, this analysis is confined to price action and the 14-day RSI.
Based on the provided technical data, it is likely that GLD will experience further consolidation or potential downside in the near term as the market adjusts to the recent sharp correction. The confluence of a price peak at significantly high volume and extreme overbought RSI readings, followed by a swift and substantial decline in both, indicates a possible exhaustion of the prior bullish trend. A resumption of the immediate prior uptrend appears unlikely without a period of base building and a re-accumulation of bullish momentum. Alternatively, there is a roughly even chance that GLD might stabilize around current price levels, potentially forming new short-term support, before a more definitive directional bias becomes evident.
GLD Price & Indicators (RSI_14_DAY, MACD_13_21_DAY)
Gold/Silver Ratio
The GLD/SLV ratio has established a moderate upward trend over the observed 14-day period, demonstrating a 3.60% increase from its starting point. The ratio experienced a significant price range, moving from a low of 8.015 on October 15th to a high of 8.656 on October 27th. The current ratio stands at 8.430, positioned closer to the higher end of this recent range, specifically at 64.7% of the total range from low to high. Volatility during this period has been relatively low, suggesting a generally steady progression within the defined trend.
Following its peak at 8.656, the ratio underwent a pullback, declining to 8.348 by October 30th. This movement suggests a period of profit-taking or consolidation. Subsequently, the ratio has shown a minor rebound, reaching 8.430 on November 3rd. This recent price action implies that the area around 8.34-8.36 may be acting as immediate support. Conversely, the previous high of 8.656 is likely to serve as a near-term resistance level that the ratio would need to overcome to signal a resumption of stronger upward momentum.
Considering the recent rebound from the implied support, a continuation of the moderate upward trend is likely, provided the ratio maintains its position above the 8.348 level. Should the ratio fail to hold this immediate support and decline below it, there is a roughly even chance of it retesting the lower levels observed earlier in the 14-day period, particularly around 8.136. A decisive move above 8.656 would indicate increased bullish conviction, making a sustained uptrend very likely.
Here is a technical analysis of the GLD/SLV ratio data, adhering to strict estimative language guidelines:
The GLD/SLV ratio has exhibited a moderately strong downtrend over the past 90 days, commencing from highs near 9.40 in early July 2025 and currently resting at approximately 8.43 as of November 3, 2025. This represents an observed decline of roughly 8.39% across the dataset. The ratio has consistently traded below its 90-day average of 8.76 for a significant portion of this period, reinforcing the bearish technical posture. The current relative position at 0.3076 suggests the ratio is in the lower third of its observed range, indicating that momentum has been predominantly to the downside during the analyzed timeframe. While the provided volatility measure is 0.1005, the consistent formation of lower highs and lower lows characterizes the overarching trend.
Initial resistance was encountered near the 9.40 level in early July, which marked the highest point within this dataset. Subsequent rallies generally failed to reclaim this level, with resistance observed around 9.20 in early August and again near 9.0 in mid-August and early September. These declining resistance levels are a characteristic feature of an established downtrend. Support has been less clearly defined in the earlier part of the period, initially appearing around the 8.80-8.90 region during July and August. However, this support was decisively breached in late September, leading to a capitulation phase. The ratio subsequently established new, albeit temporary, support around 8.60-8.70 before breaking lower to the period’s nadir.
The GLD/SLV ratio reached its 90-day low of 8.00 on October 13, marking a significant point of bearish exhaustion. From this low, the ratio has experienced a notable bounce, recovering to its current level of approximately 8.43. This rebound, while appearing energetic, has brought the ratio back towards a previous resistance zone around 8.40-8.60 that formed in late September and early October. Given the prevailing moderate downtrend, there is a likely chance that this area will act as overhead resistance, potentially stemming further upside momentum. A sustained move above 8.60 would be required to suggest a more significant short-term reversal of the decline from the 9.40 peak.
While the immediate technical outlook suggests continued downward pressure is likely, an alternative scenario warrants consideration. Should the ratio demonstrate the ability to decisively overcome the 8.60 resistance zone, then a test of the longer-term average of 8.76 becomes likely. Such a breakout could indicate a potential shift from the current downtrend, although it would not necessarily signal a complete trend reversal without further confirmation, such as a move above the prior resistance levels near 9.0. Conversely, failure to sustain the bounce above the 8.40-8.60 resistance range increases the likely chance of the ratio resuming its descent towards the 8.00 low, with a highly likely chance of testing this support level if the 8.20 area fails to hold. The volatility reading indicates that price swings are to be expected as the ratio navigates these key levels.
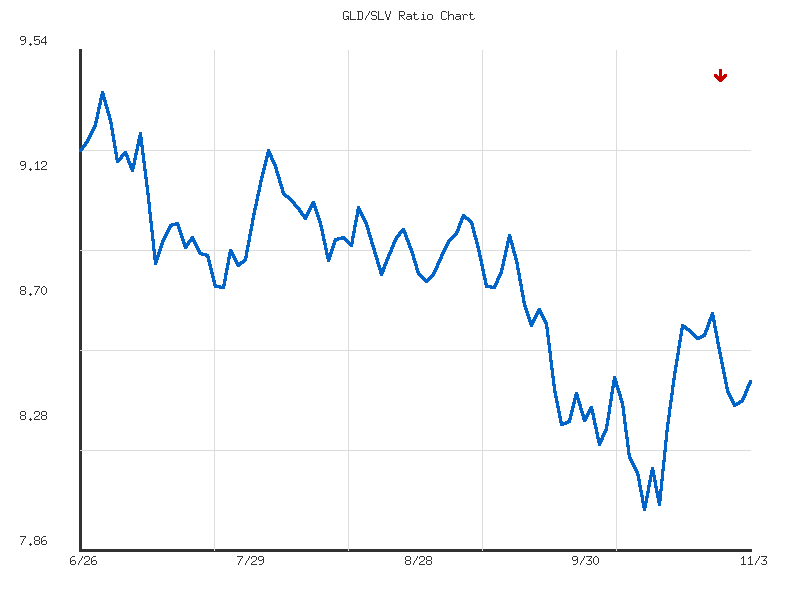
Ratio Analysis: GLD/SLV
Generated for 90days timeframe analysis
Bonds
The provided market data indicates a universal negative daily change across all observed symbols for the specified day. The magnitude of these declines spans from a low of -0.307% to a high of -0.650%. Organizing the data by daily percentage change in descending order provides the following overview:
| Symbol | Daily Percent Change |
|---|---|
| SHY | -0.307% |
| IEI | -0.326% |
| IEF | -0.361% |
| TLT | -0.631% |
| UTHY | -0.650% |
This matrix clearly illustrates that while all instruments experienced a depreciation for the day, the relative magnitudes of these movements varied considerably within the observed set.
The data suggests a discernible differentiation in market sensitivity among these symbols. Specifically, UTHY and TLT registered the most significant daily percentage declines, falling -0.650% and -0.631% respectively. This indicates a relatively stronger negative momentum for these particular instruments compared to the group. In contrast, SHY, IEI, and IEF experienced more contained negative movements, with SHY showing the least decline at -0.307%, followed closely by IEI at -0.326% and IEF at -0.361%. This pattern implies that certain instruments within this observed set are more susceptible to price depreciation on this specific trading day, experiencing a nearly twofold greater percentage loss than the least affected symbols.
Based solely on this singular day’s data, it is likely that selling pressure was broad-based across these instruments. The pronounced declines in UTHY and TLT suggest these specific symbols are experiencing greater relative weakness. A continuation of this differentiated performance, with UTHY and TLT potentially continuing to underperform the others, is a reasonable possibility in the immediate short-term if the underlying market dynamic persists. However, given that this analysis is based on only one day’s price action, a reversal or a stabilization across the board holds a roughly even chance. There is insufficient data from this limited timeframe to definitively ascertain a strong, sustained trend or a robust shift in momentum for any individual symbol beyond this single observation. Further data points would be necessary to establish more robust technical conclusions regarding ongoing trends or reversals.
Technical Market Commentary: Fixed Income ETF Review (2-Day Analysis)
This analysis focuses solely on the provided two-day candle and volume data for the fixed-income ETFs TLT, UTHY, IEF, IEI, and SHY. Over the observed period ending November 3, 2025, a pervasive bearish sentiment appears to have dominated the Treasury bond market across various maturities. All five ETFs experienced a clear price decline, characterized by significant gap-downs at the open of the November 3rd trading session. This suggests strong selling pressure between trading periods, implying a material shift in market expectations that bypassed regular trading hours. The uniform direction across long, intermediate, and short-term instruments indicates a broad-based move rather than an isolated event.
Examining the longer-duration instruments, TLT (Long-Term Treasury Bond ETF) registered a notable two-day decline. The October 31st session concluded near its low, setting a bearish tone. On November 3rd, TLT gapped down significantly and continued lower, with the close substantially below the prior day’s close. This decline was accompanied by an increase in trading volume on November 3rd, from approximately 37.97 million shares to 39.80 million shares. This volume expansion on the down move is often interpreted as confirmation of the bearish momentum. In contrast, IEF (7-10 Year Treasury Bond ETF) also gapped down and declined on November 3rd, but its volume decreased from 9.74 million to 8.00 million shares. While the price action remains bearish, the declining volume might suggest less aggressive selling pressure or reduced conviction compared to TLT for this specific maturity segment.
Shorter-duration fixed-income ETFs, including IEI (3-7 Year Treasury Bond ETF), SHY (1-3 Year Treasury Bond ETF), and UTHY (Ultrashort Treasury ETF), also exhibited distinct bearish price action. SHY displayed a flat trading day on October 31st before gapping down sharply on November 3rd, closing significantly lower with a notable increase in volume from 3.59 million to 5.39 million shares. Similarly, IEI, after a relatively flat October 31st, experienced a gap down and a clear decline on November 3rd, accompanied by an increase in volume from 1.84 million to 2.17 million shares. UTHY, though with lower absolute volume, showed a substantial percentage increase in volume on its down day (from 4.41 thousand to 10.37 thousand shares), lending weight to its two-day decline. These observations broadly suggest that selling pressure was not confined to longer-duration bonds but extended across the yield curve.
A critical technical observation is the opening price on November 3rd for all five ETFs: each gapped down below the previous day’s low. These gaps are typically considered areas of strong resistance on future upward movements. Furthermore, for most of these instruments (TLT, UTHY, IEF, IEI, SHY), the close on November 3rd was above the day’s absolute low. While this could be an early and tentative sign of some intraday buying interest attempting to stabilize prices, its significance is likely limited given the pronounced bearish gap and overall price depreciation over the two days. The broader pattern remains one of breakdown.
Given the consistent bearish price action across all maturities, marked by opening gaps and generally confirming volume on the downside (with the exception of IEF’s volume contraction), a continuation of the downtrend is likely in the immediate future for these fixed-income ETFs. The gaps down on November 3rd will likely act as overhead resistance should any rebound attempt materialize. An alternative scenario, a short-term bounce, might develop given that several instruments closed off their intraday lows on November 3rd, which indicates some intraday price rejection at the bottom. However, considering the dominant bearish momentum, a sustained recovery appears unlikely without further confirming price action. A return to test the lower bounds of the November 3rd gaps as potential resistance levels represents a roughly even chance if any meaningful buying interest were to emerge.
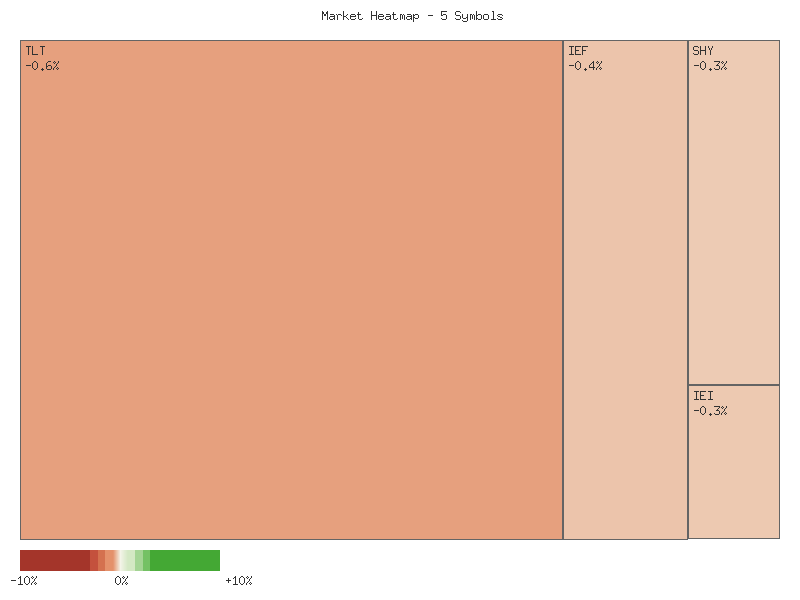
Performance Heatmap (TLT, UTHY, IEF, IEI, SHY)
Generated for 2days timeframe analysis
Magnificent 7 & Friends
| Symbol | Daily Percent Change |
|---|---|
| AMZN | 4.033% |
| TSLA | 2.587% |
| NVDA | 2.168% |
| GOOGL | 0.900% |
| ANET | -0.057% |
| MSFT | -0.151% |
| AAPL | -0.533% |
| META | -1.641% |
| AVGO | -1.872% |
| CRWV | -5.538% |
Analysis of the provided single-day percentage change data reveals a notably mixed performance across the observed symbols. AMZN, TSLA, and NVDA exhibited the strongest positive momentum, with AMZN leading the group with a 4.033% gain. This level of increase in a single session is significant and suggests a strong buying interest for AMZN. TSLA and NVDA also posted solid gains of 2.587% and 2.168% respectively, indicating a favorable trading day for these technology-related stocks. GOOGL’s modest gain of 0.900% positions it as a positive performer, albeit with less pronounced strength compared to the top three. Without additional context like volume or prior price action, it is difficult to ascertain with high confidence whether these moves represent the continuation of an established uptrend or an isolated event; however, the magnitude of AMZN’s move makes a follow-through day likely.
Conversely, CRWV experienced a substantial decline of 5.538%, marking it as the day’s weakest performer. This sharp depreciation suggests significant selling pressure or a notable shift in sentiment for CRWV. AVGO and META also registered notable losses of 1.872% and 1.641% respectively, indicating broad-based weakness for these specific securities. Minor declines were observed in AAPL (-0.533%), MSFT (-0.151%), and ANET (-0.057%). The varied nature of these negative movements, particularly the pronounced drop in CRWV, implies that the selling pressure was not uniformly distributed across all declining assets but rather concentrated in specific areas. It is likely that CRWV’s decline could test near-term support levels if prior price data were available, but the current data prevents a definitive assessment.
The data for MSFT and ANET shows a relatively flat trading day, with changes of less than 0.16% in either direction. This minimal movement suggests that these symbols experienced roughly even buying and selling interest, resulting in neither a strong bullish nor bearish technical signal for the session. From a purely technical perspective, such indecisive daily action, when viewed in isolation, provides limited directional conviction. It presents a roughly even chance of continuing within a tight range or experiencing a more significant move in either direction on the subsequent trading day, given the absence of volume or momentum indicators.
Overall, the snapshot of daily performance illustrates a divergence in market sentiment among these technology and growth-oriented stocks. While a cluster of names (AMZN, TSLA, NVDA) demonstrated clear upside momentum, another group (CRWV, AVGO, META) faced significant downward pressure. This selective strength and weakness could be indicative of sector-specific rotations or individual stock-driven catalysts. However, relying solely on single-day percentage changes restricts the ability to draw higher-confidence conclusions regarding future price action or the robustness of these movements. To form a more comprehensive technical outlook, one would typically integrate these daily changes with volume data, candlestick patterns, and broader market context, which are not present in this dataset. Without such supplementary information, any long-term directional prediction carries low confidence.
Technical Market Commentary: Two-Day Equity Review (Oct 31 – Nov 3, 2025)
This analysis provides a rigorous technical assessment of the provided two-day market data for the specified equities, focusing solely on price action, candlestick patterns, and volume. The observed price movements across this selection of stocks indicate a bifurcated market sentiment, with distinct bullish and bearish trends emerging, alongside a few exhibiting less conclusive patterns.
Several equities demonstrated robust bullish momentum over the two-day period. TSLA exhibited strong upward continuation, characterized by two consecutive bullish candles, consistently printing higher highs and higher lows, accompanied by a slight increase in volume on the second day. This pattern suggests it is highly likely to experience further upward price movement in the immediate future. Similarly, AMZN and NVDA both staged significant bullish reversals on November 3rd, with their second-day candles effectively engulfing the prior day’s bearish bodies. This bullish engulfing pattern, coupled with a notable gap-up on open for both, typically signals a strong shift in sentiment. However, the subsequent decrease in volume for both AMZN and NVDA on the second day suggests a roughly even chance of sustained immediate follow-through, as the buying conviction may not be as broad as the price action implies, potentially leading to some consolidation before further gains.
Conversely, a substantial number of equities displayed clear bearish pressure. META, AAPL, and AVGO all presented two consecutive bearish candles, consistently marking lower highs, lower lows, and closing near their daily lows, indicating a continuation of selling pressure. For META and AVGO, the second day opened higher than the prior close, only to be overwhelmed by sellers, reinforcing the bearish outlook. CRWV showed particularly strong bearish intent; after an ambiguous Day 1 closing near its open, Day 2 opened at its high and plunged, forming a large bearish candle that closed near its extreme low on significant volume. Based on these patterns, it is highly likely that META, AAPL, AVGO, and especially CRWV will experience continued downward pressure. The declining volume observed in these bearish movements could imply either diminishing selling pressure or a lack of buying interest, but the prevailing price action remains unequivocally bearish.
A few names exhibited more ambiguous or consolidating patterns, presenting a roughly even chance of either continuation or reversal from their immediate trajectories. ANET, for instance, showed two bearish candles, but its closing prices were nearly identical. Although Day 2 attempted an early bounce, it ultimately faded, suggesting resilience around the lower price levels (around 155). MSFT also posted two bearish candles with a lower low on Day 2, yet its final close was only marginally below Day 1’s close, and volume significantly declined. This indicates a tempering of selling pressure, making the immediate next move a roughly even chance between a slight continuation of the downtrend or potential stabilization. GOOGL’s pattern of a bearish Day 1 followed by a bullish Day 2, with the latter closing above Day 1’s close, suggests a short-term bullish reversal. However, the significantly reduced volume on Day 2 tempers the conviction of this reversal, leading to a roughly even chance of a sustained rally or a test of prior resistance levels.
In summary, the two-day technical data reveals a market with pronounced directional moves in key large-cap names. While TSLA, AMZN, and NVDA project near-term bullish potential, a larger cohort including META, AAPL, AVGO, and CRWV are exhibiting clear signs of bearish continuation. The overall decrease in trading volume for many of these stocks on the second day suggests a potential decrease in market participation or conviction, which could lead to choppier or less sustained directional movements in the very near future. Traders are advised to monitor the volume trends closely for confirmation or divergence from the established price patterns.
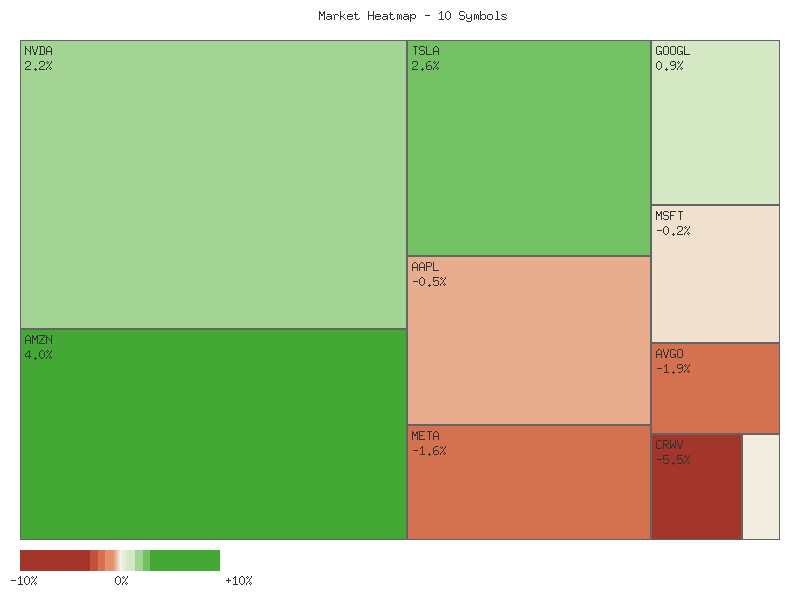
Performance Heatmap (TSLA, MSFT, AAPL, META, NVDA, AVGO, GOOGL, AMZN, CRWV, ANET)
Generated for 2days timeframe analysis
S&P 500 Sector Breadth
📊 MARKET COMMENTARY: Sector Performance and Breadth Analysis
The broader market breadth, as observed across the eleven provided S&P 500 sectors, indicates a marginally negative leaning for the trading period. With five sectors posting gains and six experiencing declines, the distribution suggests that a robust, broad-based rally is unlikely in the immediate term. The average daily percentage change across all sectors is slightly negative, reinforcing this observation of subdued overall market momentum.
An analysis of the classified offensive sectors reveals a mixed picture. Three of the six offensive sectors, specifically XLY (Consumer Discretionary), XLK (Technology), and XLE (Energy), advanced, with XLY showing the most significant positive movement among all observed sectors. However, the remaining three offensive sectors, XLF (Financials), XLI (Industrials), and XLB (Materials), experienced declines. This balanced performance within the offensive cohort suggests that while pockets of growth and risk appetite exist, a unified ‘risk-on’ sentiment across these cyclically sensitive areas is unlikely to be prevalent.
Similarly, the defensive sectors displayed a split performance. Two of the four defensive sectors, XLV (Health Care) and XLU (Utilities), recorded slight gains. Conversely, XLRE (Real Estate) and XLP (Consumer Staples) both declined, with XLP showing a notable negative change. This pattern in defensive plays makes a clear ‘flight to safety’ highly unlikely. The lack of a decisive move in either direction among defensive sectors further contributes to the overall ambiguous market sentiment.
Considering the performance across both offensive and defensive classifications, evidence for a strong market rotation is not readily apparent. While offensive leaders like XLY and XLK showed strength, other offensive components like XLF and XLI declined. Concurrently, defensive sectors were bifurcated, with some advancing and others retreating. This mixed activity, coupled with a significant decline in the unclassified XLC (Communications Services) sector, suggests it is roughly an even chance that the market is attempting to find a new equilibrium rather than committing to a clear directional bias. Therefore, based solely on this data, a prevailing risk-on or risk-off sentiment is unlikely to be dominating the market.
| Symbol | Daily Percent Change |
|---|---|
| XLY | 0.971% |
| XLK | 0.429% |
| XLV | 0.118% |
| XLU | 0.067% |
| XLE | 0.011% |
| XLRE | -0.196% |
| XLF | -0.420% |
| XLI | -0.445% |
| XLB | -0.619% |
| XLP | -0.734% |
| XLC | -1.045% |
Here is a technical analysis of the provided market data:
The recent two-day period, ending November 3, 2025, presents a mixed technical picture across the S&P 500 sector ETFs. While some sectors show signs of strength and potential bullish continuation, others exhibit clear selling pressure or indecision. Divergent volume trends either confirm or cast doubt upon the sustainability of recent price movements. This confluence of varied technical signals suggests broad directional conviction is currently lacking, implying a need for careful, sector-specific observation.
Focusing on bullish characteristics, Healthcare (XLV) demonstrated resilience. After a strong upward close, XLV registered a higher close on the second day, supported by increased volume (10.58M to 12.17M). This volume confirmation suggests continued buying interest is likely, supporting further upward movement or consolidation at elevated levels. Consumer Discretionary (XLY) also showed a significant rebound with a strong bullish candle, indicating a shift in momentum. However, this robust price increase occurred on decreasing volume (6.71M to 5.34M), introducing caution. While immediate momentum appears bullish, the lack of volume confirmation suggests roughly an even chance that this rally could face resistance or pull back without renewed conviction.
Conversely, several sectors displayed notable technical deterioration. Communication Services (XLC) and Consumer Staples (XLP) both formed bearish engulfing patterns on the second day, closing significantly lower on increased volume (XLC: 5.25M to 6.40M; XLP: 14.66M to 16.05M). It is highly likely these sectors will experience further downward pressure. Materials (XLB) registered a decisive bearish candle, closing near its low on substantially increased volume (8.76M to 11.56M), making further weakness likely. Real Estate (XLRE) also closed lower on increased volume (9.79M to 10.79M), suggesting a likely continuation of its bearish trajectory. Financials (XLF) and Industrials (XLI) also showed bearish closes below their prior day’s close. However, selling in these occurred on decreasing volume (XLF: 40.41M to 38.01M; XLI: 10.41M to 9.69M), indicating waning selling conviction. For XLF and XLI, there is roughly an even chance of either continued weakness or a short-term rebound.
Finally, a few sectors presented indecision or consolidation. Energy (XLE) exhibited minimal price change on the second day, forming a doji-like candle after a bullish prior day. This flat action, with decreasing volume (13.47M to 10.81M), signals temporary equilibrium. Utilities (XLU) also traded within a narrow range with negligible net price change, despite increased volume, underscoring indecision. Technology (XLK) formed an inside bar, entirely contained within the previous day’s range, alongside decreasing volume (8.15M to 6.94M). For XLE, XLU, and XLK, a roughly even chance exists for movement in either direction, awaiting a clear catalyst.
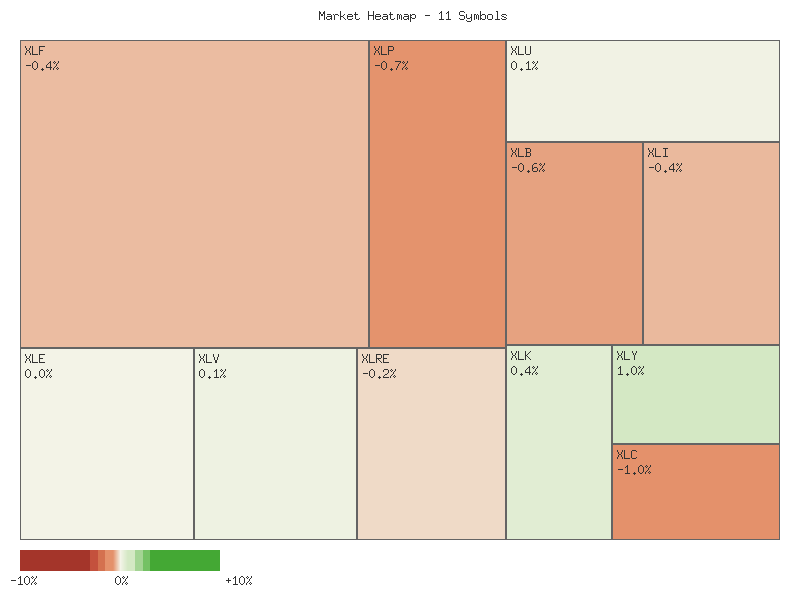
Performance Heatmap (XLP, XLRE, XLI, XLU, XLV, XLY, XLF, XLB, XLE, XLC, XLK)
Generated for 2days timeframe analysis
XLY vs XLP
The XLY/XLP ratio has demonstrated a clear and sustained upward trajectory over the past seven days. Beginning at 3.0049 on 2025-10-24, the ratio systematically advanced, culminating in a close of 3.1994 on 2025-11-03. This upward movement represents a 6.47% appreciation within the observation window, indicating a period where the Consumer Discretionary sector (XLY) has materially outperformed the Consumer Staples sector (XLP). The provided trend analysis explicitly categorizes this behavior as an “up” direction with “moderate” strength.
Analyzing the daily data points reveals a largely consistent ascent. While there was a minor retracement on 2025-10-30, where the ratio dipped to 3.0555, the general pattern was quickly re-established, with the ratio resuming its upward momentum. The current ratio of 3.1994 is the high point for this seven-day period, placing its relative position at 1. Furthermore, the calculated volatility of 0.0038 is quite low, suggesting that this ascent has been relatively smooth and controlled, rather than erratic or highly choppy. This low volatility, coupled with the consistent upward movement, is generally a constructive technical sign for the prevailing trend.
The sustained outperformance of XLY relative to XLP, characterized by a moderate upward trend, low volatility, and the ratio currently situated at its observed high, likely indicates an increasing preference for risk-on assets within the market over this short-term period. This pattern suggests that market participants are increasingly favoring growth-oriented sectors (Discretionary) over more defensive ones (Staples). Should this trend persist, it is likely that the XLY/XLP ratio will continue to advance, potentially seeking higher levels not observable in the provided dataset. However, given the limited data of only seven points, a temporary pullback or consolidation is a plausible alternative scenario. There is a roughly even chance that some consolidation or a minor retracement could occur before another leg higher, especially considering the ratio is at its high for the observed period, potentially indicating a short-term overextension.
The overall technical picture, based purely on the provided data, supports continued relative strength in Consumer Discretionary. The consistent upward movement, moderate trend strength, and low volatility over the analyzed period suggest that the current bullish sentiment for XLY relative to XLP will likely continue in the immediate future. The fact that the ratio is at its high for this period, combined with its positive trend, implies continued momentum. Nevertheless, traders should remain cognizant that even strong trends experience pullbacks. While a significant reversal in the relative strength is unlikely without further data suggesting a breakdown in the established trend, a temporary pause or minor correction should be considered a reasonable possibility for healthy price action.
Technical Analysis: XLY/XLP Ratio (90-Day View)
The provided 90-day market data for the XLY/XLP ratio reveals a clear and sustained upward trend. From its inception around 2.68 on June 26, 2025, the ratio has experienced a significant appreciation, culminating in its highest recorded value of 3.199 on November 3, 2025. This represents a robust increase of approximately 19.3% over the observation period, indicating a strong and persistent outperformance of the Consumer Discretionary sector (XLY) relative to the Consumer Staples sector (XLP). The ratio’s current position at its 90-day high, combined with the “strong” trend strength identified in the data summary, strongly suggests bullish sentiment pervades this intermarket relationship.
Analyzing the progression of the ratio, it is highly likely that the underlying momentum remains strong. The ratio has consistently registered higher highs and higher lows throughout the 90-day window, a classical characteristic of a healthy uptrend. While there were intermittent minor pullbacks, such as those observed around early August and late October, these were shallow and brief, failing to challenge the overall upward trajectory. The low volatility measurement of 0.021 further corroborates a smooth, rather than erratic, ascent. This sustained pattern of strong performance, with the ratio closing at its highest point in the provided dataset, points to a strong probability of continued upward movement in the near term.
Key support levels have formed during this advance. Initially, the ratio found solid footing near the 2.70-2.75 zone in July, before accelerating higher. More recently, prior resistance levels around 2.80-2.85 in mid-August and the psychological 3.00 level in mid-September were decisively breached. These former resistance zones subsequently acted as areas of consolidation or minor support during pullbacks, such as the one seen on October 10th when the ratio briefly dipped to 2.928 before resuming its climb. Given the current vertical ascent to new highs, establishing specific resistance targets from this limited data set is not possible. However, the consistent formation of higher lows implies that recent consolidation zones, particularly around 3.00-3.05, will likely serve as initial support should any short-term retracement occur.
While the prevailing technical evidence points to continued strength, alternative scenarios must be considered. A significant reversal of the current uptrend would require a decisive break below established short-term support levels. For instance, a sustained move below the 3.05-3.00 range would indicate a material weakening of the bullish momentum and suggest that a period of consolidation or a deeper correction could be underway. Such a breakdown is currently unlikely, given the robust nature of the trend and the consistent buying support observed on minor dips. However, traders should monitor for any significant change in daily price action, such as multiple consecutive down days or a breach of the immediate prior low, which would challenge the current bullish conviction. The probability of a sharp reversal without prior warning, especially considering the low volatility, is low, though not impossible in dynamic markets.
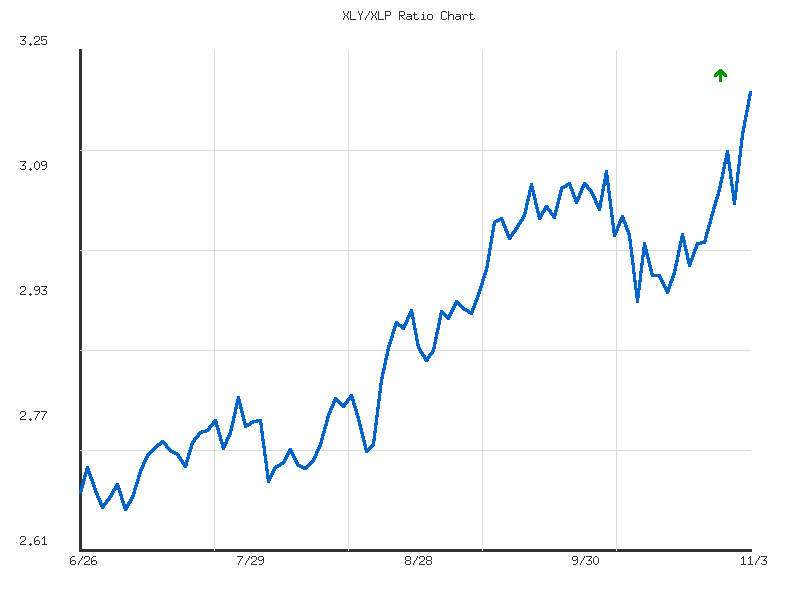
Ratio Analysis: XLY/XLP
Generated for 90days timeframe analysis
Equity Breadth
The percentage of S&P 500 members trading above their 50-day moving average (SPXA50R) exhibited a significant deterioration over the observed seven-day period. From a high of 58.08% on October 27th, the metric rapidly declined to 37.72% by November 3rd. This sharp drop, representing over a 20 percentage point reduction, strongly indicates a broad-based weakening in the short-term momentum of individual stocks within the index. It is highly likely that a substantial number of components have broken below their respective 50-day moving averages, suggesting increasing near-term bearish pressure across the market.
Concurrently, the percentage of S&P 500 members above their 200-day moving average (SPXA200R) also experienced a material downtrend. After peaking at 61.08% on October 27th, this long-term breadth indicator fell below the critical 50% threshold to 49.90% by October 29th, ending the period at 49.30% on November 3rd. The breach of the 50% mark is a notable technical event, as it implies that a majority of S&P 500 constituents are now trading below their long-term uptrend lines. This development suggests a deterioration in the underlying health of the market’s long-term trend.
The simultaneous and pronounced decline in both the short-term (SPXA50R) and long-term (SPXA200R) breadth indicators suggests broad-based market weakness. The rapid acceleration of the SPXA50R’s decline indicates it is highly probable that many individual stocks have shifted from bullish to bearish short-term trends. Furthermore, the SPXA200R’s sustained dip below 50% makes it highly likely that the longer-term structural integrity of the index’s components is also under pressure.
While it is conceivable that such a sharp pullback in breadth could precede a temporary oversold bounce, the magnitude and consistency of the declines observed across both timeframes make it unlikely to be mere minor consolidation. The current data strongly suggests that the path of least resistance for a majority of S&P 500 constituents is currently downward. A reversal in this sentiment would likely require a significant and sustained rebound in these breadth metrics in subsequent periods to indicate renewed buying interest and a shift in underlying trends.
SPY Daily
SPY’s price action over the past seven days indicates a notable deceleration in its previously strong upward momentum, culminating in a recent pullback. On October 27-29, SPY advanced, pushing towards new highs around 689.70, accompanied by RSI values hovering near 70, suggesting overbought conditions. However, the session on October 30 marked a significant shift, with SPY closing at its low of 679.83 on increased volume (80.4 million), forming a prominent bearish candle. This action strongly implies an exhaustion of buying pressure and a surge in profit-taking. The subsequent recovery on October 31 (682.06 close) and the most recent session on November 3 (683.32 close) saw price attempts to rebound, yet the overall direction of the last three sessions leans bearish, characterized by lower high/low formations on October 30 and November 3 relative to the October 29 peak.
The immediate short-term momentum, particularly over the last trading day, appears to be neutral-to-bearish. SPY recorded a bearish candle on November 3, closing lower than its open, albeit within the range of the prior two days. Volume on this last session was notably lower (51.9 million) compared to the preceding days, which may indicate reduced conviction from either buyers or sellers following the prior week’s volatility. The 50-day EMA (662.54) and 200-day EMA (619.64) continue to slope upward, with price trading well above both, confirming a sustained bullish trend on longer timeframes. However, the RSI (14-day) has receded from its elevated levels above 69 on October 29 to 62.62 on November 3, moving away from overbought territory but remaining in bullish control.
Key technical levels suggest near-term resistance around the recent high of 689.70, established on October 29. Immediate support is likely to be found around the October 30 low of 679.83. Should this level fail, the rising 50-day EMA at approximately 662.54 is a significant dynamic support zone, with prior price action showing a strong bounce from 653.02 on October 10. The 200-day EMA at 619.64 offers robust long-term support.
Considering alternative scenarios, a bullish case would involve SPY successfully retesting and breaking above the 689.70 resistance, potentially targeting higher levels. This outcome is plausible if the selling pressure from October 30 proves temporary and is absorbed, possibly indicated by a convincing bullish candle on increasing volume. Conversely, a bearish scenario is likely if SPY breaks below the 679.83 support level. Such a break would imply that the October 30 reversal holds significance, and SPY would likely test the 50-day EMA around 662.54. A move below the 50-day EMA would possibly initiate a deeper correction. A neutral outcome, indicating consolidation, has a roughly even chance of developing if SPY continues to trade within the 679.83 to 689.70 range on lower volume, reflecting market indecision following the recent volatility. The technical sentiment appears cautiously optimistic for longer horizons, given the robust EMA structure, but short-term sentiment is turning more cautious, indicated by the recent price rejection at new highs and the subsequent softening of the RSI.
SPY Technical Analysis: 90-Day Outlook
Over the past 90 trading days, SPY has exhibited a pronounced bullish trend, advancing from the low to the high . This upward trajectory has been characterized by consistent higher highs and higher lows, indicative of sustained buying pressure. Notable price action includes two significant, high-volume pullbacks, specifically around July 31st/August 1st and October 10th. These sharp corrections, while substantial in magnitude, did not invalidate the overarching uptrend, with prices quickly recovering to establish new highs. The latest price action shows SPY at approximately , having experienced a minor pullback from recent all-time highs near , suggesting a period of short-term consolidation or minor correction might be underway following the robust rally. Key support levels appear to be emerging around the mid- and the level from the October 10th rebound.
The 14-day Relative Strength Index (RSI) provides valuable insight into momentum. During the initial phase of the 90-day period (late June to late July), RSI frequently entered overbought territory above 70, peaking near 75, which strongly indicated an accelerated bullish momentum. The sharp price declines in early August and mid-October were accurately reflected in corresponding dramatic plunges in RSI, falling to 47.66 and 41.81 respectively, effectively resetting the momentum oscillator. These resets likely provided opportunities for new buying interest. Following these corrections, RSI generally recovered, often trading in the 50-70 range, signifying strong but less overheated momentum. Most recently, RSI approached the overbought threshold again in late October, climbing to near 69, before moderating to its current reading of 62.62. This moderation aligns with the recent price pullback and suggests that while bullish momentum is still present, the immediate buying fervor has eased slightly.
A comprehensive momentum analysis is constrained by the absence of MACD data in the provided dataset. While the price action and RSI offer substantial clues about market sentiment and trend strength, the lack of MACD prevents an evaluation of its signal line crossovers, histogram movements, and potential divergences, which could either confirm the observed trends or signal underlying shifts in momentum not evident from RSI alone. Therefore, conclusions drawn solely from price and RSI must acknowledge this limitation, as the full picture of trend and momentum health cannot be completely assessed without all requested indicators.
Considering the technical evidence, a continuation of the bullish trend for SPY appears likely in the near term, particularly if the current minor pullback finds support around the - range. Should this support hold, SPY will likely retest the recent high near , and a breakout above this level could lead to further upward price discovery. An alternative, less likely scenario, would involve a deeper correction. A sustained break below the - level, coupled with a further decline in RSI below the neutral 50-mark, could indicate a shift towards more bearish momentum. Such a move might test the more significant support levels around -, areas where SPY previously found strong buying interest. Traders might monitor volume on any potential future declines, as the high volume seen during past significant down days could portend a stronger move if selling pressure intensifies.