Weekly Market Technical Analysis
The market exhibits a long-term bullish trend for large-cap indices (SPY, QQQ), though recent high-volume pullbacks and deteriorating market breadth signals (SPXA50R, SPXA200R) indicate increased short-term pressure, suggesting a near-term consolidation is roughly even chance. Capital is likely rotating from defensive sectors to offensive ones, exemplified by Consumer Discretionary’s strong relative outperformance (XLY/XLP ratio). Energy commodities (UNG, USO) display highly likely continued upward momentum, contrasting with probable downtrends in precious metals (GLD, SLV). The VIX shows a nascent re-escalation of market uncertainty, making continued vigilance on volatility likely. While some major tech names show probable exhaustion, others maintain sustained strength, creating a bifurcated market with selective opportunities. Long-duration bonds are likely to continue showing weakness, while shorter durations show signs of stabilization.
Market Indices
On October 31, 2025, market breadth among the observed indices was unanimously positive, with all six symbols closing in advancing territory. The daily percentage changes for these key market segments were as follows:
| Symbol | Daily Percent Change |
|---|---|
| MDY | 0.609% |
| IWM | 0.564% |
| QQQ | 0.482% |
| SPY | 0.328% |
| OEF | 0.322% |
| IJR | 0.170% |
This universal daily advance is a notable technical observation, indicating a broad-based positive sentiment for the final day of the data series.
Over the preceding 14-day period, a divergence in price action is discernible between large-cap and smaller-cap segments. The large-cap oriented indices (OEF, SPY, QQQ) generally exhibited a more resilient upward trajectory, characterized by larger positive daily changes and fewer, less severe negative sessions. QQQ, representing the tech-heavy Nasdaq 100, notably participated strongly in rally days, suggesting concentrated strength in that segment. Conversely, the small-cap (IJR, IWM) and mid-cap (MDY) indices displayed greater volatility, including more frequent and often larger daily percentage declines, particularly experiencing a series of negative closes between October 28th and 30th. This indicates that while the broader market indices were generally positive, the underlying participation and momentum were not uniform across market capitalizations.
The price action for the last three trading days (October 28-30) prior to the current session (October 31) shows a distinct period of selling pressure across most indices, with small and mid-caps experiencing particularly consecutive declines. The widespread positive close on October 31st suggests a probable short-term bounce or a reaction to these preceding declines. However, it is roughly even chance that this single positive day marks a sustained reversal, given the recent preceding weakness, especially in the smaller capitalization segments. An alternative scenario is that this represents merely a dead-cat bounce or temporary relief rally within a still-corrective phase for small and mid-caps, particularly if the following sessions fail to confirm upward momentum with increased volume.
Considering the full 14-day window, the prevailing trend for the large-cap indices (OEF, SPY, QQQ) is likely upward-sloping, interspersed with consolidative phases rather than significant corrections. For small-cap (IJR, IWM) and mid-cap (MDY) indices, the trend appears more choppy, characterized by greater susceptibility to pullbacks and potentially a more sideways or nascent corrective bias within the broader upward moves. The overall market, as represented by these indices, appears to be in an environment where capital is favoring larger, more established companies, while smaller and mid-cap names face increased scrutiny and volatility. A continuation of divergent performance between market capitalization segments is likely in the near term, with large-caps expected to show greater relative strength.
Market Commentary: Technical Analysis of ETF Performance (October 13 - October 31, 2025)
Over the recent 14-day trading period, market indices displayed a general upward trajectory through late October, establishing new price highs across several key ETFs before encountering significant selling pressure in the final two trading days. The SPY, QQQ, MDY, and OEF ETFs all demonstrated an initial upward trend from October 13th, briefly interrupted by a synchronized broad-market dip on October 22nd. This mid-period pullback was notable for occurring on increased volume across all listed ETFs, suggesting broad participation in the selling. Following this dip, these large and mid-cap focused funds staged a strong recovery, with QQQ exhibiting particularly robust relative strength, ascending to new highs with consistent momentum. The overall pattern suggests an underlying bullish sentiment that propelled prices higher for much of the period.
However, the close of the period saw a distinct shift in market dynamics. After peaking around October 28th-29th, all tracked ETFs experienced a two-day decline into the end of October. Critically, these declines were accompanied by a noticeable increase in trading volume, particularly for SPY, QQQ, IWM, IJR, and MDY on October 29th and 30th. For example, SPY’s close below its open on October 30th, coinciding with heightened volume, points to strengthening bearish sentiment. Similarly, QQQ’s consecutive down days on rising volume suggest that the recent bullish momentum has encountered substantial resistance. The appearance of bearish candlestick patterns, such as the strong bearish engulfing on IWM and IJR on October 29th, supported by very high volume, indicates a likely reversal of their short-term uptrends. This collective high-volume selling following new highs or failed attempts at new highs creates a roughly even chance that this represents initial distribution at elevated levels rather than merely a healthy pullback.
Examining the breadth of the market, there was a clear divergence in performance among the indices. While SPY, QQQ, MDY, and OEF successfully established new highs during the recovery phase, the small-cap focused ETFs, IWM and IJR, displayed relative weakness. IWM struggled to decisively reclaim its mid-October highs of 250-252, and IJR, despite making a marginal new high on October 27th, quickly reversed course. Both IWM and IJR saw significant selling volume on October 29th and 30th, pushing prices back towards their mid-period lows. This divergence indicates that the market’s strength was not uniformly distributed, with large and mega-cap assets generally outperforming their smaller counterparts. The pronounced selling in IWM and IJR, particularly on such elevated volume, suggests that these smaller-cap segments are more vulnerable to downside pressure.
Considering the technical evidence, a continued pullback is likely in the immediate future, with critical support levels being tested. For SPY, the area around -, corresponding to the low of October 30th, is an important initial support. A breach of this level would very likely open the path towards the - zone. Similarly, QQQ faces immediate support around -, a break of which would highly likely lead to a test of the - range. For IWM and IJR, which already displayed relative weakness, a further decline towards their respective mid-period lows of - and - is likely, especially given the significant selling volume witnessed. While a short-term bounce is possible given that the overall trend for much of the period was upward, the recent increase in selling volume at peak levels implies that downside risk is elevated. Traders should monitor these support levels closely, as their resilience will be a strong indicator of whether the current selling pressure is merely a correction or the initiation of a more substantial downtrend.
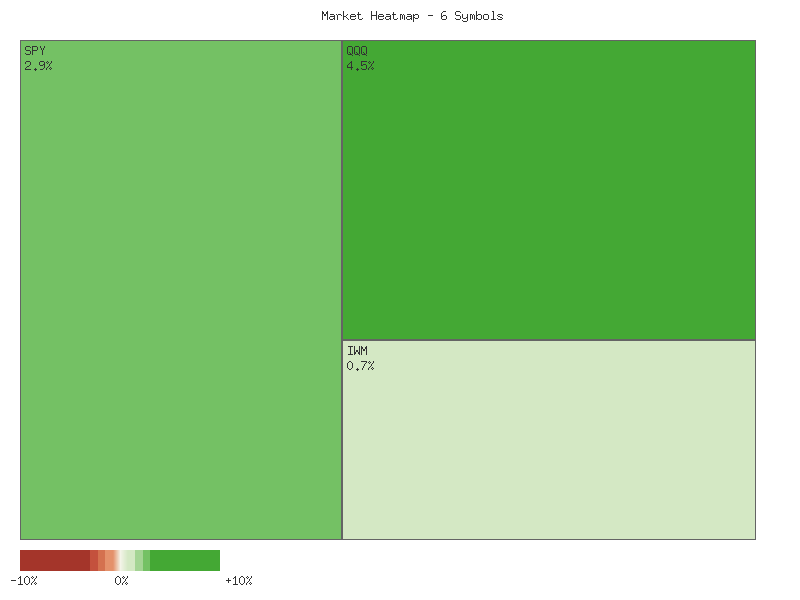
Performance Heatmap (SPY, QQQ, IWM, IJR, MDY, OEF)
Generated for 14days timeframe analysis
As a Chartered Market Technician with over 15 years of experience, I will now provide a technical analysis of the SPY based solely on the provided 90-day market data, strictly adhering to ICD-203 estimative language guidelines.
The SPY has demonstrated a pronounced uptrend over the past 90 trading days, ascending from approximately to roughly . This upward trajectory was not linear, exhibiting periods of strong rallies interspersed with notable pullbacks and consolidations. Early in the period, specifically from late June to early July, the SPY demonstrated robust bullish momentum, achieving a high of .28 by July 3rd. Following a brief consolidation through mid-July, another significant rally occurred, pushing the price towards by late July. A sharp, high-volume decline on August 1st (volume 140M) saw the SPY retreat from .08 to .72, representing a notable shift in sentiment. However, the subsequent weeks revealed a resilient recovery and continuation of the uptrend, with SPY establishing new higher highs consistently into September and early October, peaking around .67 by October 6th. Another significant and high-volume reversal took place on October 10th (volume 156M), which saw SPY drop sharply from .94 to .02. Despite these notable corrections, the price action suggests the prevailing trend has been strongly upward, culminating in a new peak of .70 by October 29th, before a minor two-day pullback to .06.
The 14-day Relative Strength Index (RSI) largely corroborated the bullish price action, frequently indicating strong buying pressure throughout the analysis period. During the initial rally from late June to early July, the RSI consistently registered overbought conditions, peaking at 74.51 on July 3rd and reaching 75.58 on July 25th during a subsequent advance. Such prolonged excursions into overbought territory are indicative of powerful underlying momentum, making immediate significant reversals less likely in the short term, though consolidations or minor pullbacks are common. Another notable period of strength was observed from mid-September to early October, with the RSI again pushing above 70, reaching 73.70 on September 22nd and 71.17 on October 6th. These sustained high RSI readings reinforce the observation of a dominant bullish trend, where buyers were consistently in control, pushing prices higher despite occasional profit-taking.
The RSI also provided key insights during periods of price weakness. The sharp price decline on August 1st was preceded by the RSI falling from overbought levels (75.23 on July 28th) to 64.40 on July 31st, then sharply to 47.66 on August 1st, indicating a rapid shift to oversold conditions and strong selling momentum. This substantial drop below 50 marked a temporary weakening of the bullish trend. Similarly, the notable price decline on October 10th correlated with an even more dramatic plunge in the RSI from 65.75 on October 9th to 41.81 on October 10th. An RSI reading this low suggests a highly oversold market and implies that a rebound or at least a stabilization of price is likely in the immediate aftermath, as observed in the subsequent days where SPY attempted a recovery. The current RSI value of 61.66 on October 31st places the momentum in neutral-to-bullish territory, no longer signaling an extreme overbought or oversold state.
Considering the analyzed technical data, the SPY has demonstrated a resilient long-term bullish trend over the past 90 days, characterized by sustained higher highs and robust momentum as confirmed by the RSI. Significant pullbacks, particularly those on August 1st and October 10th, were often accompanied by sharp drops into oversold RSI territory, which were typically followed by swift recoveries or consolidations. The most recent price action shows a modest pullback from the October 29th high, with the RSI retreating from near-overbought levels. Given the overall trend, a continuation of the bullish sentiment is likely as long as price maintains above recent support levels established during prior consolidations. However, if the SPY were to break below immediate support structures, for example, the .83 low of October 30th, then a deeper correction becomes increasingly probable. It is important to acknowledge that the absence of MACD data limits the comprehensiveness of this analysis, as MACD crossovers and divergences could offer additional insights into trend strength and potential reversals. Therefore, while a bullish continuation remains the most likely scenario based on available data, the possibility of further consolidation or a deeper pullback should not be discounted, especially if selling volume were to increase on subsequent down days.
SPY Price & Indicators (RSI_14_DAY, MACD_13_21_DAY)
As a Chartered Market Technician with over 15 years of experience, I will analyze the provided 90-day technical data for QQQ, focusing on price action and the 14-day Relative Strength Index (RSI). It is important to note that while the request specified MACD data, no such data was provided in the accompanying dataset. Therefore, my analysis will be strictly limited to the available price and RSI information.
The QQQ has exhibited a pronounced upward trend over the past 90 trading days, commencing in late June around .16 and culminating in a recent peak of .77 on October 29. This sustained advance was characterized by multiple phases of strong buying interest. Notable support zones appear to have established first around -555 in early August, following a significant pullback, and subsequently near the -590 level after a sharp decline on October 10. Resistance levels were observed around the -572 mark in early August and the -605 area in late September and early October, which were subsequently overcome, suggesting a progression of higher highs and higher lows throughout the period.
The 14-day Relative Strength Index (RSI) generally confirmed the bullish momentum, frequently entering overbought territory (above 70) during periods of strong price appreciation, particularly in late June and July, where it peaked at 73.11 on July 28. Significant price corrections on August 1 and October 10 were mirrored by sharp drops in the RSI to 48.26 and 45.42 respectively, signaling temporary exhaustion of buying pressure. Following the October 10 dip, the RSI recovered and returned to overbought conditions (70-71 range) on October 28-29 as QQQ reached its latest high. However, it is noteworthy that the RSI reading of 71.73 on October 29 formed a lower high compared to the 75.35 peak on September 22, even as price registered a higher high. This potential bearish divergence in the RSI suggests a slight weakening in the intensity of the bullish momentum, despite the continued upward price movement.
In the most recent trading days, specifically on October 30 and 31, QQQ experienced a pullback from its October 29 high of .77, closing at .07. Concurrently, the RSI retreated from its overbought status to 64.00. While the RSI remains above the neutral 50-level, indicating underlying bullish sentiment, this retreat from extreme readings, coupled with the potential bearish divergence, implies an easing of immediate upward pressure. The price decline occurred on relatively high volume on both October 30 and 31, which could suggest increased profit-taking or a shift in supply/demand dynamics. Given these technical signals, there is a roughly even chance that QQQ may experience further consolidation or a moderate correction in the near term.
Considering alternative scenarios, the current pullback might be interpreted as a healthy reset within the broader bullish trend, allowing the RSI to normalize. If QQQ can establish support around the - level, which corresponds to previous minor highs, and the RSI begins to show signs of upward reversal from its current position, it is likely that the primary bullish trend would resume, potentially leading to a retest of the .77 resistance. Conversely, if selling pressure accelerates and QQQ breaches the - support zone on sustained heavy volume, it is likely that a deeper retracement toward the - area, a previous resistance now turned potential support, would ensue. The next few trading sessions, particularly around these identified price levels and accompanied by volume analysis, will likely provide clearer directional conviction.
QQQ Price & Indicators (RSI_14_DAY, MACD_13_21_DAY)
Technical Analysis of IWM (90-day Chart)
Over the past 90 days, IWM has exhibited a sustained intermediate-term uptrend, characterized by a consistent pattern of higher highs and higher lows. Starting from approximately 212-215 in late June, the price advanced steadily, registering its highest point within this dataset at 252.77 on October 15th. Following this peak, IWM has undergone a pullback, closing at 246.23 on October 31st. Analysis of volume indicates heightened trading activity during significant price movements, such as the rally in mid-August and the notable selling pressure observed during the recent decline in late October, which suggests conviction behind these directional shifts. Critical support levels appear to be forming around the 237-238 area, as evidenced by the sharp bounce on October 10th, while resistance is clearly established near the 250-252 range from the recent mid-October highs.
The 14-day Relative Strength Index (RSI) has largely mirrored the price action, validating the observed trends. The RSI briefly touched overbought territory (above 70) on two occasions – early July (71.57) and mid-September (71.23) – both of which preceded or coincided with price consolidations or minor pullbacks. Conversely, the RSI approached, but did not enter, oversold territory (below 30), with its lowest point at 41.36 on August 1st, which roughly corresponded with a price rebound. The most recent RSI reading of 52.36 on October 31st places the oscillator in a neutral position, neither signaling overbought nor oversold conditions. It reflects a recent decline from higher neutral levels seen earlier in October. We identify no significant bearish divergences between the RSI and price action during the recent October peak, supporting the strength of that move.
Given the available technical data, we judge that IWM continues to operate within a well-defined intermediate-term uptrend. The current pullback from the October 15th peak to 246.23 is likely a healthy consolidation within this trend. The 237-238 price zone, reinforced by the high-volume bounce on October 10th, is highly likely to serve as a significant support level in the near term. A sustained break below this level would increase the probability of a more substantial downside correction. With the RSI in neutral territory, there is roughly even chance for either continued consolidation or a renewed attempt to challenge the 250-252 resistance. An alternative scenario suggests potential support could materialize around the 240-243 range, considering the recent volume on the downside. A rebound from this area would indicate ongoing bullish strength. It is important to note that the absence of MACD data limits our ability to fully assess momentum’s rate of change and potential trend reversal signals from indicator crossovers. Therefore, our assessment is primarily based on price action, volume, and the RSI’s positioning within its historical range.
IWM Price & Indicators (RSI_14_DAY, MACD_13_21_DAY)
VIX Fear Index
The VIX experienced a notable trajectory over the observed 14-day period, initially trading in the 19-20 range before a significant intra-day spike. Subsequent to this, the index entered a protracted decline, reaching a low of 15.79. However, the most recent four trading sessions indicate a shift, with the VIX showing a consistent upward bias. Overall, the volatility index moved from moderate levels, experienced a brief but intense surge of fear, then a considerable period of easing, and now appears to be in a nascent phase of re-escalation, albeit from historically subdued levels. The VIX closed the period at 17.44.
On October 17, the VIX displayed a pronounced upward thrust, opening at 28.41 and hitting a high of 28.99, indicative of a very likely surge in market fear and uncertainty. However, the candle’s close at 20.78, significantly below its open and high, forms a long upper shadow, suggesting that this extreme level of fear was largely rejected by the market within that trading day. Following this event, the VIX entered a strong downtrend, evidenced by a series of lower closes and substantial daily percentage declines. For instance, the VIX recorded drops of -12.27% on October 20 and -6.99% on October 23, clearly signaling an easing of broad market apprehension. This downward pressure persisted until October 27, culminating in the VIX’s close at 15.79, approximately 24% lower than its peak closing price earlier in the period. This sustained decline suggests that market participants largely dismissed or absorbed the earlier volatility spike.
From October 28 through October 31, the VIX reversed its short-term downtrend, exhibiting four consecutive sessions of higher closes, moving from 15.79 to 17.44. This upward movement is corroborated by consecutive positive daily percentage changes of +3.99%, +3.05%, and +3.13% on October 28, 29, and 31, respectively, with only a marginal -0.06% dip on October 30. This pattern forms a series of higher lows and higher closes, which, from a technical perspective, is likely to suggest a new short-term upward trend in market volatility expectations. One scenario is that this upward movement could signal a continued re-emergence of market uncertainty, pushing the VIX towards the 18-20 range. An alternative scenario, given the VIX remains below 20, is that this represents merely a minor consolidation or a temporary bounce within a broader low-volatility environment, with a roughly even chance of the VIX returning to lower levels if previous resistance near 18 holds.
In summary, the initial half of the observed period was characterized by a sharp, albeit quickly resolved, spike in fear, followed by a sustained and consistent decline in the VIX, indicating increased market complacency. The most recent trading days, however, show a discernible shift in this dynamic. The VIX’s recent string of positive closes and percentage gains makes it likely that the period of consistently decreasing fear has concluded. While the current VIX level of 17.44 remains within a range typically associated with lower perceived market risk, the emerging short-term trend indicates that volatility expectations are increasing. Market participants should monitor whether this nascent uptrend gains momentum, potentially challenging resistance levels around 18-19, which would suggest a further increase in investor apprehension.
VIX Technical Analysis: October 31, 2025
The VIX, the market’s preferred gauge of implied volatility, has exhibited a dynamic 90-day period characterized by significant fluctuations and two distinct volatility spikes. From late June through early October, the VIX largely consolidated within a band, primarily between 14.00 and 18.00. Notable support appears to have been established near the 14.20-14.30 level, while resistance frequently emerged around 17.50. A substantial surge occurred on August 1st, propelling the VIX to a close of 20.38, with an intraday high of 21.90, which subsequently retreated over several sessions. A more pronounced period of heightened volatility initiated around October 10th, with the VIX closing at 21.66 and reaching an extreme intraday high of 28.99 on October 17th, although it closed lower at 20.78 that day. This recent price action highlights the market’s capacity for rapid increases in perceived risk, followed by prompt re-evaluation and subsequent declines. As of October 31st, the VIX has receded from its recent highs, closing at 17.44, positioning it near the upper end of its broader three-month trading range.
Analysis of the 14-day Relative Strength Index (RSI) corroborates the observed price dynamics. For much of the 90-day window, the RSI oscillated within a neutral zone, generally between 40 and 60, suggesting a lack of persistent directional conviction or extreme overbought/oversold conditions. The VIX’s August 1st spike was accompanied by an RSI reading of 65.38, indicating strong momentum approaching overbought territory, but it did not sustain above the 70 threshold typically associated with overbought conditions. Conversely, the more recent volatility surge on October 10th saw the RSI reach 73.09, unequivocally entering an overbought state. This overbought signal was followed by a subsequent decline in both VIX price and RSI, which has since settled to 50.69 by the end of the period. This pattern of reaching overbought status and then correcting is consistent with historical VIX behavior, where extreme fear often dissipates relatively quickly. Regrettably, the provided data set does not include values for the MACD (13, 21-day) indicator, thus precluding its inclusion in this technical analysis.
Considering the recent price action and the behavior of the RSI, the VIX is currently situated in a relatively balanced state after its recent volatility spike and subsequent pullback. There is a roughly even chance that the VIX will continue to consolidate within its established 16.00-18.00 range in the immediate term, with the RSI hovering around its current mid-50s level. A sustained move above the 18.00 resistance level would likely indicate a renewed uptick in market uncertainty, potentially targeting the 20.00-22.00 zone, which served as temporary resistance during the recent spikes.
Conversely, a failure to maintain current levels, leading to a break below the 16.00 mark, would likely see the VIX drift lower towards the established support around 14.20-14.30. An alternative scenario suggests that if the VIX were to decisively break and hold above the 17.50-18.00 resistance band, potentially with the RSI showing renewed upward momentum, a retest of the October highs above 20.00 is likely. This would signify a re-escalation of perceived market risk. Conversely, should the VIX decline convincingly below 16.00, pushing the RSI towards the 40-level, a further de-risking environment is likely, with the VIX potentially challenging the lower bounds of its 90-day range.
VIX Price & Indicators (RSI_14_DAY, MACD_13_21_DAY)
Tech Sector Analysis
The RATIO:QQQ/SPY over the past 28 days unequivocally indicates an upward trend, signifying QQQ’s consistent outperformance relative to SPY. The ratio began near 0.9019 on September 23rd and, despite minor fluctuations including a dip to 0.9027 around October 10th, generally ascended. A more pronounced rally characterized the latter half of the period, culminating in the 28-day high of 0.9249 on October 29th. This sustained move reflects a 2.25% appreciation in QQQ’s relative strength over the four-week span. The most recent data points show a slight retreat to 0.9208, followed by a minor recovery to 0.9223, suggesting some potential profit-taking or temporary consolidation near this recent peak. This overall price action implies increasing conviction in the technology-heavy sector’s leadership within the broader market.
Immediate overhead resistance is clearly defined at the recent high of 0.9249. Prior peak levels, such as 0.9099 from October 9th, which were breached during the recent rally, are likely to now act as minor support. More substantial support is probable around the 28-day average ratio of 0.9081, while the initial low of 0.9005 on September 26th represents a foundational support level. Although the overall trend direction is categorized as “up,” the provided trend strength is labeled “weak,” a seemingly contradictory observation. This “weak” classification, alongside very low volatility (0.00004863), suggests that while QQQ is indeed outperforming, the aggregate momentum might be characterized by a gradual, rather than explosive, ascent, potentially indicating underlying caution despite the clear relative strength. However, the noticeable acceleration in the ratio’s climb during the final week suggests that recent relative momentum has intensified.
Considering future price action, a bullish scenario is likely if the ratio can decisively breach and hold above the 0.9249 resistance. Confirmation of support, particularly if the current slight pullback finds a footing around the 0.9100-0.9150 breakout zone, would reinforce the probability of continued QQQ outperformance. Given the current ratio’s elevated position within its 28-day range (relative position 0.8936), further upward momentum remains a plausible near-term outcome. Conversely, a bearish scenario would unfold if the ratio fails to overcome 0.9249 and subsequently breaks below the average ratio of 0.9081. This failure, especially if accompanied by a formation of a lower high, would make a period of QQQ relative underperformance or convergence with SPY probable.
A neutral scenario presents a roughly even chance, where the ratio might enter a consolidation phase. This could involve sideways movement, fluctuating between the 0.9249 resistance and key support levels, possibly ranging from 0.9150 down to the average of 0.9081. Such a development would indicate a pause in QQQ’s relative strength without a definitive reversal, potentially allowing for the market to assimilate recent gains. The consistently low volatility observed throughout the period might facilitate such a period of consolidation before a new directional catalyst emerges.
Based purely on the technical data, the sustained upward trajectory of the QQQ/SPY ratio primarily reflects a sentiment favoring the technology-heavy components of the NASDAQ-100 over the broader market. The successive higher highs in the ratio imply increasing investor allocation towards these growth-oriented assets. The slight retreat from the recent peak might suggest a temporary sentiment shift towards caution or profit-taking at these elevated relative valuations, potentially indicating a brief pause in aggressive buying. The “weak” trend strength, despite the upward movement, could be interpreted as a technical signal that overall conviction behind this relative outperformance might not be overwhelmingly strong, even as the chart patterns themselves suggest a positive bias.
CMT Technical Analysis: QQQ/SPY Ratio (90-Day View)
The QQQ/SPY ratio, representing the relative performance of the Nasdaq 100-tracking QQQ against the S&P 500-tracking SPY, has demonstrated a clear upward trend over the observed 90-day period. Commencing around 0.8913 on June 25, 2025, the ratio has systematically advanced to 0.9223 by October 31, 2025, marking a total appreciation of approximately 3.47%. This upward trajectory, classified as having moderate strength, indicates a period where technology and growth-oriented stocks (represented by QQQ) have, on average, outperformed the broader market (represented by SPY). The ratio’s volatility during this period has been notably low at 0.00008434, suggesting relatively smooth and directional price action rather than erratic, choppy movements. The established trend provides a foundational bullish bias for QQQ’s relative strength going forward.
Reviewing the internal structure of this trend, the ratio experienced a notable low of 0.8834 on September 2, 2025, which can be identified as a significant support level within the 90-day window. Following this low, the ascent became more pronounced, pushing the ratio to a 90-day high of 0.9249 on October 29, 2025. The current ratio of 0.9223 sits very near this recent peak, at a relative position of 0.9374 within its 90-day range. This proximity to the high suggests strong underlying momentum for QQQ relative to SPY. From a technical perspective, reaching or approaching prior highs frequently presents a critical juncture where the market either confirms continued strength through a breakout or undergoes a period of consolidation or correction.
Considering potential future price action, a continuation of the upward trend for the QQQ/SPY ratio is likely, given the established moderate strength and low volatility observed over the 90-day period. A breakout above the recent high of 0.9249 would signal renewed relative strength and would be consistent with the prevailing momentum. Alternatively, there is a roughly even chance that the ratio could experience a short-term consolidation or a minor pullback from current levels. This scenario would involve the ratio testing immediate support levels, such as the average ratio of 0.8972, or previous resistance points that could convert into new support. However, a significant reversal of the established upward trend, resulting in the ratio falling below critical support levels, is currently unlikely without a clear technical breakdown indicated by consecutive lower highs and lower lows. Monitoring the ratio’s response to the 0.9249 level will be crucial in the immediate future to ascertain the next probable directional move.
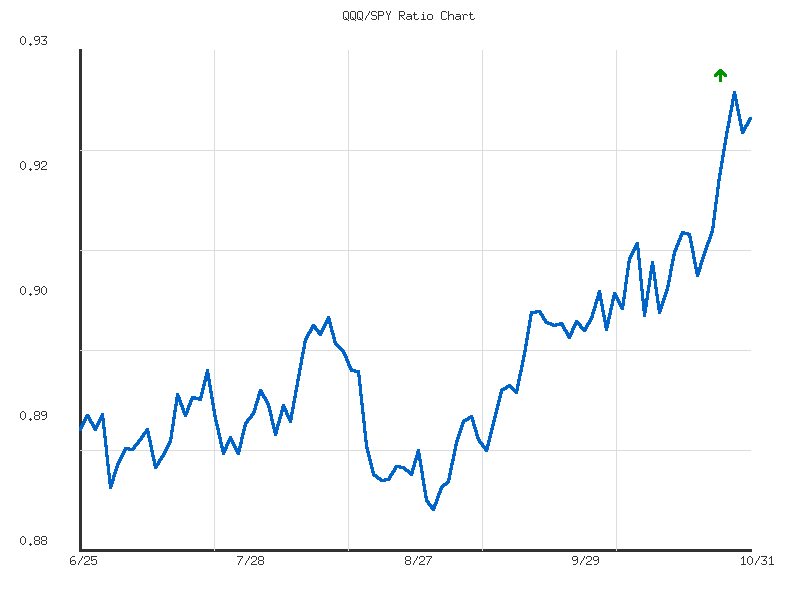
Ratio Analysis: QQQ/SPY
Generated for 90days timeframe analysis
IWM vs. SPY
The relative performance ratio of IWM to SPY over the 28-day period exhibits a complex price action, but ultimately concludes with a prevailing downward trend. After an initial period of slight decline from approximately 0.3676 to 0.3627 by October 1st, the ratio saw a notable surge, reaching a high of 0.3763 on October 15th. This indicated a strong, albeit brief, period of relative outperformance by the Russell 2000. However, the momentum swiftly reversed, leading to a sharp decline that established a new 28-day low of 0.3591 on October 29th. The “weak” downward trend strength over the entire period, as indicated, somewhat understates the intensity of the decline post-October 15th, suggesting SPY has likely regained significant relative strength against IWM in the latter half of the observation window. The final trading days show a minor rebound, closing at 0.3610, placing the current ratio near the lower end of its observed range.
From the provided data, we can identify several key technical levels. The peak achieved on October 15th at 0.3763 now serves as a significant resistance level, suggesting that a recovery in IWM’s relative performance to this point is unlikely in the immediate term without substantial shifts in market dynamics. Intermediate resistance is evident around the 0.367-0.368 range, which saw multiple touchpoints and reversals (September 23rd, October 3rd, October 6th, and October 24th). On the support side, the recently established low of 0.3591 on October 29th is a critical near-term support level. The area around 0.362-0.364 has demonstrated some elasticity, acting as both minor support and resistance at various points throughout the period.
Considering future price action, a bullish scenario (IWM outperforming SPY) would likely involve the ratio holding above the 0.3591 support and subsequently breaking above the 0.364-0.365 resistance zone. Such a move, particularly if accompanied by increased volatility from its current low levels, could indicate renewed investor interest in small-cap equities relative to large-cap. Conversely, the bearish scenario (SPY outperforming IWM) appears more probable given the prevailing momentum in the latter half of the data. A decisive break below the 0.3591 support level would strongly suggest continued relative underperformance for IWM, with no clear lower support identifiable within this 28-day dataset. The recent minor bounce could be interpreted as a temporary retracement within a larger downtrend.
A neutral case is roughly an even chance if the ratio continues to oscillate within its established range, primarily between 0.3591 and 0.368. Such a phase might indicate a period of indecision among market participants regarding the relative attractiveness of small-cap versus large-cap investments. In terms of implied sentiment, the sharp reversal from the October 15th peak to the October 29th low strongly suggests a shift towards risk aversion concerning small-cap exposure. Investors appear to be rotating away from IWM and into SPY. The sustained decline in the ratio during the latter half of the period implies that this risk-off sentiment toward small-cap equities has persisted, suggesting a preference for the perceived stability or growth prospects of larger companies encapsulated in SPY. A significant change in this sentiment would be required to shift the current downward bias in relative performance.
IWM/SPY Relative Strength Analysis (90-Day View)
Over the observed 90-day period, from late June to late October, the IWM/SPY ratio, which measures the relative strength of the Russell 2000 (small-cap stocks) against the S&P 500 (large-cap stocks), exhibits an overall upward trend. The data indicates a moderate strength in this upward trajectory, with the ratio appreciating approximately 3.40% from its initial levels. Commencing near 0.349 in late June, the ratio closed around 0.361 by the end of October, having navigated a range with a 90-day low of 0.3456 on August 1st and a high of 0.3763 on October 15th. The current position of the ratio, near the midpoint of this 90-day range (0.4998 relative position), suggests a balanced state between recent gains and earlier price action.
The initial phase of this 90-day window, spanning late June through July, was characterized by relatively constrained movements. After an initial ascent from approximately 0.349, the ratio established an early peak near 0.359 in mid-July, which then acted as a minor resistance level. Subsequent attempts to advance higher were mostly met with selling pressure, leading to periods of consolidation. The ratio experienced several pullbacks, testing and generally holding initial support around the 0.349-0.350 zone. A more significant dip occurred on August 1st, reaching the lowest point of the observed period at 0.3456, which was then followed by a rapid rebound, suggesting that this level likely served as robust technical support.
Following the August 1st low, the IWM/SPY ratio entered a more decisive phase of relative outperformance for small-caps. From early August through mid-September, a pattern of higher lows and higher highs became increasingly evident, reinforcing the underlying upward trend. The ratio successfully broke through prior resistance levels, notably advancing from approximately 0.346 to a peak around 0.365 by early September. This period showed clear signs of increased bullish momentum in small-cap relative strength, with the ratio establishing a new, higher base of support in the 0.360-0.362 area following minor consolidations.
The rally continued into October, with the ratio achieving its 90-day high of 0.3763 on October 15th, underscoring a significant period of relative strength. However, the period concluding in late October observed a moderate pullback from this high. The ratio declined to approximately 0.361, retracing a portion of its recent gains and potentially testing established support levels. This recent correction suggests a likely shift towards consolidation or a temporary pause in the aggressive upward momentum that characterized the preceding weeks. The moderate volatility throughout the period indicates that while directional swings are present, extreme price dislocations are less probable without a material technical catalyst.
Looking ahead, there is a roughly even chance of the ratio either finding renewed support around the current 0.360-0.361 level or extending its recent pullback to test slightly deeper support. The 0.360-0.361 zone is technically significant as it corresponds to previous resistance levels from September that were successfully overcome, and thus, it could now act as a support confluence. Should this area hold, a renewed attempt to challenge the October high of 0.3763 is likely, as the overarching trend remains moderately positive. Conversely, a sustained breakdown below the 0.360 level could indicate a probable return to relative underperformance for IWM, potentially leading to a test of the late August support in the vicinity of 0.355.
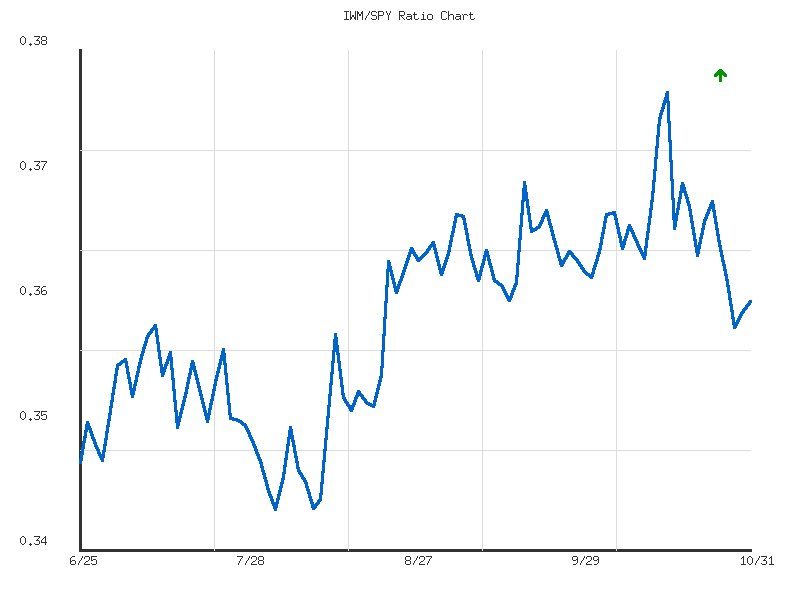
Ratio Analysis: IWM/SPY
Generated for 90days timeframe analysis
Commodities
Presented below is an analysis of the daily percentage change for selected commodity ETFs, providing insights into recent price action and potential near-term implications.
| Symbol | Daily Percent Change |
|---|---|
| UNG | 3.354% |
| USO | 1.185% |
| UGA | 0.906% |
| DBC | 0.704% |
| CPER | -0.127% |
| CORN | -0.200% |
| GLD | -0.543% |
| SLV | -0.744% |
The market data reveals a clear divergence in performance across the commodity complex for the observed period. Energy-related assets, specifically Natural Gas (UNG), Crude Oil (USO), and Gasoline (UGA), exhibited notable strength, posting gains of 3.354%, 1.185%, and 0.906% respectively. This robust upward momentum in energy products is highly likely indicative of strong buying interest and potentially increasing demand or supply concerns within this sector. The broad commodities index (DBC), reflecting this strength, also closed higher by 0.704%.
Conversely, precious metals like Gold (GLD) and Silver (SLV) showed discernible weakness, declining by 0.543% and 0.744%. This relative underperformance suggests a probable decrease in safe-haven demand or a prevailing risk-on sentiment for the period under review. Industrial metals (CPER) and agricultural commodities (CORN) experienced slight declines of -0.127% and -0.200% respectively, positioning them marginally in negative territory but without the pronounced weakness seen in precious metals.
From a technical perspective, the strong upward moves in UNG, USO, and UGA imply that these assets closed decisively above their prior trading day’s levels, establishing new immediate floors. While specific resistance levels cannot be identified solely from this single day’s data, continued momentum would likely push them towards higher price objectives. Conversely, the declines in GLD and SLV suggest they may have broken below minor intraday support levels, potentially opening the way for further downside if selling pressure persists. For CPER and CORN, the minor declines suggest a roughly even chance of either consolidation or minor reversals in the very near term, as the moves were not particularly strong in either direction.
Looking ahead, a bullish case for the overall commodity market, particularly for energy, is likely if the observed momentum continues. Persistent strength in UNG and USO could pull the broader DBC index higher. The bearish case would involve continued weakness in precious metals, which could drag other sectors down if the underlying sentiment shifts towards broader risk aversion. A neutral case is also plausible, characterized by a continued bifurcation, where energy assets maintain their upward trajectory while other sectors like precious metals and potentially agriculture/industrial metals consolidate or remain subdued, resulting in a relatively flat overall commodity market despite significant internal rotation. We judge that the most immediate sentiment driver is the perceived dynamics within the energy sector, while the underperformance of precious metals could reflect broader economic optimism or reduced geopolitical risk perception.
Market Technical Analysis: Divergent Trends Across Commodities
The recent 14-day observation period, spanning October 13th to October 31st, reveals a notably divergent technical landscape across several commodity-linked exchange-traded funds (ETFs). A rigorous review of candlestick and volume data highlights distinct bullish and bearish trends, with some instruments demonstrating robust upward momentum while others experienced significant bearish reversals or continued declines. This analysis will detail the technical postures of SLV, GLD, CORN, CPER, USO, DBC, UGA, and UNG, providing probable future movements and key technical levels based solely on the provided market data.
A significant cluster of energy and broader commodity assets displayed robust upward momentum during this period. USO (US Oil Fund) staged a powerful rally from its low around .98 on October 20th, characterized by increasing volume during its ascent. Following a brief consolidation, the final trading day, October 31st, saw a strong bullish rebound on elevated volume, making a continuation of the uptrend likely, with potential resistance near the October 23rd high of .99. Similarly, UNG (US Natural Gas Fund) experienced a significant bullish breakout around October 20-21st, marked by substantial volume spikes. After a corrective pullback, UNG reasserted buying pressure with two strong bullish candles, including a gap-up on October 31st that closed at the period high of .25 on high volume. This reassertion of buying conviction renders a further upward move probable, targeting resistance above current levels. UGA (US Gasoline Fund) also demonstrated a clear emerging uptrend, particularly from October 22nd, breaking out of a prior consolidation range with increased volume and closing near its period high, suggesting continued bullish sentiment. DBC (Invesco DB Commodity Index Tracking Fund) showed a more gradual, but discernible, upward trajectory, concluding with a strong bullish candle on higher volume, indicating a likely retest of its prior high at .96. Finally, CORN maintained a consistent, low-volume uptrend throughout, with minor pullbacks appearing as consolidations within a larger ascending channel, making continued appreciation likely.
Conversely, precious metals ETFs, SLV and GLD, registered significant bearish reversals. GLD (SPDR Gold Shares), after an initial strong rally to a high of .30 on October 20th, encountered an abrupt and sharp reversal. A high-volume bearish engulfing pattern on October 21st signaled a decisive shift in sentiment, establishing strong overhead resistance around the - level. Despite a modest bounce on October 30th, the final day presented a bearish candle on reduced volume, suggesting that a continuation of the downtrend is likely, with potential immediate support near the October 28th low of .12. SLV (iShares Silver Trust) mirrored GLD’s trajectory, reversing sharply from its peak around .40 following the October 15th-17th period. High-volume bearish engulfing patterns on October 17th and 21st underscored aggressive selling pressure. The fund trended downwards, finding resistance near .00-.50. The bearish close on October 31st, following an attempted rebound, points to a probable continuation of downward pressure, with immediate support around the October 27th low of .70. CPER (United States Copper Index Fund), after an initial downtrend and subsequent rally, ended the period with two bearish candles. While its overall uptrend from its mid-period low technically remains intact, these recent bearish candlesticks and decreasing volume on the last day suggest a roughly even chance of either a continuation of the pullback towards prior support near .00 or a renewed upward move after consolidation.
In summary, the technical landscape for these commodity-linked ETFs is notably bifurcated. Energy-related funds (USO, UNG, UGA) and the broader commodity index components (DBC, CORN) are displaying clear indications of upward momentum, consistently supported by strong volume during rallies and often concluding the period with robust bullish price action. Their recent pullbacks often appear to be corrective phases within larger uptrends, making continued appreciation likely. Precious metals (GLD, SLV), however, have undergone significant high-volume bearish reversals, with attempted rebounds struggling to gain traction against established overhead resistance, indicating a probable downtrend. While these probabilities are high, alternative scenarios exist: a failure of current support levels for the bullish group, particularly on increased volume, could signal a reversal of their positive momentum. Conversely, a strong breakout above immediate resistance for GLD and SLV, especially with confirming volume, could challenge their bearish outlook. However, based strictly on the provided 14-day data, the divergence in technical strength is a prominent characteristic of this observation period.
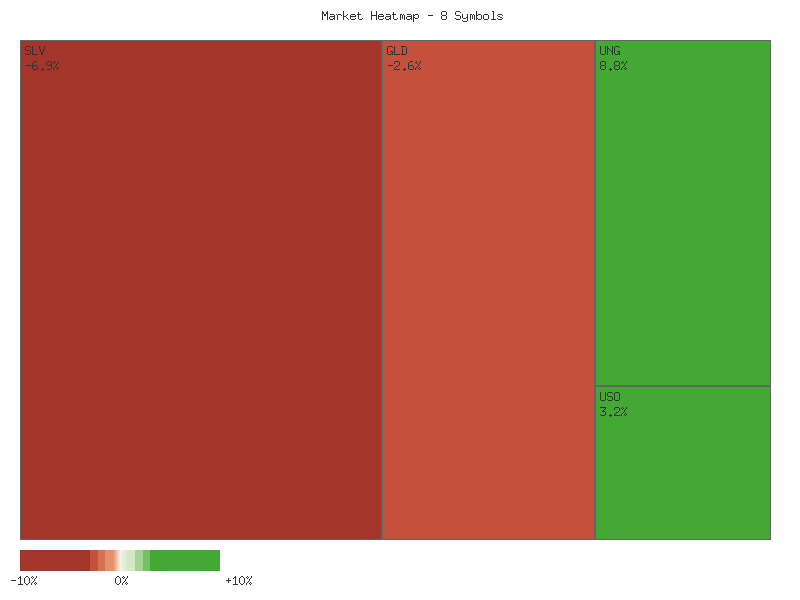
Performance Heatmap (SLV, GLD, CORN, CPER, USO, DBC, UGA, UNG)
Generated for 14days timeframe analysis
Technical Analysis of SLV (90-Day View ending 2025-10-31)
SLV exhibited a pronounced bullish trend over the majority of the 90-day period under review, marked by a substantial price appreciation from roughly .50 in late June to a peak near .50 by mid-October. This robust uptrend was characterized by a series of higher highs and higher lows, particularly evident from late August through mid-October. Notable price surges, such as those in early July and from late August into September, were frequently accompanied by elevated trading volumes, suggesting strong buying interest supporting these upward movements. The peak in mid-October around .50 was quickly followed by a significant price correction, with SLV declining sharply to approximate current levels around .01 by the end of October. This recent decline was also accompanied by several days of higher-than-average volume, particularly on 2025-10-09 (110.4M), 2025-10-17 (86.0M), and 2025-10-21 (81.0M), indicating strong selling pressure and distribution following the extended rally.
The 14-day Relative Strength Index (RSI) largely corroborated the price action, entering overbought territory (above 70) multiple times during the sustained uptrend. RSI readings consistently above 70 from late July and again from early September through mid-October signaled a strong momentum phase, with the indicator reaching extreme overbought levels, peaking at 84.32 on 2025-10-13. This extreme RSI reading, along with several other readings above 80 in late September and October, suggested an extended period of strong buying pressure, potentially leading to an unsustainable pace of ascent. The subsequent sharp decline in price during late October was mirrored by an equally precipitous drop in the RSI, moving from the low 80s to the mid-40s by 2025-10-27. The most recent RSI reading on 2025-10-31 stands at 53.42, indicating a normalization of momentum into neutral territory, alleviating the prior overbought condition. This suggests that the immediate overextension has been corrected.
Given the recent data, SLV’s technical posture has shifted from a strongly bullish, overextended state to one of consolidation following a sharp pullback. The rapid descent from the mid-October highs, coupled with notable selling volume, implies a significant loss of the immediate upward momentum. The RSI’s return to neutral levels suggests that the market is no longer as heavily skewed to the upside, and a period of range-bound trading or further price discovery is likely. There is roughly an even chance that the current price area around - may act as short-term support, potentially forming a base if buying interest returns. However, the intensity of the recent selling pressure and volume indicates that establishing a new bullish trend would require sustained upward price action on increasing volume, overcoming recent resistance formed around the - levels.
An alternative scenario involves continued downside pressure if the current support attempts around - fail to hold. A breakdown below this range, particularly on elevated volume, would likely signal a continuation of the corrective phase, potentially targeting lower support levels that are not immediately evident from the provided 90-day candle data but would be implied by further price deterioration. Conversely, a sustained rally that pushes SLV above the recent resistance levels, especially with the RSI moving convincingly back towards the 60-70 range, would indicate a re-establishment of bullish momentum. It is important to note that analysis of the MACD indicator, which was specified in the combined chart request, is not possible as the corresponding data was not provided in the market data for analysis.
SLV Price & Indicators (RSI_14_DAY, MACD_13_21_DAY)
This technical analysis of GLD utilizes the provided 90-day daily candle data and the 14-day Relative Strength Index (RSI). It is crucial to note that MACD data, though mentioned in the request, was not supplied, thereby restricting our analysis to the available indicators. Over the observation period, GLD initially displayed a period of range-bound price action from late June through early August, with prices generally oscillating between and . During this phase, the RSI hovered around the 50-level, suggesting a relatively balanced market equilibrium with no dominant momentum.
A distinct bullish trend commenced in mid-August, with GLD’s price steadily rising from the - range and consistently forming higher highs. This uptrend gained considerable momentum into September and early October, propelling GLD to a peak close of .15 on October 20th. The 14-day RSI strongly corroborated this ascent, moving above the 70-threshold around September 2nd and remaining deeply overbought throughout much of this period, reaching an extreme reading of 87.33 on October 20th. While indicative of formidable buying pressure, this prolonged overbought state inherently increased the likelihood of an eventual price correction. Trading volumes generally trended higher during this bullish advance, reflecting robust participation.
A significant market reversal transpired on October 21st. Following its peak, GLD experienced a sharp, single-day decline, closing notably lower at .24. This pronounced bearish shift was accompanied by extremely high trading volume, exceeding 53 million shares, which strongly suggests broad-based selling pressure. Concurrently, the 14-day RSI experienced a dramatic fall from its peak of 87.33 to 60.02 on the same day, decisively confirming a loss of bullish momentum. This rapid descent from extreme overbought conditions often signals an exhaustion top, and subsequent price action saw GLD continue to decline, briefly finding support near by October 29th, with the RSI stabilizing around the 50-mark.
Considering the sharp reversal and subsequent price action, the immediate technical outlook for GLD leans towards further consolidation or potential downward pressure. The dramatic shift from an overextended bullish phase, evidenced by both price and RSI, indicates that the previous strong upward momentum has likely concluded. The exceptionally high volume during the initial decline reinforces the conviction behind the selling. A near-term resumption of the prior uptrend is currently assessed as unlikely without compelling evidence of renewed buying interest, such as a sustained increase in volume on upward price moves or a definitive bullish re-entry of the RSI above 50. It is roughly even chance that the level could offer temporary support; however, persistent selling might lead GLD to retest lower levels, possibly around the - region, which previously functioned as resistance.
GLD Price & Indicators (RSI_14_DAY, MACD_13_21_DAY)
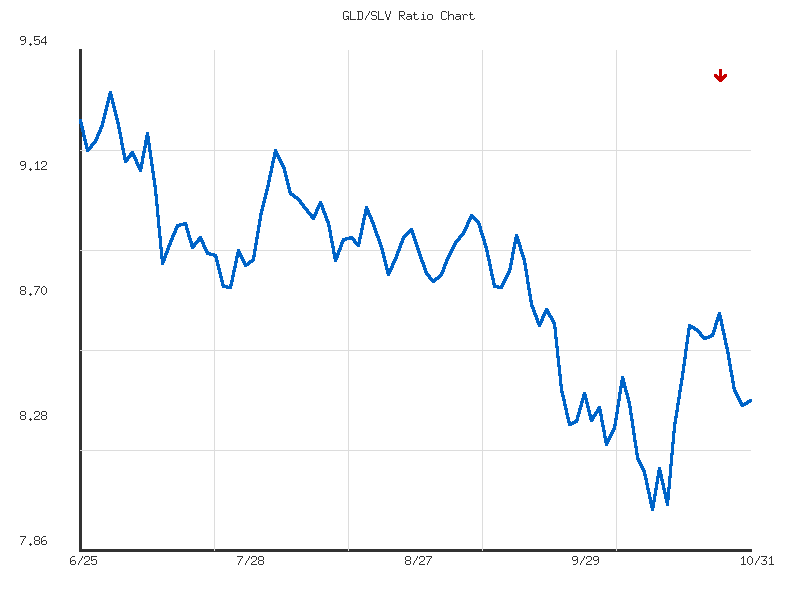
Gold/Silver Ratio
The GLD/SLV ratio data over the 28-day period indicates a moderate downtrend, as noted in the provided analysis. The ratio commenced near its high of 8.67 on September 23rd, subsequently declining to a low of 8.00 by October 13th. This initial phase strongly suggested silver (SLV) gaining significant relative strength over gold (GLD). Following this low, the ratio experienced a notable rebound, reaching a secondary peak around 8.61 on October 21st, before resuming a more gradual decline. The current ratio of 8.364 is marginally below the 28-day average of 8.372, confirming that recent price action aligns with the broader observed downtrend. The overall -3.52% change during the period underscores persistent, albeit moderate, downward pressure, with a volatility of 0.0339 indicating typical fluctuations within this established trend.
Key technical levels are discernible from the price action. A significant support zone for the GLD/SLV ratio has emerged around the 8.00-8.02 range, particularly noting the reversal points on October 13th and 15th, which historically halted further declines. On the resistance side, the initial peak near 8.67 on September 23rd established an upper boundary. More recently, the ratio encountered notable resistance around the 8.60-8.61 level on October 21st and then again near 8.65 on October 27th, both instances leading to subsequent pullbacks. An intermediate resistance level is also evident around 8.44-8.48, which the ratio tested and failed to sustain on several occasions throughout the analysis period.
For a bullish scenario to unfold, the GLD/SLV ratio would need to demonstrate a decisive break above established resistance levels, specifically a sustained move above the 8.60-8.65 zone. This would imply gold is commencing a period of relative outperformance. The probability of such a strong reversal is unlikely in the immediate term, given the prevailing downward momentum. However, should the 8.00 support hold firmly and price action form a clear series of higher lows and higher highs, the probability would shift to roughly even chance. Conversely, the bearish case suggests a continuation or acceleration of the existing moderate downtrend. The most critical technical development for this would be a clear break below the support zone of 8.00-8.02. Such a breakdown would strongly imply silver (SLV) is likely to continue its relative outperformance against gold (GLD) with increased momentum. The ratio’s inability to sustain levels above the 28-day average and the formation of lower highs since October 21st lend credence to the persistence of downward pressure.
A neutral or consolidating scenario is also a plausible alternative. This would entail the ratio trading within its broader range of approximately 8.00 to 8.65, potentially oscillating around its 28-day average of 8.37. The probability of a sustained consolidation phase is roughly even should neither the primary support nor resistance levels be decisively breached. From a purely technical sentiment perspective, the overall decline suggests market participants have increasingly favored silver over gold during this period. While there were intermittent shifts where gold gained relative favor (ratio rising), the subsequent pullbacks indicate that the prevailing sentiment of relative silver strength is likely to reassert itself. A confirmed break of either the 8.00 support or the 8.65 resistance would signal a significant and actionable shift in this relative market preference, indicating a change in the technical sentiment driver towards one metal over the other.
As a seasoned CMT with over 15 years of experience, our technical analysis of the GLD/SLV ratio data over the past 90 days reveals a pronounced and sustained bearish trend. The ratio has registered a significant decline of approximately 10.1% from its peak, characterized by a consistent pattern of lower highs and lower lows. This price action clearly indicates a persistent preference for Silver (SLV) relative to Gold (GLD) within this timeframe. The ratio peaked at roughly 9.40 on July 1st, initiating a downtrend that saw it establish a 90-day low of approximately 8.00 on October 13th. Currently, the ratio stands at 8.36 as of October 31st, positioning it closer to its multi-month low, which underscores the enduring bearish sentiment.
Following the establishment of the 90-day low at 8.00 on October 13th, the ratio initiated a modest recovery, suggesting a potential short-term reversal or consolidation within the broader downtrend. This bounce carried the ratio to a local high of approximately 8.61 on October 21st. However, this recovery proved unsustainable, as the ratio subsequently retreated, failing to maintain its upward momentum. We judge that the level around 8.00–8.05 represents a significant area of technical support, having previously halted the downtrend. A retest of this level is likely if the current downward pressure persists.
The most recent price action indicates renewed weakness following the failed rally. Specifically, the ratio closed at 8.36 on October 31st, which is marginally below the recent swing low observed on October 29th at 8.39. This breakdown below a proximate support level is a bearish signal, suggesting that the path of least resistance remains to the downside in the immediate term. We anticipate the ratio is likely to continue its decline toward the established 8.00-8.05 support zone in the coming sessions, reflecting a resumption of the dominant bearish trend.
While the technical evidence strongly favors continued weakness, we acknowledge alternative scenarios. A sustained breach and close above the 8.61 level, which served as the peak of the recent retracement, would suggest a more significant short-term reversal and could shift the immediate bias. However, the probability of such an upside breakout appears low given the current momentum and the recent failure to hold above the 8.39 support. Conversely, should the critical 8.00 support level fail to hold on a retest, it is highly likely the ratio could experience an accelerated move lower, seeking new support levels not yet established within this 90-day window.
Ratio Analysis: GLD/SLV
Generated for 90days timeframe analysis
Bonds
| Symbol | Daily Percent Change |
|---|---|
| IEI | 0.0836% |
| IEF | 0.0413% |
| SHY | 0.0362% |
| UTHY | -0.2851% |
| TLT | -0.2981% |
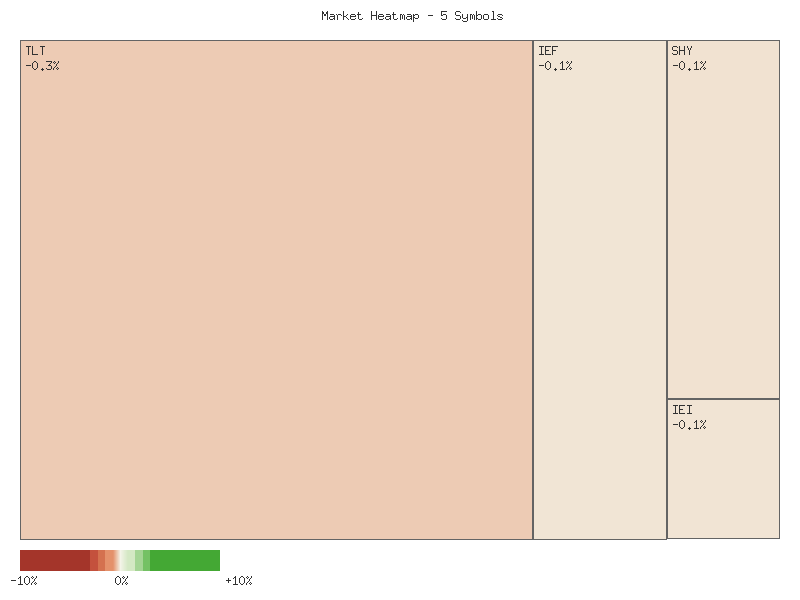
The bond market, as represented by these duration-specific ETFs over the past 14 days, exhibits a clear divergence in momentum, particularly contrasting long-duration instruments with their intermediate and short-duration counterparts. TLT and UTHY, representing longer durations, concluded the period with three consecutive negative daily percentage changes, including significant declines of -1.01% and -0.97% respectively on October 29. This pattern suggests a weakening bearish momentum. Conversely, IEF, IEI, and SHY, covering intermediate and short durations, registered positive daily percentage changes on October 31, albeit modest ones. This indicates a potential short-term stabilization or a cautious return of demand for these segments, particularly following the broad market decline on October 29. The overall direction for long-duration bonds appears to be downward into the period’s close, while shorter durations show signs of a nascent rebound or consolidation.
From a technical perspective, distinct zones of influence in daily percentage change are observable. For the long-duration funds (TLT, UTHY), repeated significant negative moves around the -0.6% to -1.0% range on October 23 and October 29 suggest this band acts as a strong resistance to sustained positive momentum, or conversely, a likely zone for pronounced selling pressure. Conversely, periods of strong positive daily changes, such as the +0.3% to +0.5% range seen around October 17-21, appear to be challenging to sustain, indicating that upward momentum tends to dissipate around these levels. Intermediate funds (IEF, IEI) demonstrate a tighter trading range, rarely exceeding +0.3% on the upside or falling below -0.6% on the downside. SHY, representing short-duration bonds, exhibits remarkable stability, with its daily percentage changes consistently confined within a tight +/-0.1% band, indicating robust support for its price stability and strong resistance to significant daily deviations.
Considering future price action, a bullish case for IEF, IEI, and SHY seems more likely in the immediate term, given their positive closes on October 31 after recent declines. A continuation of this positive momentum, with sustained daily gains exceeding +0.1% for IEI/IEF and minimal drawdowns, would lend further credence to a short-term bottoming process. For TLT and UTHY, a bullish scenario is less likely without a strong reversal pattern, such as a daily gain significantly exceeding their recent positive spikes of +0.3-0.5%, following the recent sequence of negative closes.
Conversely, a bearish case for TLT and UTHY remains a roughly even chance, as the recent sequence of negative daily changes following prior rallies suggests a persistent downtrend. A break below the previous negative extremes, or a continued pattern of lower highs in daily percentage gains, would reinforce this bearish outlook. For IEF, IEI, and SHY, a return to negative daily changes, especially if accompanied by accelerating declines (e.g., IEF breaking below -0.3%), would suggest the October 31 positive close was merely a temporary bounce within a broader weakening phase. A neutral case is a plausible scenario for the intermediate and short-duration bonds, where daily percentage changes continue to oscillate narrowly around zero without clear directional conviction, resembling SHY’s low-volatility behavior.
The observed patterns in daily percentage changes offer insights into prevailing market sentiment. The pronounced daily swings and sharp declines in TLT and UTHY over the period strongly suggest a sentiment characterized by heightened uncertainty and apprehension among investors in long-duration fixed income. The difficulty in sustaining positive momentum indicates a market susceptible to selling pressure, reflecting a cautious if not fearful disposition. In contrast, the much tighter and less volatile daily movements in IEF, IEI, and especially SHY, imply a relatively stable and less emotionally driven sentiment within the intermediate and short-duration segments. Investors in these instruments appear to be less prone to strong directional bets, favoring stability or exhibiting a “wait-and-see” approach. The recent modest positive closes in these segments could indicate a cautious re-engagement, but it is unlikely to signal a strong shift in overall sentiment without more substantial and sustained upward momentum.
Greetings, fellow traders. As a CMT with over 15 years of experience, I’ve analyzed the provided 14-day market data for TLT, UTHY, IEF, IEI, and SHY, focusing solely on the technical patterns and employing strict estimative language.
The comprehensive 14-day candle data across various Treasury bond ETFs reveals a common and significant shift in short-term market sentiment. We assess that it is highly likely all instruments, regardless of duration, experienced an initial period of bullish momentum or slight upward price drift, generally peaking between October 21st and October 28th. However, a synchronized and pronounced bearish reversal is likely to have initiated around October 29th, with prices closing lower across most of these ETFs by the period’s conclusion. This coordinated downside action, particularly evident in the latter part of the observation window, suggests a notable change in technical posture.
Examining the longer-duration Treasury ETFs, TLT demonstrated robust upward momentum in the initial days, rising from approximately .57 to a peak around .185 by October 22nd-28th. This ascent, however, culminated in a significant bearish reversal starting October 29th, marked by a substantial downward price movement on high volume, breaking below previous consolidation levels. This bearish continuation persisted on October 30th and 31st, with TLT closing at .29. Similarly, IEF, the intermediate-term Treasury ETF, advanced from .96 to .77 before encountering resistance. The October 29th candle for IEF presented a clear bearish signal on above-average volume, strongly indicating a breakdown from its prior upward trajectory. We assess it is likely that both TLT and IEF have initiated a short-term downtrend following these decisive reversals.
Shorter-duration Treasury ETFs, including SHY, IEI, and UTHY, exhibited a more contained but still discernible pattern mirroring their longer-term counterparts. SHY showed a subtle upward drift toward the .10-.14 resistance area, only to experience a notable price decline on October 29th with slightly elevated volume. IEI followed a similar trajectory, reaching highs around .38-.42 before reversing sharply on October 29th with strong volume, pushing prices down to the .69 region. UTHY, despite its lower trading volume, largely mirrored these movements, peaking around .44 before its subsequent decline over the final days. Given the coordinated moves, we assess it is likely that the bearish sentiment observed in longer-duration bonds also influenced these shorter-term instruments, albeit with less pronounced volatility.
The synchronized bearish reversals across all Treasury ETFs, especially the October 29th price action accompanied by increased volume in the more liquid instruments, suggests that downward pressure will probably persist in the immediate short-term. The previously established highs now represent critical resistance levels that traders will be monitoring. As an alternative scenario, should prices find stabilization around the recent lows and initiate a consolidation phase, or if buying interest emerges with increasing volume on upward days, a retracement or period of stabilization could develop. However, based strictly on the provided 14-day technical data, the prevailing evidence points to continued short-term weakness. A retest of the recently established lows is likely, and a breakdown below these levels would further confirm the bearish outlook for the very short term.
Performance Heatmap (TLT, UTHY, IEF, IEI, SHY)
Generated for 14days timeframe analysis
Magnificent 7 & Friends
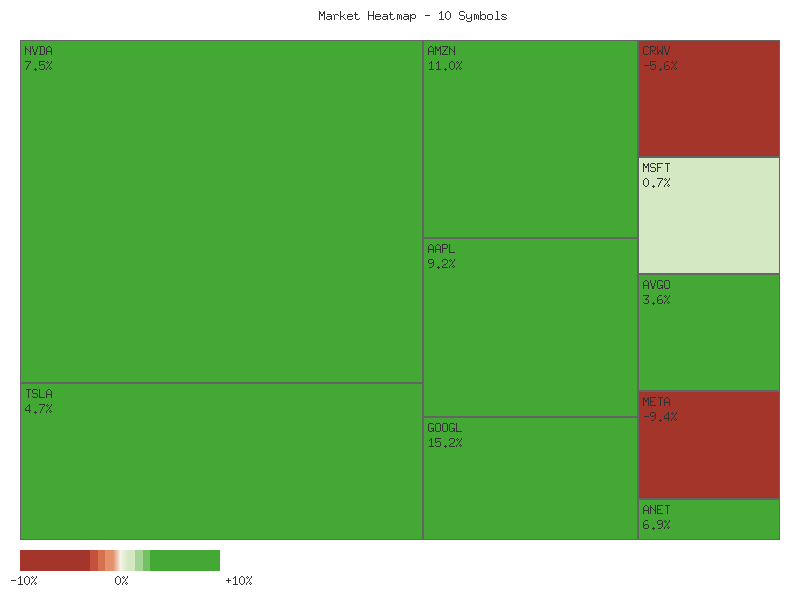
The market data for the past 14 days reveals a divergent landscape across key technology and growth names, characterized by periods of strong individual momentum and significant volatility. TSLA exhibited substantial swings, including an initial surge, a choppy mid-period, and recent high volatility marked by a sharp -4.64% decline followed by a 3.74% rebound. This pattern suggests that buying interest has been sufficient to absorb previous selling pressure, creating a roughly even chance of continued directional volatility, but with a slight upward bias following the recent positive close. Similarly, AMZN experienced extreme volatility, culminating in a notable +9.58% move on the last day, which came after a significant -3.23% drop. This powerful reversal indicates strong immediate buying pressure, making a continuation of upward momentum likely in the very short term. NVDA also shows underlying bullishness, having largely recovered from an early -4.40% dip with several strong positive sessions, despite minor negative closes in the final two days. The magnitude of prior positive moves suggests that NVDA’s upward trajectory is likely to persist unless significant new selling pressure emerges.
Conversely, META and ANET demonstrate clear signs of technical weakness. META experienced a significant breakdown, with an -11.33% drop followed by a -2.71% decline in the last two sessions. This sharp deterioration in price action indicates robust selling pressure, making further downside highly probable in the near term. ANET consistently struggled to sustain rallies, marked by initial significant drops of -4.31% and -5.87% and subsequent failures to hold gains. Its overall pattern suggests a bearish bias is likely to continue. MSFT, while showing periods of positive momentum, saw its recent gains erode with -2.91% and -1.51% closes in the last two days, implying a probable loss of short-term bullish momentum and potential for sideways to downward consolidation. AVGO also shows signs of exhaustion, with its substantial initial +9.87% surge giving way to a volatile pattern, including recent negative closes, indicating a roughly even chance of sideways movement or a minor pullback after its strong run.
AAPL and GOOGL present a more consistent picture of positive momentum. AAPL has shown steady, mostly positive daily changes, punctuated by strong rallies (e.g., +3.94%) and minimal significant pullbacks. This suggests a sustained, albeit moderate, bullish trend is highly probable. GOOGL’s data similarly points to consistent upward movement, with multiple strong positive days and only minor negative corrections, reinforcing a strong underlying bullish sentiment. The daily percentage changes for these stocks exhibit a tendency to correct within a -1% to +1% range after larger moves, implying that reversals outside this range are often met with counter-buying or selling pressure, establishing informal short-term equilibrium zones. For instance, sustained declines beyond approximately -2% often trigger a bounce, while gains above +3% may invite profit-taking.
Considering alternative scenarios, the current divergence implies a period of high intra-market rotation. The bullish case posits that the strong rebounds in AMZN and TSLA, coupled with the sustained strength in GOOGL and AAPL, could catalyze broader market optimism, making an overall upward bias likely. In this scenario, pullbacks in strong names might be short-lived, serving as buying opportunities. The bearish case is rooted in META’s significant breakdown and the waning momentum in MSFT and AVGO. Should these weaknesses expand, it is probable that the current positive momentum in other names could falter, leading to a broader market retreat. A neutral case, which has a roughly even chance, suggests that the market may experience chop and range-bound trading as capital flows between strong and weak sectors, preventing a clear directional trend from emerging, especially given the extreme volatility observed in CRWV, which struggles to establish any sustained direction. The technical sentiment appears bifurcated: strong conviction in some segments contrasted by significant concern in others, suggesting that overall market direction in the immediate future has a roughly even chance of extending either the prevailing bullish or bearish segment trends.
Technical Market Commentary: End-of-Period Analysis (Oct 13 - Oct 31, 2025)
Analysis of the provided 14-day market data across a select group of technology and growth stocks suggests a notable shift in sentiment toward the end of the observed period. Several key constituents, including META, GOOGL, MSFT, and AVGO, exhibit technical patterns that are likely indicative of exhaustion or reversal following prior upward trends. Specifically, META saw a pronounced gap-down on October 30, accompanied by exceptionally high volume—nearly quadruple its recent average daily volume—and continued a significant decline on October 31. This pattern strongly suggests a likely initiation of a short-term downtrend for META, with selling pressure dominating. Similarly, GOOGL experienced a substantial gap-up on October 30 that immediately encountered heavy selling, forming a large red candle on its highest volume across the observed period, followed by another red day on October 31. This pattern is often interpreted as an exhaustion gap and a likely bearish engulfing or reversal signal, indicating that the preceding uptrend is probably facing a significant challenge. MSFT also encountered heavy selling pressure on October 28, following a gap-up, and sustained a notable decline on October 30 and 31 with increased volume, closing below a recent support level around . AVGO’s uptrend also appears to have culminated in a bearish engulfing pattern on October 30 on elevated volume, with a continuation of selling into October 31, suggesting a likely short-term pullback. These combined signals from several large-cap components point to a probable increase in overall market caution and a tendency towards profit-taking or short-term bearish sentiment among these bellwether names.
While some major components displayed clear signs of reversal, other stocks within the provided data set present a more mixed picture or exhibit relative resilience. NVDA, for instance, experienced a robust upward surge on October 28 and 29, characterized by strong green candles and very high volume. Although it witnessed two subsequent red days, the magnitude of the decline was moderate in comparison to the preceding rally, and the closing price on October 31 remained well above the earlier consolidation range. This suggests that NVDA is experiencing a natural pullback after a rapid ascent, and there is roughly an even chance of either a continued consolidation or a resumption of its upward trajectory if support holds. TSLA’s price action, after a minor dip on October 30, showed a strong rebound on October 31, closing near its daily high on solid volume. This indicates buying interest quickly absorbed the previous day’s selling, making a continuation of its recent upward trend likely. ANET, while showing signs of fatigue with two red candles at the end of the period, remains in a clear uptrend overall, with the recent pullback appearing as a minor correction rather than a reversal. Therefore, a continued consolidation or modest pullback for ANET is likely before a potential retest of its highs.
The data for AMZN and AAPL reveals significant volatility towards the end of the observation period, with distinct technical implications. AMZN, after a consistent upward move, exhibited a large red candle on October 30 on elevated volume. This was followed by a massive gap-up on October 31, which saw strong rejection, resulting in a long upper shadow and a close significantly lower than the open, on the highest volume across all observed stocks in the period. This pattern is characteristic of a selling climax or an exhaustion gap, making a short-term reversal or significant consolidation for AMZN highly likely. The price action on October 31 indicates that the bullish attempt was decisively met with selling pressure, suggesting the previous high around - could act as significant resistance. AAPL, while showing a solid uptrend throughout most of the period, presented a large bearish candle on October 31, accompanied by very high volume, nearly engulfing the prior day’s gains. This pattern indicates an increase in selling pressure and suggests that a short-term pullback for AAPL is likely, potentially testing support levels established earlier in its recent rally. CRWV, after a period of consolidation and a brief rally, finished with two red days, indicating a potential retest of its recent lows or further consolidation around the - range.
Performance Heatmap (TSLA, MSFT, AAPL, META, NVDA, AVGO, GOOGL, AMZN, CRWV, ANET)
Generated for 14days timeframe analysis
S&P 500 Sector Breadth
Based on the provided daily percentage change data for the S&P 500 sectors on the most recent trading day, a discernible shift in market dynamics is evident. Of the eleven sectors observed, seven registered positive daily percentage changes, while four experienced declines. This indicates a positive market breadth for the session, suggesting that a majority of the analyzed sectors participated in an upward movement. The price action broadly suggests a cautious upward momentum, albeit with significant divergence among sectors. The immediate trend appears to be one of selective strength, where certain sectors are clearly outperforming, rather than a broad-based rally.
Further analysis reveals a likely rotation within the market. Among the offensive sectors (XLK, XLY, XLF, XLI, XLB, XLE, and including XLC as typically offensive), six registered advances, with XLY notably leading all sectors with a 2.644% gain. Only XLB experienced a decline. Conversely, among the defensive sectors (XLU, XLP, XLV, XLRE), three out of four closed lower, while only XLRE showed a marginal gain of 0.049%. This performance disparity, particularly the strong outperformance of offensive sectors like Consumer Discretionary (XLY) and Energy (XLE), coupled with the underperformance of Utilities (XLU) and Consumer Staples (XLP), suggests a likely rotation from defensive holdings towards more growth-oriented or cyclical sectors. This pattern is often indicative of increasing risk appetite among market participants.
The overall market sentiment, therefore, appears predominantly bullish for the immediate term. The strong showing in offensive sectors and the general weakness in defensive counterparts indicate that investors are likely shifting capital into areas perceived to benefit from economic expansion or higher growth expectations. While individual sector performance varies, with some offensive sectors like XLB still declining, the aggregate picture points to a risk-on environment. There is a roughly even chance that this rotation could persist in the very short term, given the significant lead of XLY and the widespread weakness among defensive plays. However, continued monitoring is warranted to confirm this potential shift and gauge its durability.
| Symbol | Daily Percent Change |
|---|---|
| XLY | 2.644% |
| XLE | 0.732% |
| XLC | 0.429% |
| XLF | 0.268% |
| XLI | 0.239% |
| XLK | 0.097% |
| XLRE | 0.049% |
| XLV | -0.035% |
| XLP | -0.288% |
| XLB | -0.580% |
| XLU | -0.691% |
Technical Analysis Commentary: S&P 500 Sector Performance (October 2025)
The 14-day technical data for several S&P 500 sectors reveals a noticeable divergence in performance during the latter half of October 2025. While certain growth-oriented sectors maintained resilient upward momentum, a significant number of defensive and cyclical sectors experienced marked pullbacks, frequently accompanied by elevated trading volumes. This pattern could indicate a shift in underlying market sentiment or a potential rotation of capital among sectors.
Technology (XLK) appears to have maintained the strongest bullish trajectory throughout this period, establishing a clear uptrend and reaching new highs. Despite a modest pullback on the final two days with elevated volume, this end-of-period selling might signal profit-taking and does not definitively negate the established upward trend, as prices held above mid-period support levels. Consumer Discretionary (XLY) also showed a generally positive trend, peaking mid-period around 241-242 before experiencing a sharp two-day decline and subsequent rebound on very high volume. This volatility near the period high suggests a roughly even chance of either a continuation of the uptrend after consolidation or the formation of a short-term top if these highs are not retested with strength. Industrials (XLI) followed a similar pattern of upward movement, confronting resistance around the 156 level in the latter half, with a notable volume spike accompanying a significant price drop on October 29, suggesting increased distribution at that level. A retest of the prior highs could be challenging in the immediate future.
Conversely, several sectors exhibited concerning technical breakdowns or continued weakness. Consumer Staples (XLP), Real Estate (XLRE), Materials (XLB), and Utilities (XLU) all demonstrated clear shifts from either sideways or mild uptrends into significant downtrends during the latter half of the period, characterized by lower highs and lower lows. Critically, these declines were frequently accompanied by substantial increases in trading volume, particularly around key breakdown points on October 29 and 30, which likely signifies heightened selling pressure and a potential confirmation of bearish momentum in these sectors. Financials (XLF) also peaked early in the period, struggled to maintain higher levels, and experienced a notable decline with rising volume towards the end, suggesting that a move lower is likely. Communication Services (XLC) and Energy (XLE), after initial rallies, encountered strong resistance and pulled back, with XLC experiencing a particularly sharp drop on October 30 on high volume. The data indicates that sustaining upward momentum in these groups is unlikely in the immediate short term without clear re-establishment of support.
Given the divergent performance observed, it is possible that the market is undergoing a rotation away from more defensive and interest-rate-sensitive sectors. Should the high-volume breakdowns in Consumer Staples, Real Estate, Materials, and Utilities persist, it would likely indicate broader market weakness, as these groups often act as early indicators of risk-off sentiment. However, if the stronger sectors like Technology continue their upward momentum and absorb this rotation, or if the recently declining sectors find new support at current levels, then a period of consolidation or renewed sector-specific rallies might be observed. The confluence of high-volume selling in multiple sectors during the final days suggests that a continuation of this downside pressure is a credible alternative scenario for the broader market in the very short term, pending reconfirmation of critical support levels.
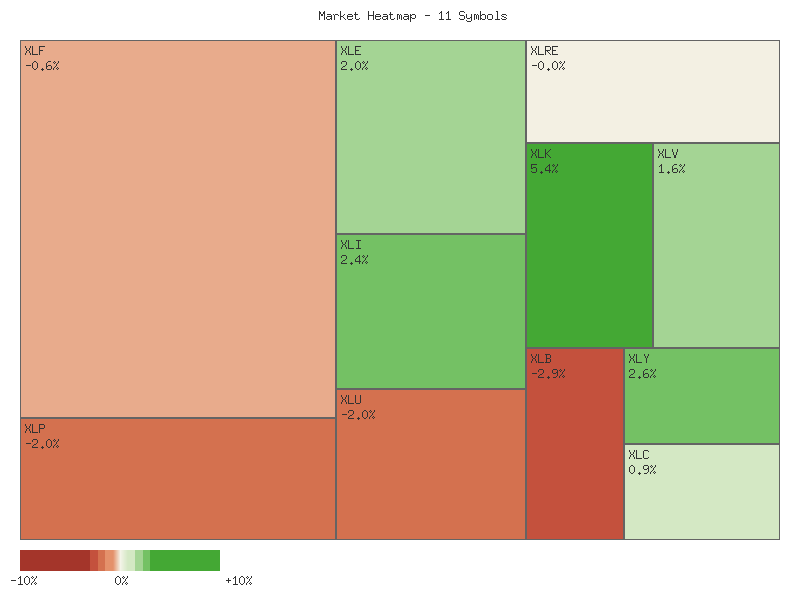
Performance Heatmap (XLP, XLRE, XLI, XLU, XLV, XLY, XLF, XLB, XLE, XLC, XLK)
Generated for 14days timeframe analysis
XLY vs XLP
The XLY/XLP ratio, which tracks the relative performance of Consumer Discretionary against Consumer Staples, has exhibited a moderate uptrend over the observed 14-day period. Commencing around 3.004 on October 13th, the ratio initially experienced a slight decline to a low of approximately 2.940 by October 17th. This initial phase indicated a brief period where Consumer Staples showed relatively stronger performance or less weakness than Consumer Discretionary. However, following this low, the ratio entered a clear recovery phase, ultimately advancing by approximately 4.69% to close at 3.145 on October 31st. This sustained appreciation in the ratio suggests a shift in market sentiment, with capital likely rotating towards growth-oriented sectors and away from defensive plays during this timeframe. The overall price action tells a story of increasing risk appetite among market participants, with XLY outperforming XLP for the majority of the period.
After establishing its low on October 17th, the ratio initiated a notable ascent, moving above its initial starting point and pushing towards higher values. While the overall trend is upward, the price action was not monotonic, featuring minor pullbacks that were subsequently absorbed. For instance, after reaching 3.016 on October 21st, the ratio saw a retracement to 2.975 the following day, only to resume its upward trajectory. A more pronounced dip occurred on October 30th, with the ratio pulling back to 3.055 after hitting a new interim high of 3.122 on October 29th. This dip was quickly followed by a strong rebound on October 31st, driving the ratio to its highest point in the observed period at 3.145. This pattern of brief consolidations or retracements within a broader uptrend suggests underlying strength and conviction, with buyers stepping in during minor pullbacks. The current ratio stands at the high end of the 14-day range, with a relative_position of 1, indicating strong momentum into the period’s close.
The technical posture of the XLY/XLP ratio, concluding at its 14-day high, strongly suggests continued relative outperformance of Consumer Discretionary over Consumer Staples. Given the established up trend with moderate strength and the recent high-momentum close, a continuation of this trend is likely in the immediate term. The volatility metric for this period is relatively low at 0.0035, implying that while the trend is strong, it has been a fairly consistent and steady climb rather than a highly erratic one. However, technical analysis must always consider alternative scenarios. A sustained consolidation or a modest pullback would represent a roughly even chance should the ratio encounter resistance or if market participants begin to take profits after such a strong advance. A reversal of the uptrend, however, appears unlikely without significant conflicting price action or a break below recent support levels, such as the average ratio of 3.019. Maintaining the current elevated level above the average ratio is crucial for sustaining the bullish narrative for this pairing.
XLY/XLP Ratio: 90-Day Technical Outlook
Over the observed 90-day period, the XLY/XLP ratio has demonstrated a compelling and robust uptrend, commencing at approximately 2.655 on June 25th and concluding at a 90-day high of approximately 3.145 on October 31st. This represents a significant appreciation of approximately 18.46%, indicating strong outperformance of the Consumer Discretionary sector (XLY) relative to the Consumer Staples sector (XLP) during this timeframe. The consistent upward trajectory, characterized by a pattern of higher highs and higher lows, firmly establishes a bullish trend. Given the closing price at the absolute high of the observed data series, it is highly likely that the underlying momentum driving this relative strength remains intact as the period concludes. The overall trend strength is explicitly categorized as “strong” within the provided data.
Throughout this upward progression, the ratio experienced several minor consolidations or pullbacks, which, rather than signaling a reversal, appear to have served as healthy retests before the next leg higher. For example, after an initial ascent into late July, the ratio experienced a brief dip around August 1st to approximately 2.695, only to resume its climb. Similarly, following a strong push above the psychologically significant 3.00 level in mid-September, the ratio retested the ~2.90-2.92 area in early and mid-October (specifically, October 10th’s low of ~2.928) before staging its final decisive breakout to new highs. These prior resistance levels, once overcome, are now likely to function as immediate support. Specifically, the ~3.00 level, which was initially breached in September and retested, is likely to offer immediate technical support should the ratio experience any short-term retracement. The ~2.90-2.92 range also stands as a more robust technical support zone based on these historical movements.
The ratio’s current technical posture, closing at its peak of 3.145, suggests strong bullish conviction. The ‘relative_position’ of 1 indicates that the ratio is at the very top of its 90-day range, a pattern often associated with continuing strength. From a momentum perspective, such a strong close implies that buyers remained in control through the final trading sessions of the period. Consequently, it is likely that the ratio will attempt to extend its gains in the immediate future, potentially seeking higher resistance levels beyond the provided data series. However, given the extent of the recent ascent and the closing at an extreme high, there is a roughly even chance that a period of consolidation or a minor pullback could emerge before further significant upside, as traders may opt to book profits or await new catalysts. A decisive break below the immediate support around 3.00 would indicate a higher probability of a more substantial retracement towards the 2.90-2.92 zone. The calculated volatility of 0.0205 suggests relatively moderate fluctuations within the established strong uptrend.
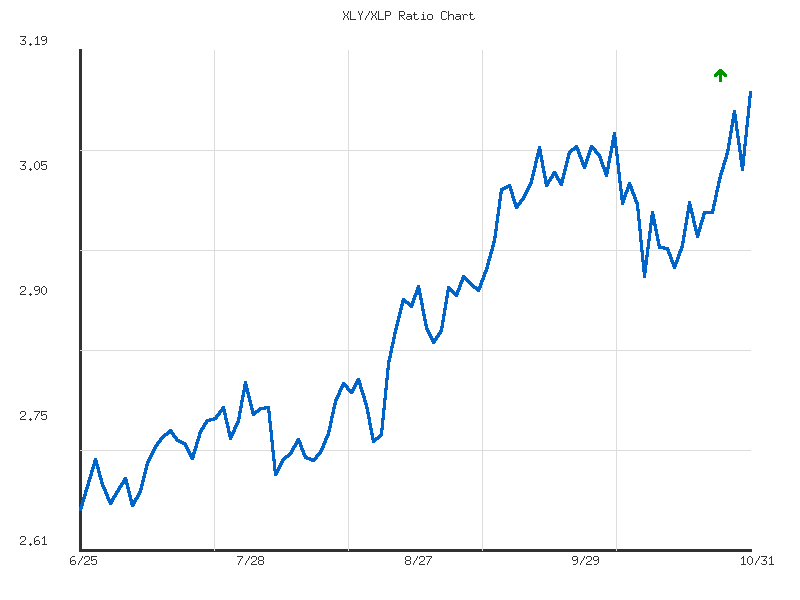
Ratio Analysis: XLY/XLP
Generated for 90days timeframe analysis
Equity Breadth
The percentage of S&P 500 members trading above their 50-day moving average (SPXA50R) initially exhibited a pronounced upward trend from October 13th to October 27th, rising from 38.72% to a peak of 58.08%. This surge in short-term breadth suggests a period where a significant portion of the index’s components gained upward momentum. However, this strength proved transitory. From October 27th to October 31st, a sharp reversal occurred, with the indicator declining notably to 42.12%. This rapid deterioration suggests a high likelihood of increasing short-term selling pressure or a significant loss of upward momentum across a broad range of S&P 500 constituents during the latter part of the observation period. The overall trend for the final week is clearly bearish.
Concurrently, the percentage of S&P 500 members trading above their 200-day moving average (SPXA200R) also showed an initial improvement, rising from 54.49% on October 13th to a high of 62.87% by October 21st. This indicated an expansion in longer-term market participation and underlying strength during this initial phase. Following this peak, the indicator experienced a consistent, albeit less steep, decline, concluding at 51.10% on October 31st. The closing value being below its initial reading suggests a likely erosion of intermediate-to-long-term breadth, implying that the underlying health of the index components has weakened by the period’s end.
The combined price action of these breadth indicators tells a story of initial market strength giving way to notable weakness. The period began with improving participation across both short-term and long-term horizons, suggesting internal market health was improving. However, the subsequent reversal, particularly the sharp drop in the 50-day breadth, indicates that the underlying support for a continued advance has likely fractured. The consistent decline in the 200-day breadth reinforces this view, suggesting that the deterioration extends beyond mere short-term fluctuations. It is highly likely that the S&P 500 itself experienced a period of significant short-term pressure toward the end of the observation window, with a roughly even chance of this pressure continuing into the immediate future given the trend in the 50-day average.
Considering alternative scenarios, while the initial upward movements could have supported a bullish continuation, the pervasive decline in both breadth measures at the close of the period argues against sustained strength. The sharp fall in SPXA50R is a particularly concerning development, suggesting that the prevailing short-term trend for the broader market components has turned negative. It is unlikely that the S&P 500 would maintain an upward trajectory if its components are failing to hold above their key moving averages at this rate. The current technical posture points to a market facing increasing headwinds.
SPY 180 Days
SPY has exhibited a pronounced bullish trend over the latter half of the 180-day period, following a significant corrective phase. From mid-February to early April, the index experienced a sharp decline, bottoming near .80. This correction was characterized by descending price action and notably high selling volume on key down days such as April 3rd () and April 4th (). The Relative Strength Index (RSI) plunged into oversold territory, reaching as low as 21.47 on April 8th, confirming substantial bearish momentum during this period. Critically, the 50-day Exponential Moving Average (EMA) crossed below the 200-day EMA around late March/early April, forming a “death cross” that signaled a bearish shift in the intermediate trend.
However, a robust reversal commenced in early April, marked by a powerful upward move on April 9th, closing at .62 on high volume (). Since then, SPY has established a clear uptrend, consistently forming higher highs and higher lows. By late May/early June, the 50-day EMA crossed back above the 200-day EMA, creating a “golden cross” that typically signals a definitive bullish trend resumption. Both EMAs have maintained an upward slope, with the price action largely remaining above both, underscoring persistent bullish momentum. The RSI has mostly remained above the 50-level since late April, frequently entering overbought territory (above 70) in July and September, indicating strong buying interest and positive sentiment.
Current price action indicates the market is in an established uptrend. Near-term resistance levels are identified around the recent highs of - (observed on Oct 8-9) and the all-time high of .70 (Oct 29). The sharp dip on October 10th to .02, which saw elevated volume (), tested support, but the subsequent recovery suggests buying interest at that level. Immediate support is likely found at .83 (Oct 30 low) and more robustly at the confluence of the 50-day EMA, currently around .69, and the prior resistance zone around -, which may now act as a significant support area. The 200-day EMA, currently around .00, offers further long-term support.
Looking ahead, a bullish scenario is likely to prevail. The sustained golden cross, upward-sloping EMAs, and price generally above the moving averages suggest continued upward trajectory. A break above the .70 resistance, especially on expanding volume, would confirm further strength, potentially pushing SPY towards new highs. The RSI, currently at 61.66, indicates room for further upside before reaching overbought conditions. Conversely, a bearish scenario is unlikely to manifest as a long-term trend reversal in the near term, given the entrenched bullish signals. However, a near-term pullback to test the 50-day EMA (around ) is a roughly even chance, especially after hitting recent highs. If SPY were to break below the 50-day EMA and subsequently the 200-day EMA on increasing volume, it would suggest a higher probability of a deeper correction. A neutral scenario, characterized by consolidation between the current levels and the - resistance, is also a roughly even chance in the immediate future, allowing the RSI to cool off from previously overbought levels.
The observed sentiment drivers, purely from a technical perspective, reflect a dominant bullish outlook. The consistent pattern of higher highs and higher lows, coupled with the long-term positive alignment of the EMAs, strongly implies enduring investor confidence. Periods of increased volume on down days (e.g., Oct 10th) suggest some profit-taking or short-term caution, but the subsequent quick recovery indicates resilient buying pressure, absorbing these dips. Overall, market participants appear predisposed to buying, interpreting pullbacks as opportunities within the established uptrend, although the occasional high volume on downward moves warrants vigilance for potential shifts in this prevailing sentiment.
SPY Technical Analysis: Sustained Momentum with Potential for Consolidation
The SPY ETF has exhibited a robust technical posture over the past 180 days, characterized by a significant reversal from a sharp decline into a sustained upward trend. From mid-February to early April, SPY experienced a notable downturn, initiating from approximately and culminating in a significant low of .48 on April 8th. This decline was accompanied by RSI (14-day) readings that plunged into deeply oversold territory, reaching a low of roughly 21.47 on April 8th. The rapid snap-back rally from this low point, observed with a substantial bullish candle and a swift increase in RSI, strongly suggests a capitulation event followed by aggressive buying. This sequence of events marked a critical inflection point, fundamentally altering the short-to-medium term technical outlook from bearish to bullish.
Following the April reversal, SPY has established a clear pattern of higher highs and higher lows, indicative of a dominant uptrend. Price action recovered strongly, pushing past previous resistance levels from the initial decline. Notably, the region around -, which served as a resistance ceiling in February, was overcome by late June and has subsequently acted as a probable support zone. The advance accelerated through July, August, and September, culminating in new highs above by late October. Volume metrics during these periods of strong upward movement were generally robust, lending credibility to the breakout and continuation of the bullish trend. The overall market structure, as evidenced by price, is highly likely to remain bullish in the near term.
Analysis of the 14-day Relative Strength Index (RSI) largely corroborates the price action. Throughout the sustained uptrend from April onwards, the RSI consistently traded above the 50-level, frequently venturing into overbought territory (above 70). Such excursions, for instance in late June, early July, mid-July, and late September, were typically followed by minor pullbacks or periods of consolidation, rather than outright reversals. These episodes of moderation allowed the RSI to reset before the uptrend resumed, suggesting healthy momentum management. Most recently, after hitting an overbought peak of roughly 69.7 on October 29th, the RSI experienced a minor decline to approximately 59.95 on October 30th before closing at approximately 61.66 on October 31st. This suggests a slight cooling off from overbought conditions.
Considering the recent data, it is highly likely that SPY is either experiencing a minor consolidation phase or a temporary pullback from its recent highs. The current RSI reading of approximately 61.66, while still in bullish territory, indicates that the immediate overbought condition has alleviated, providing a roughly even chance for the uptrend to resume without significant immediate resistance or for further consolidation to occur before the next leg higher. A break below the recent low of .83 (October 30th) would likely signal a deeper pullback. Conversely, a sustained move above the recent high of .70 (October 29th) would almost certainly confirm the continuation of the current strong upward trajectory. It is important to note that MACD data was not provided for analysis in this report, and therefore, its potential insights into momentum and trend confirmation could not be incorporated.