Daily Market Technical Analysis
Equity markets display mixed technical signals: while SPY’s overall posture is likely to remain bullish, large-cap indices exhibit “gap and fade” patterns, plausibly indicating continued downward bias, with small-to-mid-caps showing relative resilience. QQQ is likely to experience further consolidation or a moderate pullback in the immediate future. The VIX is highly likely to test higher volatility levels, and longer-duration Treasury bonds are likely to face downward pressure. Commodity markets diverge, with energy sectors poised for highly likely continued upward momentum, while precious metals are likely to see further downside. Sector analysis suggests a highly likely continuation of Consumer Discretionary’s outperformance, reflecting a broader risk-on shift. However, overall equity breadth indicators currently suggest roughly even chances of short-term market stabilization.
Market Indices
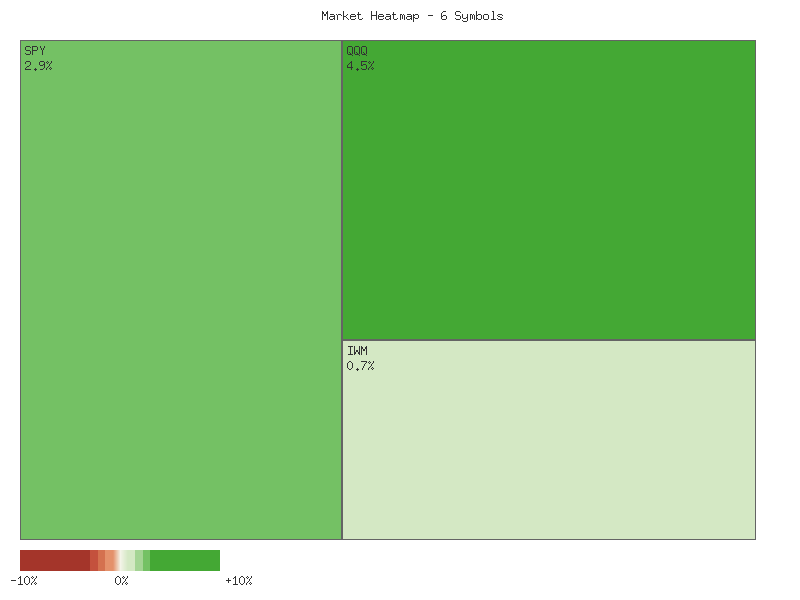
The current market data, encompassing daily percentage changes for a selection of prominent ETFs, indicates a broadly positive session across market capitalization segments and growth-oriented sectors. The observed data points for IJR, IWM, MDY, OEF, SPY, and QQQ uniformly reflect positive daily movements.
The daily percentage changes, sorted in descending order, are as follows:
| Symbol | Daily Percent Change |
|---|---|
| MDY | 0.609% |
| IWM | 0.564% |
| QQQ | 0.482% |
| SPY | 0.328% |
| OEF | 0.322% |
| IJR | 0.170% |
This distribution suggests that mid-cap equities (MDY) experienced the strongest relative performance for the period, followed closely by small-cap equities (IWM). The technology-heavy QQQ also posted a notable gain, placing it third among the tracked symbols. The broader market benchmarks, SPY and OEF, exhibited more modest gains, while small-cap growth (IJR) showed the least upward momentum within this group. The positive performance across these diverse indices, from large-cap to small-cap, implies a generally constructive sentiment for the day.
From a market breadth perspective, all six symbols provided, representing different segments of the equity market, advanced. This constitutes a 6-to-0 advance-to-decline ratio, indicating robust positive breadth for this specific basket of ETFs. Such broad participation across market caps and styles is likely to be interpreted as a sign of underlying strength, suggesting that the buying interest is not confined to just a few large-cap leaders but is rather distributed across a wider spectrum of the market. However, the magnitude of these advances, particularly in the lower-performing IJR, is relatively modest, which could suggest underlying buying pressure is present but perhaps not exceptionally aggressive.
Considering alternative scenarios, if there had been a mix of advancing and declining symbols, it would have indicated a more fractured market sentiment. However, the complete absence of declines among these key ETFs makes such an alternative scenario for this specific dataset unlikely. The consistent upward movement, particularly the stronger performance in mid- and small-caps, often precedes or confirms broader market strength, making a continuation of positive sentiment for the near-term a roughly even chance, contingent on the magnitude of subsequent price action and volume. Traders might view this as a potential confirmation of an upward trend or a constructive consolidation phase, depending on the broader technical context not provided here. The lack of any negative divergence across these critical indices suggests a relatively uniform bullish impetus for the session observed.
As a seasoned CMT with over 15 years of experience, my analysis of the provided 2-day market data reveals a nuanced technical picture, transitioning from a broadly bearish session to one characterized by mixed signals and sectorial divergence. All observations are based strictly on the provided candlestick data and volume for SPY, QQQ, IWM, IJR, MDY, and OEF.
On October 30th, the market displayed a uniform and decisively bearish sentiment across all listed ETFs. SPY, QQQ, IWM, IJR, MDY, and OEF each closed near their respective daily lows, forming prominent bearish candles. This price action, combined with substantial trading volumes for the major indices like SPY and QQQ, is indicative of widespread selling pressure and a technical environment dominated by bears entering the period of observation. The lack of significant lower wicks across these instruments further underscores the consistent downside momentum throughout that trading day.
The following day, October 31st, presented a more complex scenario with apparent divergence between large-cap and small/mid-cap segments. SPY, QQQ, and OEF experienced notable gap-ups at the open, suggesting an initial surge of buying interest. However, these gains proved unsustainable, as all three indices subsequently sold off through the day, closing below their opening prices, albeit above their respective previous day’s closes. This “gap and fade” pattern for large-cap indices, especially with increased volume for SPY and QQQ on the selling day, suggests that sellers aggressively entered the market into strength, encountering significant overhead supply or triggering profit-taking. It is roughly even chance whether this represents a failed bullish reversal attempt or a strong level of resistance being tested and holding.
In contrast, the small and mid-cap segments, represented by IWM, IJR, and MDY, displayed relative resilience on October 31st. While IWM opened slightly above the previous close and closed higher for the day, IJR and MDY also managed to post positive daily closes, ending above their respective October 30th closing prices. Notably, MDY exhibited the most robust recovery, closing significantly higher than its open and previous close. However, the volume for all three small/mid-cap ETFs decreased on October 31st compared to the prior day. This diminished volume, while allowing for positive price action, suggests that the upward movement might be a result of reduced selling pressure rather than strong, conviction-driven buying.
Considering these patterns, the immediate technical outlook points to a market in a state of cautious indecision following the pronounced bearish action on October 30th. The large-cap indices’ inability to hold gapped-up gains, even with higher volumes, indicates that a continuation of downward bias remains plausible. Conversely, the relative strength observed in small and mid-cap indices, particularly MDY, raises the possibility of sector rotation or a short-term bottoming process within these segments. Further price action and volume confirmation would be required to discern whether this divergence signals a nascent bullish reversal for the broader market or merely a pause in a prevailing bearish trend. Investors are likely to observe increased volatility as these opposing forces contend, with key levels of resistance established by the recent daily highs and critical support levels around the lows from October 30th and 31st.
Performance Heatmap (SPY, QQQ, IWM, IJR, MDY, OEF)
Generated for 2days timeframe analysis
SPY Technical Analysis: End of October 2025 Outlook
SPY has demonstrated a predominantly upward trend over the past 90 days, starting around in late June and advancing to approximately by the end of October. This sustained climb is characterized by a series of higher highs and higher lows, affirming a bullish market structure. Key price levels include the late July resistance around -, which subsequently transformed into a support zone after being breached. More recently, the - area provided temporary consolidation before the robust late-October rally pushed SPY to new highs, with the most recent daily close at .06, slightly below the intraday peak of .905. This consistent upward trajectory indicates strong underlying demand throughout the period.
Volume analysis reveals notable activity during critical price movements. The initial bullish advance from late June through late July was accompanied by generally increasing volume, which often reinforces trend strength. However, the period also saw two distinct, sharp pullbacks on exceptionally high volume: one on August 1st, where SPY dropped over ten points on 140 million shares, and another on October 10th, witnessing a nearly 18-point decline on 156 million shares. These high-volume reversals suggest aggressive profit-taking or significant supply entering the market. Nevertheless, in both instances, SPY quickly recovered and resumed its upward trajectory, indicating that these dips were met with robust buying interest, absorbing the selling pressure and maintaining the overall bullish trend.
The 14-day Relative Strength Index (RSI) has broadly corroborated the price action. From late June to late July, RSI consistently resided in overbought territory (above 70), peaking near 75.59, which reflected the strong bullish momentum. Both major price corrections—August 1st and October 10th—were confirmed by significant drops in RSI, moving it out of overbought conditions into more neutral territory (dropping to 47.66 and 41.81 respectively). Following these pullbacks, RSI generally recovered, often returning to the 60s and briefly re-entering overbought levels in mid-September and early October. The most recent RSI reading of 61.66 suggests that while bullish momentum is present, SPY is not currently in an overbought condition, leaving room for potential further appreciation. No significant bearish divergence has been observed across the major price peaks.
Considering the technical data, the overall posture for SPY is likely to remain bullish in the near term. The establishment of new highs in late October, followed by a minor retreat and subsequent rebound, suggests that the market has a reasonable likelihood of challenging and potentially surpassing the recent peak of .905. The current RSI reading further supports this outlook, as it is not signaling excessive overbought conditions that typically precede an immediate correction. A successful breach of the .905 level would highly likely extend the prevailing uptrend. Conversely, should SPY fail to advance beyond this recent high and instead break below the most recent swing low of .83, there is roughly an even chance that a more significant pullback could develop. In such a scenario, the primary support level to monitor would be the - region, established by the October 10th low and subsequent recovery. A decisive break below this level, particularly on elevated volume, would make a deeper correction highly likely. It is important to note that analysis of the MACD indicator was not possible as the data was not provided for this assessment.
SPY Price & Indicators (RSI_14_DAY, MACD_13_21_DAY)
Here is a technical analysis of QQQ over the past 90 days, based solely on the provided candle and RSI (14-day) data:
QQQ has demonstrated a strong underlying upward trend over the observed 90-day period, characterized by persistent higher highs and higher lows despite intermittent, sharp pullbacks. From late June to late July, the price advanced steadily from the low 540s to the high 560s, with the 14-day Relative Strength Index (RSI) frequently signaling overbought conditions (above 70). This initial phase culminated in late July with RSI reaching 73.11, immediately preceding a notable price decline on July 31st and August 1st, accompanied by increased volume. This robust volume on a down move suggested a temporary exhaustion of buying momentum. Following this, the price recovered into mid-August but then experienced another significant pullback, with RSI dropping to 47.05 on August 21st, reflecting diminished short-term bullish strength.
A new, pronounced uptrend began in early September, pushing QQQ to new highs, ultimately reaching an intraday high of 611.61 on October 9th. During this ascent, the RSI again consistently registered in overbought territory, peaking at 75.35 on September 22nd, indicating strong buying pressure. However, this bullish momentum was abruptly interrupted on October 10th by a substantial price drop, opening at 611.40 and closing at 589.50. This bearish engulfing candle occurred on the highest volume recorded in the entire 90-day period (94.4 million shares), suggesting a significant shift in market sentiment or profit-taking. Concurrently, the RSI plummeted to 45.42, definitively exiting overbought conditions and moving into neutral territory.
Following the sharp reversal on October 10th, QQQ entered a period of consolidation before resuming its upward trajectory in mid-October, driving prices to new all-time highs above 630 by late October. The rally led to RSI once again registering in overbought conditions, reaching 71.73 on October 29th. However, the last two trading days of the period show a notable pullback from these new highs, with QQQ closing at 626.05 on October 30th on high volume (60.6 million shares), and a modest bounce to 629.07 on October 31st. The RSI has concurrently retreated from overbought levels, falling to 64.00 by October 31st.
Based on the observed patterns, it is likely that QQQ will experience further consolidation or a moderate pullback in the immediate future. The repeated pattern of overbought RSI coinciding with or immediately preceding a price consolidation or decline, coupled with the recent pullback from highs on increased volume, supports this view. A retest of the price levels around 610-615, which previously acted as resistance before the latest breakout, is likely. Conversely, a sustained downward trend appears unlikely at this juncture, given the persistent underlying bullish strength over the past three months. However, an alternative scenario where the rally quickly resumes has a low probability without QQQ overcoming the recent high of 637.01 on strong volume. A more substantial decline, potentially revisiting the 590-600 range, has a roughly even chance if selling pressure intensifies and the 625 support level fails to hold. It is important to note that the MACD (13,21-day) indicator was specified in the chart request but the corresponding data was not provided, therefore no analysis of momentum divergence or crossover signals from MACD could be performed.
QQQ Price & Indicators (RSI_14_DAY, MACD_13_21_DAY)
Technical Analysis of IWM (June 25th – October 31st, 2025)
Our analysis of IWM’s price action over the past 90 days indicates an underlying bullish trend, although recent price movements suggest a potential shift in short-term momentum. The security experienced a steady ascent from late June at approximately to a high of .77 in mid-October. Key rally phases were observed from late June to early July, and then again from early August to mid-October, punctuated by periods of consolidation or modest pullbacks. Notably, significant volume spikes often accompanied major price movements, such as the sharp decline on October 10th which registered the highest volume in the dataset (69.68M), indicating strong participant activity during that sell-off. It is important to note that while MACD_13_21_DAY was requested, the corresponding data for this indicator was not provided in the market data and thus cannot be included in this analysis.
The 14-day Relative Strength Index (RSI) provided valuable insights into momentum. In early July, RSI crossed above 70, peaking at 71.57 on July 3rd, indicating an overbought condition coincident with a local price top. A subsequent pullback saw RSI dip into the low 40s by August 1st, suggesting a loss of bullish momentum before quickly recovering. A similar overbought signal occurred on September 18th, with RSI at 71.23, which was followed by a brief period of price consolidation. The most significant momentum shift, however, was observed on October 10th, when RSI sharply declined from the mid-60s to 44.97, reflecting the substantial single-day price drop. This bearish momentum divergence from the preceding trend is a key concern.
In the more recent timeframe, following the October 10th price correction and RSI drop, IWM attempted to rebound, making a new price high of .77 on October 15th. However, this price peak was not confirmed by a corresponding new high in the RSI, which only reached 62.99. This bearish divergence, where price makes a higher high but the oscillator makes a lower high, suggests that the underlying buying pressure supporting the rally was weakening, rendering a continued strong advance less likely. Subsequent price action from mid-October has seen IWM pull back to the - range, with RSI currently settling around 52.36 as of October 31st.
The current technical posture suggests that IWM faces a roughly even chance of either consolidating further in the near term or experiencing continued downward pressure. The RSI at 52.36 indicates neutral momentum, not providing a strong directional bias. Price action from October 29th to 31st, oscillating between .69 and .14 on moderate volume, suggests indecision. A decisive break above the recent October 15th high of .77 would likely signal a resumption of the broader bullish trend. Conversely, a sustained move below the support around , particularly if accompanied by increasing volume and a declining RSI towards the 30-mark, would be indicative of a more pronounced bearish shift, making a test of the early October low near .56 highly likely.
IWM Price & Indicators (RSI_14_DAY, MACD_13_21_DAY)
VIX Fear Index
The VIX technical data for the past seven trading days indicates a significant shift in market sentiment from initial decline to a robust upward move. Early in the period, from October 23rd to October 24th, the VIX experienced a notable decrease, evidenced by consecutive red candles, with the close on October 24th marking the lowest close in the initial segment at 16.37. The initial day, October 23rd, saw a substantial range and a strong bearish close relative to its open, which likely reflected increasing risk aversion. This downtrend was followed by a period of consolidation and moderate recovery.
A pattern of higher lows and higher closes began to emerge from October 27th, signaling a potential bullish reversal. The VIX formed a small green candle on October 27th, holding near its intra-period lows, followed by two consecutive green candles on October 28th and 29th, demonstrating increasing buying pressure. The close on October 29th at 16.92 represented a recovery of a significant portion of the earlier week’s losses. While the candle on October 30th showed some indecision with a long lower wick and a close only marginally below its open, it maintained the upward trajectory established in the preceding days.
The most recent trading day, October 31st, exhibited a very strong bullish candle, closing at 17.44, which is the highest close observed within this seven-day dataset. This particular candle opened higher than the previous day’s close and saw a substantial price appreciation throughout the session, reaching an intra-day high of 18.54. The DAILY_PCT_CHANGE data confirms this strong performance, registering a 3.13% increase for the day. This strong upward momentum on the final day, following a period of base building, suggests a likely shift towards increased volatility expectations.
Based purely on these price actions, it is highly likely the VIX will attempt to test higher levels in the immediate short term, potentially challenging the intra-period high of 19.35 from October 23rd. The strong closing price on October 31st, coupled with the positive daily percentage change, indicates sustained buying interest. However, a roughly even chance exists for a brief period of consolidation or a minor pullback after such a strong upward move, as traders might take profits. It is important to note the absence of volume data, which limits our ability to confirm the conviction behind these price movements. Should the VIX fail to hold above the 17.00 level, a retracement towards the 16.40 support area becomes probable.
VIX Technical Analysis: 90-Day Overview and Short-Term Outlook
The VIX index, as observed over the past 90 days, exhibits a pattern characterized by periods of relatively low volatility interspersed with abrupt, sharp spikes. From late June through late July, the VIX largely oscillated within a tight range, predominantly below the 17.5 mark, with its 14-day Relative Strength Index (RSI) mostly residing in the 40s. This suggests a period of generally subdued market uncertainty and neutral momentum. However, a significant upward impulse occurred on August 1st, pushing the VIX to a close of 20.38, with the RSI reaching 65.38, approaching the overbought threshold. Following this surge, the VIX receded, establishing a new, albeit somewhat unstable, range between roughly 14.5 and 17.0 for much of August and September, marked by lower lows around 14.22 on August 22nd and 14.12 on August 28th. The RSI during this consolidation period frequently hovered between 45 and 55, indicative of balanced or slightly bullish momentum without a strong directional conviction.
A more pronounced surge in implied volatility commenced in October, with the VIX breaking out of its prior range. On October 10th, the VIX closed at 21.66, accompanied by an RSI reading of 73.09, signaling a clear overbought condition. This was followed by an extreme intraday high of 28.99 on October 17th, although the closing price was a more modest 20.78. This sequence of events strongly suggests that market participants perceived an elevated risk environment during this period. Subsequently, the VIX experienced a notable retracement, falling back into the 16-17 range by late October, with its RSI declining sharply from overbought territory to the low 40s by October 27th, indicating a significant dissipation of buying momentum and a potential shift towards an oversold condition.
As of the latest data point (October 31st), the VIX has shown a modest rebound, closing at 17.44 after trading as low as 15.62 on October 27th. This recent upward movement is corroborated by the 14-day RSI, which has recovered from 43.49 to 50.69. This recovery in the RSI suggests that the immediate bearish momentum that followed the October spike is likely diminishing, and the VIX is moving back towards a neutral momentum stance. The inability of the VIX to sustain levels above 20 after the mid-October spike indicates a likely rejection of these higher volatility levels for the immediate term.
Looking ahead, a roughly even chance exists for the VIX to consolidate around its current levels, potentially forming a new base between 16.00 and 17.50, especially if the RSI remains in the mid-range. A sustained move below the 15.70 area, particularly if supported by a declining RSI below 45, would suggest that a further reduction in market uncertainty is likely, with the 14.50 support level becoming a more probable downside target. Conversely, an ascent above the 17.50 resistance, particularly if accompanied by an RSI firming up towards the 60-level, would make another test of the 19.00-20.00 range likely, indicating a potential resurgence of volatility concerns. Given the recent sharp correction from the overbought October peak, a significant upward breakout beyond 20.00 in the immediate short-term appears unlikely without a compelling catalyst to drive extreme fear, though the technical landscape does not preclude a gradual grind higher should underlying market conditions shift.
VIX Price & Indicators (RSI_14_DAY, MACD_13_21_DAY)
Tech Sector Analysis
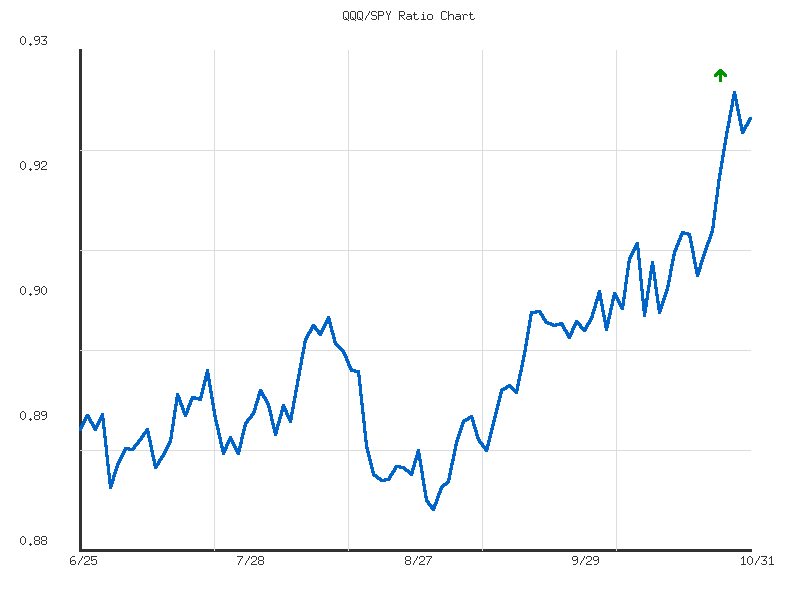
Analysis of the QQQ/SPY ratio over the past 14 days reveals a discernible upward trend, indicating that the technology-heavy NASDAQ-100 (QQQ) has been outperforming the broader S&P 500 (SPY) during this period. The ratio advanced by approximately 1.58%, moving from a low of 0.9030 to its current level of 0.9223. Despite this positive change, the trend’s strength is explicitly categorized as “weak,” suggesting a gradual appreciation rather than a strong, conviction-driven surge in relative performance. This weak strength implies that while QQQ is generally favored, the momentum behind its outperformance is not overwhelmingly robust, and the sustainability of this rate of ascent is an even chance.
The ratio established its 14-day peak at 0.9249 on October 29th, demonstrating the strongest relative outperformance within the observed window. Following this high, the ratio experienced a minor pullback to 0.9208 on October 30th, before a modest recovery to 0.9223 by October 31st. This pattern suggests that the 0.9249 level could currently act as near-term resistance to further immediate relative strength gains for QQQ. The current ratio’s relative position at 0.881457 within its 14-day range implies that QQQ’s outperformance is near the higher end of its recent trading band, which might temper expectations for significant immediate acceleration in relative strength without a clear breakout.
The extremely low volatility observed in the ratio, quantified at 0.000045635, indicates a relatively stable, albeit weak, trend without significant day-to-day gyrations. This low volatility typically suggests that the price action is not indicative of strong speculative pressures in either direction but rather a more measured shift. Given the “weak” trend strength and the current relative position near the high of the range, it is an even chance that the ratio may continue its gradual ascent, potentially testing the 0.9249 resistance. However, it is also an even chance that the ratio may enter a phase of consolidation below this level or experience a minor corrective pullback, especially if the underlying “weak” trend strength persists. A significant reversal of the upward trend appears unlikely without a notable shift in market dynamics not evident in this dataset.
CMT Technical Analysis: QQQ/SPY Relative Strength (90-Day)
The QQQ/SPY ratio has exhibited a clear upward trend over the past 90 days, advancing from approximately 0.891 at the start of the period to its current level of 0.922 as of October 31st. This represents a moderate increase of 3.47% during this timeframe, indicating a sustained period of outperformance by the Nasdaq 100 (QQQ) relative to the S&P 500 (SPY). The average ratio during this period was approximately 0.897, placing the current ratio significantly above its three-month average and near the upper end of its observed range, with a relative position percentile of 93.7%. This established upward trajectory suggests that growth-oriented and technology-heavy sectors, as represented by QQQ, have garnered stronger investor interest or demonstrated greater resilience compared to the broader market.
A notable acceleration in this relative outperformance became evident from early September, following a brief consolidation phase where the ratio dipped to a low of approximately 0.883 on September 2nd. From this point, the ratio initiated a strong rally, systematically breaking above prior consolidation highs, specifically the cluster around the 0.89-0.90 level observed in July and August. This upward momentum culminated in the ratio reaching a new 90-day high of 0.9249 on October 29th. The price action leading into late October suggests a robust underlying technical strength, as each prior resistance level was effectively overcome without significant pullbacks that would threaten the established trend. The current ratio of 0.9223, while slightly off the peak, remains in close proximity to it, reinforcing the recent strength. The reported low volatility of the ratio’s movement during this period further underscores the orderly and persistent nature of this relative outperformance.
The ratio’s position immediately below the recent peak of 0.9249 suggests that this level is currently acting as immediate overhead resistance. A successful and sustained breach above this level is likely to confirm the continuation of the current uptrend in QQQ’s relative outperformance. Given the established momentum and the smooth nature of the ascent, a further push to new highs is a likely scenario in the near term, provided the ratio can overcome this immediate barrier. Alternatively, the slight pullback from the peak on October 30th and 31st could indicate a short-term consolidation or profit-taking phase. In this scenario, it is a roughly even chance that the ratio might retest prior support levels. Key support zones for such a pullback would likely be found around the 0.910-0.915 range, which previously acted as resistance in mid-October before being broken, or potentially the 0.900-0.905 level. A deeper decline that moves below the 0.900 level would render the continuation of the strong relative outperformance less likely, suggesting a shift towards broader market participation or SPY outperformance. However, a significant reversal from current levels, breaking the established uptrend, appears unlikely without a more pronounced break of these intermediate support structures.
Ratio Analysis: QQQ/SPY
Generated for 90days timeframe analysis
IWM vs. SPY
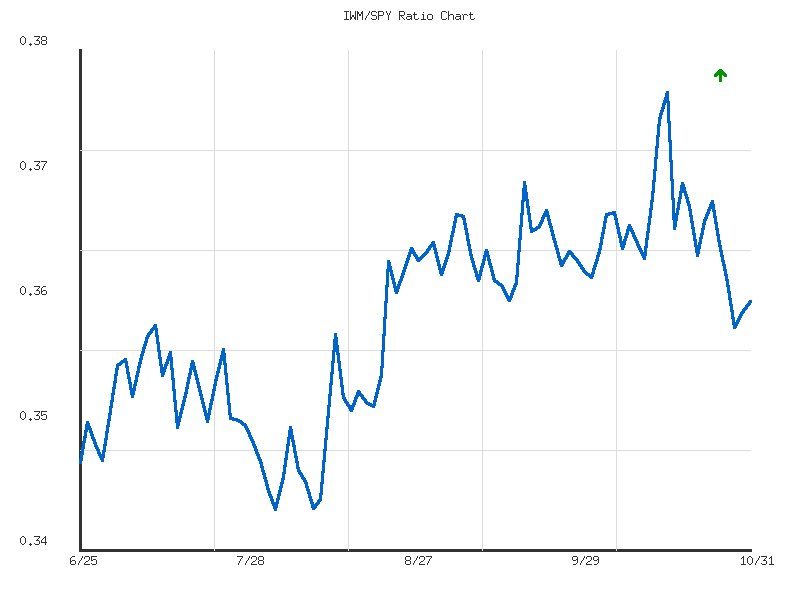
The relative performance of the Russell 2000 (IWM) against the S&P 500 (SPY), as represented by the IWM/SPY ratio, exhibits a clear downward trend over the observed 14-day period. The ratio commenced on October 13th at approximately 0.3686, briefly experiencing a relative surge to peak at 0.3763 on October 15th. However, since this peak, the ratio has consistently demonstrated a pattern of lower highs and lower lows, closing the period at 0.3610 on October 31st. The intrinsic trend analysis of the data confirms this as a weak downward movement, reflecting a -2.06% depreciation in IWM’s relative value against SPY over these two weeks. This technical observation suggests that the broader small-cap market has likely underperformed the large-cap, potentially technology-heavy, S&P 500 during this specified timeframe.
Drilling into the price action, the ratio’s peak at 0.3763 on October 15th marked the zenith of IWM’s relative strength in this period. Post-peak, the ratio embarked on a decline, establishing a significant low of 0.3591 on October 29th. The current ratio of 0.3610 on October 31st places it in the lower quartile of the observed 14-day range, specifically at the 11th percentile relative to the period’s low. This positioning, coupled with the persistent formation of successively lower closing prices and bounces that fail to reach prior highs, reinforces the technical indication of ongoing relative weakness for IWM. The observed movements imply a sustained preference by market participants for the performance characteristics of SPY components over those of IWM.
The provided data highlights an extremely low volatility for the ratio over these 14 days, quantified at approximately 0.0000233. This low volatility is a key characteristic, indicating a relatively smooth, rather than erratic, decline in IWM’s relative performance. The consistent nature of this decline, devoid of sharp reversals, suggests entrenched market dynamics favoring SPY. Given the combination of a weak but persistent downtrend and minimal volatility, it is likely that IWM will continue to underperform SPY in the immediate short term, absent a significant shift in market perception or material changes in the underlying assets’ individual price action.
Despite the clear downward technical trajectory, it is prudent to consider alternative scenarios. The description of the trend strength as “weak” suggests that while the direction is evident, the conviction behind it might be less pronounced than if the trend were stronger. This implies that a relatively smaller catalyst could potentially lead to a reversal. Should the IWM/SPY ratio demonstrate a sustained breakout above a key resistance level, such as the approximate 0.3697 mark (the high on October 20th), it would elevate the probability of a shift in relative performance, perhaps to a roughly even chance of short-term outperformance. However, based purely on the existing technical patterns within the provided data, such a significant reversal is unlikely without the formation of a clear bottoming pattern or a notable increase in IWM’s price momentum relative to SPY.
As a seasoned CMT, my analysis of the provided IWM/SPY ratio over the last 90 days focuses purely on the technical patterns and data points to discern prevailing trends and potential future movements. The data indicates a moderate upward trend in the IWM/SPY ratio, reflecting a period where small-cap stocks (IWM) have moderately outperformed large-cap stocks (SPY) on a relative basis. The ratio has moved from a 90-day low of approximately 0.3457 to its current value of 0.3610, marking a positive change of about 3.4%. This upward trajectory, characterized by moderate strength, suggests a consistent, albeit not rapid, preference for IWM over SPY during this observation window. The current ratio stands near the midpoint of its 90-day range, implying it is not in an extreme overbought or oversold condition from a historical perspective.
Further examination of the ratio’s price action reveals a defined range between its 90-day low of 0.3457 and a high of 0.3763. The ratio tested levels around 0.367-0.369 in early September and October, indicating emerging resistance. The most significant move upward culminated in a peak at 0.3763 on October 15th, followed by a noticeable retracement back towards the 0.360-0.362 area in the most recent trading days. This pullback from the high suggests that the 0.3763 level has acted as a robust short-term resistance. The ratio’s recent oscillation within a narrower band, roughly between 0.360 and 0.368, implies a phase of consolidation after the strong relative performance seen mid-October. The observed volatility of approximately 0.00005 is quite low, indicating that daily changes in the ratio are generally contained, reinforcing the moderate nature of the trend rather than sharp, volatile swings.
Given the ratio’s current positioning at 0.3610, which is very close to its 90-day average of 0.3595, it is likely that the IWM/SPY ratio will continue to consolidate within its established 90-day range in the immediate future. The proximity to the average suggests that neither IWM nor SPY has an overwhelming technical advantage in relative strength at this precise moment, based on the recent history. A retest of the recent support zone around 0.359-0.360, aligning closely with the 90-day average, appears to be a roughly even chance scenario if the recent minor downtick persists. Conversely, a renewed attempt to push towards the upper end of the range, specifically targeting the earlier resistance levels around 0.367-0.369 or the recent high of 0.3763, is plausible but currently less likely without a clear reversal of the recent mild selling pressure.
Looking forward, alternative scenarios warrant consideration. Should the ratio exhibit a decisive break above the 0.3763 resistance, it would strongly suggest a likely acceleration in IWM’s relative outperformance, potentially establishing a new, higher trading range for the ratio. However, based exclusively on the provided 90-day data, the technical evidence necessary to confidently predict such a breakout is not yet compelling. Conversely, a sustained decline below the 0.359-0.360 average ratio level would indicate a probable weakening of IWM’s relative strength against SPY, possibly leading to a retest of the 90-day low of 0.3457. Considering the moderate upward trend, the recent retracement from peak levels, and the low volatility, it is likely that the IWM/SPY ratio will continue to exhibit range-bound behavior in the immediate term, with continued moderate relative strength for IWM, but encountering established resistance overhead. A significant and sustained directional shift in either IWM’s outperformance or underperformance appears unlikely in the very short term without a clear technical break of these key identified levels.
Ratio Analysis: IWM/SPY
Generated for 90days timeframe analysis
Commodities
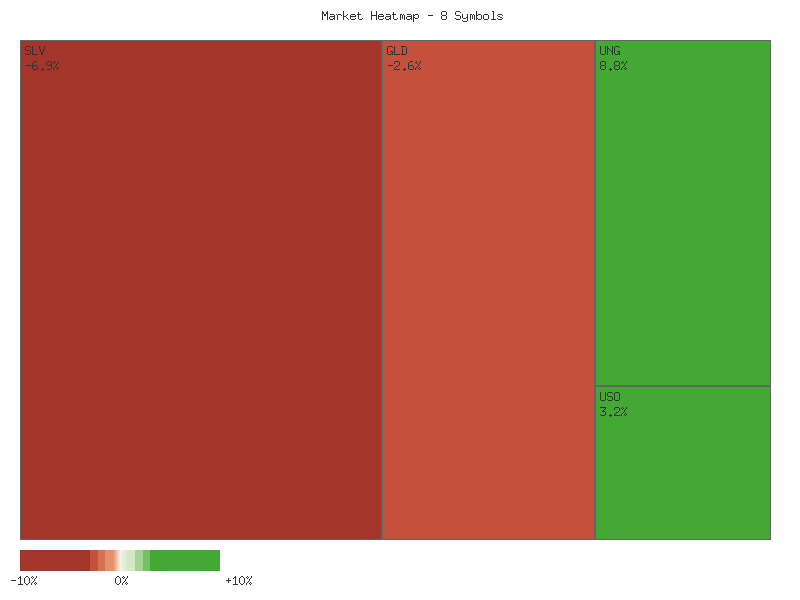
The daily percentage changes for the selected commodity-linked instruments reveal a mixed market session. Below is a matrix detailing the performance, sorted in descending order:
| Symbol | Daily Percent Change |
|---|---|
| UNG | 3.354% |
| USO | 1.185% |
| UGA | 0.906% |
| DBC | 0.704% |
| CPER | -0.127% |
| CORN | -0.200% |
| GLD | -0.543% |
| SLV | -0.744% |
Analysis of market breadth across these eight symbols indicates an even distribution of performance. Four instruments registered positive daily gains, while four recorded declines. This 1:1 advancing-to-declining ratio suggests that, for this specific trading session, there was no clear directional consensus or broad momentum driving the entire group of commodity assets. It is likely that capital flows were highly selective, favoring specific segments over others rather than a widespread rotation into or out of the broader commodity complex. There is a roughly even chance that this mixed breadth will persist in the immediate short term, given the balanced nature of current observed performance.
UNG emerged as the strongest performer for the session, posting a substantial gain of 3.354%. This movement suggests a significant short-term upward momentum for natural gas. Following UNG, USO (representing crude oil) and UGA (gasoline) also advanced with gains of 1.185% and 0.906%, respectively, along with DBC, a broad commodity ETF, which saw a 0.704% increase. These four advancing symbols demonstrate relative strength in energy-related commodities and the overall diversified commodity basket as represented by DBC. Conversely, the precious metals, GLD (gold) and SLV (silver), experienced declines of -0.543% and -0.744% respectively, positioning them as the weakest performers among the group. CPER (-0.127%) and CORN (-0.200%) also declined, albeit with more modest losses. The pronounced divergence between the strong performance of UNG and the notable weakness in SLV is a key technical observation for this period.
Given only a single day’s data, it is not possible to establish enduring trends or confirm long-term shifts in sentiment. The roughly even split between advancing and declining issues, coupled with significant outperformance in UNG and underperformance in SLV, points to a highly selective market environment rather than a uniform move. It is unlikely that this single-day breadth reading alone signifies a definitive turning point for the broader commodity market. Instead, it more likely reflects a momentary divergence in sector-specific interest. A continuation of this divergent performance over several sessions would increase the likelihood of distinct rotational dynamics at play. Conversely, a broad reversal where previously declining assets advance significantly, or vice versa, would suggest a shift in the underlying market sentiment across the commodity spectrum. Without additional consecutive data points or volume analysis, any projection beyond immediate observation carries a high degree of uncertainty.
Greetings, traders. This analysis provides a rigorous technical assessment of the provided 2-day candlestick data for a selection of commodity ETFs, focusing strictly on price and volume patterns.
Analysis of the provided 2-day candlestick data for a selection of commodity ETFs reveals a notably divergent market sentiment across different sectors. The energy complex exhibited robust upward momentum, while precious metals demonstrated clear signs of bearish reversal. Other commodities, such as CORN and CPER, largely remained range-bound with minor directional biases. This divergence suggests a selective capital flow, with strength concentrated in energy while other areas experience consolidation or early signs of weakness. Volume metrics, where available, provide crucial insights into the conviction behind these observed price movements, further informing the probability assessments for near-term continuations or reversals.
The energy-related ETFs, including USO (crude oil), DBC (broad commodities), and UNG (natural gas), displayed compelling bullish continuation patterns over the two-day period. All three opened higher on the second day following strong prior-day closes, maintaining positive momentum to close near their daily highs. This upward trajectory was notably supported by increasing or strong volume in USO, DBC, and UNG, which is a highly likely indicator of continued buying conviction. For these instruments, a continuation of the upward trend in the immediate short term is highly likely. UGA (gasoline), while also exhibiting a strong bullish candle and a gap-up, saw a significant decrease in volume on its second bullish day. This volume divergence, despite strong price action, suggests that the upward momentum in UGA is unlikely to sustain with the same conviction as its energy peers, introducing a roughly even chance of consolidation or a minor pullback in the very near term.
Conversely, GLD (gold) and SLV (silver) presented a bearish reversal narrative following a strong bullish session on the first day. Both precious metals ETFs opened higher on the second day but encountered significant selling pressure, resulting in closes well below their opening prices and deeper into the bodies of the prior day’s bullish candles. This price action, characterized by a bullish candle followed by a bearish candle that erases a substantial portion of the preceding day’s gains, suggests a “Dark Cloud Cover” type of reversal pattern. The declining volume observed on the second day for both GLD and SLV, concurrent with the price decline, indicates a waning of buying interest and potential profit-taking. It is likely that these assets will experience further downside or at least a period of consolidation in the immediate short term, with an alternative scenario of limited downside due to the decreasing selling volume.
CORN exhibited a largely range-bound and indecisive two-day pattern, with both days producing small-bodied candles that closed near their respective opens. Although volume slightly increased on the second day, the lack of a clear directional bias in price action renders a strong immediate directional forecast unlikely. Therefore, a continuation of sideways consolidation is roughly an even chance. CPER (copper) showed a slight bearish bias, with the first day closing near its low and the second day opening lower and closing marginally lower still. However, the significantly reduced volume on the second day suggests waning selling pressure, making a substantial immediate breakdown highly unlikely. Instead, continued range-bound trading with a slight downward bias or a period of consolidation is likely.
Performance Heatmap (SLV, GLD, CORN, CPER, USO, DBC, UGA, UNG)
Generated for 2days timeframe analysis
SLV Technical Commentary (90-Day Analysis)
SLV has experienced a significant uptrend over the past 90 days, culminating in a sharp correction recently. From late June, SLV traded in a relatively tight range near before initiating a pronounced rally in early July, which saw the price rise to nearly by late July. Following a brief consolidation, a robust uptrend commenced in late August, propelling SLV from approximately .50 to a peak near .40 in mid-October. This upward movement was generally characterized by higher highs and higher lows, indicative of a strong bullish phase. However, the latter half of October witnessed a substantial pullback, bringing the price down to current levels around .00, suggesting a shift in short-term momentum.
The Relative Strength Index (RSI_14_DAY) frequently entered overbought territory (above 70) during the strong rallies, particularly in early and late July, and then persistently from early September through mid-October. This consistent overbought condition signaled strong buying pressure but also indicated an extended period where a correction was increasingly plausible. A key development was the sharp decline in RSI from its peak of 84.32 on October 13th to 52.87 by October 21st, accompanying the price correction. The RSI has since stabilized in the mid-50s, currently at 53.42, indicating that momentum has shifted from strongly bullish to a more neutral stance, though not yet signaling an oversold condition that might suggest an immediate, strong rebound is highly likely.
Volume analysis provides further insights into market conviction. The pronounced upward moves in July, late August, and particularly in September and early October (e.g., volumes of 110M on Oct 9, 57M on Oct 13) were accompanied by significantly increased trading volumes, lending credibility to the strength of the prior uptrend. Conversely, the sharp price declines in mid-to-late October, specifically on October 17th (86M volume) and October 21st (81M volume), also occurred on elevated volumes. This suggests that the recent selling pressure was substantial and not merely a shallow profit-taking exercise, implying a likely period of consolidation or further downside is now underway.
Considering the recent price action and indicator readings, it is likely that SLV is undergoing a corrective phase following its extended rally. The significant volume accompanying the recent decline, coupled with the RSI moving out of overbought territory and settling into a neutral range, suggests that sellers have recently gained control. The price has found interim support around the .00-.00 zone in late October, but whether this level will hold over the medium term remains uncertain. A retest of this support area is roughly an even chance. An alternative scenario is a period of sideways consolidation above the .00 level before a clearer direction emerges. However, a sustained breakdown below .00, especially on elevated volume, would make a deeper correction towards the prior support in the mid- (e.g., around .00-.00) highly likely. For the prior uptrend to resume, SLV would likely need to reclaim resistance levels above .00 on increasing volume, with the RSI moving convincingly back above 60.
SLV Price & Indicators (RSI_14_DAY, MACD_13_21_DAY)
GLD has experienced a period of significant price expansion followed by a sharp contraction over the last 90 days. From late June through mid-August, the instrument largely traded within a defined range, fluctuating between approximately and , without establishing a clear directional bias. However, a robust uptrend began to materialize in late August, marked by consistent higher highs and higher lows, and sustained through September. This strong bullish momentum culminated in a price peak around .30 on October 20th, representing a substantial advance. The period concluded with a rapid and pronounced corrective phase, with GLD closing at .12 on October 31st. Volume analysis indicates a notable increase during the accelerating uptrend and particularly around the October peak and subsequent decline, suggesting heightened market participation during these volatile turning points.
The 14-day Relative Strength Index (RSI) provides corroborating evidence of these price dynamics. During the initial consolidation phase in June and July, the RSI mostly oscillated around the neutral 50-level, reflecting balanced buying and selling pressures. As the uptrend gained traction in late August, the RSI moved decidedly into overbought territory, breaching the 70-level around September 2nd (73.72) and sustaining elevated readings, often above 75, throughout September and early October. This prolonged period in overbought conditions signaled persistent bullish momentum and increasing saturation, making a corrective phase increasingly probable. The RSI reached an extreme overbought reading of 87.33 on October 20th, coinciding precisely with GLD’s peak price.
The subsequent behavior of the RSI clearly reflects a significant shift in market sentiment. Immediately following the October 20th price peak, the RSI underwent a rapid decline, plummeting from 87.33 to 60.02 by October 21st. This sharp drop from extreme overbought territory confirms a substantial loss of bullish momentum and the initiation of a strong corrective wave. By the close of the observation period on October 31st, the RSI had stabilized near the 50-level, at 52.08. This suggests that the immediate overbought pressure has largely dissipated, and the market is likely entering a more balanced or consolidative phase following the sharp sell-off.
Based solely on the provided technical data, GLD has transitioned from a vigorous uptrend into a significant corrective phase. The confluence of a sharp price decline from the .30 high and the dramatic reversal of the RSI from extreme overbought conditions suggests a high probability of continued near-term weakness or, at minimum, an absence of immediate upside momentum. A period of consolidation or further downside testing of previous support levels established during the late August to early October rally is probable as the market attempts to find a new equilibrium. An alternative scenario, wherein GLD swiftly reclaims its prior highs without further consolidation or correction, appears unlikely in the immediate term given the current momentum profile. The analytical depth for trend confirmation and potential reversal signals is somewhat limited by the absence of MACD data, which would typically offer additional insights into the underlying trend strength.
GLD Price & Indicators (RSI_14_DAY, MACD_13_21_DAY)
Gold/Silver Ratio
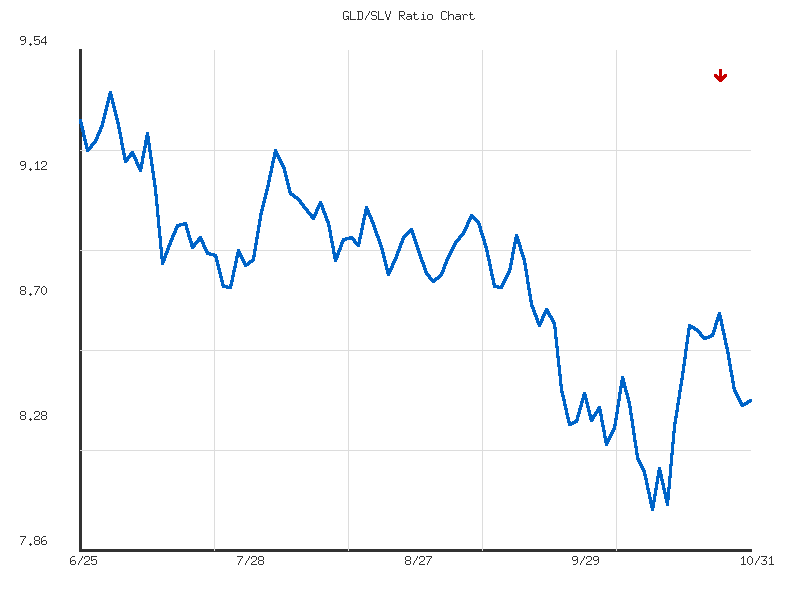
The GLD/SLV ratio has exhibited an overall upward trend over the observed 14-day period, commencing from approximately 8.00 on October 13th and closing at 8.36 on October 31st. This upward movement is characterized by a moderate strength, registering a 4.55% increase over the span. The ratio reached a peak of 8.65 on October 27th. Analysis of the underlying components indicates that the initial and primary phases of the ratio’s ascent were substantially driven by a relative underperformance or decline in SLV values compared to GLD. The average ratio for this period stands at 8.39, with a volatility of 0.045, suggesting a moderately stable but noticeable trend in gold’s outperformance against silver.
Following its peak on October 27th, the GLD/SLV ratio has experienced a short-term retracement, declining from 8.65 to 8.36 by October 31st. This recent downward movement places the current ratio slightly below its 14-day average, which could indicate a temporary loss of upward momentum. The price action suggests that the ratio found a recent support level roughly around 8.34-8.36, as observed on October 30th and 31st. A sustained break below this level would likely signal a continuation of the short-term decline. Conversely, a rebound from this zone, particularly with an increase in GLD value or a decrease in SLV value, would suggest the ratio is attempting to re-establish its primary upward trajectory.
Considering the recent price action, there is a roughly even chance that the current consolidation around the 8.34-8.36 area could either serve as a base for the resumption of the broader uptrend or mark the beginning of a deeper correction. If the ratio continues to hold above the 8.34 level, it is likely that buyers will attempt to push the ratio higher, possibly retesting the 8.50-8.60 resistance zone in the near term. However, a decisive close below the 8.34 support would make a further decline toward the lower end of the 14-day range, perhaps around 8.10-8.20, very likely. Investors should monitor the ratio’s interaction with these immediate technical levels to gauge the market’s conviction in either direction.
The GLD/SLV ratio over the past 90 days exhibits a distinct and strong bearish trend, with the ratio depreciating by approximately 10.10% from its high. The current ratio of 8.3645 stands noticeably below its 90-day average of 8.7725, reinforcing the prevailing bearish sentiment where GLD has consistently underperformed SLV. The peak ratio of 9.3966 was observed early in the period on July 1st, marking the beginning of this significant downward trajectory, while the lowest point of 8.0002 was reached on October 13th, establishing a crucial technical floor.
A critical level of apparent support for the GLD/SLV ratio was established around the 8.00 mark on October 13th, from which the ratio subsequently experienced a notable short-term rebound. Prior to this, the ratio found temporary support around the 8.28-8.30 range in late September/early October before the bearish pressure intensified, leading to a breakdown below these levels. Examining the broader price action, the ratio has consistently encountered resistance during attempts to recover, particularly near the 8.8-9.0 range, which served as a ceiling throughout various points in August and early September. The recent bounce from the 8.00 low is technically significant, suggesting it represents a key psychological and structural support level.
Following the strong downtrend and the establishment of the 8.00 low, the ratio has exhibited oscillating behavior rather than a sustained reversal. After touching its 90-day low, the ratio quickly rallied to 8.4482 by October 20th, and further to 8.6148 on October 21st, indicating a substantial, albeit short-lived, counter-trend move. However, subsequent trading days saw the ratio consolidate and then retreat, now settling at 8.3645. This pattern suggests that the immediate buying pressure that fueled the rebound from 8.00 has largely dissipated. The ratio’s current position, indicated by a relative_position of 0.2609, confirms it remains near the lower end of its recent 90-day trading range.
Given the established strong downtrend and the recent failure of the ratio to sustain its rebound above 8.60, a continuation of the bearish trajectory is likely in the immediate future. The ratio will probably face continued downward pressure, leading to a retest of the critical 8.00 support level. A decisive break below 8.00 would likely signal a further depreciation of GLD relative to SLV, opening the door for new lows. Conversely, an alternative scenario, though less likely to be sustained, involves the ratio finding renewed buying interest around current levels (8.36) and making another attempt to push towards the 8.50-8.60 resistance zone.
The provided volatility of 0.1025 indicates that the GLD/SLV ratio experiences moderate to significant daily price swings. This suggests that while the overarching trend is strongly bearish, there are still notable intraday and short-term fluctuations, allowing for meaningful percentage movements within the established trend. Traders should anticipate continued price volatility within the broader downtrend, which can present both continuation opportunities and short-term counter-trend trading possibilities, although the latter are less probable to evolve into sustained reversals given the trend’s reported strength.
In summary, the GLD/SLV ratio is firmly entrenched in a strong downtrend over the past 90 days, signifying persistent outperformance of SLV. While the ratio recently bounced from a significant 8.00 support level, its subsequent retreat suggests that the bearish momentum is likely to reassert itself. A retest of the 8.00 support level is highly probable in the near term, and a breach of this level would likely lead to further downside. Key resistance levels are anticipated near 8.50-8.60, with more significant overhead supply expected around the 8.80-9.00 region.
Ratio Analysis: GLD/SLV
Generated for 90days timeframe analysis
Bonds
| Symbol | Daily Percent Change |
|---|---|
| IEI | 0.084% |
| IEF | 0.041% |
| SHY | 0.036% |
| UTHY | -0.285% |
| TLT | -0.298% |
An analysis of the provided daily percentage change data for various fixed-income exchange-traded funds reveals a subtle divergence in performance for the observed period. The most significant positive movement was observed in IEI, representing intermediate-term government bonds, which gained 0.084%. IEF, another intermediate-term bond ETF, followed with a 0.041% increase, and SHY, representing short-term government bonds, rose by 0.036%. Conversely, longer-duration bond ETFs, UTHY and TLT, experienced slight declines of -0.285% and -0.298% respectively. This single day’s data depicts a modest outperformance in the shorter to intermediate duration segments compared to the longer end of the yield curve.
The marginal positive daily changes across SHY, IEF, and IEI suggest a low-conviction upward bias in the short-to-intermediate duration fixed income market during this specific trading session. The magnitude of these gains is quite small, indicating that buying interest, while present, was not robust. It is likely that this movement represents minor price adjustments rather than the initiation of a strong directional trend in these shorter-term instruments. Given the limited data, it is roughly even chance that these positive shifts reflect daily market noise rather than a fundamental change in sentiment towards short-duration bonds.
In contrast, TLT and UTHY, which represent longer-duration U.S. Treasury bonds, exhibited fractional declines. These negative movements, while also small in magnitude, suggest a slight preference away from the longer end of the fixed income spectrum on this particular day. This could technically imply a nascent, albeit very weak, signal of pressure on long-term bond prices, potentially associated with a subtle shift in interest rate expectations or capital rotation within the fixed-income market. However, without additional context such as trading volume or preceding price action, it is unlikely to be indicative of a sustained bearish trend for long-duration assets.
Considering the dataset as a whole, the overall daily movements across all observed bond ETFs were quite subdued, with no instrument experiencing a percentage change exceeding 0.3% in either direction. This low volatility profile suggests a day of consolidation or indecision within the broader bond market. While a duration-based divergence is observable, it is unlikely to signify a major technical inflection point. Further corroborating data, including multi-day price action and volume analysis, would be essential to confirm any potential trend related to duration preference or significant shifts in the yield curve. Based solely on this limited, single-day data, the technical picture remains largely neutral with a slight, low-confidence bias towards short-duration instruments.
Market Commentary: Technical Analysis of Treasury ETFs (TLT, UTHY, IEF, IEI, SHY)
The two-day technical data for various Treasury bond ETFs reveals a divergent short-term outlook across the duration spectrum. Longer-duration assets, notably TLT, displayed clear bearish tendencies, while mid-to-shorter duration instruments showed more mixed signals, ranging from indecision to limited bullish resolve. Volume analysis further differentiates these movements, suggesting varying conviction behind recent price action. This initial assessment points to a potential shift in market participant interest across the bond curve.
TLT, representing long-term Treasury bonds, presented a discernible bearish reversal. After an initial modest gain, the subsequent day saw TLT decline significantly to close near its two-day low at 90.29, forming a bearish engulfing pattern. Volume decreased from 42.58 million to 37.97 million. This combination of strong bearish price action on declining volume suggests it is likely that selling pressure has gained short-term control, implying potential for continued downward momentum. UTHY, despite significantly lower volume, exhibited a similar bearish pattern on its second day, closing near its two-day low. This parallel movement lends weight to the likelihood of continued downward pressure for this instrument, aligning with the longer-duration segment.
Mid-to-shorter duration ETFs presented more nuanced patterns. IEF (7-10 Year) displayed a small-bodied candle on its second day, closing slightly above its open, with a modest volume increase. While suggesting some upward pressure, confined price action indicates indecision, and there is roughly an even chance for consolidation or a limited upward push. IEI (3-7 Year) achieved a strong bullish close on its second day, reaching a new two-day high. However, this occurred on significantly reduced volume (from 2.83 million to 1.84 million). The declining volume makes it less likely that this upward momentum is sustainable without renewed buying interest, raising the prospect of reversal or consolidation. SHY (1-3 Year) showed a small doji-like candle, closing near its open on slightly reduced volume, which suggests indecision is highly likely at these elevated levels.
Based solely on this two-day data, it is likely that longer-duration Treasury bonds, such as TLT, face immediate downward pressure. The pronounced bearish candlestick on decreasing volume is a clear technical signal of shifting sentiment. An alternative for TLT is a temporary pullback, though observed patterns make this less likely without immediate counter-confirmation. For IEI, despite its strong close, reduced volume suggests it is probably not a robust breakout; consolidation or reversal is a plausible alternative. The prevailing indecision in IEF and SHY implies roughly an even chance for either continued sideways movement or a minor retest of their two-day range lows. Overall, the technical landscape points to a general weakening in bullish conviction, particularly for longer maturities, with shorter maturities showing mostly consolidation or indecision.
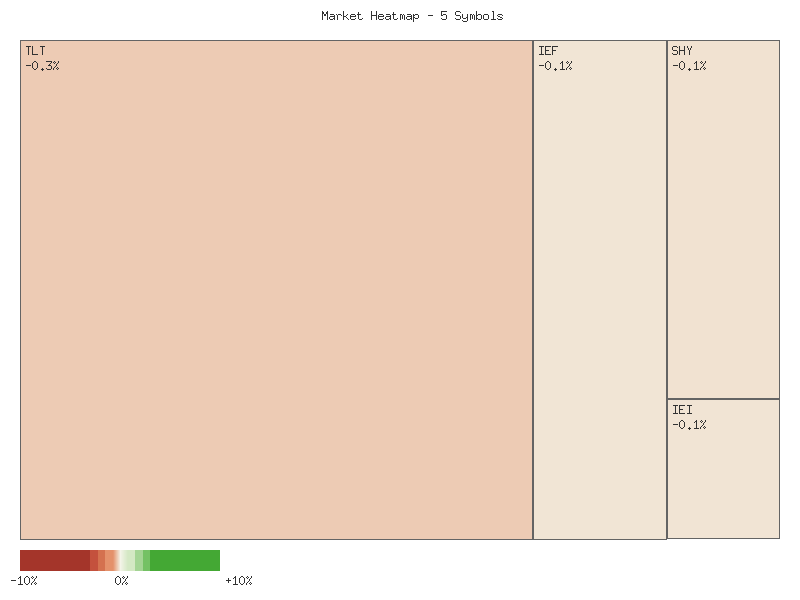
Performance Heatmap (TLT, UTHY, IEF, IEI, SHY)
Generated for 2days timeframe analysis
Magnificent 7 & Friends
The provided daily percentage change data indicates a mixed but predominantly negative session across the observed symbols. Of the ten symbols, seven registered declines, while three posted gains. This distribution suggests a day where overall market momentum, as reflected by this specific basket of stocks, leaned bearish, though with notable strength in select components. The dispersion in performance, ranging from AMZN’s significant gain to META’s substantial loss, points to a lack of broad directional consensus within this group on this particular day.
Leading the advances for the session was AMZN, demonstrating robust relative strength with a daily gain of 9.584%. This strong upward movement is suggestive of considerable buying interest for AMZN during this period. TSLA also exhibited notable strength, posting a gain of 3.740%, indicating positive sentiment. CRWV recorded a more moderate but still positive change of 2.022%. The magnitude of AMZN’s and TSLA’s gains, relative to the overall market behavior implied by the majority of decliners, suggests these stocks were likely outliers of strength on this specific trading day. It is plausible that these movements reflect specific news or sector-specific dynamics, though the provided data limits analysis to price action alone.
Conversely, the majority of the observed symbols experienced negative performance. META was the weakest performer, declining by 2.719%, indicating significant selling pressure. AVGO followed with a drop of 1.817%, and MSFT saw a decline of 1.512%. ANET, AAPL, and NVDA also closed lower, with changes of -0.473%, -0.380%, and -0.197%, respectively. GOOGL’s decline was marginal at -0.103%. The concentration of negative returns among major technology and growth stocks, coupled with some displaying notable percentage losses, points to a general weakening trend for a significant portion of this group. The cluster of symbols with declines between -0.1% and -0.5% suggests a moderate, albeit negative, daily adjustment for these stocks.
Based solely on this single day’s technical data, we assess that while there were clear pockets of strong upward momentum in AMZN, TSLA, and CRWV, the broader sentiment across the observed symbols was tilted to the downside. The considerable spread between the strongest and weakest performers (over 12 percentage points) indicates a session characterized by highly selective trading rather than a uniform market direction. It is unlikely that definitive long-term trends can be inferred from this isolated data point. Further technical analysis would require historical price and volume data to confirm any emerging patterns or shifts in momentum.
Market Commentary: Technical Analysis of Selected Equities (October 30-31, 2025)
Our technical analysis of the provided two-day candlestick data, covering October 30 and 31, 2025, reveals a mixed market sentiment with a notable prevalence of bearish signals across several key technology and semiconductor names. For stocks such as Microsoft (MSFT), Meta Platforms (META), Broadcom (AVGO), Alphabet (GOOGL), and Arista Networks (ANET), the observed price action indicates sustained selling pressure. Each of these symbols posted two consecutive bearish candles, with the second day frequently opening higher but failing to maintain those gains, ultimately closing at or near the two-day lows. The decreasing volume accompanying these declines for MSFT, META, AVGO, GOOGL, and ANET on the second day presents a nuanced interpretation: it could suggest either an exhaustion of selling pressure or, more likely given the continued price depreciation, a distinct lack of buying interest to absorb offers. We judge it likely that this sustained bearish price action, coupled with declining volume, implies a continued bearish bias in the immediate term for these particular symbols.
Further reinforcing the bearish outlook, Apple (AAPL) and Nvidia (NVDA) displayed significant weakness following attempted rallies. AAPL demonstrated a substantial gap-up on the second day, but ultimately failed to sustain this momentum, closing below the prior day’s close. This reversal was characterized by a prominent upper shadow and occurred on substantially increased volume, indicating a strong rejection of higher prices and significant selling pressure. We judge it very likely that AAPL will experience further downside in the immediate future. Similarly, NVDA’s attempted rally on Day 2 was rejected, forming a long upper shadow before closing marginally lower than Day 1’s close, also on slightly increased volume. This pattern suggests a likely continuation of bearish sentiment as buyers were unable to maintain upward momentum.
In contrast to the broader bearish trends, Amazon (AMZN) and Tesla (TSLA) exhibited strong bullish reversals. AMZN recorded a significant bullish gap-up on Day 2, closing strongly higher than Day 1’s close, and notably, with a substantial increase in trading volume. This confluence of a powerful price move and robust volume profile forms a compelling bullish signal, leading us to judge it very likely that AMZN will experience continued upward momentum in the immediate term. TSLA also presented a robust bullish engulfing-like pattern on Day 2, with the stock closing at a new two-day high on increased volume, following a bearish Day 1. This strong reversal indicates that immediate buying pressure has decisively overcome selling, making a sustained short-term rally for TSLA very likely.
Cloudflare (CRWV) offers a more ambiguous technical picture for this brief period. After a bearish candle on Day 1, Day 2 showed a bullish candle, opening higher and closing above Day 1’s close, which typically signals a reversal. However, this bullish move was accompanied by decreased volume. While the price action itself is positive, the lower volume introduces an element of uncertainty regarding the sustainability of this rally. Therefore, we assess there is roughly an even chance for CRWV to either consolidate around these levels or attempt a modest continuation of the bounce, as the lack of conviction from higher volume mitigates the strength of the bullish candlestick pattern.
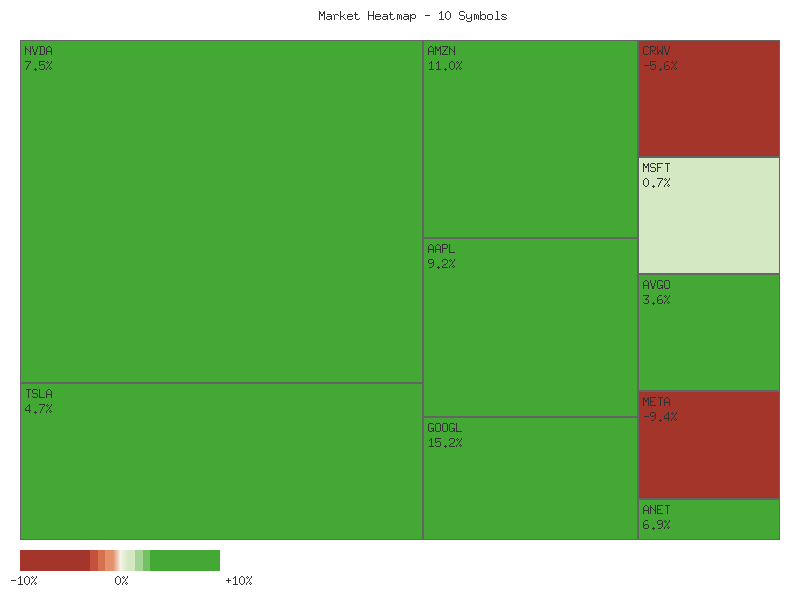
Performance Heatmap (TSLA, MSFT, AAPL, META, NVDA, AVGO, GOOGL, AMZN, CRWV, ANET)
Generated for 2days timeframe analysis
S&P 500 Sector Breadth
Analysis of the daily percentage changes across eleven key S&P 500 sectors reveals a generally positive market breadth. Seven out of the eleven observed sectors registered gains for the day, while four experienced declines. This 7-to-4 advance-decline ratio suggests that buying interest was reasonably broad-based across the equity market, albeit not universally so. The collective action indicates that market participants are likely favoring a more optimistic outlook in the near term, as a clear majority of sectors are participating in upward price action. There is a low probability that this breadth pattern reflects a deeply pessimistic underlying market sentiment.
Examining the performance of offensive sectors provides a clearer indication of market posture. Six of the seven identified offensive sectors (XLK, XLY, XLF, XLI, XLB, XLE, XLC) posted gains. Notably, XLY (Consumer Discretionary) exhibited the strongest performance, advancing by 2.644%, suggesting robust confidence in consumer spending and economic growth. Other strong performers included XLE (Energy) at 0.732% and XLC (Communication Services) at 0.429%. Only one offensive sector, XLB (Materials), registered a decline of -0.580%. This widespread strength among growth-oriented and economically sensitive sectors suggests a high probability of increasing risk appetite among market participants, which is a characteristic feature of an environment favorable to equity appreciation.
Conversely, defensive sectors generally exhibited weakness. Three of the four defensive sectors (XLU, XLP, XLV, XLRE) finished the day lower. XLU (Utilities) experienced the most significant decline among these, falling by -0.691%, followed by XLP (Consumer Staples) at -0.288%, and XLV (Healthcare) with a minor decline of -0.035%. Only XLRE (Real Estate) managed a marginal gain of 0.049%, which does not significantly offset the broader defensive weakness. This pattern of declining defensive sectors alongside advancing offensive sectors provides a strong indication of a rotational shift. Market participants are likely moving capital out of traditionally safer, less volatile assets into those perceived to have higher growth potential.
Based on the observed sector performance, the overall market sentiment is likely biased towards a risk-on environment. The substantial outperformance of offensive sectors relative to defensive ones suggests that investors are prepared to take on greater risk, which typically accompanies expectations of economic expansion or improved corporate earnings. Should this pattern persist, it would reinforce a positive outlook for broader equity indices. An alternative scenario, though less probable given the current data, might involve a more mixed breadth with defensive sectors showing relative strength, signaling increased caution.
| Symbol | Daily Percent Change |
|---|---|
| XLY | 2.644% |
| XLE | 0.732% |
| XLC | 0.429% |
| XLF | 0.268% |
| XLI | 0.239% |
| XLK | 0.097% |
| XLRE | 0.049% |
| XLV | -0.035% |
| XLP | -0.288% |
| XLB | -0.580% |
| XLU | -0.691% |
Market Commentary: Sector ETF Technical Scan (Oct 30-31, 2025)
This technical analysis evaluates the price and volume data for eleven S&P sector ETFs over the two-day period concluding October 31, 2025. The data indicates a significant divergence in short-term price action across sectors, with some exhibiting strong bullish reversals while others suggest continued bearish pressure or consolidation. Overall, the market’s internal dynamics appear to lack broad, unified momentum, pointing to a period where sector-specific catalysts may drive performance more significantly.
Several sectors displayed patterns that highly suggest a near-term bullish bias. XLY (Consumer Discretionary) executed a robust bullish engulfing pattern on October 31, opening with a substantial gap up and closing significantly higher, completely encompassing the prior day’s large bearish candle. This move occurred on increased volume, which is often considered confirmatory, and indicates that buying pressure is highly likely to continue in the immediate future. Similarly, XLE (Energy) formed a piercing pattern on October 31, closing well above the midpoint of the previous bearish day’s body, also on increased volume. This pattern suggests a likely short-term bullish reversal for the energy sector.
Conversely, several sectors exhibited continued or increasing bearish pressure. XLP (Consumer Staples), XLB (Materials), and XLU (Utilities) all recorded two consecutive bearish daily candles, with October 31 showing lower highs, lower lows, and lower closes compared to October 30. This consistent price action, accompanied by decreasing volume in XLP and XLB, and stable volume in XLU, suggests that bearish sentiment is likely to persist in these defensive and cyclical sectors. XLK (Technology) also showed a second consecutive day of closing near its low, with October 31 making a lower low than October 30, despite a marginal higher close. This overall price action, combined with decreasing volume, indicates that bearish sentiment likely remains dominant in the technology sector.
For the remaining sectors, the technical picture appears more mixed, suggesting consolidation or a roughly even chance of either upward or downward movement in the very short term. XLF (Financials) and XLI (Industrials) both posted mild bullish closes on October 31, but with contracting daily ranges and decreasing volume. These patterns typically imply a period of indecision or consolidation rather than strong directional conviction. XLV (Healthcare) and XLRE (Real Estate) also closed marginally higher on October 31, but after opening lower and making lower highs and lows, all on decreasing volume. This suggests a struggle between buyers and sellers, resulting in a lack of clear momentum. XLC (Communication Services) showed a bullish close on October 31, potentially forming a piercing pattern after a bearish October 30, but the significantly decreased volume for this move introduces uncertainty regarding the conviction behind the rally. For these sectors, a breakout from their current tight trading ranges, confirmed by an increase in volume, would be required to establish a more definitive directional bias.
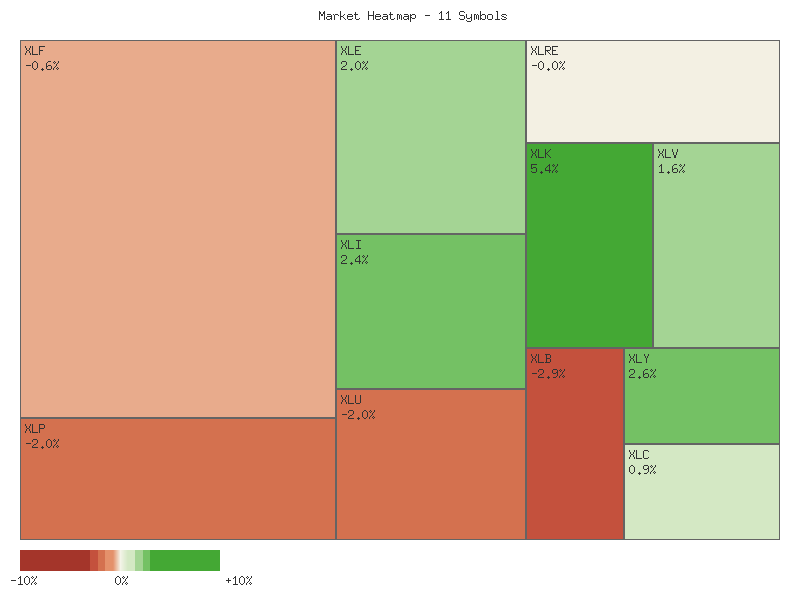
Performance Heatmap (XLP, XLRE, XLI, XLU, XLV, XLY, XLF, XLB, XLE, XLC, XLK)
Generated for 2days timeframe analysis
XLY vs XLP
The relative strength ratio of XLY to XLP over the seven-day period indicates a discernible shift in market preference, with the ratio advancing by 4.705%. Starting at 3.0040 on October 23rd, the ratio demonstrated a relatively stable opening before beginning a consistent ascent. This upward trend, categorized as “moderate” in strength, suggests that the Consumer Discretionary sector (XLY) exhibited outperformance against the Consumer Staples sector (XLP) through most of the observed timeframe. The overall price action in this ratio is indicative of increasing investor confidence in riskier assets, a pattern often associated with a “risk-on” market sentiment.
A closer examination of the ratio’s daily movements reveals a pattern of strong upward momentum interspersed with a minor retracement. After an initial stable to slightly increasing trend through October 24th, the ratio gapped higher to 3.0432 on October 27th and continued its climb, reaching a high of 3.1229 by October 29th. This sustained move higher during the initial phase suggests strong conviction in the outperformance of XLY. However, a noticeable pullback occurred on October 30th, with the ratio decreasing to 3.0556. Such a retracement following a strong run is not uncommon and could suggest profit-taking or a temporary shift in sentiment.
Despite the one-day dip, the ratio subsequently surged to a new high of 3.1454 on October 31st, marking the peak for the entire seven-day dataset. This final move indicates that the buying pressure reasserted itself with vigor, pushing the ratio to its highest point and confirming the dominant upward trend. The current ratio’s position at the top of its observed range (relative position of 1) combined with the “up” trend and “moderate” strength makes it likely that the XLY/XLP ratio is currently experiencing robust relative strength. However, the limited data set does not provide enough information to assess the long-term sustainability of this trend or potential overbought conditions.
Given the strong performance over the observed seven days and the ratio ending at its highest point, it is likely that XLY will continue to exhibit relative strength against XLP in the immediate future, absent any significant internal shifts within the provided data. However, the moderate volatility of 0.00254 combined with the preceding pullback on October 30th suggests that further consolidation or a short-term correction, albeit within the context of an upward trend, is a roughly even chance in the very near term as the market potentially digests the recent gains. A reversal of the current trend appears unlikely unless the ratio breaks significantly below the average of 3.0644, which would require a notable shift from the established upward momentum.
Here is a technical analysis of the XLY/XLP ratio data for the past 90 days.
The XLY/XLP ratio has exhibited a strong upward trend over the observed 90-day period, registering an impressive appreciation of approximately 18.46%. This robust bullish momentum is clearly visible in the ratio’s consistent climb from its starting point of 2.655 on June 25th to its current value of 3.145 on October 31st. Importantly, the ratio concluded the period at its highest point, indicating that demand for Consumer Discretionary (XLY) relative to Consumer Staples (XLP) was at its peak within this observation window. This suggests a highly likely continuation of the established bullish sentiment in the immediate short term, as the ratio is currently in an active breakout phase, having surpassed all prior highs within the provided timeframe. The consistent formation of generally higher highs and higher lows throughout the period underscores the strength and sustainability of this upward trajectory.
A deeper dive into the price action reveals a sustained pattern of bullish momentum. Following an initial phase of relative consolidation in late June and early July, the ratio commenced forming a clear sequence of higher highs and higher lows. A notable event was the initial breach of the 2.80 level in late July, which, after a subsequent minor pullback to approximately 2.69 in early August, appeared to establish itself as a developing support zone. The ratio then experienced an acceleration of gains throughout August and September, successfully breaking above the psychological 3.00 threshold in mid-September. Minor pullbacks, such as the one observed on October 10th, where the ratio dipped to 2.92 from a preceding local high of 3.097, highlight that buying interest quickly re-emerged, supporting the underlying upward movement. The current position at the 90-day high of 3.145 suggests a likely continuation of this strong upward momentum, as there is no apparent overhead resistance based on the provided dataset.
Considering the strong close at the absolute period high, it is likely that the XLY/XLP ratio will attempt to extend its gains further in the very near term. The sustained demand for XLY relative to XLP, coupled with the absence of any discernible overhead resistance within this specific dataset, suggests that the path of least resistance remains skewed to the upside. However, it is also a roughly even chance that the ratio could experience a modest retracement or a period of sideways consolidation in the immediate future, a typical market behavior after reaching new highs as traders may elect to take profits. Historical patterns within this dataset, such as the pullbacks observed in early August and early October following previous peaks, lend credence to this alternative scenario. Traders are advised to monitor for potential support retests around recently established resistance-turned-support levels, such as the 3.00-3.05 range. A significant break below these levels, while currently unlikely given the overall trend strength, would necessitate a re-evaluation of the prevailing bullish outlook.
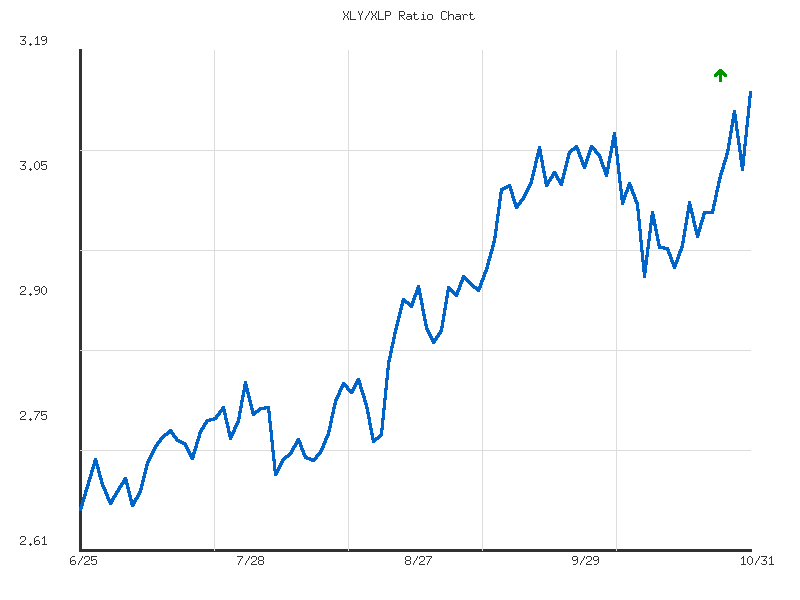
Ratio Analysis: XLY/XLP
Generated for 90days timeframe analysis
Equity Breadth
The percentage of S&P 500 members trading above their 50-day moving average (SPXA50R) displayed a notable shift over the past seven days. From October 23rd to October 27th, this breadth indicator demonstrated a clear upward trajectory, rising from 52.49% to a peak of 58.08%. This suggested a strengthening in short-to-medium term market participation, indicating that an increasing number of constituents were experiencing positive momentum. However, this bullish momentum proved ephemeral. From October 28th to October 30th, SPXA50R experienced a precipitous decline, dropping sharply from 48.50% to a low of 40.51%. This rapid deterioration in breadth is highly likely to reflect a broad-based erosion of short-term strength across the index, potentially signaling increasing bearish sentiment or profit-taking activities.
The drop of SPXA50R below the 50% threshold on October 28th, followed by further declines, indicates that a majority of S&P 500 stocks were trading below their 50-day moving averages, a characteristic typically associated with weakening market health. While the indicator saw a modest rebound to 42.11% on October 31st, this recovery is relatively weak compared to the preceding decline. Considering the scale of the preceding sell-off, it is likely that this minor uptick represents a technical bounce rather than a definitive reversal of the recent bearish momentum. Sustained upside from this level would require a more significant proportion of stocks to regain positive short-term momentum.
Concurrently, the percentage of S&P 500 members above their 200-day moving average (SPXA200R), a longer-term breadth gauge, also experienced significant volatility. Between October 23rd and October 27th, SPXA200R remained relatively robust, hovering around 61%, indicating that a substantial majority of the S&P 500 components maintained a positive long-term trend. This level typically suggests underlying strength in the broader market’s foundational trend. However, similar to the shorter-term indicator, SPXA200R underwent a sharp contraction starting October 28th, dropping from 57.08% to 49.90% by October 29th. This breach of the 50% mark is likely to be a significant technical development, implying that for the first time in this observed period, less than half of the index members were in a long-term uptrend.
The subsequent two days saw SPXA200R recover marginally, rising to 50.29% and then 51.09% by October 31st. This recovery, while modest, is significant enough to place the indicator back above the 50% threshold, suggesting that the long-term trend for slightly more than half of the S&P 500 constituents remains positive. However, it is unlikely that this minor rebound negates the prior sharp decline entirely. The synchronized nature of the declines in both SPXA50R and SPXA200R from October 28th to October 29th strongly indicates a broad-based deterioration in market breadth, affecting both short-term momentum and longer-term structural health. While the slight recovery in both indicators on October 30th and 31st offers a roughly even chance of short-term stabilization, the overall pattern suggests a market encountering increasing headwinds, especially given that both indicators ended the period significantly below their initial levels.
SPY Daily
The long-term technical picture for SPY over the past 90 days indicates a dominant bullish trend. Price is consistently trading well above both the upward-sloping 50-day and 200-day Exponential Moving Averages (EMAs), with the 50-day EMA maintaining a strong position above the 200-day EMA. This configuration typically signals robust underlying strength. Over the past seven trading days, SPY exhibited significant upward momentum, rallying from approximately 671.76 on October 23rd to a recent high of 687.39 on October 29th. This sustained advance pushed the 14-day Relative Strength Index (RSI) into the high 60s, approaching overbought conditions. However, a notable pullback occurred on October 30th, with price declining from an open of 688.72 to close at 679.83 on elevated volume (approximately 75.5 million shares), suggesting profit-taking or a temporary exhaustion of buying pressure.
The most recent trading day, October 31st, saw SPY open at 685.04, test initial resistance near its high of 685.08, then decline to a low of 679.24 before recovering to close at 682.06. This price action formed a candle with a notable lower wick, indicating buying interest emerged at lower levels following the previous day’s decline. Volume remained elevated (approximately 86.2 million shares). The RSI, having retreated from near 70 to 59.95 on October 30th, saw a modest rebound to 61.66, suggesting a slight recovery in immediate momentum. Based on recent price action, an immediate resistance level is observed in the 687-689 range, representing the recent highs from October 28th and 29th. The 679-680 area provided support during the October 31st session. More broadly, the rising 50-day EMA, currently around 661.70, is a likely dynamic support level. The low established after the significant drop on October 10th, around 653.02, also functions as a stronger support zone.
Looking ahead, a likely scenario is that the current upward trend will reassert itself. A sustained break above the 687-689 resistance zone, particularly on increasing volume, would indicate continued strength and could lead to new all-time highs. The rebound on October 31st and the non-overbought RSI provide room for such a move. Conversely, a roughly even chance exists for a deeper retracement. Should SPY fail to decisively break above the 687-689 resistance and instead break below the October 30th low of 679.83, it would likely target the 50-day EMA around 661.70. A decisive break below the 50-day EMA, especially accompanied by heavy selling volume, would be a strong indication of a bearish shift, potentially bringing the 653.02 support into play. A period of consolidation is also a roughly even chance, where SPY could trade horizontally between the recent high resistance (687-689) and the 50-day EMA (around 662) for several sessions, allowing indicators to reset further.
The consistent positioning of price above both the 50-day and 200-day EMAs, with both moving averages trending upward, indicates a prevailing bullish market sentiment over the medium to long term. The quick absorption of selling pressure evident on October 31st after the prior day’s decline suggests that buyers remain active on dips. However, the sharp, high-volume pullback on October 30th, particularly from the overbought RSI levels, points to an underlying sensitivity to high valuations and a willingness among some participants to take profits, indicating a degree of cautious optimism rather than unbridled enthusiasm. The technical data alone does not allow for speculation on external fundamental drivers.
SPY Technical Analysis: End of October 2025 Outlook
SPY has demonstrated a predominantly upward trend over the past 90 days, starting around in late June and advancing to approximately by the end of October. This sustained climb is characterized by a series of higher highs and higher lows, affirming a bullish market structure. Key price levels include the late July resistance around -, which subsequently transformed into a support zone after being breached. More recently, the - area provided temporary consolidation before the robust late-October rally pushed SPY to new highs, with the most recent daily close at .06, slightly below the intraday peak of .905. This consistent upward trajectory indicates strong underlying demand throughout the period.
Volume analysis reveals notable activity during critical price movements. The initial bullish advance from late June through late July was accompanied by generally increasing volume, which often reinforces trend strength. However, the period also saw two distinct, sharp pullbacks on exceptionally high volume: one on August 1st, where SPY dropped over ten points on 140 million shares, and another on October 10th, witnessing a nearly 18-point decline on 156 million shares. These high-volume reversals suggest aggressive profit-taking or significant supply entering the market. Nevertheless, in both instances, SPY quickly recovered and resumed its upward trajectory, indicating that these dips were met with robust buying interest, absorbing the selling pressure and maintaining the overall bullish trend.
The 14-day Relative Strength Index (RSI) has broadly corroborated the price action. From late June to late July, RSI consistently resided in overbought territory (above 70), peaking near 75.59, which reflected the strong bullish momentum. Both major price corrections—August 1st and October 10th—were confirmed by significant drops in RSI, moving it out of overbought conditions into more neutral territory (dropping to 47.66 and 41.81 respectively). Following these pullbacks, RSI generally recovered, often returning to the 60s and briefly re-entering overbought levels in mid-September and early October. The most recent RSI reading of 61.66 suggests that while bullish momentum is present, SPY is not currently in an overbought condition, leaving room for potential further appreciation. No significant bearish divergence has been observed across the major price peaks.
Considering the technical data, the overall posture for SPY is likely to remain bullish in the near term. The establishment of new highs in late October, followed by a minor retreat and subsequent rebound, suggests that the market has a reasonable likelihood of challenging and potentially surpassing the recent peak of .905. The current RSI reading further supports this outlook, as it is not signaling excessive overbought conditions that typically precede an immediate correction. A successful breach of the .905 level would highly likely extend the prevailing uptrend. Conversely, should SPY fail to advance beyond this recent high and instead break below the most recent swing low of .83, there is roughly an even chance that a more significant pullback could develop. In such a scenario, the primary support level to monitor would be the - region, established by the October 10th low and subsequent recovery. A decisive break below this level, particularly on elevated volume, would make a deeper correction highly likely. It is important to note that analysis of the MACD indicator was not possible as the data was not provided for this assessment.