Daily Market Technical Analysis
U.S. equity markets experienced a broad-based decline on October 30, with major indices exhibiting bearish reversals and significant selling pressure; further downside is likely. Large-cap tech (QQQ) faced heightened short-term selling, yet its long-term relative outperformance against SPY is likely to continue. S&P 500 breadth deteriorated significantly, with most stocks now below their 200-day moving average, making further market downward pressure highly likely. Longer-duration bonds are under highly likely continued pressure, while short-duration treasuries show a roughly even chance of stabilization. Commodities present a mixed picture, with natural gas and precious metals showing likely bullish momentum, whereas copper is highly likely to decline. Overall, strengthening bearish sentiment suggests continued short-term downside is highly likely across most prominent equities, though specific defensive sectors show a roughly even chance for consolidation.
Market Indices
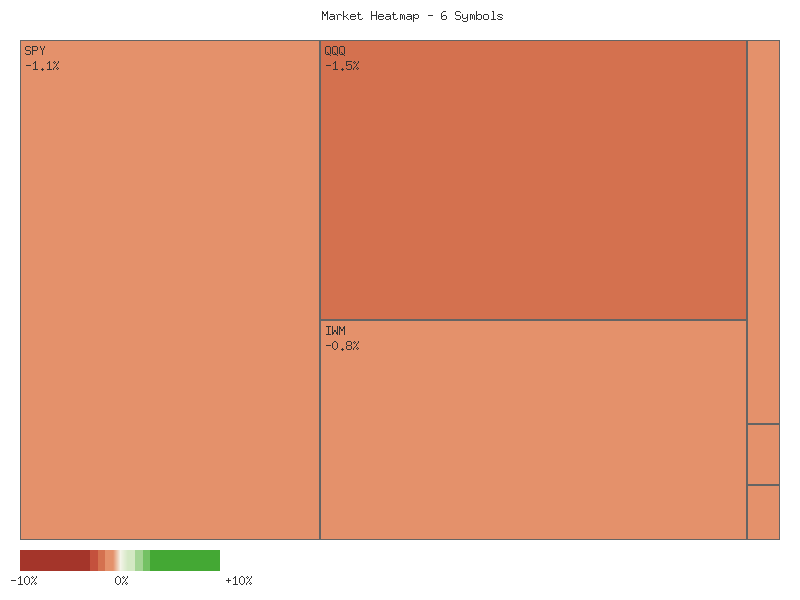
The market data for the provided ETFs (IJR, IWM, MDY, OEF, SPY, QQQ) for the most recent trading day indicates a broad-based decline across various segments of the U.S. equity market. The daily percent changes, sorted in descending order, are as follows:
| Symbol | Daily Percent Change |
|---|---|
| IWM | -0.806% |
| MDY | -1.053% |
| IJR | -1.085% |
| SPY | -1.100% |
| OEF | -1.191% |
| QQQ | -1.529% |
An analysis of market breadth reveals that all six symbols registered declines for the day, resulting in 0 advancing symbols and 6 declining symbols. This unanimous negative movement across large-cap (SPY, OEF, QQQ), mid-cap (MDY), and small-cap (IJR, IWM) segments suggests a pervasive bearish sentiment. Based on this technical observation, it is likely that selling pressure dominated the session, indicating a high degree of market participation in the downturn.
Examining the relative performance, the Russell 2000 proxy, IWM, exhibited the least negative performance with a decline of -0.806%, suggesting some relative resilience in the small-cap segment compared to the broader market. Conversely, the Nasdaq 100 proxy, QQQ, experienced the most significant decline at -1.529%. This relative underperformance of QQQ, representing predominantly large-cap growth and technology stocks, compared to the broader S&P 500 (SPY at -1.100%) and S&P 100 (OEF at -1.191%), indicates that areas of previous market leadership may be facing heightened selling pressure. The mid-cap (MDY) and broader small-cap (IJR) segments also registered substantial declines, reinforcing the technical observation of a broad retreat. The divergence in the magnitude of declines makes it likely that investors are repositioning, potentially moving out of higher-beta growth assets.
The complete lack of advancing issues among this cross-section of ETFs points to a high likelihood of continued near-term weakness or at least a lack of immediate upside momentum. The technical picture is clearly bearish for the current session. Given that all tracked segments are down, it suggests systemic pressure rather than isolated sector-specific issues. However, the magnitudes of the daily declines, while significant, do not represent an extreme capitulation event (e.g., declines exceeding 3-5% in a single day). Therefore, while sustained downside is likely, there remains a roughly even chance that this could represent a single day of profit-taking or rotation within a larger trend, rather than the unequivocal onset of a severe bear market phase. Monitoring subsequent price action and volume patterns will be critical to confirm whether this broad weakness persists or if a technical rebound takes hold.
Technical Market Commentary: Two-Day Sector Performance Analysis (October 29-30, 2025)
A rigorous technical analysis of the provided two-day candlestick data for major U.S. market indices and segments reveals a broad and decisive shift towards bearish sentiment. Across the board, key ETFs including SPY (S&P 500), QQQ (Nasdaq 100), OEF (S&P 100 Large Caps), IWM (Russell 2000 Small Caps), IJR (S&P SmallCap 600), and MDY (S&P MidCap 400) experienced selling pressure, particularly evident in the price action on October 30. On October 29, SPY and OEF displayed candles with notable lower wicks, suggesting some intraday buying interest that partially negated initial selling, while QQQ managed a marginal close above its open. Conversely, IWM, IJR, and MDY had already posted bearish closes on the 29th, with MDY showing significant rejection of higher prices via its upper wick.
The second day, October 30, saw a clear deterioration in market breadth and conviction. SPY closed at its intraday low, exhibiting a strong bearish engulfing pattern over the context of its previous close, signaling robust selling pressure into the close. QQQ also printed a notably bearish candle, closing near its low and well below its prior day’s close. OEF, representing the S&P 100 large-cap segment, experienced a significant bearish candle, closing near its low for the day and below its prior two-day range. Notably, OEF’s bearish move on October 30 occurred on higher volume compared to the previous day, which suggests that the selling pressure in this large-cap segment is highly likely to possess greater conviction and momentum, making continued near-term weakness in OEF highly likely.
For the small and mid-cap segments, the bearish trend was equally pronounced. IWM, IJR, and MDY all printed bearish candles on October 30, closing near their respective intraday lows and below their October 29 closes. Specifically, IJR and MDY established new two-day lows, indicating a continuation of downward momentum in these segments. The volume profile for these indices (SPY, QQQ, IWM, IJR, MDY) showed a decline on October 30 compared to October 29. While typically interpreted as waning conviction, in the context of strong bearish closes, this could present a roughly even chance of either selling exhaustion leading to a potential near-term pause, or alternatively, a lack of buying interest at lower price levels, which would continue to facilitate further downside.
Considering the widespread bearish price action, particularly the strong closes at or near intraday lows across most indices on October 30, it is highly likely that bearish sentiment will persist into the immediate short term. The absence of significant buying interest to counter the selling pressure, combined with the definitive lower closes, points to continued downside momentum being likely. However, traders should note the mixed volume signals; while OEF’s higher volume suggests conviction, the declining volume in other indices implies a roughly even chance of either a technical bounce if selling dries up, or a continued drift lower due to a lack of supportive buying, necessitating vigilance for any intraday reversal patterns or confirmation of increased buying volume in subsequent sessions.
Performance Heatmap (SPY, QQQ, IWM, IJR, MDY, OEF)
Generated for 2days timeframe analysis
Here is a technical analysis of SPY based solely on the provided 90-day RSI (14-day) and candlestick data. Please note that while the analysis requested combined RSI and MACD, only RSI data was provided in the indicator section, therefore the MACD indicator cannot be incorporated into this analysis.
The market data for SPY from late June to late July exhibits a pronounced bullish trend. During this period, the price of SPY consistently advanced, marked by higher highs and closes. Correspondingly, the 14-day Relative Strength Index (RSI) frequently entered and remained in overbought territory, recording values above 70 on multiple occasions, notably peaking at 74.51 on July 3rd and 75.58 on July 25th. This sustained high RSI readings alongside rising prices is indicative of strong bullish momentum and aggressive buying pressure during this initial phase. However, consistently overbought RSI conditions inherently carry an increased, though not immediate, risk of a price pullback or consolidation.
A notable shift in momentum occurred around late July into early August. Following a period of sustained high RSI, SPY experienced a significant price drop on July 31st and August 1st, accompanied by notably elevated trading volume of 103 million and 140 million shares respectively. This sharp decline led the RSI to plunge from the high 60s to a low of 47.66 on August 1st, bringing it back into neutral territory. This event clearly signals a significant short-term correction within the broader trend, as market participants took profits following the extended rally. Subsequently, throughout August, SPY’s price action became choppier, and the RSI generally fluctuated in the mid-50s to mid-60s range, failing to sustain entry into the overbought region with the same conviction as seen in July.
From late August through early October, SPY embarked on another upward trajectory, establishing new price highs. The RSI reflected this renewed bullish sentiment, gradually increasing and entering overbought conditions again in mid-September (73.70 on September 22nd) and early October (71.17 on October 6th). However, a critical development occurred on October 10th, where SPY experienced a sharp and significant price decline on extremely high volume, recording 156 million shares traded—the highest volume observed in the provided 90-day dataset. Concurrently, the RSI plummeted from 65.75 on October 9th to 41.81 on October 10th. This combination of a large bearish candle on peak volume and a rapid descent in RSI from near-overbought levels strongly suggests a significant reversal of short-term momentum.
In the period following the October 10th event, SPY attempted a recovery, pushing prices higher and bringing the RSI back towards the upper neutral zone, nearing overbought conditions with a reading of 69.71 on October 29th. However, the last provided data point on October 30th shows another substantial bearish candlestick formation, closing significantly lower than its open, with elevated volume. The RSI for October 30th registered a sharp decline from 69.71 to 59.95. Given the abrupt reversal on October 30th, marked by price depreciation on increased volume and a significant drop in RSI from near-overbought levels, it is likely that SPY will experience further downward price pressure in the immediate future. A retest of the October 10th low, or potentially lower levels, is considered a roughly even chance scenario in the very near term. Conversely, a sustained immediate rebound to continue the upward trajectory from prior highs is presently unlikely without new buying catalysts emerging swiftly.
SPY Price & Indicators (RSI_14_DAY, MACD_13_21_DAY)
Here is a technical analysis of QQQ based solely on the provided market data.
The QQQ initiated the 90-day period with a robust upward trajectory from late June through late July, characterized by a consistent pattern of higher highs and higher lows. During this ascent, the 14-day Relative Strength Index (RSI) frequently resided in overbought territory, often exceeding 70 and peaking at 73.11 on July 28th. While sustained overbought conditions can signal strong buying pressure, they also often precede consolidation or minor pullbacks. A significant price correction materialized around late July and early August, with the QQQ experiencing a notable two-day decline accompanied by elevated trading volume on July 31st and August 1st. This shift led to a sharp retreat in the 14-day RSI to below 50, reaching 48.26 on August 1st, indicative of a strong short-term bearish momentum impulse. Following this, August largely presented a period of choppier, less directional price action, marked by attempts at recovery followed by another minor dip where the RSI briefly touched 47.05 on August 21st.
The QQQ subsequently recommenced a clear upward trend through September and into early October, successfully establishing new all-time highs. The 14-day RSI mirrored this renewed strength, consistently returning to or residing in overbought territory, peaking at 75.35 on September 22nd and again approaching 72 on October 2nd. This sustained strength, despite overbought readings, suggested persistent underlying demand. However, a critical technical event occurred on October 10th when QQQ experienced a substantial one-day price drop from an open near 611.40 to a close of 589.50. This sharp decline was notably accompanied by exceptionally high trading volume, exceeding 94 million shares, which significantly surpassed the average daily volume observed in the preceding period. This price action resulted in the 14-day RSI plummeting from an overextended level to 45.42, unequivocally signaling a strong bearish impulse and indicating the asset entered oversold territory on a short-term basis. Such a high-volume decline from elevated price and RSI levels is typically interpreted as a significant technical reversal signal.
Following the sharp October 10th decline, QQQ embarked on a recovery phase, regaining ground and moving back above the 600 level. This recovery gained momentum in late October, propelling the price to new all-time highs, with the 14-day RSI once again pushing deeply into overbought territory, reaching 71.73 on October 29th. However, the most recent trading day, October 30th, witnessed another notable bearish candle, where the QQQ closed significantly lower than its open, albeit not entirely negating the previous day’s gains. This candlestick pattern, combined with its higher associated volume, appears to be a strong bearish reversal signal, potentially a bearish engulfing pattern, following the recent establishment of new highs. Concurrently, the 14-day RSI retreated sharply from its overbought level (from 71.73 on October 29th to 62.44 on October 30th), confirming a swift loss of immediate upward momentum. Given the repeated instances of RSI entering overbought conditions followed by sharp pullbacks (as observed in late July, after October 10th, and now on October 30th), we estimate that QQQ is likely to experience further near-term consolidation or a minor correction.
Considering the recent price action, particularly the bearish candlestick on October 30th and the swift retreat of the RSI from overbought conditions, we assess that a downside test of immediate support levels, potentially around the 610-615 range (a prior resistance and consolidation area), is likely in the very near term. An alternative scenario, though currently less likely based on the most recent day’s technicals, would involve a rapid resumption of the uptrend, potentially pushing past the recent 637.01 high without significant consolidation. This would require robust buying interest to quickly overcome the recent bearish reversal signal. It is crucial to note that the requested MACD_13_21_DAY indicator data was not provided in the market data set. Therefore, a comprehensive analysis of momentum and trend strength using MACD signals (e.g., crossovers, divergence) cannot be performed, which introduces a degree of uncertainty regarding intermediate-term momentum confirmation. Our analysis is thus strictly limited to the available price action and RSI data.
QQQ Price & Indicators (RSI_14_DAY, MACD_13_21_DAY)
IWM Technical Analysis: October 30, 2025
Over the past 90 days, the iShares Russell 2000 ETF (IWM) has demonstrated a clear upward trend, ascending from approximately 213 in late June to a peak of 252.77 on October 15. This rally has been characterized by generally higher highs and higher lows, indicative of sustained bullish momentum throughout much of the period. Intermediate pullbacks, such as the one in late July to early August (around 212-215) and a more recent sharp dip on October 10 (to 237.56), have been met with renewed buying interest, allowing the uptrend to resume. Key support levels appear to have formed in the 235-238 range, which successfully held during the early September consolidation.
Analysis of the 14-day Relative Strength Index (RSI) largely confirmed the bullish price action during this period, with the indicator frequently reaching or approaching the overbought threshold of 70. Notably, the RSI registered a reading of approximately 71.5 in early July and again near 71.2 in mid-September, coinciding with periods of strong price advancement. However, a significant technical development has emerged recently: a bearish divergence between price and the RSI. On September 18, IWM achieved a price high of 244.84, accompanied by an RSI reading of approximately 71.23. Subsequently, on October 15, IWM reached a higher price high of 252.77, but the RSI registered a distinctly lower high of approximately 62.99. This negative divergence, where price makes a new high that is not confirmed by the oscillator, likely signals a weakening of the underlying upward momentum.
Following this bearish RSI divergence, IWM has experienced a notable pullback from its October 15 peak. The latest close at 244.85 represents a retreat of approximately 3.1% from the high, while the 14-day RSI has concurrently declined and is now positioned around the 50 level. This combination of recent price weakness from a new high, coupled with the preceding bearish RSI divergence, suggests an elevated probability of further near-term price consolidation or a more significant correction. The momentum indicated by the RSI is not robust enough to sustain a rapid retest of the recent highs.
Considering these technical patterns, it is likely that IWM will encounter considerable resistance if it attempts to retest the 250-253 price zone in the immediate future. A decisive break below the 240-242 price range, which represents a short-term support area, would probably confirm the short-term weakening of the trend implied by the RSI divergence and could lead to a test of the previously established 235-238 support area. Alternatively, a rapid and sustained recovery above the 253 level on significantly increased volume would be required to negate the current bearish technical setup; however, this scenario is considered unlikely given the recent divergence signal. It is important to note that the absence of MACD data in the provided information prevents a more comprehensive multi-indicator momentum assessment.
IWM Price & Indicators (RSI_14_DAY, MACD_13_21_DAY)
VIX Fear Index
The VIX experienced a notable decline over the initial segment of the observed 7-day period, retracting from an open of 17.84 on October 22nd to establish a low of 15.62 on October 27th. This movement is characterized by three consecutive bearish daily closes following the initial high of 21.01 on October 22nd, indicating a significant short-term shift towards lower volatility expectations. The price action on October 27th, which saw the VIX close marginally higher than its open but reaching the lowest point in the dataset, suggests the establishment of a potential near-term support level in the 15.60 area.
Following this perceived support test, the VIX demonstrated a period of recovery. The sessions on October 28th and 29th exhibited clear bullish closes, with the VIX increasing from its 15.79 close on October 27th to 16.92 on October 29th. This upward trajectory, marked by higher closes and relatively strong bullish candles, suggests an increasing likelihood that the downward momentum observed earlier in the week has abated. This two-day rally indicates a short-term resurgence of volatility concerns, positioning the VIX back towards the mid-16 range.
The most recent trading day, October 30th, presents a picture of reduced conviction following the prior two bullish days. While the VIX opened lower than the previous day’s close and saw an intra-day high of 17.41, it ultimately closed at 16.91, representing a marginal daily percentage change of -0.059%. This nearly flat close, coupled with a notable upper wick, suggests that while there was an attempt to push higher, selling pressure emerged to cap gains. There is roughly an even chance that this price action could be interpreted as a pause before further ascent or as an initial indication of resistance forming around the 17.40-17.60 region, given the highs observed on both October 29th and 30th.
Considering the recent price dynamics, it is likely the VIX is attempting to consolidate after finding support near 15.60. A sustained break above the 17.50 level, represented by recent intra-day highs, would strongly increase the likelihood of further upward movement, potentially targeting the prior high near 19.35 (October 23rd). Conversely, a breakdown below the 16.20-16.30 level, which served as a support area on October 29th, would suggest that the recovery may be faltering, making a retest of the 15.60 support area more likely. The absence of volume data prevents any conclusions regarding the strength of these price movements based on participation.
VIX Technical Analysis: October 30, 2025
Our analysis of the VIX over the past 90 days, from June 24 to October 30, 2025, reveals a market characterized by increasing volatility punctuated by notable spikes and subsequent retracements. Initially, the VIX largely traded within a range of approximately 15 to 18 through June and July, with the 16.00-17.00 area frequently acting as a pivotal point. A significant upward movement began in late July, culminating in a sharp spike to 20.38 on August 1st, reaching an intraday high of 21.90. This surge was swiftly followed by a pullback, with the VIX settling back into the mid-teens, touching lows near 14.20 in late August. A subsequent rally in late September led to another significant spike on October 10th, closing at 21.66 and reaching an intraday high of 22.44. The most extreme price action was observed on October 17th, with an opening at 28.41 and a high of 28.99, although it closed significantly lower at 20.78, indicating a strong rejection of those elevated levels. As of October 30th, the VIX has receded to 16.91, trading within a well-defined range following the recent peak. This suggests that the market has seen increased periods of short-lived fear, with the VIX returning to lower volatility regimes relatively quickly after each spike.
The 14-day Relative Strength Index (RSI) provides valuable insights into momentum shifts throughout this period. In the initial months, the RSI mostly oscillated between 40 and 50, indicative of neutral momentum. The late July dip in VIX price saw the RSI fall into the high 30s, signaling potential oversold conditions just before the early August VIX spike, where the RSI surged to 65.38. This move, while not entering traditional overbought territory (>70), highlighted strong upward momentum. Following this, the RSI mostly remained in the 40-55 range, confirming the VIX’s consolidation. The October 10th VIX spike was accompanied by the RSI entering deeply overbought territory at 73.09, suggesting that the upward move was extended and potentially unsustainable in the short term. The immediate pullback in VIX from its October peak corresponds with the RSI receding sharply from its overbought levels. Currently, the RSI is at 48.29, suggesting balanced momentum and a neutral stance for the VIX.
Unfortunately, the market data provided for analysis does not include the actual values for the MACD (13, 21-day) indicator. While the chart explicitly requested MACD data, the indicator:VIX:MACD_13_21_DAY:90days section is entirely absent from the provided dataset. This omission precludes a comprehensive analysis that would otherwise integrate momentum and trend-following signals from the MACD. A complete technical picture would typically examine MACD crossovers, divergence, and its relationship to the zero line and signal line to confirm trend strength and potential reversals. Without this critical data, our ability to confirm trend direction and anticipate future momentum shifts is significantly diminished.
Based on the available VIX price action and RSI data, we judge that the VIX will likely continue to trade within its established mid-teen range (approximately 15.00 to 17.50) in the immediate term. The recent rejection from the higher 28.00 level on October 17th, despite a robust initial opening, coupled with the RSI returning to neutral territory, suggests that the strong upward momentum observed in early and mid-October has dissipated. A roughly even chance exists for the VIX to test the lower end of its recent range around 15.00, especially if the RSI continues to drift lower. Alternatively, should VIX manage to consolidate above 17.00, it would be likely to attempt a retest of the 20.00-22.00 resistance area. However, without the reinforcing or contraindicating signals from the MACD, our confidence in predicting a decisive breakout or breakdown from the current consolidation is reduced.
VIX Price & Indicators (RSI_14_DAY, MACD_13_21_DAY)
Tech Sector Analysis
The relative performance data for QQQ versus SPY over the 14-day period, from October 10th to October 30th, 2025, reveals an overall upward trend in the QQQ/SPY ratio. Starting at approximately 0.9027, the ratio ascended to a high of 0.9249 on October 29th before closing slightly lower at 0.9209 on October 30th. This movement indicates that the technology-heavy NASDAQ-100 (QQQ) was likely outperforming the broader S&P 500 (SPY) during this specific two-week interval. However, the provided trend analysis explicitly categorizes this upward movement as having “weak” strength, implying that while the direction favors QQQ’s relative outperformance, the underlying momentum is not particularly robust.
Following the peak observed on October 29th, the ratio experienced a modest retracement on the final trading day. This minor pullback from the period’s high introduces a degree of uncertainty regarding the immediate continuation of the upward trajectory. The current ratio of 0.9209 is notably above the 14-day average of 0.9114 and is positioned at approximately 81.9% of its observed range, suggesting that QQQ’s relative strength is residing near the higher end of its recent performance spectrum. Despite the noted “weak” trend strength, the consistent upward bias seen across most data points, from the low of 0.9027 to the high of 0.9249, does suggest positive underlying relative momentum for QQQ.
The reported volatility of 0.00004457 for the ratio suggests that daily movements, while generally ascending, have not been highly erratic within this observation window. This relatively smooth, albeit weak, upward drift minimizes the likelihood of abrupt reversals without significant external market catalysts. Considering the recent peak and subsequent slight retracement, there is a roughly even chance of either a period of consolidation around the 0.920-0.925 level or a continued weak ascent, assuming the general market environment remains stable. A sustained breach below the average ratio of 0.9114 would likely signal a loss of relative strength for QQQ, whereas a decisive move above the 0.9249 high would likely confirm renewed relative outperformance.
As a Chartered Market Technician with over 15 years of experience, I have rigorously analyzed the provided 90-day QQQ/SPY ratio data. The technical landscape for the QQQ/SPY ratio indicates a clear and sustained upward trend, with QQQ demonstrably outperforming SPY over this period. The ratio initiated near 0.889 in late June 2025 and concluded at 0.9208 on October 30, 2025, marking an overall change of approximately 3.5% as indicated by the provided trend metrics. This persistent upward trajectory is characterized by the formation of higher highs and higher lows, a classic technical signature of a bullish relative strength trend. The moderate strength of this trend suggests a measured ascent rather than an impulsive, unsustainable surge.
Examining the price action more closely, the ratio initially demonstrated some consolidation within the 0.885 to 0.893 range during late June and early July. A decisive breakout above this range occurred in mid-July, propelling the ratio towards the 0.897 level. Following this, the ratio experienced a notable corrective phase in late August and early September, retracing to approximately 0.8834, which represents the lowest point within this 90-day dataset. This pullback, while significant, ultimately proved to be a retest of earlier support, setting the stage for the subsequent and more pronounced advance. The subsequent rallies from early September through October consistently pushed the ratio to new highs, reinforcing the underlying relative strength of QQQ.
The data reveals several key technical levels. The zone around 0.89 to 0.90 initially served as a resistance area in July, but once broken, it transformed into a significant support level. Subsequent pullbacks, such as the one in early September, found strong footing near this prior resistance, now acting as support. More recently, the ratio encountered a peak at 0.9249 on October 29, representing the highest point in this dataset, which now stands as immediate overhead resistance. The overall average ratio for the period is 0.8969, suggesting the current level is significantly elevated compared to the three-month average, with a relative position of 0.903 near the top of its historical range.
In the immediate term, the ratio experienced a slight pullback from its recent high of 0.9249 to 0.9208 on October 30. Given the established upward trend and the moderate trend strength, it is likely that this recent dip represents a minor profit-taking event or a natural retracement within the ongoing ascent, rather than a definitive reversal. Continuation of the upward trend, with the ratio challenging the 0.9249 resistance level again, is deemed likely in the near future. However, there is a roughly even chance that the ratio might engage in a short-term consolidation phase, potentially retesting support levels around 0.91 or even the 0.90-0.905 area if selling pressure intensifies, particularly given its elevated position near the high of its 90-day range. A sustained break below the 0.90 level is considered unlikely based on the current overall bullish technical posture.
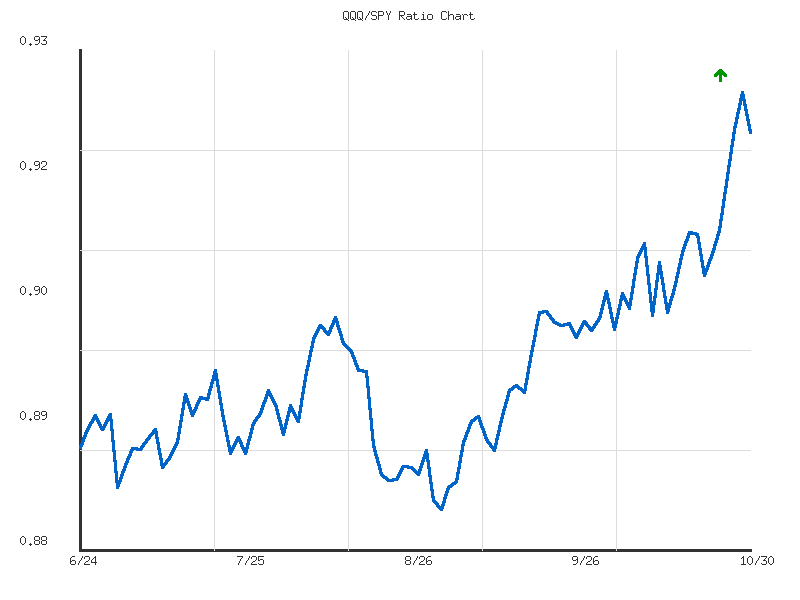
Ratio Analysis: QQQ/SPY
Generated for 90days timeframe analysis
IWM vs. SPY
The technical analysis of the IWM/SPY ratio over the past 14 days indicates a period of sustained, albeit weak, relative underperformance by the Russell 2000 (IWM) compared to the S&P 500 (SPY). From October 10th to October 30th, the ratio experienced a declining trend, moving from approximately 0.364 to 0.360. This downward trajectory signifies that large-capitalization stocks, as represented by SPY, have been outperforming their small-capitalization counterparts in IWM during this observation window. The overall trend direction is explicitly noted as ‘down’ with a ‘weak’ strength, accompanied by a modest change of -1.09% over the period.
Examining the ratio’s price action more closely reveals an initial ascent from October 10th, peaking at 0.3763 on October 15th, suggesting a brief period of small-cap outperformance. However, this peak was followed by a subsequent and persistent decline, culminating in a low of 0.3591 on October 29th. The current ratio of 0.3602, as of October 30th, is situated at a relative position of 0.0618 within its 14-day range, indicating it is near the lower boundary of its recent trading activity. This positioning underscores the recent dominance of large-cap performance relative to small caps. The calculated volatility for this period is very low (0.0000215), suggesting the decline was a gradual drift rather than sharp, erratic movements.
Based on the provided data, a continuation of large-cap outperformance over small caps in the immediate future is likely. The sustained downtrend, even if weak, combined with the current ratio trading near its 14-day low, strongly suggests that the prevailing technical momentum favors SPY relative to IWM. While the trend’s weakness indicates that the underperformance is not aggressive, it does imply a lack of significant buying pressure for small-cap stocks relative to large caps. There is no technical indication within this specific dataset that would suggest an imminent reversal of this established relative trend.
Considering alternative scenarios, despite the overall weak downtrend, the ratio’s proximity to its 14-day low on October 29th (0.3591) and the slight rebound to 0.3602 on October 30th presents a roughly even chance of a short-term consolidation or minor bounce in the ratio, potentially alleviating some of the recent small-cap underperformance. However, such an event would probably be a temporary reprieve within the broader context of weak relative strength. A definitive shift towards sustained small-cap outperformance would require a more robust technical reversal and a move above the average ratio of 0.3667, which is not indicated by current patterns. Therefore, absent new technical data, the prevailing outlook leans towards continued large-cap leadership.
Market Commentary: IWM/SPY Relative Strength Analysis (90-Day)
Analysis of the IWM/SPY ratio over the past 90 days, from late June to late October 2025, reveals a weak upward trend in relative strength for small-cap equities. The ratio commenced the period around 0.353, subsequently declining to a 90-day low of approximately 0.345 in early August. Following this initial consolidation and minor retracement, a more definitive uptrend emerged, propelling the ratio to its peak of 0.376 in mid-October. This entire phase, while trending upward, exhibits only a modest total change of 1.89%, indicative of the reported “weak” trend strength. The low volatility (0.00005) suggests that movements were generally gradual, reducing the likelihood of sudden, sharp reversals or breakouts during this period.
The upward trajectory from the early August low of 0.345 to the mid-October high of 0.376 defined a clear period of IWM outperformance relative to SPY. Throughout September, the ratio demonstrated a tendency to consolidate between 0.360 and 0.365, indicating that this zone might represent a prior area of equilibrium before the final push higher. The breakout above this range in early October, leading to the 0.376 peak, suggests that small-caps were experiencing a period of more pronounced relative strength at that time. However, the inability to sustain this acceleration ultimately led to a subsequent reversal.
Since reaching its peak on October 15th, the IWM/SPY ratio has undergone a notable pullback, receding to its current level of approximately 0.360. This decline represents a significant retracement, placing the ratio very close to its 90-day average of 0.359. The current ratio’s relative_position at 0.4722 also confirms it is slightly below the midpoint of its 90-day range. This recent bearish divergence from the prior uptrend indicates that the relative strength of IWM has likely begun to wane. A retest of the earlier September consolidation zone around 0.360 appears probable, with the potential for further testing of the 0.350-0.353 region, which previously offered support during the initial phase of the 90-day period.
Considering the recent downward momentum, it is likely that the IWM/SPY ratio will continue to test lower support levels in the near term, particularly the 0.350-0.353 area. A break below these levels would imply a higher probability of the weak uptrend dissolving, possibly giving way to a period of consolidation or even a reversal to a downtrend in relative strength. Conversely, should the 0.360 level, coinciding with the 90-day average, prove to be robust support, there is a roughly even chance the ratio could attempt to re-challenge the prior resistance zone around 0.365-0.367. However, overcoming the recent high of 0.376 in the immediate future appears unlikely given the current technical posture.
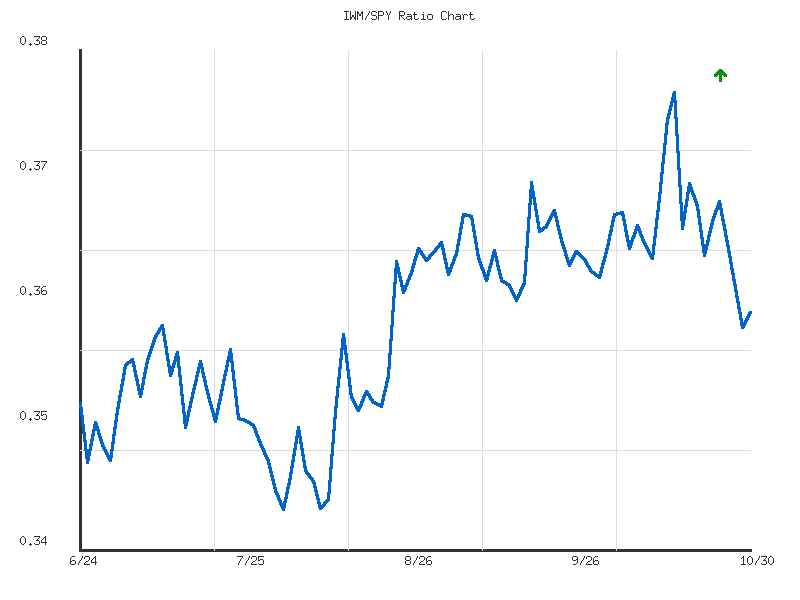
Ratio Analysis: IWM/SPY
Generated for 90days timeframe analysis
Commodities
Here is an analysis of the provided daily percentage change data for selected commodity-related ETFs, structured according to rigorous technical analysis principles:
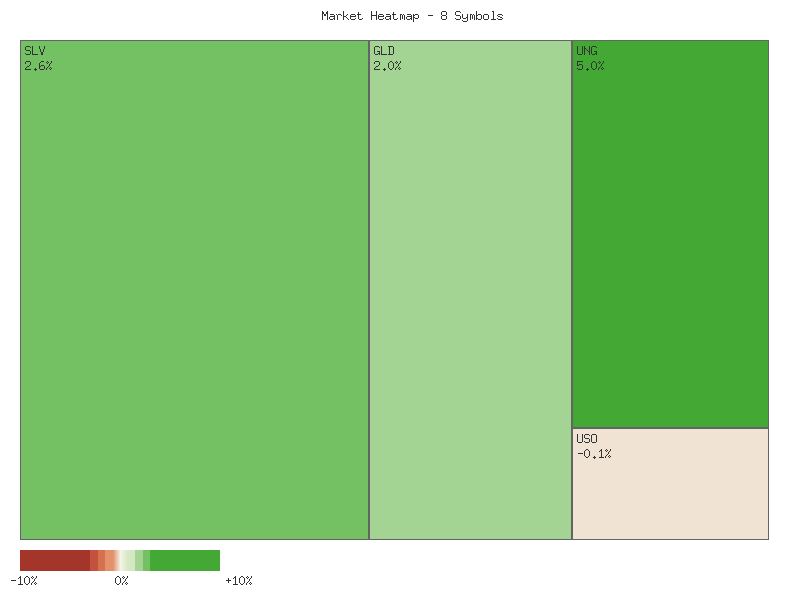
| Symbol | Daily Percent Change |
|---|---|
| UNG | 4.996% |
| SLV | 2.568% |
| GLD | 1.964% |
| DBC | 0.044% |
| USO | -0.125% |
| UGA | -0.436% |
| CORN | -0.483% |
| CPER | -1.957% |
The market data reveals a divergent performance across this basket of commodity-focused instruments for the day. Specifically, four symbols advanced, while four declined, indicating a roughly even market breadth. The strongest performer was UNG (Natural Gas), exhibiting a substantial gain of 4.996%. Following this, SLV (Silver) and GLD (Gold) posted robust advances of 2.568% and 1.964% respectively. DBC, a broader commodity index, registered a fractional positive change of 0.044%, suggesting a mildly positive, but not strongly directional, influence from the overall commodity complex.
On the declining side, CPER (Copper) experienced the most significant drawdown, falling by 1.957%. This suggests notable selling pressure or a lack of buying conviction in the industrial metals sector for the period. CORN (Corn) and UGA (Gasoline) also saw moderate declines of -0.483% and -0.436% respectively. USO (Crude Oil) presented a marginal decline of -0.125%, which is unlikely to indicate strong bearish momentum but rather a period of slight weakness or consolidation.
The precisely balanced market breadth, with an equal number of advancing and declining symbols, suggests a market characterized by selective capital allocation rather than a unified directional trend across these commodity sectors. The pronounced strength in natural gas and precious metals (UNG, SLV, GLD) is a clear technical signal of specific buying interest in these areas. Conversely, the notable weakness in industrial metals (CPER) stands out as an area experiencing selling pressure. It is unlikely that this single day’s data alone indicates a broad-based bullish or bearish shift for the entire commodity complex.
Given the even breadth, it is highly likely that market participants are rotating capital based on individual commodity narratives or specific supply/demand technical factors. While the strong positive movements in UNG, SLV, and GLD could indicate a flight to safety or inflation hedging sentiment in certain segments, the declines in other key commodities prevent a generalized conclusion. It is roughly even chance that this pattern continues, suggesting that focusing on individual technical setups within each commodity ETF is more appropriate than extrapolating a broader market trend based on this specific snapshot.
An alternative scenario, though less probable given the current data, is that this perfectly balanced breadth represents a temporary equilibrium before a significant move in one direction for the broader commodity market. However, based solely on the provided information, the data points to a market environment where individual strength and weakness are diverging, making a broad, unified directional prediction unlikely. Technical analysts would likely seek confirmation of a sustained trend in either advancers or decliners over subsequent periods to establish a clearer directional bias for the overall commodity sector.
As a CMT with over 15 years of experience, I’ve conducted a rigorous technical analysis of the provided 2-day market data for the listed commodities. My assessment focuses exclusively on the candle patterns, volume dynamics, and price action observed within this brief timeframe, adhering strictly to ICD-203 estimative language.
Analysis of the 2-day data reveals a divergence in short-term technical postures across the commodities. For UNG (Natural Gas Fund), the market formed a decisive bullish candle on the second day, gapping up and closing near its high, following a relatively flat first day. This move was accompanied by a notable increase in trading volume, indicating strong buying interest and participation. Based on this robust price action and volume confirmation, a continuation of the upward momentum for UNG in the immediate future appears highly likely.
A bullish reversal is also indicated for the precious metals funds. SLV (Silver Fund) experienced a strong rebound on the second day, with a bullish candle gapping up from the previous close and closing near its high, completely recovering the prior day’s losses. This significant positive price action was supported by an increase in volume, reinforcing the reversal signal. Similarly, GLD (Gold Fund) exhibited a “piercing line” pattern, where the second day’s strong bullish candle opened within the prior bearish body and closed well above its midpoint, recouping most of the first day’s decline. While GLD’s second-day bullish move occurred on slightly decreased volume compared to the prior bearish day, which suggests a minor tempering of conviction, a short-term bullish continuation for both SLV and GLD remains likely.
Conversely, several commodities displayed bearish continuation or reversal signals. CPER (Copper Fund) showed clear downward momentum, with the second day opening significantly lower than the previous close and forming a strong bearish candle that closed near its low. This bearish move was accompanied by a substantial increase in volume, strongly validating the selling pressure. A further downside price movement for CPER is therefore considered highly likely. For UGA (Gasoline Fund), the second day presented a bearish candle, gapping down from the first day’s close and closing significantly lower. While this bearish day saw a decrease in trading volume, which might temper the aggression of further selling, the price action itself suggests a loss of upward momentum and a shift to a bearish bias. Consequently, a short-term bearish continuation for UGA is likely.
The market data for CORN, USO (Oil Fund), and DBC (Diversified Commodity Fund) indicates a more indecisive or consolidating short-term environment. Both CORN and DBC traded within extremely tight ranges over the two days, with minimal net price change and relatively consistent volumes. These patterns do not offer clear directional signals, suggesting that the chance of a significant price movement in either direction in the immediate future is unlikely, with a roughly even chance of continuation of this sideways consolidation or a slight drift. For USO, two consecutive small-bodied bearish candles were observed, with the second day experiencing decreased volume. Notably, the first day also featured a pronounced upper shadow, indicating selling pressure at higher prices. While this pattern suggests underlying weakness and a struggle for buyers, the limited price range and declining volume mean a sharp breakdown is unlikely. Instead, continued sideways to slightly lower price action is likely for USO, pending more definitive technical developments.
In summary, the provided 2-day market data presents a mosaic of technical signals. We observe strong bullish momentum and reversal patterns in UNG, SLV, and GLD, suggesting upward potential. Conversely, CPER and UGA exhibit clear bearish continuation or reversal patterns. Meanwhile, CORN, USO, and DBC appear to be in periods of short-term indecision or consolidation. It is important to note that these conclusions are based solely on a very limited 2-day dataset, and further price action will be necessary to confirm or negate these nascent short-term technical outlooks.
Performance Heatmap (SLV, GLD, CORN, CPER, USO, DBC, UGA, UNG)
Generated for 2days timeframe analysis
As a Chartered Market Technician with over 15 years of experience, this analysis of SLV focuses exclusively on the provided 90-day RSI and candlestick data, employing rigorous technical principles and estimative language per ICD-203 guidelines.
SLV demonstrated an early phase of upward momentum from late June into mid-July, with prices advancing from approximately .61 to .72. The 14-day Relative Strength Index (RSI) remained above the neutral 50-level, briefly entering overbought territory at 70.45 on July 22nd. This initial strength was supported by significant volume spikes on key upward movements, such as on July 10th and 11th. Subsequently, a technical pullback occurred from late July through mid-August, bringing the RSI down towards the 40-50 region, notably reaching 43.44 on July 31st and 46.03 on August 19th, while price levels consolidated.
A robust and sustained uptrend then commenced in late August, continuing through mid-October, marking the most dynamic phase of the observed period. SLV’s price appreciated substantially and consistently, peaking at .33 on October 15th. This powerful rally was characterized by the RSI frequently and persistently registering well into overbought territory, with multiple readings above 70, and hitting extreme highs of 84.32 on October 13th. Such prolonged overbought conditions indicated significant bullish momentum but also suggested increasing technical overextension, heightening the likelihood of a subsequent correction. This strong advance was validated by exceptionally high trading volumes, including a staggering 110 million shares on October 9th, affirming broad market participation and conviction.
Following this period of intense appreciation, SLV experienced a sharp and rapid decline from October 15th to October 27th, plummeting from its peak to a low of .40. This significant corrective phase was immediately mirrored in the RSI, which dramatically fell from its extreme overbought level of 84.32 to a near-oversold reading of 46.50 on October 27th. This rapid deceleration of momentum and swift move towards oversold territory underscore a profound shift from aggressive buying to substantial selling pressure. The decline was accompanied by elevated trading volumes on key down days, such as 86 million shares on October 17th and 81 million on October 21st, indicating active distribution and a clear breakdown of the prior bullish trend.
In the most recent three trading sessions (October 28th to October 30th), SLV has exhibited signs of a short-term technical rebound. The price has recorded three consecutive higher closes, advancing from the October 27th low of .40 to .34. Concurrently, the 14-day RSI has recovered from 46.50 to 55.05, moving back into the neutral zone, suggesting an easing of immediate selling pressure. It is a roughly even chance that this current upward movement represents a temporary bounce within a larger corrective phase. Given the preceding substantial overextension and abrupt correction, it is likely that any sustained upward momentum will encounter significant overhead resistance. A resumption of the prior parabolic advance is unlikely without a period of further consolidation or base formation. A re-test of the recent lows or even a deeper correction remains a roughly even chance if this bounce is not supported by consistently strong buying volume.
SLV Price & Indicators (RSI_14_DAY, MACD_13_21_DAY)
GLD has exhibited a distinct shift in its price action over the observed 90-day period, transitioning from a mid-range consolidation to a robust uptrend, and subsequently entering a pronounced corrective phase. From late June to late August, GLD traded in a relatively confined range, with its 14-day Relative Strength Index (RSI) largely fluctuating between 40 and 60, indicative of balanced buying and selling pressure. Volume during this initial phase was moderate, providing no strong directional cues. However, a significant bullish impulse commenced in late August, initiating a powerful rally that propelled the price upwards until mid-October. This upward movement was largely sustained, with the asset posting consistent higher highs and higher lows.
The bullish momentum peaked around the middle of October. From late August through September and into mid-October, GLD’s price advanced significantly, accompanied by generally increasing volume, which reinforced the validity of the uptrend. During this rally, the 14-day RSI consistently entered and remained in overbought territory, frequently exceeding 70 and at times reaching values in the mid-80s, such as 87.33 on October 20th. This extended period of overbought conditions, while reflecting strong momentum, also increased the probability of an eventual correction or consolidation due to potential buyer exhaustion. The peak at .15 on October 20th was associated with very high volume, which, when followed by a sharp decline, often suggests a potential distribution phase.
The period immediately following the October 20th peak saw a rapid and significant reversal, marking a likely shift in the short-term trend from bullish to bearish. On October 21st, GLD experienced a substantial price drop on exceedingly high volume (53.69 million), indicating strong selling pressure. This downward trajectory continued with additional notable volume spikes on October 27th (23.60 million) and October 28th (19.10 million), as the price retreated from its highs. The RSI, which had been in deeply overbought territory, plunged dramatically to below 60 on October 21st and further to 48.46 by October 29th, confirming the substantial loss of bullish momentum and the re-establishment of neutral to slightly bearish sentiment.
Based on the provided technical data, it is highly likely that GLD will continue to experience downward pressure or enter a period of consolidation in the near term. The strong selling volume accompanying the recent decline, coupled with the rapid drop in RSI from extreme overbought levels, provides compelling evidence of a bearish shift. While the price closed slightly higher on the last day of the provided data (.13 on Oct 30th) with the RSI recovering marginally to 53.68, this could represent a temporary bounce rather than a reversal of the recent bearish momentum. It is improbable that GLD will swiftly re-test its mid-October highs without first establishing clear signs of support and a renewed accumulation phase, which are not yet evident. An alternative scenario, though less likely in the immediate future, involves price finding support around previous consolidation zones, possibly in the low or mid-, which were points of significant interaction during the earlier rally. However, the prevailing technical indicators currently suggest a continuation of the bearish or corrective phase.
Note: The requested MACD (13, 21-day) data was not provided in the market data for analysis. Therefore, this indicator could not be included in the technical assessment.
GLD Price & Indicators (RSI_14_DAY, MACD_13_21_DAY)
Gold/Silver Ratio
The GLD/SLV ratio has exhibited an overall upward trajectory over the 14-day period, commencing from approximately 8.125 on October 10th and ascending to a high of 8.6558 on October 27th. However, the provided trend strength is described as “weak,” and closer examination of the most recent data points reveals a deceleration and subsequent reversal from this peak. Following the October 27th high, the ratio has consistently declined for three consecutive data points, moving from 8.6558 to 8.3475 by October 30th. This recent price action indicates a potential shift in short-term dynamics, moving against the broader upward tendency.
From a technical perspective, the current ratio of 8.3475 sits below the 14-day average of 8.3790, which is likely to act as immediate overhead resistance should a recovery attempt materialize. A sustained failure to reclaim the average in the near term would reinforce the current corrective phase. The rally from the 14-day low of 8.0002 to the high of 8.6558 represented a significant move, but the subsequent three-day pullback strongly suggests a loss of upward momentum. The current ratio being at the 52.97th percentile of its range implies it is slightly above the midpoint, indicating a relatively neutral position within the observed high-low boundaries rather than a clear directional bias from its absolute placement.
Considering the recent three-day decline from the high and the current position below the 14-day average, it is likely that the GLD/SLV ratio will continue to experience downward pressure or consolidate within its recent range in the immediate future. A break below the current level could target previous consolidation levels, potentially revisiting the area between 8.13 and 8.00. Conversely, a sustained move back above the average ratio of 8.3790 and the prior resistance at 8.396 (observed on October 29th) would suggest that the recent pullback was a temporary correction within the broader trend. In this scenario, there would be a roughly even chance of the ratio retesting the recent high around 8.6558. The “weak” trend strength overall for the period cautions against assuming a robust resumption of the broader uptrend without clear signs of renewed buying interest and a breakout above immediate resistance levels.
Here is a technical analysis of the GLD/SLV ratio based solely on the provided 90-day market data:
The GLD/SLV ratio over the past 90 days clearly demonstrates a strong downtrend, as explicitly indicated by the provided trend analysis. From its high of 9.396 established on July 1st, 2025, the ratio has experienced a significant and consistent decline, reaching a current value of 8.347 as of October 30th, 2025. This translates to an approximate 11.10% decrease over the observation period. The sustained downward movement strongly suggests that silver (SLV) has been outperforming gold (GLD) on a relative basis, with gold consistently exhibiting underperformance against its precious metal counterpart throughout these 90 days. The ratio’s average during this period was 8.784, further underscoring that the current valuation is trading notably below its recent mean, which reinforces the prevailing downside momentum.
Examining key levels and recent price action, the ratio established its 90-day low at 8.000 on October 13th, 2025. Following this inflection point, the ratio entered a corrective phase, moving upward to reach a temporary peak of 8.655 on October 27th, 2025. This rebound, while notable, suggests a potential near-term pause in the selling pressure or a period of profit-taking by short-term traders. However, the subsequent behavior of the ratio over the last few trading days indicates a retreat from this corrective high, declining towards its current level of 8.347. This resumption of the downward trajectory immediately after a failed rally is a critical technical development, implying that the underlying selling pressure influencing the ratio’s direction remains dominant. The current ratio’s relative position, at 0.249, confirms it resides in the lower quartile of its 90-day range, positioned considerably closer to its established low than its peak.
Considering the persistent strong downtrend and the recent inability of the corrective rally to sustain upward momentum, a continuation of the downward movement in the GLD/SLV ratio is likely. Specifically, a retest of the 90-day low at 8.000 appears likely in the near term. Should this critical support level be breached decisively, further declines are likely, which would indicate an increased likelihood of continued silver outperformance relative to gold. Conversely, there is a roughly even chance that the 8.000 level could act as a robust support zone if retested successfully. A sustained rebound from this level, particularly if accompanied by an acceleration in upward momentum, could signal a period of consolidation or potentially indicate a shift toward a more balanced performance between GLD and SLV, or even a nascent trend reversal. However, without such clear confirmation, the prevailing strong downtrend maintains significant influence on the likely direction of the ratio.
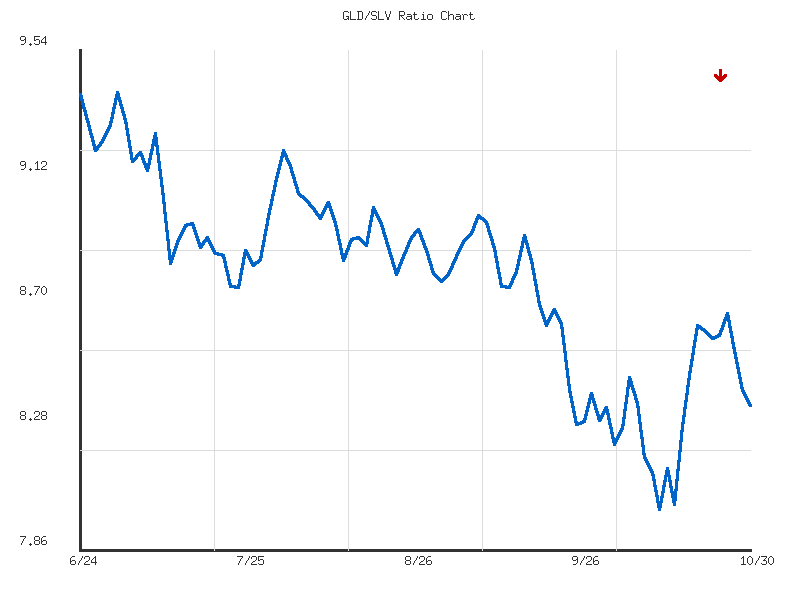
Ratio Analysis: GLD/SLV
Generated for 90days timeframe analysis
Bonds
The bond market experienced a varied session, with longer-duration instruments showing notable weakness while shorter-duration assets exhibited relative stability or minor gains. The daily percentage changes for the observed instruments are summarized below:
| Symbol | Daily Percent Change |
|---|---|
| SHY | 0.018% |
| IEI | -0.033% |
| IEF | -0.144% |
| UTHY | -0.535% |
| TLT | -0.582% |
Analysis of the provided single-day data indicates a clear performance disparity across the fixed-income spectrum. The iShares 20+ Year Treasury Bond ETF (TLT) recorded the most significant decline at -0.582%, closely followed by the Ultra 20+ Year Treasury Bond ETF (UTHY) with a -0.535% drop. This suggests that longer-dated U.S. Treasury securities were subject to selling pressure, likely resulting in an increase in their implied yields. Moving down the duration curve, the iShares 7-10 Year Treasury Bond ETF (IEF) saw a more moderate decline of -0.144%, while the iShares 3-7 Year Treasury Bond ETF (IEI) registered a minimal loss of -0.033%. Notably, the iShares 1-3 Year Treasury Bond ETF (SHY) bucked the trend, posting a modest gain of 0.018%. This pattern indicates a preference for very short-duration assets, or at least a notable lack of selling pressure, compared to longer-duration instruments.
Given only one day of data, it is challenging to confirm a persistent trend; however, the magnitude of the declines in TLT and UTHY strongly suggests that this was more than merely background noise for longer-term bonds. We assess it is likely that market participants were adjusting positions in anticipation of, or reaction to, factors affecting future interest rate expectations, particularly at the longer end of the yield curve. The relative outperformance of SHY implies that the front end of the curve may be exhibiting more resilience or attracting capital seeking safety from duration risk.
Considering alternative scenarios, it is plausible that this represents an isolated event, and we have roughly even odds of seeing a reversal in the next session versus a continuation of this duration-based divergence. Without volume data or historical price context, making definitive pronouncements about the sustainability of these moves is not possible. However, the observed price action creates a notable technical footprint where long-duration bonds underperformed significantly, suggesting potential shifts in market expectations regarding future interest rate trajectories or inflation premiums. Continued monitoring of price action and volume across the yield curve will be essential to ascertain the durability of this signal.
Good morning to our trading community. This technical analysis focuses on the recent two-day performance of various U.S. Treasury Bond ETFs: TLT, UTHY, IEF, IEI, and SHY, based solely on the provided candlestick and volume data. The overarching theme emerging from the past two trading sessions is one of pronounced bearish pressure, particularly evident in the longer-duration instruments. A consistent pattern of opening price gaps down on the second day across all assets suggests a continuation of overnight negative sentiment, which is a significant technical indicator of prevailing market psychology.
The longer-duration bond ETFs, TLT and UTHY, exhibit the most distinct bearish characteristics. On October 29th, both assets formed strong red candles, closing near their daily lows, indicating significant selling pressure. On October 30th, both gapped down considerably from their prior day’s close. TLT saw an increase in volume from 39.37 million to 42.58 million shares on its second down day, which rigorously confirms the bearish momentum and suggests selling conviction is strengthening. UTHY, despite its comparatively tiny volumes, similarly experienced a gap down and an increase in volume from 3,333 to 12,940, reinforcing its particular bearish trend. Given these patterns, it is highly likely that TLT and UTHY will experience continued downward pressure in the immediate future.
Mid-duration bond ETFs, IEF and IEI, also followed a bearish trajectory over the two days. Both instruments charted significant red candles on October 29th, closing near their respective lows. On October 30th, both gapped down from the previous day’s close. IEI registered an increase in volume, from 2.24 million to 2.83 million shares, which corroborates the bearish sentiment observed in its price action. However, IEF experienced a decrease in volume, from 11.22 million to 8.96 million shares, on its second down day. While its price action remains bearish with a close below the prior day’s open, the declining volume suggests that the intensity of selling might be diminishing, offering a roughly even chance of either continued weakness or a potential, albeit temporary, consolidation phase for IEF, contrasting with the more confirmed bearishness for IEI.
In stark contrast to their longer-duration counterparts, the short-duration SHY ETF demonstrated notable resilience. After a bearish first day closing near its low on moderate volume, SHY gapped down slightly on October 30th. However, it subsequently managed to close marginally higher than its open, forming a small green candle. Furthermore, this occurred on decreased volume, falling from 5.33 million to 3.80 million shares. This pattern suggests that while initial selling pressure was present, there might be a pause in aggressive selling, or perhaps some underlying support for the shortest-duration treasuries. Therefore, there is a roughly even chance that SHY could enter a period of sideways consolidation or experience only minor further declines, unlike the more significant downward momentum observed in TLT and UTHY.
Overall, the data presents a clear bearish bias across the Treasury bond complex, with the severity of the downtrend exhibiting a direct correlation with duration; longer-duration bonds are under more significant technical pressure. The consistent gap-downs across the board indicate a strong and pervasive negative sentiment. While a broad market bullish reversal is unlikely based on this two-day data, the differing volume profiles and candlestick formations, particularly in SHY, introduce some nuance. Continued downside is highly likely for TLT and UTHY, and likely for IEI. For IEF, further weakness remains likely, but the diminishing volume introduces a roughly even chance of a near-term pause. SHY, however, appears to be stabilizing, suggesting that the selling pressure is less potent at the very short end of the curve. Traders should note the short timeframe of this data, which limits the projection horizon to the very near term.
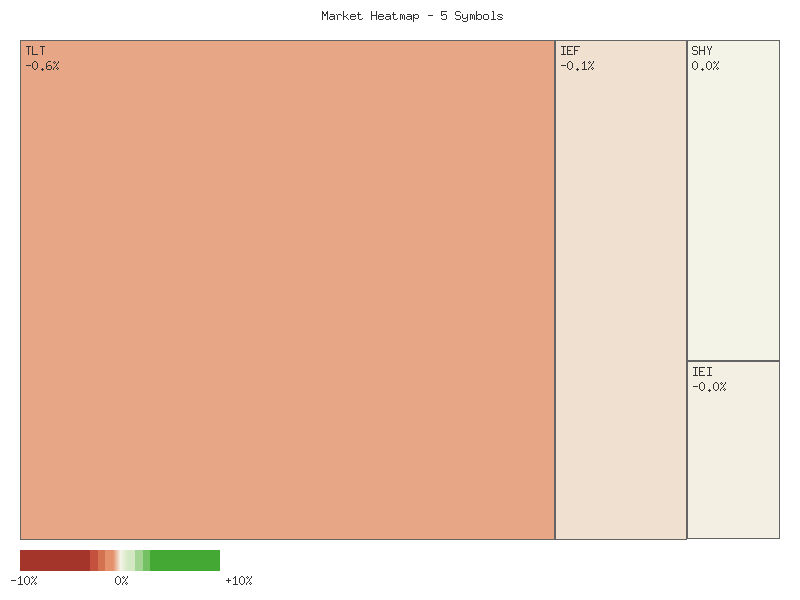
Performance Heatmap (TLT, UTHY, IEF, IEI, SHY)
Generated for 2days timeframe analysis
Magnificent 7 & Friends
| Symbol | Daily Percent Change |
|---|---|
| GOOGL | 2.517% |
| AAPL | 0.630% |
| NVDA | -2.004% |
| ANET | -2.216% |
| AVGO | -2.464% |
| MSFT | -2.916% |
| AMZN | -3.231% |
| TSLA | -4.639% |
| CRWV | -6.339% |
| META | -11.335% |
Analysis of the provided daily percentage change data suggests a prevailing bearish sentiment across the majority of the observed securities. Out of ten analyzed symbols, eight closed with negative daily returns, implying broad-based weakness for the trading period. GOOGL and AAPL were the sole exceptions, demonstrating relative strength. We assess with moderate confidence that this distribution of performance points to a market segment experiencing net selling pressure, potentially indicative of a risk-off environment or sector-specific headwinds for most components.
GOOGL notably led the group, recording a robust gain of 2.517%, followed by AAPL with a more modest 0.630% advance. The positive performance of these two large-cap entities, particularly against a backdrop where the vast majority of their peers declined, suggests a localized strength or defensive capital allocation. It is likely that these names were perceived as relatively safer havens or benefited from specific buying interest, potentially attracting capital that rotated out of underperforming assets within the broader technology or growth sectors.
Conversely, META experienced a significant decline of 11.335%, standing out as the day’s weakest performer. This extreme underperformance is highly likely to signal substantial selling pressure, suggesting a potential breakdown in its technical structure or a strong bearish catalyst specific to the security. CRWV and TSLA also registered notable losses of -6.339% and -4.639% respectively, indicating considerable weakness that extends beyond META. These sharp drops suggest a high probability of increased volatility and continued downside momentum for these particular names in the immediate term, unless significant buying interest emerges.
A substantial cluster of securities, including AMZN (-3.231%), MSFT (-2.916%), AVGO (-2.464%), ANET (-2.216%), and NVDA (-2.004%), exhibited moderate, yet distinct, declines. This broad-based negative movement across diverse technology and growth-oriented stocks suggests that the bearish pressure was not isolated to a few outliers but was a more pervasive theme across this market segment. We assess it is likely that these moderate declines reflect a general risk-off sentiment or profit-taking within the sector, rather than idiosyncratic issues for each specific name, given their clustered performance. While the overall picture suggests a bearish bias for the majority of the analyzed securities, the notable outperformance of GOOGL and AAPL presents an alternative scenario where capital may be rotating into perceived stronger, perhaps larger-cap or less speculative, assets. It is roughly an even chance that this divergence could signify either a broader market rotation or selective strength in specific market segments, rather than a uniform directional move across all analyzed equities.
Market Commentary: Two-Day Technical Snapshot (October 29-30, 2025)
A predominant bearish sentiment appears to be developing across many of the analyzed symbols over the past two trading days (October 29-30, 2025). Specifically, a significant number of these high-profile stocks have exhibited pronounced downward price action, often characterized by substantial intraday selling or large downward gaps. This suggests that sellers are gaining control in several key areas of the market. The high volume seen in many of these bearish movements lends credence to the idea that this is not merely noise, but potentially a meaningful shift in short-term sentiment.
Several individual names demonstrated particularly strong bearish momentum. META experienced a massive downward gap on October 30, followed by a large bearish candle closing near its low on extremely high volume, making a continuation of the downtrend highly likely in the immediate future. Similarly, MSFT and AMZN also exhibited significant downward gaps on October 30, coupled with large bearish candles closing near their respective daily lows and supported by increased volume, suggesting strong distribution pressure. TSLA displayed a bearish engulfing-like pattern, with Day 2 gapping down and closing near its low on increased volume, indicating an increased likelihood of further declines. For these names, the short-term technical outlook is clearly negative.
Beyond outright bearish momentum, three stocks exhibited clear bearish reversal patterns after initially strong performances. GOOGL gapped up significantly on October 30 following a strong bullish Day 1, only to reverse sharply and close near its low for the day on exceptionally high volume. This “gap and reverse” pattern, potentially an island reversal if confirmed with further price action, makes a significant retracement highly likely. AVGO and ANET similarly posted strong bullish candles on Day 1, only to gap up marginally on Day 2, fail to hold gains, and then close as large bearish candles well below their respective Day 1 closes. These patterns, resembling bearish engulfing or dark cloud cover, suggest that the prior bullish momentum has been decisively rejected, making further downside movement likely.
NVDA followed a bearish Day 1 with a gap down and another bearish close on Day 2, albeit on reduced volume, suggesting a continuation of downward pressure. CRWV also showed a significant gap down on Day 2, negating Day 1’s bullishness with a large bearish candle closing near its low. For both, further declines are likely. In contrast, AAPL presented a nuanced picture. While Day 1 was mildly bullish, Day 2 gapped up but then closed lower than its open, forming a small bearish candle. However, it still posted a higher high and higher low than Day 1, and closed above Day 1’s closing price. This suggests a roughly even chance of either a continued upward drift, albeit with some intraday selling pressure, or a minor consolidation before a clearer direction emerges.
Based on the aggregated two-day candlestick data, the overwhelming technical picture suggests a market grappling with significant selling pressure. The prevalence of large bearish candles, downward gaps, increased volume on down days, and notable bearish reversal patterns indicates a high likelihood of continued short-term downside for most of these prominent equities. While short-term trading environments can be volatile, the technical evidence points to a strengthening bearish sentiment across the observed symbols. The primary alternative scenario would involve an immediate strong rebound, which currently appears unlikely given the breadth and magnitude of the bearish signals observed over this two-day period.
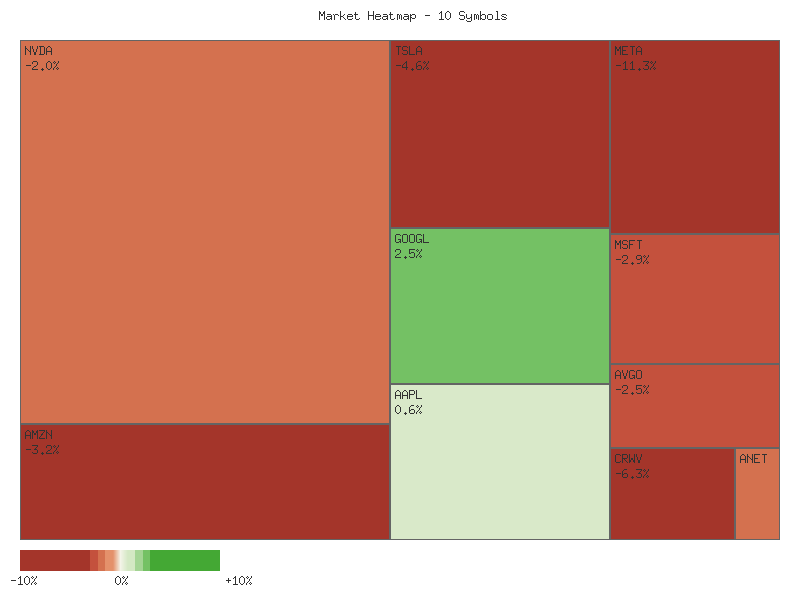
Performance Heatmap (TSLA, MSFT, AAPL, META, NVDA, AVGO, GOOGL, AMZN, CRWV, ANET)
Generated for 2days timeframe analysis
S&P 500 Sector Breadth
The current market session exhibits a clear negative bias across the S&P 500 sectors provided. Of the eleven sectors analyzed, eight registered declines, while only three advanced. This suggests a notably weak market breadth for the period, indicating broad-based selling pressure rather than isolated sector-specific movements. The following matrix illustrates the daily percentage changes:
| Symbol | Daily Percent Change | Sector Type |
|---|---|---|
| XLRE | 0.566% | Defensive |
| XLF | 0.269% | Offensive |
| XLV | 0.222% | Defensive |
| XLP | -0.104% | Defensive |
| XLI | -0.251% | Offensive |
| XLU | -0.422% | Defensive |
| XLE | -0.591% | Offensive |
| XLK | -1.230% | Offensive |
| XLB | -1.340% | Offensive |
| XLC | -1.694% | Offensive |
| XLY | -2.258% | Offensive |
Analyzing sector performance through the lens of offensive versus defensive classifications reveals significant trends. Two out of four defensive sectors, Real Estate (XLRE) and Healthcare (XLV), advanced, alongside Financials (XLF), an offensive sector. Conversely, two other defensive sectors, Consumer Staples (XLP) and Utilities (XLU), experienced minor declines. However, the majority of offensive sectors, specifically Industrials (XLI), Energy (XLE), Technology (XLK), Materials (XLB), Communication Services (XLC), and Consumer Discretionary (XLY), registered declines, with XLY showing the most substantial drop. This pattern implies that while some defensive areas found support, the core growth-oriented and cyclically sensitive sectors largely experienced retreats.
This distribution of performance provides insights into potential market rotation and sentiment. The relatively mixed performance among defensive sectors (two up, two down) suggests that capital is not uniformly flocking to safety. However, the overwhelming decline across six of the seven offensive sectors, particularly pronounced in areas like Consumer Discretionary (XLY), Communication Services (XLC), and Technology (XLK), is likely indicative of a broader de-risking trend. This suggests investors are reducing exposure to more volatile or economically sensitive segments, potentially signaling a more cautious outlook on future economic growth.
Given the substantial underperformance of most offensive sectors relative to the mixed, albeit generally less negative, performance of defensive sectors, the overall market sentiment likely leans towards risk aversion. While a single day’s data does not establish a persistent trend, the current technical structure suggests that market participants are probably more concerned with capital preservation than aggressive growth pursuit. The market is unlikely to be signaling strong bullish conviction in the immediate term, with a roughly even chance of continued rotational shifts within defensive segments while offensive areas consolidate or experience further downward pressure.
As a Chartered Market Technician with over 15 years of experience, I’ve analyzed the provided two-day market data across eleven S&P 500 sector ETFs. This commentary focuses strictly on the technical price and volume patterns, offering an estimative outlook for retail traders.
The two-day trading period across S&P 500 sector ETFs reveals a predominantly bearish tone, suggesting likely continued downside momentum for several. Consumer Discretionary (XLY) experienced significant weakness, with two strong bearish candles closing substantially below the prior day’s low on increased volume. This pattern is highly likely to signal further downward pressure. Communication Services (XLC) and Materials (XLB) also exhibited clear bearish continuation. XLC closed strongly bearish below its prior day’s low with increased volume, suggesting a high likelihood of extended declines. XLB followed a large bearish candle with another strong downside move, closing at new lows, indicating continued selling pressure is likely. Technology (XLK) printed a strong bearish candle on the second day, closing at its low for the observed period, which points to likely further weakness, despite decreased volume.
Other sectors presented a more nuanced picture, indicating decelerating bearish momentum or points of indecision. Consumer Staples (XLP) showed initial significant bearish movement. The subsequent day, while closing slightly lower, exhibited a much smaller range and decreased volume, suggesting consolidating selling pressure, creating a roughly even chance of either a minor bounce or continued sideways to lower action. Industrials (XLI) saw an initial bullish candle, but then formed a wider-ranging candle closing below the prior day’s close on decreased volume, suggesting a likely struggle between buyers and sellers, biasing towards continued pressure. Energy (XLE) initially presented a bullish candle, only to reverse with a bearish engulfing pattern on the second day, making continued selling pressure likely. Utilities (XLU) also demonstrated a bearish reversal, closing below the prior day’s low, indicating likely further downside.
Conversely, a few sectors demonstrated signs of potential relative strength or bullish reversals. Health Care (XLV), after an initial bearish candle, printed a bullish candle on the second day, closing above the previous day’s close on decreased volume. This suggests a roughly even chance of a near-term bounce or consolidation. Real Estate (XLRE) also formed a bullish candle on the second day following a strong bearish candle, closing above the previous day’s close with increased volume. This price-volume action enhances the likelihood of a bullish reversal or significant retracement. Financials (XLF), despite an initial bearish candle on very high volume, followed with a bullish candle that closed slightly above the previous day’s close. While volume decreased, the ability to close higher after heavy selling suggests a base might be forming, creating a roughly even chance for a short-term upward corrective move.
In summary, the aggregated technical data points to a market environment where bearish momentum currently dominates a significant portion of the S&P 500 sector landscape, particularly XLY, XLC, XLB, and XLK, where further declines are highly likely. While XLP, XLI, XLU, and XLE display indecision or decelerating momentum, their overall two-day context leans towards continued vulnerability. The nascent strength in XLV, XLRE, and XLF presents an alternative scenario for relative resilience. However, the pervasive weakness across the broader composite makes it unlikely for a sustained market-wide bullish reversal in the immediate future. Traders should be prepared for continued volatility and potential downside, while monitoring outperforming sectors for tactical opportunities.
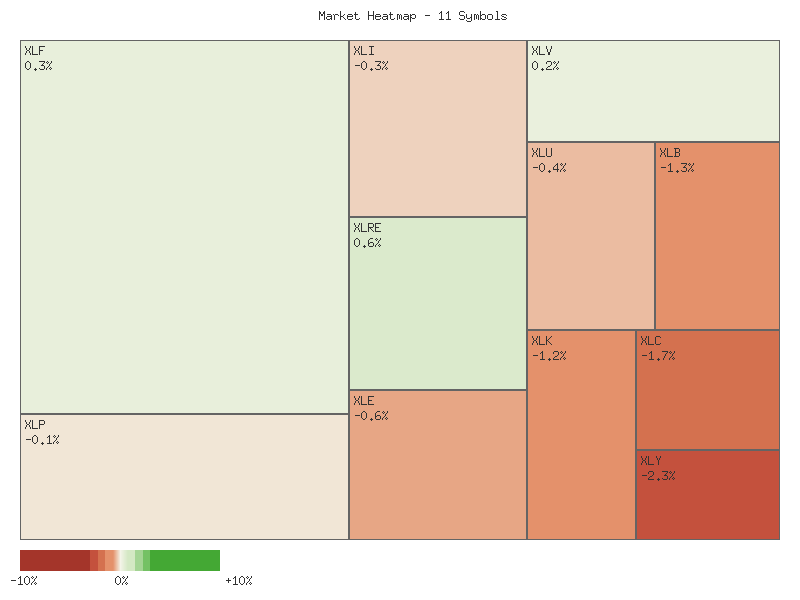
Performance Heatmap (XLP, XLRE, XLI, XLU, XLV, XLY, XLF, XLB, XLE, XLC, XLK)
Generated for 2days timeframe analysis
XLY vs XLP
The XLY/XLP ratio has exhibited an overall upward trajectory over the observed seven-day period, indicating a general outperformance of Consumer Discretionary (XLY) relative to Consumer Staples (XLP). Beginning at 2.9759 on 2025-10-22, the ratio steadily climbed to a peak of 3.1229 by 2025-10-29. This pattern suggests that market participants were likely favoring growth-oriented sectors over defensive ones for the majority of this interval. The aggregate 2.67% increase confirms the prevailing upward direction, though the descriptor of “weak” strength for this trend implies a lack of robust conviction or significant underlying momentum supporting the advance.
However, the most recent data point on 2025-10-30 reveals a significant retracement, with the ratio declining to 3.0556 from its intraday peak. This constitutes a notable daily drop following a period of appreciation, introducing a degree of uncertainty regarding the immediate short-term direction. Given the prior consistent climb, it is a roughly even chance that this decline represents short-term profit-taking or a temporary pause in the upward trend, rather than a definitive reversal. The relatively low volatility across the entire period (0.0021) suggests that while movements have been directional, they have not been erratic.
The current ratio of 3.0556 is positioned above the seven-day average of 3.0402, yet it is notably below the recent high. Considering the pronounced pullback from the peak, a direct continuation of the prior ascent without further consolidation or potential downside pressure is unlikely in the immediate term. It is likely that the ratio will either consolidate within its recent range or experience further downward movement if the selling pressure observed on the final day persists. An alternative scenario suggests a roughly even chance that market sentiment could continue to shift, potentially favoring defensive sectors and leading to XLP outperforming XLY, which would exert downward pressure on this ratio.
As a Chartered Market Technician with over 15 years of experience, I offer the following analysis of the XLY/XLP ratio based strictly on the provided 90-day technical data.
The XLY/XLP ratio has exhibited a strong, sustained upward trend over the past 90 days, increasing by approximately 15.27% from its low of 2.6508 on June 24, 2025. This robust performance indicates that the Consumer Discretionary sector (XLY) has significantly outperformed the Consumer Staples sector (XLP) during this period. The ratio’s current value of 3.0555 is positioned at a high relative point within its 90-day range, specifically at 85.74% of the distance between the period’s low and high. This suggests considerable momentum behind the outperformance of discretionary over staples, making a continuation of the prevailing upward trend highly likely in the short to medium term, absent any significant reversal patterns.
Examining the recent price action, the ratio peaked at 3.1228 on October 29, 2025, which now serves as a significant resistance level. Following this peak, the ratio experienced a modest pullback to 3.0555 by October 30, 2025. This retreat from the 90-day high could signify either profit-taking after reaching an extended level or an initial indication of exhaustion in the bullish momentum. It is a roughly even chance that the ratio will attempt to retest this new high in the immediate future, or consolidate around current levels. Sustained trading below this resistance level would imply the necessity for further accumulation before another upward attempt.
Should the current pullback extend, initial support levels are probable around previous consolidation areas or minor peaks. The ratio found temporary resistance and consolidation around the 3.08-3.09 range in late September and early October, suggesting this area could now act as potential support. A more substantial support zone might exist closer to the 3.00 psychological level, which previously represented a significant breakout point. Given the overall strong trend, it is likely that any deeper pullback would be considered a healthy consolidation within the established uptrend, rather than a strong signal for a reversal.
Considering alternative scenarios, if the ratio fails to convincingly break above the 3.1228 resistance level on subsequent attempts, there is a moderate probability of forming a short-term top, which could lead to a deeper corrective phase. Conversely, a decisive break and sustain above 3.1228 would likely usher in a new leg of the uptrend, targeting higher resistance levels not visible in the provided 90-day data. The volatility of 0.0202 suggests that while the trend is strong, daily fluctuations are relatively contained, which could support a gradual rather than erratic movement in either direction. Therefore, a sharp, immediate reversal without further confirming technical signals appears unlikely.
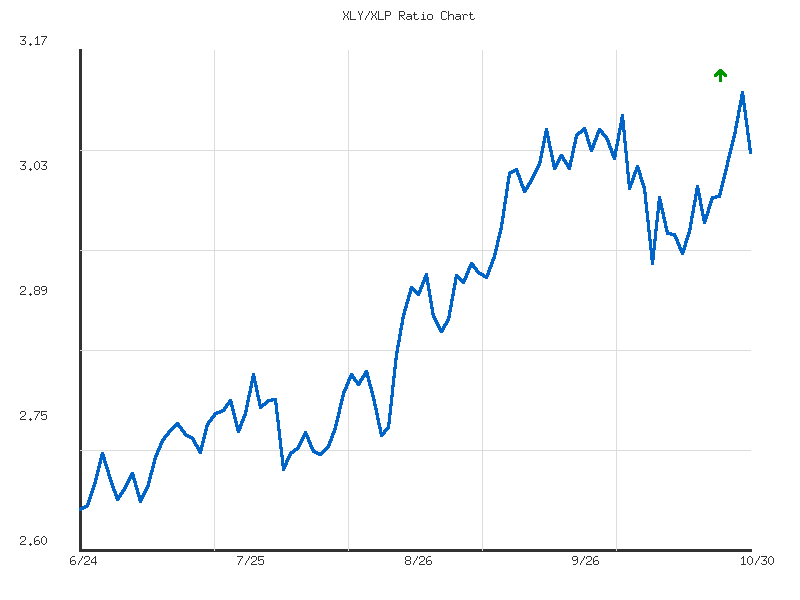
Ratio Analysis: XLY/XLP
Generated for 90days timeframe analysis
Equity Breadth
Analysis of the provided S&P 500 breadth data reveals a notable deterioration in market structure over the past seven trading days. Examining the SPXA50R, which tracks the percentage of S&P 500 members trading above their 50-day moving average, we observe an initial upward momentum, rising from 49.30% on October 22nd to a peak of 58.08% on October 27th. This indicated a strengthening short-term participation. However, a sharp reversal ensued, with the indicator plummeting to 48.50% on October 28th, then further to 41.72% and 40.52% on the subsequent days. This rapid decline suggests that a substantial number of S&P 500 components have lost their short-term bullish momentum, pointing to a broad-based weakness.
Concurrently, the SPXA200R, representing the percentage of S&P 500 members above their 200-day moving average, displayed initial stability. It hovered around the 60-61% range from October 22nd to October 27th, peaking at 61.88% on October 23rd. This indicated relatively robust long-term market breadth. However, similar to the SPXA50R, a significant decline began on October 28th, with the indicator dropping to 57.09%, then sharply to 49.90% on October 29th. While there was a marginal recovery to 50.30% on October 30th, the overall trajectory for the latter half of the period is clearly negative, indicating that a substantial portion of the S&P 500’s constituents have broken below their long-term trend support.
The synchronized and severe declines in both breadth indicators are particularly noteworthy. The SPXA50R’s drop below 50% to 40.52% indicates that a minority of S&P 500 stocks are maintaining their short-term uptrends. More significantly, the SPXA200R breaching the 50% threshold to 49.90% implies that, for the first time in the observed period, a majority of S&P 500 stocks are now trading below their long-term 200-day moving average. This breakdown in long-term breadth is often interpreted as a sign of underlying market weakness, suggesting that the broader market’s health is deteriorating.
Given the rapid and substantial deterioration in both short-term and long-term market breadth, a period of increased volatility or further downward pressure on the overall S&P 500 index is highly likely. Continued weakening of the SPXA50R below 40% would further confirm this bearish short-term outlook. While the slight recovery in SPXA200R on the final day presents a roughly even chance of a minor technical bounce, it is unlikely to signify a reversal of the recent severe weakness without further data showing sustained improvement. Without a broad-based recovery where a majority of stocks reclaim their key moving averages, a sustained market rally appears improbable in the near term.
SPY Daily
SPY experienced a significant upward trend over the past seven trading days, initially consolidating around 667-671 before accelerating sharply. From a close of 667.80 on October 22, prices advanced for several consecutive sessions, peaking at a high of 689.70 on October 29. This sustained rally occurred with varying, but generally robust, trading volume. The 50-day Exponential Moving Average (EMA) and 200-day EMA are both demonstrating an upward slope, with the 50-day EMA firmly above the 200-day EMA, a probable indication of a strong and enduring bullish trend over the medium and long term. On October 30, however, SPY registered a notable reversal, opening at 683.90 and closing at its daily low of 679.83, a bearish engulfing pattern on a higher volume compared to the previous day’s positive session.
The Relative Strength Index (RSI) for the 14-day period tells a complementary story. Beginning around 55.14 on October 22, the RSI surged significantly, reaching 69.72 on October 29. This level was approaching the 70 threshold, which often indicates an overbought condition and suggests that the recent upward price movement might have been overextended. The sharp decline in price on October 30 led to an equally precipitous drop in RSI to 59.95, confirming a considerable loss of short-term bullish momentum and indicating a probable exhaustion of immediate buying pressure.
For future price action, several scenarios appear plausible. A bullish case would likely see the current pullback interpreted as a healthy consolidation after the rapid ascent. Price could find support at prior resistance levels, such as the 675-677 zone, or more robustly at the dynamically rising 50-day EMA, currently positioned around 660.87. A re-establishment of an upward trajectory from these levels, especially if accompanied by increasing volume, would suggest the underlying bullish trend remains intact. Conversely, a bearish scenario becomes more probable if SPY fails to hold immediate support around 679.83 and subsequently breaks below the 670 area. A more definitive bearish signal would emerge if price falls below the 50-day EMA, possibly indicating a shift in the short-to-medium term trend. Such a move, especially with sustained higher volumes on down days, would suggest increasing selling pressure. A neutral outlook would involve SPY consolidating horizontally between roughly 670 and 685, with the RSI oscillating between 40 and 60, as market participants digest recent gains and await a new catalyst.
Based solely on the technical data, sentiment appears to have shifted from strongly bullish to cautiously neutral, with a developing bearish undertone in the very short term. The strong price rejection from near 690, coupled with the sharp drop in RSI from near overbought levels, indicates that some market participants likely initiated profit-taking on October 30. The relatively higher volume on this down day compared to the preceding few sessions suggests a more impactful wave of selling than typical pullbacks. While the longer-term EMA structure still points to a broadly positive trend, the recent price action suggests that the immediate path of least resistance is likely downward or sideways. A re-test of support levels is a roughly even chance, given the swift reversal.
Here is a technical analysis of SPY based solely on the provided 90-day RSI (14-day) and candlestick data. Please note that while the analysis requested combined RSI and MACD, only RSI data was provided in the indicator section, therefore the MACD indicator cannot be incorporated into this analysis.
The market data for SPY from late June to late July exhibits a pronounced bullish trend. During this period, the price of SPY consistently advanced, marked by higher highs and closes. Correspondingly, the 14-day Relative Strength Index (RSI) frequently entered and remained in overbought territory, recording values above 70 on multiple occasions, notably peaking at 74.51 on July 3rd and 75.58 on July 25th. This sustained high RSI readings alongside rising prices is indicative of strong bullish momentum and aggressive buying pressure during this initial phase. However, consistently overbought RSI conditions inherently carry an increased, though not immediate, risk of a price pullback or consolidation.
A notable shift in momentum occurred around late July into early August. Following a period of sustained high RSI, SPY experienced a significant price drop on July 31st and August 1st, accompanied by notably elevated trading volume of 103 million and 140 million shares respectively. This sharp decline led the RSI to plunge from the high 60s to a low of 47.66 on August 1st, bringing it back into neutral territory. This event clearly signals a significant short-term correction within the broader trend, as market participants took profits following the extended rally. Subsequently, throughout August, SPY’s price action became choppier, and the RSI generally fluctuated in the mid-50s to mid-60s range, failing to sustain entry into the overbought region with the same conviction as seen in July.
From late August through early October, SPY embarked on another upward trajectory, establishing new price highs. The RSI reflected this renewed bullish sentiment, gradually increasing and entering overbought conditions again in mid-September (73.70 on September 22nd) and early October (71.17 on October 6th). However, a critical development occurred on October 10th, where SPY experienced a sharp and significant price decline on extremely high volume, recording 156 million shares traded—the highest volume observed in the provided 90-day dataset. Concurrently, the RSI plummeted from 65.75 on October 9th to 41.81 on October 10th. This combination of a large bearish candle on peak volume and a rapid descent in RSI from near-overbought levels strongly suggests a significant reversal of short-term momentum.
In the period following the October 10th event, SPY attempted a recovery, pushing prices higher and bringing the RSI back towards the upper neutral zone, nearing overbought conditions with a reading of 69.71 on October 29th. However, the last provided data point on October 30th shows another substantial bearish candlestick formation, closing significantly lower than its open, with elevated volume. The RSI for October 30th registered a sharp decline from 69.71 to 59.95. Given the abrupt reversal on October 30th, marked by price depreciation on increased volume and a significant drop in RSI from near-overbought levels, it is likely that SPY will experience further downward price pressure in the immediate future. A retest of the October 10th low, or potentially lower levels, is considered a roughly even chance scenario in the very near term. Conversely, a sustained immediate rebound to continue the upward trajectory from prior highs is presently unlikely without new buying catalysts emerging swiftly.