Daily Market Technical Analysis
The market presents a bifurcated technical picture: large-capitalization indices (QQQ, OEF, SPY) show sustained bullish momentum, while small and mid-cap segments (IWM, IJR, MDY) exhibit likely continued downside pressure. SPY maintains an unambiguously bullish trend, though its RSI suggests a roughly even chance of a near-term pause. Bond markets display broad bearish reversals across durations, making continued short-term downside pressure likely, with a roughly even chance of consolidation. In commodities, gasoline (UGA) shows likely upward momentum, while gold (GLD) faces highly likely further downtrends after a sharp reversal. Overall equity breadth has deteriorated, indicating the S&P 500 may face sustained downward pressure.
Market Indices
The daily performance across the provided indices presents a mixed, but generally subdued, technical picture. The following matrix details the daily percentage changes for the referenced symbols, sorted in descending order:
| Symbol | Daily Percent Change |
|---|---|
| QQQ | 0.450% |
| OEF | 0.450% |
| SPY | 0.048% |
| MDY | -0.636% |
| IWM | -0.852% |
| IJR | -1.295% |
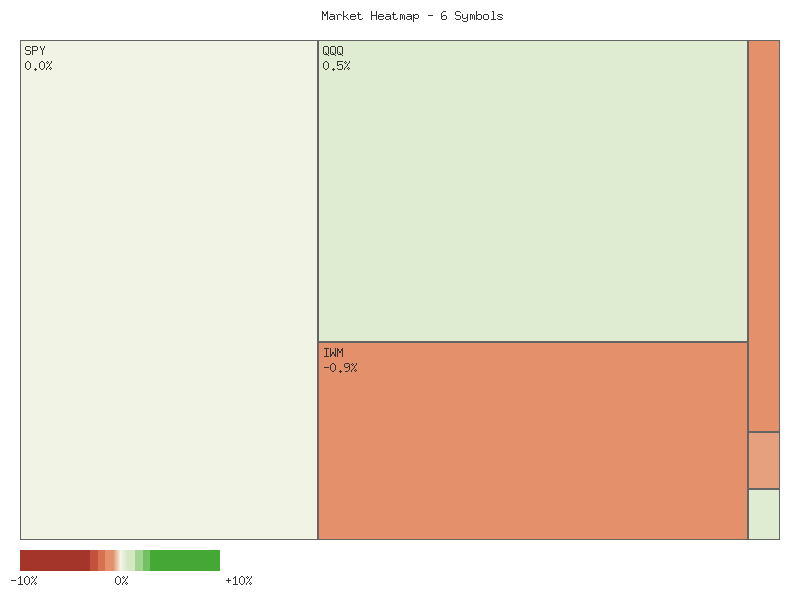
Analysis of market breadth indicates a roughly even distribution between advancing and declining symbols. Three symbols (QQQ, OEF, SPY) posted positive daily returns, while another three symbols (MDY, IWM, IJR) recorded negative returns. This 50/50 split suggests a lack of broad directional conviction in the market based solely on these six components. A prevalence of decliners or advancers might signal a clearer trend, but the current data indicates a period of technical equilibrium or indecision across these major market segments.
Examining the performance, larger-capitalization indices, represented by QQQ (Nasdaq 100), OEF (S&P 100), and SPY (S&P 500), demonstrated relative strength, all closing in positive territory, albeit with SPY’s gain being very marginal. This suggests that the larger, more established companies, particularly those within the technology-heavy Nasdaq 100, are likely providing support. Conversely, mid-cap (MDY), small-cap (IWM), and micro-cap (IJR) indices experienced notable declines, with IJR showing the most significant drawdown. This divergence—strength in large caps versus weakness in smaller caps—is a key technical observation from this data set.
The relative underperformance of small and mid-cap segments against their larger-cap counterparts could suggest that market participants are rotating into perceived safer or more liquid assets, or it could simply reflect idiosyncratic weakness within these segments for the day. While it is unlikely to indicate a broad market rally given the mixed breadth, it is also unlikely to signal an immediate, sharp market reversal based on this single day’s data alone. The observed pattern could represent a short-term pause or a developing theme of sector rotation, with a roughly even chance of either scenario unfolding in subsequent sessions if no further technical confirmation emerges.
As a Chartered Market Technician with over 15 years of experience, I’ve analyzed the provided two-day market data across several key U.S. equity exchange-traded funds (ETFs) to discern emerging technical patterns and probable near-term trajectories. The data reveals a significant divergence in performance, underscoring a bifurcated market environment rather than a uniform trend. We assess that large-capitalization segments, particularly those represented by QQQ and OEF, exhibited clear signs of upward momentum. Conversely, small and mid-capitalization indices, namely IJR, MDY, and IWM, demonstrated notable downside pressure, often confirmed by increasing selling volume. The S&P 500 (SPY), a broader market bellwether, displayed a more consolidated and indecisive stance within this two-day window.
Delving into the segments showing strength, QQQ, tracking the NASDAQ 100, presented two consecutive bullish closes. The second day showed a higher high and a higher close, firmly supported by an increase in trading volume from the previous day. This robust price action and volume confirmation are classic indicators of prevailing buying interest, making continued upward momentum highly likely for QQQ in the immediate term. Similarly, OEF, representing the S&P 100, also posted two successive bullish closes, with the second day exhibiting a higher high and close on elevated volume. This pattern suggests that OEF is likely to experience further upward movement. SPY, while showing a marginal higher close on its second day, did so with a very small body and a tight trading range, despite an increase in volume. This price action suggests a period of relative indecision or consolidation, where further upward continuation is roughly an even chance compared to a sideways or slight downward drift, indicating limited conviction.
Conversely, the small and mid-cap segments delivered distinct bearish signals. IJR, focused on small-cap growth, concluded its second day with a large bearish candle, closing significantly lower and breaking below the previous day’s low, all on noticeably increased volume. This pattern, often resembling a bearish engulfing, strongly indicates intensifying selling pressure, making further downside movement for IJR highly likely. The Russell 2000 (IWM), representing small-cap stocks, experienced an even more pronounced bearish engulfing pattern on its second day. Its price action decisively broke below the prior day’s range, closing significantly lower, and was accompanied by a near doubling of trading volume. We assess this to be a compelling technical signal of strong selling conviction, rendering continued weakness highly likely for IWM. MDY, tracking mid-cap stocks, similarly closed lower for two consecutive days, with the second day establishing a lower low and lower close on increased volume, suggesting it is likely to experience further downward trajectory.
Considering the pronounced divergence, we assess that market participants are exhibiting a preference for larger capitalization assets, possibly due to perceived stability or growth prospects within those segments. The persistent selling pressure and increasing volume observed in IJR, IWM, and MDY, coupled with sustained buying interest in QQQ and OEF, establish clear short-term trends for these respective market capitalization categories. It is highly likely that this divergence will persist in the immediate future, with capital continuing to flow towards perceived strength in large-cap growth and stability. An alternative scenario, where small and mid-caps find immediate support and reverse their downward trajectory while large-caps falter, appears unlikely without subsequent technical confirmation, such as significant bullish reversal candlestick patterns or a distinct contraction in bearish volume for the small/mid-caps. Instead, continued sector-specific performance disparities and overall market volatility are likely to characterize the near-term landscape.
Performance Heatmap (SPY, QQQ, IWM, IJR, MDY, OEF)
Generated for 2days timeframe analysis
Here is a rigorous technical analysis of the provided SPY market data:
The SPY has displayed a persistent bullish trend over the observed 90-day period, characterized by a distinct pattern of higher highs and higher lows, climbing from approximately to nearly . The 14-day Relative Strength Index (RSI) has largely confirmed this upward momentum, frequently signaling periods of overextension. From late June through late July, SPY experienced a robust rally, with the RSI consistently residing in overbought territory (above 70), peaking at 74.51 on July 3rd and 75.58 on July 25th. This prolonged overbought condition was subsequently followed by a notable price pullback on July 31st and August 1st, during which SPY declined from a high of 639.85 to 621.72. The selling volume observed on August 1st was the highest within the dataset at over 140 million shares, indicating significant, albeit temporary, bearish pressure. This established a pattern where extended overbought RSI readings are likely to precede a short-term price consolidation or correction, allowing momentum to reset.
Following the early August correction, SPY entered a phase of consolidation before resuming its upward trajectory. Throughout August and early September, the RSI generally oscillated within a healthier range, mostly between 50 and 70, reflecting sustained but less overheated bullish momentum. However, a re-entry into overbought territory, with RSI peaking at 73.70 on September 22nd, once again preceded a minor price retreat and consolidation. A more significant technical event occurred on October 10th, when SPY experienced a sharp, high-volume decline from 673.95 to 653.02, with volume spiking to over 156 million shares—the highest in the entire dataset. This abrupt sell-off dramatically reset the RSI to 41.81. Remarkably, SPY demonstrated a strong recovery subsequent to this dip, steadily climbing back to establish new all-time highs within the provided data by late October. This rebound was accompanied by the RSI rising from the low 40s to its current level of 69.71 on October 29th, approaching overbought conditions once more.
The prevailing technical posture for SPY is unambiguously bullish, underpinned by the clear series of higher highs and higher lows over the 90-day window and the recent powerful recovery. Given the current price action establishing new highs and the RSI nearing overbought levels at 69.71, it is likely that the immediate bullish trend will continue. However, the proximity of RSI to the 70 threshold suggests a roughly even chance of either a continued breakout to even higher levels or a temporary pause or minor pullback, consistent with historical price behavior following similar RSI conditions within this dataset. Key support for any near-term correction is likely to be found around the 670-675 price range, representing prior consolidation zones and the rapid rebound point. A sustained break below the 670 level, especially if accompanied by elevated selling volume and the RSI dipping below 50, would be an early indication of a significant shift in momentum, suggesting a higher likelihood of a more substantial correction. Conversely, sustained price strength with RSI remaining above 70 could signal exceptionally strong buying interest, making further upward progression very likely.
SPY Price & Indicators (RSI_14_DAY, MACD_13_21_DAY)
QQQ Technical Analysis (90-Day View)
Based on the provided 90-day technical data for QQQ, the underlying trend appears to be one of robust upward momentum, frequently punctuated by periods of consolidation or modest retracement. Price action reveals a pattern of higher highs and higher lows throughout the observation period, culminating in a fresh peak as of the latest data point. The 14-day Relative Strength Index (RSI) has been a significant confirming indicator, consistently reaching overbought conditions (above 70) during these upward phases, which suggests strong buying pressure. Historically within this dataset, such extended periods of overbought RSI have typically been followed by a consolidation or pullback, rather than an immediate reversal of the primary trend.
Presently, QQQ’s RSI is registering 71.73 on October 29th, firmly within the overbought zone. This level indicates that momentum remains highly bullish, consistent with the price reaching new highs at .77. While persistent overbought readings can, at times, signal an impending top or exhaustion, within the context of this 90-day data, the market has demonstrated an ability to sustain high RSI readings for several sessions before experiencing a meaningful cooling-off period. Therefore, it is roughly even chance that this current overbought condition could persist for a short duration, but it is likely to increase the probability of a near-term consolidation or price moderation.
Analyzing the price and volume data further illuminates the strength of the rallies and the nature of pullbacks. A notable example is the sharp price decline observed on October 10th, closing at .50, which was accompanied by exceptionally high volume (94.4 million shares). This substantial selling pressure briefly pulled the 14-day RSI down to 45.42, indicating a significant loss of momentum. However, the subsequent price action has shown a very strong recovery from this dip, pushing to new highs with consistent, elevated volume over the latter half of October. This suggests that the October 10th sell-off found significant buying interest, effectively absorbing the selling pressure and reinforcing the underlying uptrend.
Considering the current technical posture, the upward trajectory for QQQ is highly likely to continue in the near term, supported by strong momentum and recent high-volume buying activity that propelled the index to new peaks. However, given the sustained overbought condition on the 14-day RSI and historical patterns within the dataset, there is an increased possibility of a minor price pullback or a period of sideways consolidation in the immediate future. Any such retracement, should it occur, would likely be interpreted as a healthy digestion of gains rather than a reversal of the established upward trend, especially if accompanied by diminishing volume. Traders should monitor volume closely for signs of exhaustion if the price continues to rise without significant pauses, or for renewed selling pressure if a pullback initiates.
QQQ Price & Indicators (RSI_14_DAY, MACD_13_21_DAY)
IWM Technical Analysis: October 29, 2025
The IWM (iShares Russell 2000 ETF) has exhibited a sustained upward trend over the provided 90-day period, consistently establishing higher highs and higher lows from late June through late October. The price action climbed robustly from approximately 208 to a recent peak near 252. This broad bullish trend has been punctuated by sharp, but typically short-lived, pullbacks, which were subsequently met with renewed buying interest. Notably, IWM reached a new high of 252.77 on October 15th, followed by a minor consolidation and another attempted push to 251.11 on October 24th. However, the most recent three trading days (October 27th-29th) show a distinct pullback from these peak levels, with the price settling at 246.84. This recent price action suggests that the immediate upward momentum, which drove the IWM to new highs, has likely diminished.
Analysis of the 14-day Relative Strength Index (RSI) largely corroborates the observed bullish price action over the last 90 days. The RSI frequently remained in bullish territory, often hovering above the 60 level and at times entering overbought conditions (above 70), such as on July 3rd (71.57) and September 18th (71.23). These instances coincided with short-term price peaks, which were generally followed by minor pullbacks, indicating that periods of extreme positive momentum were often unsustainable without a brief consolidation. The sharp price decline on October 10th was accompanied by a notable drop in RSI to 44.97, nearing oversold conditions, yet the price subsequently recovered with renewed momentum. Currently, the RSI has retreated from 58.76 on October 27th to 53.35 on October 29th. This declining movement in the RSI, while still situated in neutral-bullish territory, suggests that short-term buying pressure is likely decreasing, aligning with the observed price pullback.
Based on recent price action, an immediate resistance level for IWM is likely found near the 251-252 range, encompassing the recent highs of October 15th and 24th. A decisive break above this zone would signal a continuation of the broader uptrend and would likely require a significant re-acceleration of momentum. Conversely, a critical support level appears to be established around the 237-238 range, particularly the low of 237.56 observed on October 10th, which successfully halted a prior sharp decline and led to a robust rebound. Should the current pullback persist, a re-test of this support level is a roughly even chance. A decisive breach below 237.56 would increase the likelihood of a deeper correction towards earlier support areas around 232-235, which served as consolidation zones in late August and early September.
Considering the recent price pullback from new highs and the declining RSI from its higher range, a continued short-term consolidation or minor correction is likely in the immediate future. The IWM has historically shown resilience in recovering from previous pullbacks, often on increased volume following periods of downward pressure, as evidenced by the strong recoveries after the August 1st and October 10th dips. However, the current momentum indicators suggest a temporary pause in aggressive buying. There is a roughly even chance that IWM could find support above the 237.56 level and resume its upward trajectory if renewed buying interest emerges. Conversely, if short-term selling pressure continues to build and momentum wanes further, a re-test and potential breach of this key support would be a plausible alternative scenario. Ultimately, while the overarching trend remains bullish, traders should monitor for stabilization around current levels or further declines towards critical support zones.
IWM Price & Indicators (RSI_14_DAY, MACD_13_21_DAY)
VIX Fear Index
The VIX experienced a notable short-term trend reversal over the past seven days, based solely on the provided candlestick data. Beginning at 18.65 on October 21st, the index displayed initial volatility, peaking at a high of 21.01 on October 22nd before closing at 18.60. A subsequent decline characterized the next three trading sessions, with the VIX reaching a low of 15.62 on October 27th and closing at 15.79. This established a clear bearish momentum phase, pushing the VIX to its lowest levels within the observed period. The pattern of lower highs and lower lows was evident until the indecision candlestick on October 27th, which featured a tight range and a close near its open, suggesting that the selling pressure might have been exhausting itself.
Following this period of decline and consolidation, the VIX initiated a significant upward correction over the subsequent two days. On October 28th, the index closed at 16.42, marking a clear rebound from the prior day’s close. This bullish momentum continued strongly into October 29th, with the VIX closing at 16.92. The daily percentage change data confirms this latest move, showing a rise of 3.045% for October 29th. This robust upward movement from the 15.60-15.80 support zone strongly suggests a short-term bullish reversal. Given the current price action, it is likely that the VIX will attempt to test higher resistance levels established during the earlier part of the week, specifically around the 17.50-18.00 range, possibly pushing towards the highs seen around 19.35 on October 23rd.
Considering alternative scenarios, there is roughly an even chance that the recent upward move could be a short-term counter-trend rally within a broader consolidation phase rather than a sustained uptrend. If the VIX encounters significant selling pressure at the 17.50-18.00 resistance area, it is likely to retest the recent support around 15.60-15.80. A failure to clear these immediate resistance levels, particularly the high of 17.58 from October 29th, could lead to renewed bearish sentiment. The absence of volume data for confirmation of these price movements limits the conviction of the analysis; consequently, all interpretations are based solely on price action and candlestick patterns. Further price action will be crucial in determining whether the VIX is establishing a new upward trend or merely undergoing a temporary retracement.
Technical Analysis of VIX (90-Day Period)
The VIX, an indicator of implied market volatility, displayed a distinct pattern over the past 90 days, characterized by an initial decline, a period of consolidation, and two significant upward spikes. From late June to late July, VIX largely trended downwards, moving from an opening level of 21.15 on June 23rd to lows near 14.93 by July 25th, indicating a period of decreasing market uncertainty. This decline was interrupted by a sharp, albeit brief, surge to a high of 21.90 on August 1st, which quickly receded. Following this, the VIX entered a consolidation phase through August and September, primarily oscillating between approximately 14.20 and 17.50. The most recent notable development began in early October, culminating in a significant spike where VIX reached a high of 28.99 on October 17th, before retreating. The closing price on October 29th was 16.92, positioning VIX within its broader consolidation range but above the lowest levels observed in late July and mid-August.
Analysis of the 14-day Relative Strength Index (RSI) provides further insight into VIX’s momentum. During the initial VIX decline in July, the RSI generally mirrored the price action, falling into the upper 30s, indicating weakening upward momentum. The August 1st VIX spike saw RSI climb to 65.38, approaching overbought territory, which coincided with the VIX quickly reversing downwards. This suggests a short-term exhaustion of buying pressure for volatility. The most recent VIX surge in October pushed the RSI into clearly overbought conditions, peaking at 73.09 on October 10th. Historically, RSI readings above 70 for VIX have frequently preceded price reversals, signaling that the move was likely unsustainable in the immediate term. From its mid-October highs, the RSI has subsequently declined, settling at 48.33 by October 29th, which suggests that the upward momentum that drove the recent VIX spike has largely dissipated and is now in neutral territory. It is important to note that MACD data was specified for analysis but not provided in the dataset, therefore our momentum assessment relies solely on RSI.
From a structural perspective, the VIX appears to have established a significant support zone roughly between 14.20 and 14.50, observed through multiple bounces in August. The 17.00-17.50 level has also frequently acted as a near-term resistance, particularly following upward price excursions. Considering the VIX’s recent retreat from its October highs and the corresponding decline in RSI from overbought levels, we judge it likely that VIX will continue to consolidate or experience further downward pressure in the immediate term. A retest of the 15.50-16.00 range is plausible in this scenario. However, the recurring pattern of sharp, temporary spikes within the 90-day period suggests that unexpected increases in market uncertainty, leading to VIX surges, remain a possibility.
Alternative scenarios must be considered. While a significant immediate upward reversal is unlikely given the current momentum profile indicated by the RSI, a sustained break above the 17.50-18.00 resistance level could signal renewed bullish sentiment for volatility. The current technical picture, including the candlestick on October 29th, shows the VIX closing below its open, despite an intraday high, reinforcing the observed downward momentum after the recent spike. Therefore, without new data to suggest a shift in the underlying conditions, we estimate a roughly even chance that the VIX remains within its recent consolidation range (15.50-17.50) in the very near term, with a bias towards the lower end of that range.
VIX Price & Indicators (RSI_14_DAY, MACD_13_21_DAY)
Tech Sector Analysis
Analysis of the RATIO:QQQ/SPY:14days data indicates a discernible upward trend in the relative performance of the NASDAQ-100 (QQQ) against the S&P 500 (SPY) over the past two weeks. The ratio began at approximately 0.9099 on October 9th and has progressively climbed, closing at its 14-day high of 0.9249 on October 29th. This represents a net change of 1.647% during the period, signifying that the technology-heavy QQQ has generally outperformed the broader market.
Despite the upward direction, the trend strength is categorized as “weak,” which is further supported by the remarkably low volatility measure of 0.00003775 for the ratio. While QQQ’s relative strength saw an initial dip to a low of 0.9027, the subsequent price action demonstrated a sustained recovery and gradual ascent, particularly accelerating in the last five trading sessions from 0.9089 to its current high. The current ratio being at the high end of its 14-day range, with a relative_position of 1, confirms the recent momentum favoring QQQ.
Considering the established upward trajectory and the closing at a 14-day high, it is likely that QQQ’s relative outperformance against SPY will continue in the immediate short term. This suggests an ongoing preference among market participants for the growth-oriented technology sector as represented by QQQ. However, the identified “weak” trend strength indicates that any continued outperformance is unlikely to be exceptionally aggressive or rapid without further significant catalysts.
Conversely, given that the ratio has reached its peak for this specific 14-day period, there is a roughly even chance of a minor consolidation or slight pullback in QQQ’s relative performance as short-term momentum may temporarily exhaust. A complete reversal of the observed upward trend is unlikely in the immediate future based solely on this dataset, but the weak strength implies that the trend could be easily stalled if underlying market dynamics shift. Investors should monitor for any significant change in the ratio’s pattern or an increase in volatility that could signal a shift from the current trajectory.
Here is a technical analysis of the QQQ/SPY ratio data over the past 90 days, conforming strictly to ICD-203 estimative language and technical analysis principles.
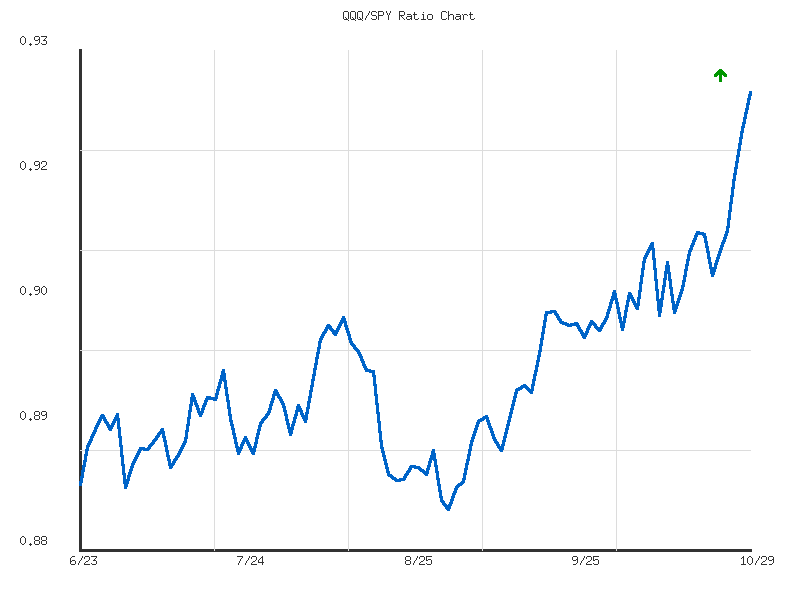
The QQQ/SPY ratio over the past 90 days presents a clear and discernable upward trend, indicating a period of sustained outperformance by the Nasdaq 100 (QQQ) relative to the S&P 500 (SPY). Starting near 0.8858 in late June, the ratio initially experienced some moderate fluctuations but established a definitive bullish trajectory, particularly from early September. The overall trend is officially categorized as “up” with “moderate strength” and has recorded a 4.407% increase from its initial point to the latest data point. This ascending channel suggests a consistent shift in market preference towards the growth and technology sectors represented by QQQ when compared to the broader market, as reflected solely by this relative performance metric.
Current price action indicates robust bullish momentum for the QQQ/SPY ratio. The ratio closed at 0.9249 on October 29th, marking its highest point within the entire 90-day observation period, as confirmed by its “relative_position” of 1. This signifies that QQQ is currently exhibiting the strongest relative performance against SPY over the last three months provided. The data reveals a notable acceleration in the upward trend since mid-October, with the ratio posting consecutive daily gains. Previous local highs, such as the 0.902 level observed in mid-August and the 0.903 level in mid-September, which had previously acted as resistance, have been decisively breached. These former resistance zones are now likely to serve as potential support levels should a pullback occur. The ratio’s ability to consistently establish new highs further reinforces the strength of this underlying trend.
Examining the historical data points, the lowest ratio observed was 0.8834 on September 2nd, which establishes a significant historical support floor within this 90-day window. Given the current upward momentum and the substantial distance from this low, it is highly unlikely for the ratio to retest this level in the immediate short term. The average ratio for the period stands at 0.8965, which could act as a dynamic mid-range support during any potential consolidation phases. The reported volatility of 0.0000727 suggests that while the ratio has made significant upward progress, its daily fluctuations have been relatively contained, indicating a somewhat orderly and persistent ascent rather than a highly erratic or jumpy movement.
Based on the predominant upward trend, the sustained creation of new highs, and the strong momentum evident in the recent data, the QQQ/SPY ratio is likely to continue its outperformance of SPY in the short to medium term. The current relative_position at 1, while bullish, also implies an extended move that might lead to a period of consolidation. Therefore, there is a roughly even chance of the ratio either continuing its immediate breakout towards higher levels or experiencing a modest, short-term pullback to test prior resistance-turned-support levels, such as the 0.90-0.91 range, before resuming its upward trajectory. A significant break below these newly established support zones, particularly the 0.8965 average ratio, would suggest a weakening of the current bullish sentiment and might indicate a shift towards a more range-bound or potentially bearish relative performance. However, without further data beyond the provided 90-day window, the primary technical indication points to continued QQQ strength relative to SPY.
Ratio Analysis: QQQ/SPY
Generated for 90days timeframe analysis
IWM vs. SPY
The analysis of the IWM/SPY ratio over the past 14 days reveals a likely shift towards relative underperformance of the Russell 2000 (IWM) compared to the S&P 500 (SPY). Initially, the ratio showed an increase from approximately 0.365 on October 9th to a peak of 0.376 on October 15th, suggesting a brief period where small-caps were outperforming large-caps. However, following this peak, the ratio entered a clear phase of decline, concluding the period at its 14-day low of 0.359 on October 29th. This consistent decline in the latter half of the observation window is a notable technical development, indicating a rotation away from smaller-capitalization stocks relative to their larger counterparts.
From the relative high on October 15th, the IWM/SPY ratio exhibited a pattern of lower highs and lower lows, which is a classic technical indication of a downtrend in relative strength. Key relative support levels for the ratio, such as the initial 0.365 level seen around October 9-10, were subsequently breached without significant recovery. The provided trend data confirms this, characterizing the current direction as “down” with a “weak” strength and a -1.68% change over the entire 14-day period. The final data point at 0.359 represents the absolute low for this specific observation window, reinforcing the near-term relative weakness.
Given the established relative downtrend in the IWM/SPY ratio and the current ratio being at the low end of the observed range, it is likely that the Russell 2000 will continue to underperform the S&P 500 in the immediate future, absent new information. The “weak” strength of this trend, however, implies that while the underperformance is present, it is not an aggressive or panicked decline. This provides a roughly even chance that the current rate of underperformance could stabilize or enter a period of consolidation, especially if the ratio finds relative support at these lower levels. A substantial reversal of this trend, leading to sustained outperformance by IWM, would be unlikely without a decisive move above recent lower highs, which are not currently in evidence within the provided data. The technical evidence points to continued large-cap leadership.
Technical Analysis: IWM/SPY Ratio (90-day)
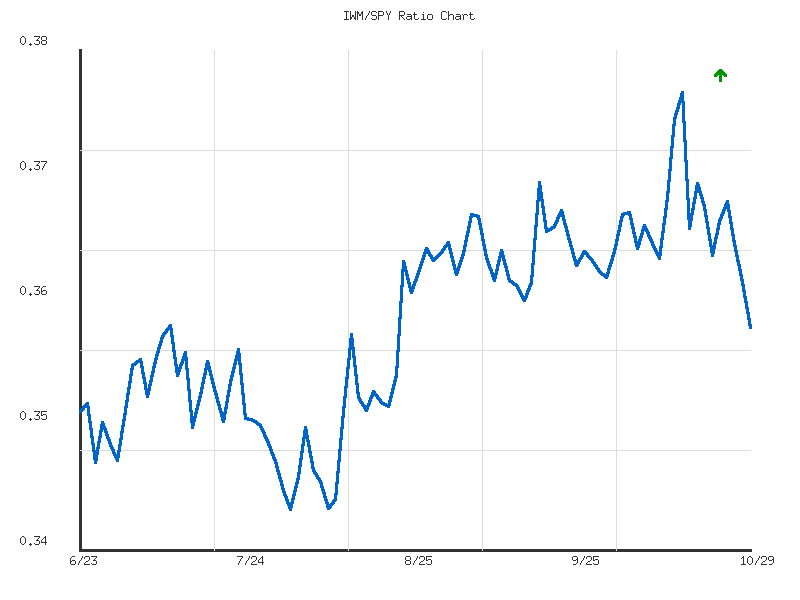
The IWM/SPY ratio, which measures the relative performance of the Russell 2000 (small-cap equities) against the S&P 500 (large-cap equities), has exhibited a weak upward trend over the observed 90-day period, increasing by approximately 1.77% from 0.3528 to 0.3590. This suggests a subtle, long-term favoritism towards small-cap outperformance within the provided timeframe. During this period, the ratio experienced a notable range, establishing a low point around 0.3456 on August 1st and subsequently reaching a peak of 0.3763 on October 15th. The current ratio of 0.3590 lies slightly below its 90-day average of 0.3593 and is positioned approximately 43.75% from its low, indicating it is currently in the lower half of its recent trading range. The volatility of the ratio, though numerically low at 0.00005, reflects the gradual nature of its movements.
A closer examination of the recent price action reveals a significant shift in momentum following the October 15th peak. After reaching its highest point at 0.3763, the IWM/SPY ratio has experienced a consistent and sustained decline, closing at 0.3590 on October 29th. This downward movement has erased a substantial portion of the gains from the preceding rally and has been characterized by multiple consecutive trading days where the ratio has fallen. This pattern indicates a short-term reversal, with large-cap equities (SPY) beginning to outperform small-cap equities (IWM). The strength of this recent pullback suggests that the previously observed weak upward trend has been temporarily interrupted, and a period of relative underperformance for small-caps is unfolding.
Considering the pronounced recent weakness, a continued decline in the IWM/SPY ratio in the immediate term appears likely. The ratio has broken below several minor support levels established during the September and early October consolidation phases. The next discernible support region appears to be around the 0.350 to 0.353 zone, which served as a consolidation area in mid-July and again briefly in early August. There is a roughly even chance that the ratio could test this prior support range in the coming days. A rapid reversal back to retest the recent high of 0.3763 is considered unlikely given the current downward momentum. While a retest of the 90-day low of 0.3456 is a more remote possibility without further aggressive selling, the prevailing technical signals suggest that large-cap outperformance is poised to continue in the near-term.
Ratio Analysis: IWM/SPY
Generated for 90days timeframe analysis
Commodities
| Symbol | Daily Percent Change |
|---|---|
| UGA | 1.849% |
| SLV | 1.241% |
| CPER | 0.656% |
| USO | 0.574% |
| DBC | 0.531% |
| CORN | 0.037% |
| GLD | -0.379% |
| UNG | -1.053% |
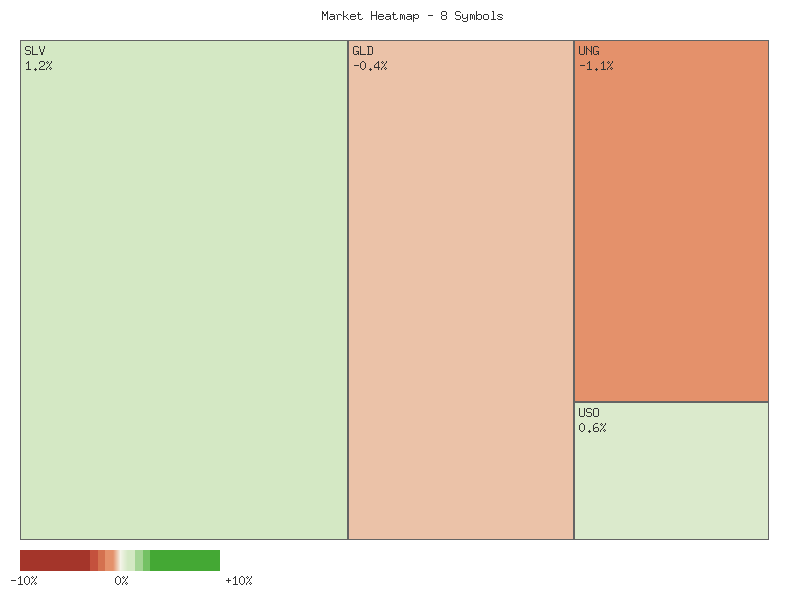
Analysis of the provided daily percentage change data reveals a predominantly positive, yet nuanced, market breadth for the observed commodity-linked assets. Six of the eight symbols (UGA, SLV, CPER, USO, DBC, CORN) registered gains, while two (GLD, UNG) experienced declines. This indicates a favorable market breadth, with advancing issues outnumbering declining ones by a three-to-one ratio. Given this distribution, it is likely that the overall sentiment within this specific basket of commodity ETFs was generally positive for the analyzed period, suggesting broad, albeit not universal, strength across these sectors.
Examining individual performances, UGA exhibited the strongest upward movement, advancing by 1.849%. This notable gain positions it as the clear outperformer for the day, suggesting significant bullish pressure in the gasoline market. SLV also demonstrated robust strength, gaining 1.241%, indicating a likely positive momentum in silver. CPER, USO, and DBC posted moderate gains ranging from 0.531% to 0.656%, which are constructive but do not necessarily imply strong directional conviction or breakout potential based solely on this single data point. CORN registered a minimal gain of 0.037%, essentially flat, suggesting a roughly even chance of either positive or negative movement in the very near term given the lack of clear momentum.
Conversely, GLD recorded a decline of -0.379%. This performance is noteworthy as it contrasts with SLV’s positive movement, a divergence that is not typical for these precious metals. This may indicate a slight rotation or distinct market drivers impacting gold compared to silver. It is unlikely to be a sustained trend without further corroborating data. UNG was the weakest performer, declining by -1.053%, which points to considerable downside pressure in natural gas and makes it the clear laggard among the group.
For retail traders considering these assets, the observed market breadth suggests that positive momentum was more prevalent than negative. However, the divergence between GLD and SLV, along with UNG’s pronounced weakness, highlights specific areas where caution may be warranted. While the majority of instruments advanced, it is unlikely that this single day’s data indicates a universally strong bullish environment across all commodities, especially considering the underperformance in natural gas. There remains a roughly even chance that the positive breadth could face resistance or reverse in subsequent sessions, emphasizing the importance of multi-day analysis for trend confirmation.
Here is a technical analysis of the provided market data for various commodity ETFs over the past two trading days, adhering strictly to technical analysis principles and estimative language guidelines.
An examination of the two-day candlestick data reveals a nuanced landscape across various commodity sectors, with distinct momentum shifts and areas of consolidation. UGA (Gasoline Fund) displayed robust bullish price action. On the first day, it formed a clear bullish candle with moderate volume. This was followed by a significantly stronger bullish candle on the second day, opening with a price gap higher and closing near its high, supported by notably increased volume. This pattern, coupled with the rising volume on the up-day, suggests that a continuation of upward momentum is likely for UGA in the immediate term. Conversely, UNG (Natural Gas Fund) exhibited clear bearish pressure. The first day closed near its low on high volume, indicating selling pressure. The second day saw a further decline, opening lower and closing near its low, albeit on slightly reduced volume. The sustained selling pressure and lower closing prices make a continuation of downward momentum likely for UNG.
The precious metals complex presented a mixed, yet predominantly cautionary, picture. GLD (Gold Fund) initiated with a strong bullish candle on the first day, closing near its high with good volume. However, the second day opened with a gap higher but then experienced significant selling pressure, resulting in a large bearish candle that closed well below its open and below the prior day’s close. This price action, particularly the wide range and the close near the low after a gap up, forms a strong bearish reversal pattern (potentially a dark cloud cover or bearish engulfing variant). Therefore, a period of downward pressure or consolidation for GLD is likely. SLV (Silver Fund) showed initial strength similar to GLD, with a bullish candle on the first day. The second day opened higher and traded to a new high, but strong selling pressure emerged, evidenced by a long upper wick and a close significantly off its high, although still above the prior day’s close. While not as definitively bearish as GLD, this pattern suggests that the upward momentum has stalled, and further significant upward movement without a period of consolidation or a retracement is unlikely. A roughly even chance exists for either sideways consolidation or a minor pullback in SLV.
Other commodity sectors show varying degrees of indecision or consolidation. USO (Crude Oil Fund) closed bearishly on the first day, near its low with good volume. The second day saw a slight bounce and an attempt to rally, but it ultimately formed a candle with a long upper wick, closing marginally above its open and very close to the prior day’s close, on slightly reduced volume. This suggests indecision after a down move. A clear directional continuation is unlikely, with a roughly even chance of further sideways action or a continued attempt at a bounce. CORN (Corn Fund) displayed very little directional conviction, with small body candles and declining volume over the two days. Its close on the second day was marginally higher than the first. This suggests that sustained directional movement is unlikely in the immediate term, with continued consolidation being likely.
Finally, CPER (Copper Fund) exhibited initial bullish momentum similar to precious metals, gapping up on the second day from a strong first day close. However, like SLV, it encountered selling pressure at higher levels, forming a long upper wick, though it still closed higher than the previous day. The volume on the second day was lower, suggesting diminishing buying conviction at the highs. While the overall trend for these two days remains slightly positive, the upper wick indicates that a period of consolidation is likely, and a direct continuation of strong upward momentum without a pause faces a roughly even chance against further range-bound trading. DBC (Diversified Commodities Fund) showed modest bullish price action on the second day, with a small bullish candle closing slightly above the prior day’s small bearish candle, on slightly increased volume. This suggests a minor upward bias but lacks significant conviction. A strong directional breakout from current levels is unlikely, and sustained sideways movement or minor upward drift is likely.
Performance Heatmap (SLV, GLD, CORN, CPER, USO, DBC, UGA, UNG)
Generated for 2days timeframe analysis
SLV Technical Analysis (90-Day View)
Over the past 90 days, SLV has exhibited a pronounced uptrend, moving from approximately .81 in late June to a peak of .33 in mid-October, representing a substantial appreciation of over 47%. This upward trajectory was characterized by distinct phases of bullish momentum followed by periods of minor consolidation. Notable price surges occurred in mid-July, late August, and particularly from late September through early October. Volume often expanded significantly during these rally phases, lending credence to the strength of the moves. However, the substantial increase in price culminated in an abrupt and sharp correction in mid-October, witnessing SLV shedding a significant portion of its gains.
Analysis of the 14-day Relative Strength Index (RSI) largely corroborated the price action throughout this period. During the primary uptrend from late August to early October, RSI consistently resided in or near overbought territory (above 70), peaking at an extreme of 84.32 on October 13th. Such sustained elevated readings, while indicative of strong buying pressure, simultaneously signaled an increasingly overextended condition, making a corrective phase highly likely. Indeed, the subsequent price decline from the October peak coincided with a precipitous drop in RSI, moving from overbought levels rapidly down towards the 50-mark, and momentarily dipping into the lower 40s during the sharpest selling on October 21st. The absence of MACD (13/21-day) data prevents a comprehensive momentum assessment from that indicator’s perspective.
The significant price decline in mid-October, particularly evident from October 17th to October 21st, was accompanied by exceptionally high trading volumes, including a record high of 110.43 million shares on October 9th (pre-peak) and 86.04 million shares on October 17th (start of major decline), along with 81.01 million shares on October 21st. Such elevated volume during a sharp downward move strongly suggests aggressive selling pressure, potentially institutional distribution or widespread profit-taking. Following this steep correction, SLV has shown signs of attempting to stabilize, trading in a range between approximately .23 and .93 since October 27th. The 14-day RSI has settled around 50.32 as of the last data point, indicating a roughly even chance in short-term momentum between buyers and sellers following the retracement.
Considering the recent price stabilization and the neutral positioning of the RSI, two primary scenarios emerge as possible in the immediate term. It is plausible that SLV may attempt to consolidate further around the current .00-.00 range, potentially forming a base for a subsequent rebound. For a renewed bullish impetus, a definitive break and sustained trading above the .00 resistance level, coupled with increasing volume and an RSI climb back above 55-60, would be required. Conversely, should the asset fail to hold current support, particularly if it closes below the recent low of .70 from October 27th, it is likely that selling pressure could resume. Such a move would raise the probability of SLV retesting lower support zones established during previous consolidations, potentially around the .00-.00 area, as the significant volume during the prior decline may not yet be fully absorbed.
SLV Price & Indicators (RSI_14_DAY, MACD_13_21_DAY)
As a Chartered Market Technician with over 15 years of experience, I’ve conducted a rigorous technical analysis of GLD based solely on the provided 90-day candle data and the 14-day Relative Strength Index (RSI). It is important to note that while the request specified MACD (13,21-day) data, this indicator was not present in the provided dataset and thus cannot be incorporated into this analysis.
GLD exhibited a period of relative consolidation through late June and July, largely trading within a range between approximately and . Volume during this initial phase was moderate, typically ranging from 6 million to 13 million shares. The RSI (14-day) broadly mirrored this price action, initially fluctuating between 40 and 55, indicating a neutral momentum profile. A discernible bullish trend began to emerge from late July, characterized by higher highs and higher lows, and this uptrend gathered significant momentum through August, September, and into mid-October, pushing GLD’s price from the low to a peak around .
The acceleration of the bullish trend from late August was particularly pronounced, characterized by a series of strong up days often accompanied by increasing volume. By early September, GLD’s RSI had moved well into overbought conditions (above 70), frequently registering readings above 75, and reaching as high as 87.33 on October 20. Such persistent overbought readings, while typically suggesting an eventual pullback, in this context, underscore the profound strength and conviction behind the rally. Elevated trading volumes, notably exceeding 15 million shares on several occasions during September and peaking at 61 million on October 17 and 34 million on October 20, further reinforce the robust demand that drove this extended advance.
Following its peak at .15 on October 20, GLD has experienced a sharp and significant reversal, closing at .00 by October 29. This represents a substantial decline over a short period. The RSI, which had peaked at an extreme 87.33 on October 20, experienced an immediate and steep drop to 60.02 on October 21, and has continued to fall, reaching 48.46 by the end of the provided data. This rapid deterioration in the RSI, moving from extreme overbought to neutral territory in just a few trading days, is a very strong indication of a dramatic shift in momentum from bullish to bearish. Furthermore, the decline was accompanied by exceptionally high selling volume, including 53 million shares on October 21, 30 million on October 22, and consistent volumes above 18 million on several subsequent down days. This substantial volume on the decline strongly suggests significant distribution and liquidation by market participants.
The immediate outlook for GLD appears bearish. The confluence of a sharp price decline, rapidly falling RSI, and high distribution volume makes a continuation of the downtrend highly likely in the short term. The price action on October 29, characterized by an open gap down from the prior day’s close, a lower high, and a lower close, further supports this view. A possible initial support level might be observed around the - area, given the clustering of previous price action around these levels in early October. However, given the intensity of the recent selling pressure, a test of lower support levels, potentially towards the - range, which previously acted as resistance in early October, is also likely. An alternative scenario, though less likely in the immediate term, would involve a short-term oversold bounce if the RSI were to dip into the low 30s or below, especially if accompanied by a significant decrease in selling volume. However, based on the current momentum and volume profile, further downside appears to be the more probable path.
GLD Price & Indicators (RSI_14_DAY, MACD_13_21_DAY)
Gold/Silver Ratio
The GLD/SLV ratio has exhibited an upward trend over the observed 14-day period, as explicitly indicated by the provided data. This trend, however, is characterized as “weak,” with a modest 2.73% appreciation from the start to the end of the data series. The relatively low volatility, recorded at 0.052, further corroborates the weak strength assessment, suggesting price movements have been gradual rather than aggressive. Despite the recent two-day decline, the ratio’s current level of 8.39 remains above its 14-day average of 8.36, which is an important technical consideration for short-term analysis.
A closer examination of the ratio’s movement reveals a clear progression. Following an initial dip to a 14-day low of approximately 8.00 on October 13, the ratio initiated a sustained rally, establishing a high of 8.65 on October 27. This upward trajectory confirms the underlying bullish bias that has prevailed through most of the specified timeframe. However, the two most recent data points show a clear retracement from this peak, with the ratio declining to 8.39 by October 29. This short-term pullback suggests a temporary exhaustion of immediate upward momentum following the establishment of the new high.
Given the current technical posture, it is likely the GLD/SLV ratio is undergoing a minor consolidation or retracement phase within its broader, albeit weak, uptrend. The current ratio’s position above the 14-day average of 8.36 suggests that the primary bullish structure remains intact, despite the recent selling pressure. There is a roughly even chance that the ratio could test the vicinity of its 14-day average (8.36) as a potential support level in the immediate future. A breakdown below the 8.00 low observed earlier in the period appears unlikely, given the established upward trend direction over the full 14 days. Conversely, a retest of the 8.65 high would probably necessitate a clear rebound from current levels and a renewed surge in buying pressure, which is not yet confirmed by the most recent price action.
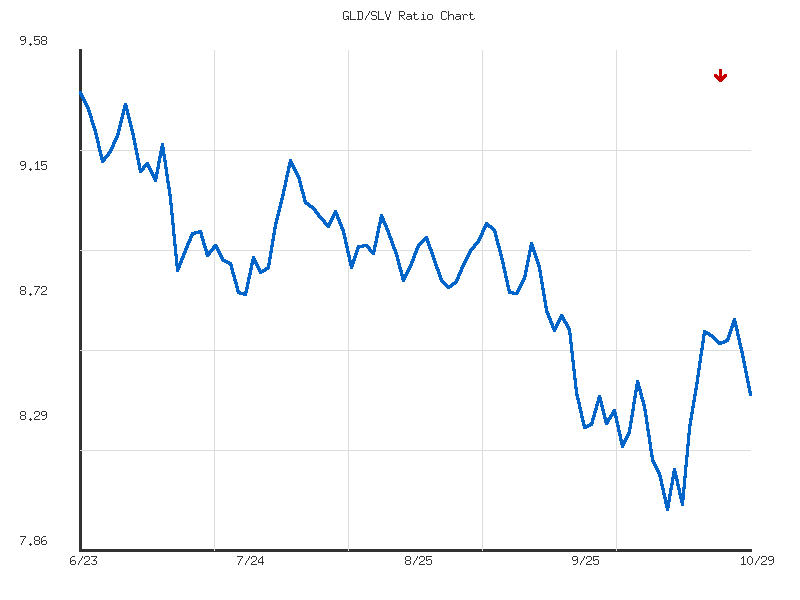
Technical Analysis: GLD/SLV Ratio (90-Day View)
The GLD/SLV ratio has exhibited a strong and persistent downward trend over the past 90 days, declining by approximately 11.03% from its peak of 9.4381 on June 23, 2025, to its current level of 8.3969 as of October 29, 2025. This sustained decline indicates a consistent pattern of gold (GLD) underperforming silver (SLV) throughout the observed period. The current ratio stands significantly below its 90-day average of 8.7960, positioning it closer to the 90-day low of 8.0002 than to its high, which underscores the prevailing bearish sentiment. The relatively low volatility (0.1072) suggests that this trend has been orderly rather than characterized by sharp, erratic movements.
Initially, the ratio declined from its June high, encountering minor support around the 8.8-9.0 region in mid-July. Despite a brief attempt to rebound towards 9.2 in early August, the ratio failed to establish a higher high, reinforcing the nascent downtrend. Subsequent movements saw the ratio consistently forming lower highs and lower lows, which is a textbook characteristic of a bearish trend. Notable resistance zones developed around 9.2 in early August and later around 9.0 in late July and early August, which proved impenetrable for any sustained bullish movement. A series of attempts to consolidate or reverse were ultimately met with selling pressure, pushing the ratio further down.
The downtrend accelerated in late September, leading to a significant breakdown below prior support levels and establishing a new 90-day low of 8.0002 on October 13, 2025. Following this trough, the ratio mounted a rebound attempt, reaching a high of 8.6147 on October 21, 2025. This rally appears to have been largely driven by SLV experiencing a proportionally greater decline than GLD on that specific day, rather than robust strength in GLD. Subsequently, this rebound was met with considerable selling pressure, preventing a sustained recovery. The ratio has since retreated, making a lower high relative to its earlier declines, which is consistent with the ongoing bearish pattern. We judge it unlikely that this latest rebound represents a significant trend reversal given the strong rejection seen in the subsequent sessions.
Looking forward, the immediate critical support level to monitor is the 90-day low of 8.0002 established on October 13. A decisive break below this level would likely signal a continuation of the strong downward trend, with the potential for further significant underperformance of GLD relative to SLV. Conversely, if the 8.0002 level holds, there is roughly an even chance that the ratio could attempt to consolidate within the 8.00 to 8.4 range, or possibly retest the immediate resistance area around 8.5-8.6. However, overcoming this recent resistance, particularly the October 21 high of 8.6147, appears unlikely in the near term, given the current strong bearish momentum indicated by the persistent lower highs and the overall trend direction.
Ratio Analysis: GLD/SLV
Generated for 90days timeframe analysis
Bonds
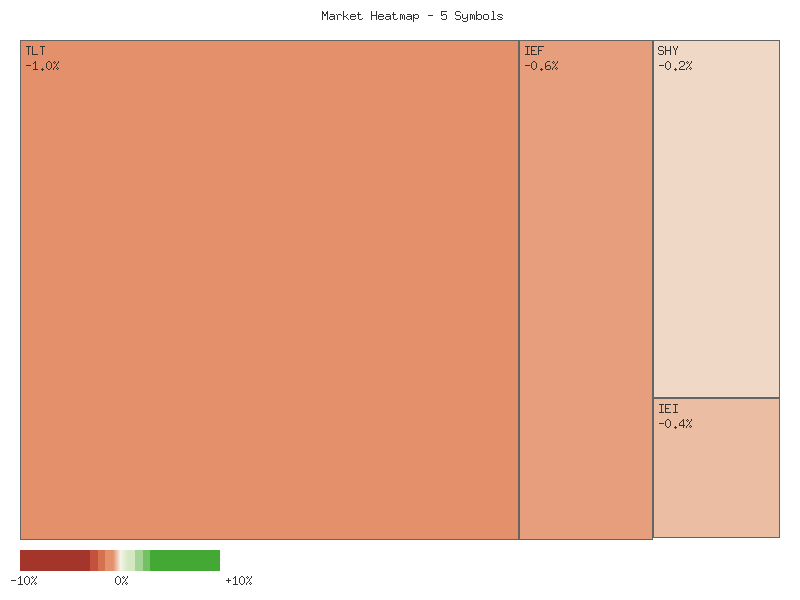
Based on the provided daily percent change data for various bond-oriented exchange-traded funds, a clear technical pattern of broad-based weakness is observable across the fixed income spectrum for the analyzed day. All five instruments—TLT, UTHY, IEF, IEI, and SHY—registered negative daily returns. The following matrix illustrates the performance sorted in descending order:
| Symbol | Daily Percent Change |
|---|---|
| SHY | -0.1986% |
| IEI | -0.4160% |
| IEF | -0.6456% |
| UTHY | -0.9792% |
| TLT | -1.0106% |
This data strongly suggests a technical environment where selling pressure was prevalent across bond durations. A noteworthy technical observation from this single day’s data is the evident differentiation in performance based on implied duration. Longer-duration instruments, such as TLT (tracking 20+ year Treasuries) and UTHY (ultra 20+ year Treasuries), experienced the most significant declines, falling by -1.0106% and -0.9792% respectively. Conversely, shorter-duration instruments, like SHY (1-3 year Treasuries) and IEI (3-7 year Treasuries), exhibited comparatively milder downturns, at -0.1986% and -0.4160%. IEF, representing intermediate-term Treasuries (7-10 years), positioned centrally with a -0.6456% decline, further reinforcing this duration-based sensitivity. The consistency of this pattern across all observed instruments makes it highly likely that the underlying market dynamics for this specific period exerted greater pressure on longer-dated fixed income assets.
The uniformly negative performance across the fixed income market, from short to long duration, implies a broad shift in technical sentiment for this trading day. The relative magnitudes of the declines, particularly the more pronounced weakness in the longer-duration segment, suggest that market participants were adjusting positions in a way that disproportionately affected longer-term bonds. This pattern, while confined to a single day’s data, is consistent with technical action typically seen when bearish pressures are dominant within the bond market. Based solely on this technical snapshot, it is likely that the observed selling pressure was pervasive rather than isolated to a specific duration segment, although its intensity varied.
However, drawing definitive long-term conclusions from a singular day’s price action is inherently challenging. While the immediate technical signals point to weakness and a clear duration-based impact, it is roughly an even chance that this represents either a temporary market adjustment or the initial phase of a more sustained downtrend. Without additional technical data, such as trading volume, historical price trends, or momentum indicators, it is not possible to determine the persistence or significance of this single day’s decline. Subsequent analysis of price action over multiple days, coupled with volume analysis, would be required to form more robust estimative judgments regarding future price direction and trend strength.
As a CMT with extensive experience, my analysis of the provided two-day market data for the listed Treasury ETFs indicates a likely shift toward short-term bearish sentiment across the fixed-income spectrum. All five instruments—SHY, TLT, UTHY, IEF, and IEI—exhibited a highly consistent and notably negative price action pattern from October 28th to October 29th, 2025. On October 28th, each ETF displayed generally constructive, bullish candles, closing near their respective daily highs and suggesting a positive momentum. This constructive action was, however, decisively reversed on the subsequent day.
The price action on October 29th presents a compelling bearish signal for each observed ETF. Following an open that was either flat or slightly above the previous day’s close, all instruments experienced significant selling pressure throughout the session, closing firmly near their daily lows. This creates a pattern strongly resembling either a Bearish Engulfing or a Dark Cloud Cover formation, depending on the specifics of the open relative to the prior day’s close. In all cases, the Day 2 bearish candle completely negated Day 1’s gains and, crucially, closed below Day 1’s low, indicating a strong rejection of higher prices. This uniformity across different maturity bonds suggests a broad, concerted move rather than an isolated event in one specific segment.
Volume analysis provides further insights into the conviction behind this two-day reversal. TLT and IEF, representing longer and intermediate-term maturities, experienced a substantial increase in volume on October 29th, with trading activity almost doubling compared to October 28th. This significant surge in selling volume lends considerable weight to the bearish price action, suggesting strong institutional participation in the liquidation. SHY and IEI also saw slightly increased or comparable volume on their bearish days, providing modest confirmation. The primary outlier is UTHY, which displayed a dramatic decrease in volume on its bearish day. While the price action remains unambiguously bearish, the significantly lower volume for UTHY makes it unlikely that this particular instrument’s move carries the same broad market conviction as TLT or IEF, possibly suggesting less widespread participation or instrument-specific dynamics.
Considering the collective evidence, it is likely that these Treasury ETFs will experience continued short-term downside pressure. The widespread bearish reversal, particularly when confirmed by increased volume in key long and intermediate-term segments, points to a prevailing negative sentiment among market participants. Traders should anticipate the potential for further price depreciation, with the recent lows serving as immediate support levels to monitor for breakdown.
Despite the strong bearish signal from the two days of data, it is crucial to recognize the inherent limitations of such a short timeframe. While a continuation of the downside is likely, establishing a sustained, long-term trend from merely two data points is unlikely. An alternative scenario, such as a short-term bounce or a period of consolidation, carries a roughly even chance if subsequent trading sessions show a significant reduction in selling pressure or a failure to breach the October 29th lows on heavy volume. However, based purely on the provided data, the immediate outlook for these Treasury ETFs remains decidedly negative, demanding caution from market participants.
Performance Heatmap (TLT, UTHY, IEF, IEI, SHY)
Generated for 2days timeframe analysis
Magnificent 7 & Friends
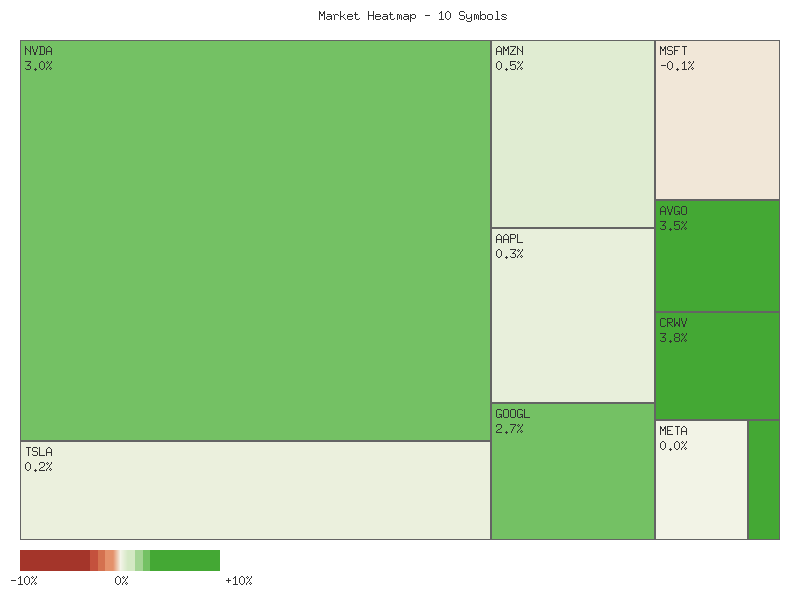
| Symbol | Daily Percent Change |
|---|---|
| CRWV | 3.806% |
| AVGO | 3.488% |
| ANET | 3.355% |
| NVDA | 2.990% |
| GOOGL | 2.655% |
| AMZN | 0.458% |
| AAPL | 0.260% |
| TSLA | 0.208% |
| META | 0.031% |
| MSFT | -0.096% |
The technical data presents a market snapshot dominated by positive daily percentage changes across a significant majority of the provided symbols. Out of ten observed equities, nine concluded the day with gains, suggesting a prevailing bullish sentiment within this specific cohort. CRWV, AVGO, ANET, NVDA, and GOOGL emerged as the leading performers, each registering gains exceeding 2.5%. CRWV, specifically, demonstrated the strongest upward momentum with a 3.806% increase, indicating likely robust demand during the trading session. This concentrated strength among a few names suggests an environment where capital is actively flowing into specific perceived growth or value areas, at least for this particular observation period.
Conversely, MSFT stands out as the sole laggard, recording a marginal daily decline of -0.096%. This minimal negative movement, while technically a decline, is of such small magnitude that it implies a roughly even chance of either a minor technical pullback within an existing trend or merely noise in the price action. The relative strength index (RSI) or moving average convergence divergence (MACD) for MSFT, if available, would be crucial to determine if this marks a nascent bearish shift or simply a temporary dip. Given the context of broad positive performance elsewhere, it is highly unlikely that this isolated, minor decline represents a significant shift in overall market sentiment based solely on this single data point.
The strong performance of CRWV, AVGO, ANET, NVDA, and GOOGL is particularly notable. Their substantial single-day percentage increases suggest a likely surge in buying interest, potentially indicative of breaking out from consolidation patterns or strong continuation of an existing upward trend. Without volume data or historical price series, it is difficult to definitively confirm these patterns, but the magnitude of these moves certainly points to strong positive price discovery. For example, an almost 4% gain like CRWV’s would typically require significant buying pressure, implying a strong short-term technical outlook.
The smaller positive movements observed in AMZN, AAPL, TSLA, and META (ranging from 0.031% to 0.458%) imply a more measured buying interest compared to the top performers. These more subdued gains could suggest consolidation phases or a less aggressive accumulation. It is highly likely that these stocks are either preparing for a larger move, or simply participating in the broader positive sentiment with less conviction. From a technical perspective, a consistent series of such modest positive closes, especially with rising volume (not provided), would typically reinforce underlying strength and increase the likelihood of eventual stronger upside momentum. Without additional data, however, definitive trend confirmation remains limited.
Market Technical Commentary: Two-Day Performance Analysis
The recent two-day trading period reveals a mixed landscape across the selected technology and growth stocks, with clear instances of bullish momentum, emerging bearish pressure, and pronounced indecision. A review of the candle data indicates a discernible shift in sentiment for several names, particularly evident through price action and volume characteristics. Overall, while some stocks exhibit robust upward trends, others suggest either impending reversals or a period of consolidation.
Specifically, Broadcom (AVGO) and Arista Networks (ANET) demonstrate strong bullish continuation. Both stocks recorded consecutive bullish closing prices near their respective daily highs, accompanied by increasing trading volume. This pattern, characterized by strong price appreciation and rising participation, suggests a high likelihood of continued upward momentum in the immediate short term. Alphabet (GOOGL) also presents a notably bullish pattern, with a strong Day 2 bullish engulfing-like candle closing near its high on significantly increased volume, indicating a likely bullish reversal from the prior day’s weakness.
Conversely, Microsoft (MSFT) is exhibiting persistent selling pressure. The stock posted two successive bearish closes near its daily lows, with Day 2 showing increased volume relative to Day 1, reinforcing the downward momentum. This pattern suggests a high likelihood of further price declines. NVIDIA (NVDA), after a robust Day 1 rally, gapped up on Day 2 but formed a bearish reversal candle, closing significantly off its highs on increased volume. This price action suggests a roughly even chance of a short-term top formation and potential retracement, as buying conviction waned at higher levels. Amazon (AMZN) likewise showed a gap up on Day 2 but closed with a long upper wick and below its open on higher volume, indicating that upward progress faced considerable resistance, making a sustained rally less likely without additional bullish confirmation.
Several other prominent names display patterns of indecision and consolidation. Apple (AAPL) and Meta Platforms (META) both closed with relatively tight daily ranges across the two periods, despite increased volatility and higher trading volumes on Day 2, evidenced by pronounced upper and lower wicks. This indicates a battle between buyers and sellers, resulting in a roughly even chance of either upward or downward resolution. Tesla (TSLA) showed a strong bullish Day 1, followed by a narrower range on Day 2, often referred to as an inside bar, with lower volume. While the long lower wick on Day 2 suggests support, the reduced volume points to a period of consolidation, with directional clarity unlikely without a break from this range. Finally, CrowdStrike (CRWV) presented a potential bullish reversal pattern on Day 2, forming a hammer-like candle after a bearish Day 1 close. However, the accompanying decrease in volume on Day 2 introduces some uncertainty regarding the strength of this potential reversal, suggesting a roughly even chance for either a continuation of selling or a nascent rebound.
Performance Heatmap (TSLA, MSFT, AAPL, META, NVDA, AVGO, GOOGL, AMZN, CRWV, ANET)
Generated for 2days timeframe analysis
S&P 500 Sector Breadth
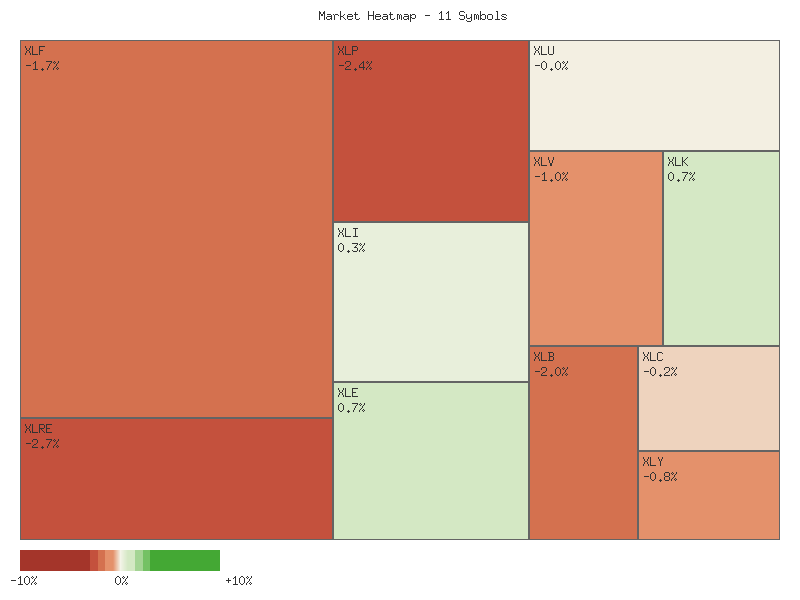
The market breadth on the given day indicates a decidedly negative bias, with eight of the eleven S&P 500 sector ETFs experiencing daily percentage declines. Only three sectors recorded positive gains. This substantial imbalance, where declining symbols outnumber advancing symbols by a ratio of more than two to one, suggests a broad underlying weakness in the observed market segment.
Analyzing the performance by sector classification reveals distinct patterns. Of the seven offensive sectors (XLK, XLY, XLF, XLI, XLB, XLE, XLC), three advanced: Energy (XLE) with +0.744%, Technology (XLK) with +0.719%, and Industrials (XLI) with +0.259%. The remaining four offensive sectors—Communication Services (XLC), Consumer Discretionary (XLY), Financials (XLF), and Materials (XLB)—all experienced declines. Notably, all four defensive sectors (XLU, XLP, XLV, XLRE) also posted negative performance, with Utilities (XLU) at -0.033%, Healthcare (XLV) at -1.011%, Consumer Staples (XLP) at -2.359%, and Real Estate (XLRE) suffering the largest decline at -2.728%.
The observed sector movements make a clear market rotation difficult to ascertain. A distinct rotation into offensive sectors is unlikely, given that a majority of offensive sectors declined, including key growth-oriented areas like Consumer Discretionary. Conversely, a rotation into defensive sectors is also improbable, as all defensive categories registered negative performance, with some experiencing significant losses. This pattern points to a generalized market softness where even traditional safe havens failed to attract capital, suggesting a broad risk-off tone without a corresponding flight to specific defensive assets.
Overall market sentiment, derived exclusively from this daily price action, appears predominantly negative. While the isolated strength in XLE, XLK, and XLI might suggest targeted buying in specific areas, the widespread declines across both offensive and defensive sectors, particularly the notable weakness in Real Estate and Consumer Staples, points to a prevailing cautious or bearish outlook among market participants for the observed period. The technical data does not provide a basis to conclude that a clear rotation strategy is underway; rather, it indicates general market weakness with specific pockets of resilience.
| Symbol | Daily Percent Change |
|---|---|
| XLE | 0.744% |
| XLK | 0.719% |
| XLI | 0.259% |
| XLU | -0.033% |
| XLC | -0.249% |
| XLY | -0.825% |
| XLV | -1.011% |
| XLF | -1.698% |
| XLB | -1.964% |
| XLP | -2.359% |
| XLRE | -2.728% |
As a CMT with extensive experience, my analysis of the provided two-day market data for these eleven select sector ETFs indicates a broad underlying technical weakness across several key areas, punctuated by a few instances of potential strength or indecision. The short-term price action, particularly on the second day, points to continued downward pressure for a majority of these sectors, largely confirmed by volume dynamics.
A notable bearish trend is evident in sectors such as Financials (XLF), Healthcare (XLV), Consumer Staples (XLP), Real Estate (XLRE), Consumer Discretionary (XLY), Materials (XLB), and Communication Services (XLC). XLF, XLV, XLP, and XLRE each display two consecutive bearish candles, with the second day showing a lower close and often a significant increase in trading volume, strongly indicating continued selling pressure. Specifically, XLP’s second day saw volume more than double alongside a substantial price decline, making further downside highly likely. Similarly, XLF and XLV exhibited clear bearish continuation with increased volume, suggesting that further price depreciation is likely. XLRE also showed a strong downward move, despite a slight decrease in volume on the second day, making continued downside likely.
In XLY and XLB, the technical picture shifted decidedly bearish on the second day. XLY recorded a strong bearish reversal on higher volume, effectively negating the minor bullishness from the prior day and making further downside likely. XLB displayed a strong bearish candle on significantly increased volume on the second day, opening lower than the previous day’s close and extending losses, which suggests that continued downward movement is likely. XLC likewise saw two bearish days with increased volume, indicating that further downside is likely, even if the second day’s body was relatively smaller.
Conversely, a few sectors demonstrated resilience or outright strength. Technology (XLK) presented a robust bullish continuation, with the second day opening higher and closing higher than the first day, accompanied by a significant increase in volume. This pattern makes continued upside for XLK highly likely. Energy (XLE) showed a bullish reversal on the second day; after a bearish first day, it opened slightly higher and closed significantly higher with increased volume, forming a bullish engulfing-like pattern that suggests further upside is likely.
The remaining sectors, Utilities (XLU) and Industrials (XLI), exhibit more ambiguous short-term technical signals. XLU’s second day was characterized by a very small candle body following a pronounced bearish day, suggesting a pause in the downward momentum. While volume increased slightly, the lack of a clear directional move creates a roughly even chance of either a minor recovery or continued consolidation, with strong downside continuation being unlikely in the immediate term. XLI, after a bearish first day, managed a small bullish close on the second day with significantly increased volume. However, the intra-day price action included a new low for the two-day period, and the bullish candle lacked strong conviction. This presents a roughly even chance of either a modest rebound or continued sideways consolidation, as a strong directional move is not clearly indicated.
Performance Heatmap (XLP, XLRE, XLI, XLU, XLV, XLY, XLF, XLB, XLE, XLC, XLK)
Generated for 2days timeframe analysis
XLY vs XLP
The XLY/XLP ratio, which compares the performance of Consumer Discretionary to Consumer Staples sectors, has exhibited a clear upward trend over the recent seven-day observation period. This ratio commenced at 3.016 on October 21st, dipped briefly to 2.976 on October 22nd, before establishing a consistent advance to close at 3.123 on October 29th. We assess this movement as a moderately strong upward trend, reflecting a 3.53% increase from its lowest point. The current ratio resides at the high end of this short-term range, indicating notable short-term momentum.
The consistent advance in the XLY/XLP ratio from October 22nd suggests a strengthening preference for growth-oriented sectors (Consumer Discretionary) over defensive sectors (Consumer Staples) within the observed timeframe. This pattern is often interpreted as an indicator of increasing investor risk appetite. The sustained daily gains observed from October 27th through October 29th reinforce the positive momentum, making it likely that the outperformance of XLY against XLP will persist in the immediate future, assuming no significant shifts in underlying sentiment within the next few trading sessions.
From a structural perspective, the low of 2.976 on October 22nd could be considered a short-term support level, while the closing high of 3.123 on October 29th represents the current resistance point for this specific dataset. The reported volatility of 0.00215 for this period is relatively low, suggesting a measured rather than erratic ascent in the ratio. This low volatility implies that the upward trend has been relatively stable, with less day-to-day fluctuation, which further supports the strength of the observed momentum.
While the current technical posture strongly favors continued outperformance of XLY relative to XLP, a seven-day data set represents a very short-term view. A retracement to test the 3.00-3.04 range is a plausible alternative scenario, particularly if the momentum were to wane and cause profit-taking. However, based solely on the provided data, a reversal of the established upward trend in the immediate term appears unlikely without additional technical signals of weakness such as a significant drop in the ratio or an increase in volatility on declining prices. We judge the technical evidence points to continued sector rotation into discretionary segments.
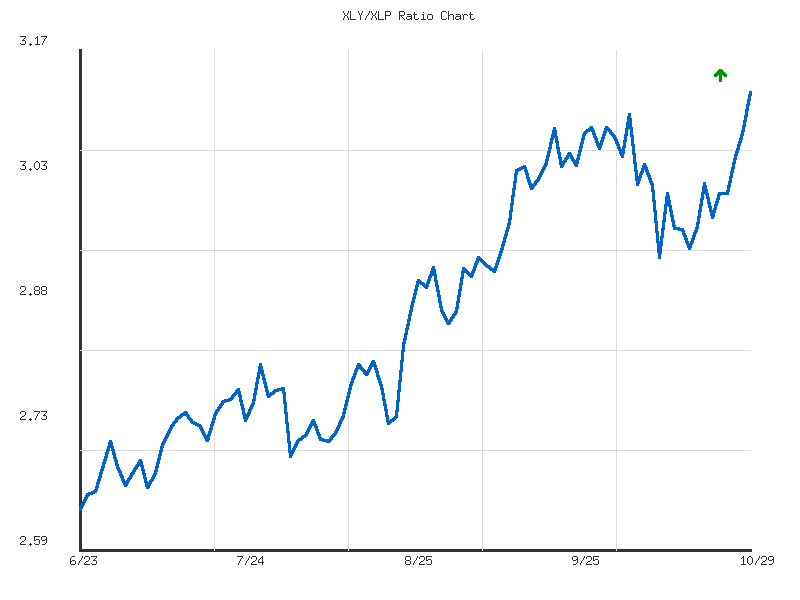
As a CMT with over 15 years of experience, I’ve conducted a rigorous technical analysis of the provided XLY/XLP ratio data over the 90-day period. This ratio serves as a vital indicator of market sentiment, reflecting the relative performance of Consumer Discretionary (XLY) versus Consumer Staples (XLP) sectors, often signaling an appetite for risk when rising.
The data unequivocally reveals a strong and persistent uptrend in the XLY/XLP ratio. Starting at 2.6339 on June 23rd, the ratio surged by an impressive 18.56%, culminating at its 90-day high of 3.1228 on October 29th. This consistent upward trajectory, characterized by higher highs and higher lows, confirms a clear technical preference for Consumer Discretionary stocks over Consumer Staples throughout the observation period. The ratio’s ability to close at its absolute peak for the 90-day timeframe is a significant technical signal, indicating robust momentum and strong conviction for continued outperformance of XLY relative to XLP as the period concluded. Based on this established bullish momentum, it is highly likely that XLY will continue to exhibit relative strength against XLP in the near future.
Technically, the trend’s strength is further supported by its relatively controlled ascent, as indicated by a volatility measure of approximately 0.02. This suggests a smooth, directional move rather than erratic price action. Intermediate support levels have been established through prior consolidation phases, notably around the 2.90-3.00 range, which previously acted as resistance. Following the recent breakout, these levels are now likely to serve as new support. The overall technical structure, from the foundational low of 2.6339 to the series of higher lows, paints a picture of a healthy, ascending trend, making a substantial reversal in the immediate term appear unlikely without a preceding period of consolidation or weakening momentum.
However, a closer examination of the final day’s activity provides a crucial nuance. The ratio’s close at its 90-day high on October 29th was primarily propelled by a notable decline in Consumer Staples (XLP), which fell from 78.43 to 76.58, while Consumer Discretionary (XLY) experienced a slight dip from 241.14 to 239.15. This suggests that the final surge in the ratio was less about XLY’s direct strength and more about a pronounced “flight out of safety” from XLP. While the prevailing strong uptrend strongly suggests continued risk-on sentiment, there is a roughly even chance that the ratio might experience a short-term consolidation or minor pullback. Such a scenario would likely test the newly established support levels, particularly if XLY itself does not resume its upward trajectory. A breakdown below the 3.00-3.05 support area would indicate a temporary pause in the current momentum, though the overall bullish structure of the ratio would remain intact as long as higher lows continue to hold.
Ratio Analysis: XLY/XLP
Generated for 90days timeframe analysis
Equity Breadth
The recent 7-day observation period for S&P 500 market breadth reveals a notable deterioration, particularly in the latter half of the timeframe. Initially, the percentage of S&P 500 members trading above their 50-day moving average (SPXA50R) displayed volatility, starting at 54.49% on October 21st, dipping to 49.30% the following day, then rebounding to a peak of 58.08% by October 27th. This upward movement for several days suggested a period of strengthening short-term bullish momentum. However, a significant reversal occurred, with SPXA50R sharply declining to 48.50% on October 28th, and further to 41.72% on October 29th. This swift contraction of over 16 percentage points in just two days indicates a very likely rapid and broad-based loss of short-term momentum across a substantial portion of the S&P 500 constituents.
Concurrently, the percentage of S&P 500 members trading above their 200-day moving average (SPXA200R), a gauge of intermediate-to-long-term breadth, also exhibited a weakening trend. This indicator began the period at 62.87% on October 21st and remained relatively stable, fluctuating narrowly between 60.68% and 61.88% through October 27th. This stability suggested that despite short-term fluctuations, a majority of S&P 500 components maintained a positive long-term technical posture. Nevertheless, SPXA200R experienced a notable drop to 57.09% on October 28th, followed by a substantial decline to 49.90% on October 29th. The breach of the 50% threshold on the final day of observation is a material technical development, making it likely that the intermediate-to-long-term health of the underlying index components is deteriorating.
The synchronized and accelerating decline in both the SPXA50R and SPXA200R indicators during the final two days of the period suggests a broad-based shift in market sentiment and technical positioning. The short-term breadth (SPXA50R) has moved decisively into bearish territory, while the long-term breadth (SPXA200R) has fallen below a critical equilibrium point, implying that the bullish trend is no longer supported by a majority of the index members. Given this widespread technical weakness, it is likely that the S&P 500 index itself may face sustained downward pressure or enter a period of increased volatility. An alternative scenario, where this severe breadth deterioration is quickly reversed, is unlikely without a significant external catalyst or a sharp shift in underlying price action, as the magnitude of the recent declines in both metrics points to a more systemic weakening of market structure. Monitoring these indicators for a potential bounce or further decay will be crucial in the coming days.
SPY Daily
Over the past 90 days, SPY has maintained a clear and robust upward trend. Price action consistently resides above both the rising 50-day Exponential Moving Average (EMA) and the 200-day EMA, signaling sustained bullish momentum across short and long-term horizons. The 50-day EMA has maintained a position above the 200-day EMA throughout this period, confirming the strength of this underlying uptrend. The 14-day Relative Strength Index (RSI) has largely remained above the 50-level, frequently venturing into overbought territory before healthy consolidations, which further underscores the prevailing bullish sentiment.
Focusing on the past 7 days, SPY experienced a significant acceleration in price, marked by several consecutive higher opens and closes. Price advanced from approximately 671.76 on October 23rd to 687.39 on October 29th. This upward movement was accompanied by consistent, moderate to high volume, suggesting conviction behind the buying pressure. On the final day, October 29th, SPY opened with a gap higher but formed a candle with a notable upper wick, indicating some intra-day profit-taking from the session high of 689.70 before closing at 687.39. Despite this, the close was still higher than the previous day. The RSI, which started the 7-day period around 58.73, has climbed steadily to 69.71, now hovering just below the traditionally overbought threshold of 70.
Immediate overhead resistance is likely situated near the recent high of 689.70 and the psychological 690.00 level. A sustained break above this zone would imply further upside potential. Conversely, immediate support appears to be established around the previous day’s close of 687.06, followed by the intra-day low of 682.87. More substantial support levels exist at the prior peak around 677.25 (October 24th close) and crucially, the rising 50-day EMA, currently near 660.09, which often acts as a dynamic floor in an uptrend.
For future price action, a bullish continuation is likely if SPY can decisively break above the 690.00 level with expanding volume, especially if the RSI manages to sustain above 70, indicating resilient momentum. However, a bearish scenario becomes a roughly even chance if SPY fails to consolidate above 685.00 and experiences a decline with increased selling volume, potentially leading to a test of the 50-day EMA around 660.00. A neutral case suggests SPY could consolidate sideways within the 682.87-690.00 range for several sessions, allowing the RSI to cool down from its near-overbought state without a significant price correction, which is a roughly even chance given the recent extended rally.
Sentiment, based solely on this technical data, appears predominantly bullish. The sustained uptrend and price action above key moving averages suggest persistent buying interest. However, the RSI nearing 70 and the upper wick on the last day’s candle, accompanied by elevated volume, imply that short-term sentiment may be shifting toward a more cautious stance, with a possibility of profit-taking becoming slightly more likely than continued aggressive buying without consolidation. This hints at emerging short-term equilibrium between buyers and sellers near current highs.
Here is a rigorous technical analysis of the provided SPY market data:
The SPY has displayed a persistent bullish trend over the observed 90-day period, characterized by a distinct pattern of higher highs and higher lows, climbing from approximately to nearly . The 14-day Relative Strength Index (RSI) has largely confirmed this upward momentum, frequently signaling periods of overextension. From late June through late July, SPY experienced a robust rally, with the RSI consistently residing in overbought territory (above 70), peaking at 74.51 on July 3rd and 75.58 on July 25th. This prolonged overbought condition was subsequently followed by a notable price pullback on July 31st and August 1st, during which SPY declined from a high of 639.85 to 621.72. The selling volume observed on August 1st was the highest within the dataset at over 140 million shares, indicating significant, albeit temporary, bearish pressure. This established a pattern where extended overbought RSI readings are likely to precede a short-term price consolidation or correction, allowing momentum to reset.
Following the early August correction, SPY entered a phase of consolidation before resuming its upward trajectory. Throughout August and early September, the RSI generally oscillated within a healthier range, mostly between 50 and 70, reflecting sustained but less overheated bullish momentum. However, a re-entry into overbought territory, with RSI peaking at 73.70 on September 22nd, once again preceded a minor price retreat and consolidation. A more significant technical event occurred on October 10th, when SPY experienced a sharp, high-volume decline from 673.95 to 653.02, with volume spiking to over 156 million shares—the highest in the entire dataset. This abrupt sell-off dramatically reset the RSI to 41.81. Remarkably, SPY demonstrated a strong recovery subsequent to this dip, steadily climbing back to establish new all-time highs within the provided data by late October. This rebound was accompanied by the RSI rising from the low 40s to its current level of 69.71 on October 29th, approaching overbought conditions once more.
The prevailing technical posture for SPY is unambiguously bullish, underpinned by the clear series of higher highs and higher lows over the 90-day window and the recent powerful recovery. Given the current price action establishing new highs and the RSI nearing overbought levels at 69.71, it is likely that the immediate bullish trend will continue. However, the proximity of RSI to the 70 threshold suggests a roughly even chance of either a continued breakout to even higher levels or a temporary pause or minor pullback, consistent with historical price behavior following similar RSI conditions within this dataset. Key support for any near-term correction is likely to be found around the 670-675 price range, representing prior consolidation zones and the rapid rebound point. A sustained break below the 670 level, especially if accompanied by elevated selling volume and the RSI dipping below 50, would be an early indication of a significant shift in momentum, suggesting a higher likelihood of a more substantial correction. Conversely, sustained price strength with RSI remaining above 70 could signal exceptionally strong buying interest, making further upward progression very likely.