Daily Market Technical Analysis
The market exhibits a notable divergence, with large-cap technology indices (SPY, QQQ) displaying robust bullish momentum, while small and mid-cap segments (IWM) are likely to face continued downside pressure. SPY is highly probable to extend its upward trajectory, though QQQ faces a roughly even chance of near-term consolidation due to RSI divergence. The commodity complex is predominantly bearish, with energy and gold likely experiencing sustained selling pressure, contrasted by a likely bullish trend in intermediate and longer-duration bonds. Among individual equities, NVDA and AVGO are highly likely to extend gains, while CRWV and GOOGL show likely bearish reversals. Overall equity breadth suggests continued short-term pressure, but the broader long-term market structure appears resilient.
Market Indices
Based on the provided daily percentage change data for the listed indices, the market exhibited a mixed performance across different market capitalizations.
| Symbol | Daily Percent Change |
|---|---|
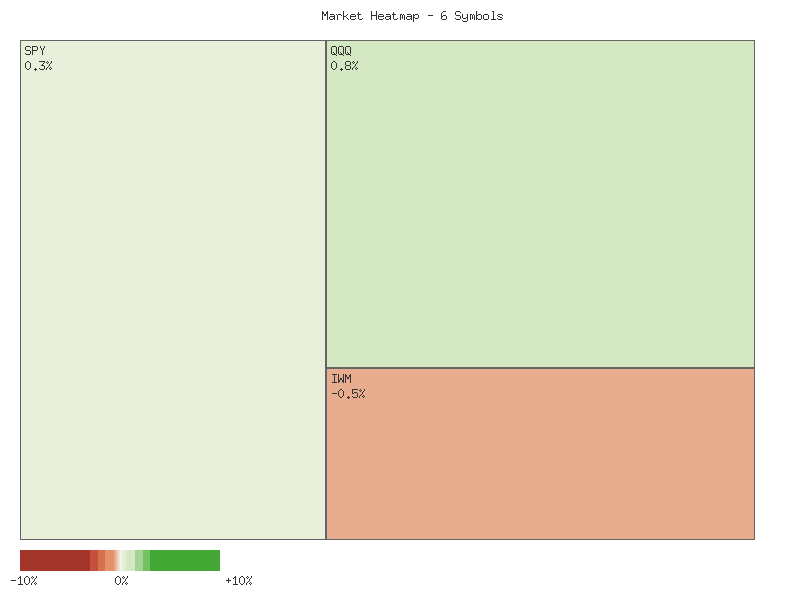
| QQQ | 0.7690% |
| OEF | 0.6238% |
| SPY | 0.2656% |
| IWM | -0.5354% |
| IJR | -0.5778% |
| MDY | -0.8780% |
Analyzing the market breadth from this specific dataset, we observe three advancing symbols (QQQ, OEF, SPY) and three declining symbols (IWM, IJR, MDY) out of the six tracked. This balanced count suggests a roughly even chance of a generally bullish or bearish sentiment dominating the overall market if we were to solely consider the absolute number of advancers versus decliners among these specific instruments. However, a deeper technical examination of the performance across market capitalization segments reveals a more complex dynamic.
The data indicates a clear divergence in performance based on market capitalization. The large-cap and technology-heavy indices, specifically QQQ (+0.7690%) and OEF (+0.6238%), demonstrated the strongest positive momentum for the period. SPY, representing the broader S&P 500, also advanced, albeit with less vigor (+0.2656%). In stark contrast, the small-cap and mid-cap segments experienced notable declines, with MDY (mid-cap) leading the retreat at -0.8780%, followed by IJR (small-cap growth) at -0.5778%, and IWM (Russell 2000 small-cap) at -0.5354%. This pattern of large-cap outperformance amidst small and mid-cap weakness is likely indicative of a selective flow of capital, possibly toward perceived safety or established growth in larger entities.
This technical pattern, where leadership narrows to larger capitalization segments while smaller ones lag, typically suggests caution. A market demonstrating this type of internal divergence is likely undergoing a period of re-evaluation, where investors may be concentrating capital in fewer, larger names. If this divergence persists, it is likely to create headwinds for broader market participation and overall strength. A broadening of market strength, where small and mid-caps participate or even lead, would be required to suggest robust underlying bullish momentum.
Considering alternative scenarios, if this pattern were to reverse in subsequent periods, with small and mid-caps beginning to outperform large-caps, it would indicate a broadening of market participation and likely signal renewed underlying strength. However, based purely on the provided daily data, such a reversal is currently unlikely. The present technical observation points to a market environment characterized by selective strength concentrated in larger capitalization segments, with weakness evident in the smaller components.
As a Chartered Market Technician with over 15 years of experience, my analysis of the provided two-day market data reveals a striking divergence in performance across various market capitalization segments. Over the observed period, large-cap indices, specifically SPY, QQQ, and OEF, exhibited clear bullish momentum characterized by upward price action and higher closes. Conversely, small-cap and mid-cap indices, represented by IWM, IJR, and MDY, displayed distinct bearish price structures with consecutive declines. This marked disparity suggests a short-term shift in market sentiment favoring larger capitalization equities, while smaller and mid-sized companies face downward pressure. Such internal market bifurcation is a critical technical observation, indicating underlying shifts in participant preferences.
SPY, representing the broader large-cap market, demonstrated two consecutive white candles. Yesterday’s session (Oct 28) gapped up from the previous close and maintained a higher close, high, and low compared to the prior day. While volume slightly decreased on the second day, the price action remains constructively bullish. QQQ, tracking the Nasdaq 100, exhibited particularly robust strength, forming two powerful white candles, both closing near their respective daily highs. The second day saw a significant upside gap and an increase in volume, which is often a strong confirmation of bullish momentum. OEF, tracking the S&P 100, mirrored this strength, also forming two consecutive white candles with higher closes, highs, and lows, accompanied by a notable increase in volume on the second day’s upward move. Collectively, it is highly likely that this large-cap segment will attempt to extend its upward trajectory in the very near term, barring an unforeseen reversal.
In stark contrast, the small-cap segment, as indicated by IWM, recorded two consecutive black candles. The second day (Oct 28) gapped down from the previous close and closed below the prior day’s low, signaling declining momentum on slightly reduced volume. IJR, representing small-cap growth, also showed two black candles, with the second day experiencing a gap-down and closing at a new low for the observed period. Importantly, the decline in IJR on the second day was accompanied by a significant increase in volume, lending credence to the bearish price action. MDY, tracking mid-cap stocks, presented a similar picture of weakness, forming two black candles. The second day’s candle was a strong bearish close near its low, with the high of the day failing to surpass the previous day’s close, despite a slight decrease in volume. Based on these patterns, it is likely that IWM, IJR, and MDY will experience further downside pressure in the immediate future.
The clear divergence between large-cap outperformance and small/mid-cap underperformance is a key takeaway from this two-day data. This pattern suggests a “flight to quality” or a rotation of capital towards larger, more established companies, or potentially a sign of waning risk appetite in the broader market. It is highly likely that large-cap indices, particularly QQQ and OEF, will continue to exhibit relative strength, while small- and mid-cap indices, especially IJR and MDY, are likely to face continued technical headwinds. An alternative scenario, though less likely given the current momentum and increasing volume in the stronger segments, would be a mean reversion where small-caps quickly regain footing. However, for such a reversal to occur, the smaller capitalization indices would need to establish clear bottoming patterns with supportive volume, which are not evident in the provided two-day data. The current technical landscape strongly favors continued large-cap leadership.
Performance Heatmap (SPY, QQQ, IWM, IJR, MDY, OEF)
Generated for 2days timeframe analysis
Technical Analysis of SPY (Past 90 Days)
The SPY ETF has exhibited a clear upward bias over the past 90 days, characterized by sustained rallies interspersed with sharp, yet generally brief, pullbacks. Examining the price action from late June, SPY advanced significantly, establishing a series of higher highs and higher lows. For instance, the price moved from approximately in late June to a peak near by late July. This robust uptrend was subsequently interrupted by a notable pullback around the end of July and early August, with SPY declining to approximately on August 1st. Following this, the price resumed its ascent, eventually reaching new highs near by late September. Another distinct sharp correction occurred on October 10th, where the price experienced a significant decline from around to , accompanied by a substantial increase in trading volume (over 156 million shares), suggesting a period of strong selling pressure. Since that October 10th low, SPY has engaged in a strong recovery rally, closing most recently at .06. This pattern suggests a resilient market, where dips are relatively short-lived and followed by renewed buying interest, driving prices to successively higher levels.
Analysis of the 14-day Relative Strength Index (RSI) largely corroborates the observed price dynamics. Throughout much of the 90-day period, the RSI consistently trended in the bullish zone, frequently entering overbought territory (above 70). Instances include early July (70.39 to 74.51), mid-July (69.83 to 70.96), late July (73.49 to 75.58), mid-September (70.55 to 73.70), and early October (71.17). These periods of elevated RSI typically coincided with strong price advances, underscoring robust momentum. The significant price pullbacks, such as the one on August 1st, led to the RSI dropping from overbought levels (75.23 on July 28th) to a more neutral position (47.66 on August 1st). Similarly, the sharp decline on October 10th saw the RSI plummet from 65.75 to 41.81. These instances highlight that momentum tended to reset from overbought conditions rather than entering oversold territory, which could be indicative of underlying strength. The most recent RSI reading is 69.51, indicating that momentum has surged back to the cusp of overbought conditions, reflective of the recent upward price trajectory.
Based on the provided data, the immediate technical posture for SPY appears to be bullish. The strong recovery rally from the October 10th low, accompanied by the RSI nearing overbought levels, suggests that upward momentum is likely to persist in the near term. It is highly probable that SPY could test and potentially break above recent highs established around the current levels, driven by this sustained buying pressure. However, given the RSI’s proximity to the overbought threshold, there is a roughly even chance of a near-term consolidation or minor pullback as momentum potentially eases. Should SPY maintain its upward trajectory, it would reinforce the established bullish trend. Conversely, a significant increase in selling volume during a price decline, particularly if the RSI were to dip notably below 60, might signal a more substantial momentum shift and potentially lead to a deeper correction.
In conclusion, the technical indicators and price action for SPY over the last 90 days strongly suggest an enduring bullish trend. The market has consistently shown an ability to recover from pullbacks and push to new highs. The current configuration, with strong upward price action and the 14-day RSI approaching overbought conditions, indicates a high probability of continued upward movement or at least a period of elevated price levels. Traders should be cognizant of the potential for a momentum reset should the RSI move into overbought territory, which historically has preceded consolidations or minor corrections rather than significant reversals in this data set. (Note: MACD data was requested but not provided for analysis in the market data section.)
SPY Price & Indicators (RSI_14_DAY, MACD_13_21_DAY)
Here is a technical analysis of QQQ based solely on the provided market data:
QQQ has exhibited a sustained bullish trend over the 90-day period under review, marked by a series of higher highs and higher lows. From a low of approximately 525 in late June, the price has ascended consistently, reaching 632.92 by the close of October 28th. This upward trajectory is particularly pronounced in the most recent weeks. Notable pullbacks occurred on August 1st, where QQQ dropped from around 570 to 553.88, and more recently on October 10th, experiencing a decline from approximately 611 to 589.5. Both of these corrections were accompanied by higher-than-average trading volumes (69.4M and 94.4M respectively), suggesting robust selling pressure during these events. However, the subsequent price action quickly found support and resumed its upward momentum, reaffirming the underlying bullish sentiment. The most recent three trading days show strong consecutive closes with increasing volume, indicating continued buying interest as the price approaches new all-time highs.
The 14-day Relative Strength Index (RSI) largely supports the bullish price action, frequently entering overbought territory (above 70) during periods of strong rallies. Specifically, the RSI registered overbought readings in late June/early July (peaking at 72.4 on June 30), mid-July (peaking at 71.77 on July 17), late July (peaking at 73.11 on July 28), and intermittently throughout September and October. A significant observation is the presence of a bearish divergence between price and RSI in the latter part of the data. QQQ reached a high of 602.2 on September 22nd with an RSI reading of 75.35. Subsequently, the price advanced to a new high of 632.92 by October 28th, yet the RSI concurrently registered a lower peak of 70.54. This pattern—a higher price peak coupled with a lower RSI peak—strongly suggests a waning in upward momentum, even as price continues to climb.
Given the established bearish divergence on the RSI, there is a roughly even chance that QQQ may experience a near-term price pullback or consolidation. The current overbought condition (RSI at 70.54) further increases the likelihood of such a scenario. Historically, previous instances of sustained RSI above 70 have frequently preceded short-term corrections, as observed following the late July peak (RSI dropped to 48.26 on August 1st) and the September 22nd peak (RSI dropped to 61.53 on September 25th). Should a correction materialize, initial support is likely to be found around the 590-595 range, which corresponds to the low established after the October 10th drop and prior consolidation levels. A more significant support zone, if the correction deepens, might exist around the 570-575 level, aligning with the August highs before the late August consolidation.
While a pullback or consolidation is a distinct possibility based on the RSI divergence, there is a low probability that the strong buying interest evident in the most recent price action could temporarily override this bearish signal. Should price continue to extend its gains without a significant correction, the RSI would need to register new higher peaks to negate the divergence. However, as it stands, the technical evidence points to an increased risk in maintaining the current steep ascent. A prudent technical perspective suggests that traders should prepare for an increased likelihood of either a sideways consolidation or a price correction in the immediate future. It is important to note that the requested MACD data was not provided, thereby preventing a comprehensive analysis of momentum through that specific indicator and limiting our understanding of potential trend reversals or accelerations it might have indicated.
QQQ Price & Indicators (RSI_14_DAY, MACD_13_21_DAY)
Technical Analysis of IWM (90-Day Horizon)
The price action for IWM over the past 90 days reveals a clear upward trend, characterized by periodic rallies, brief consolidations, and sharp corrections. From late June to early July, IWM experienced a notable advance, moving from approximately to . This ascent was accompanied by the 14-day Relative Strength Index (RSI) entering overbought territory, peaking above 71 on July 3rd, indicating a probable exhaustion of upward momentum. Following this, the price underwent a corrective phase in late July and early August, culminating in a significant decline to around on August 1st, a move reinforced by a spike in trading volume and the RSI dipping below 42. This confluence of high volume on a down-day and a rapidly declining RSI suggests a strong shift in short-term sentiment at that juncture.
Subsequent to the early August low, IWM initiated another robust rally, establishing a pattern of higher highs and higher lows through mid-September. Notable resistance was encountered around the level, observed on September 18th and 19th. During this period, the RSI consistently trended upwards, briefly touching overbought conditions above 71 on September 18th, aligning with the price peak and implying a potential for a short-term reversal or consolidation. Trading volume generally supported these upward moves, with notable spikes accompanying significant price advances, indicating accumulation. However, a lack of MACD data, despite being requested, prevents any assessment of momentum cross-overs or divergence signals from this indicator.
The most recent significant technical event occurred on October 10th, when IWM experienced a sharp price drop from .13 to .79, accompanied by an exceptionally high trading volume print of nearly 70 million shares. This substantial volume on a down-day, coupled with a precipitous decline in the 14-day RSI from above 60 to approximately 45, strongly suggests a significant wave of selling pressure. Historically, such sharp drops on heavy volume, especially following periods where RSI nears overbought territory, frequently precede further downward movement or a period of protracted consolidation.
Currently, IWM has rebounded from the October 10th low, reaching a recent high of around -. The 14-day RSI has recovered from its post-October 10th dip and is currently situated in the mid-50s, which is neutral territory. While the price has advanced, the RSI’s inability to re-enter overbought conditions during this recovery phase suggests that the bullish momentum driving this rebound is less assertive compared to earlier rallies in the observed 90-day period. It is therefore a roughly even chance that the current rally could consolidate or face renewed selling pressure, as the underlying momentum, as measured by RSI, does not currently support a continuation of the rapid upward trajectory seen in prior months. Should the price breach the recent support established around , it would be likely to test the October 10th low near . Conversely, sustained trading above on increasing volume would probably indicate a resumption of the broader uptrend.
IWM Price & Indicators (RSI_14_DAY, MACD_13_21_DAY)
VIX Fear Index
An analysis of the provided VIX data over the seven-day period from 2025-10-20 to 2025-10-28 reveals a dominant downward trend. The VIX initiated the period with an open of 20.53, subsequently declining to a low of 15.62 by 2025-10-27. This consistent bearish price action, marked by lower highs and lower lows, likely indicates a general reduction in market volatility and a potential increase in investor confidence throughout this timeframe. The overall price movement established a clear downtrend channel, with the VIX reaching its lowest point within this observation window on 2025-10-27.
Closer examination of the latter part of this period highlights a potential shift in momentum. On 2025-10-27, the VIX formed a small-bodied candle (open 15.73, high 16.07, low 15.62, close 15.79), resembling a Doji or Spinning Top near the established lows of the downtrend. This pattern probably signifies a period of indecision or a significant deceleration in the prior selling pressure at a potential support level around 15.62-15.79. The subsequent day, 2025-10-28, saw the VIX open higher at 15.95 and close strongly at 16.42, marking a daily gain of 3.99%. This positive close, following the indecision candle, likely suggests a resolution of market uncertainty to the upside, indicating a short-term bounce from the perceived support.
Based on these technical patterns, we judge that the VIX is likely to attempt a short-term rebound from its recent lows. The strong bullish close on 2025-10-28, directly following a period of consolidation and indecision, suggests that the immediate selling pressure has diminished. While a continuation of the prior downtrend remains an alternative scenario, it is less likely given the robust nature of the latest bullish candle and the successful defense of the 15.62-15.79 support zone. Initial resistance for this potential rebound appears to be situated near the 2025-10-24 high of 17.22, with a subsequent level around the 2025-10-23 high of 19.35.
A critical limitation in forming a high-confidence assessment is the complete absence of trading volume data, which is consistently reported as ‘0’ for all provided candlesticks. Volume is paramount for confirming the strength and sustainability of price movements and pattern validity. Without this confirmatory data, the conviction behind the observed short-term reversal signals is inherently reduced. Therefore, while price action alone suggests an upward bounce, the lack of volume confirmation introduces a significant degree of uncertainty regarding the conviction and potential longevity of this move.
Here is a technical analysis of the VIX based on the provided data:
The VIX has exhibited a broad consolidation pattern over the past 90 days, generally ranging between approximately 14.00 and 22.00, with occasional intraday excursions beyond these levels. After beginning the period in late June near the 20-21 handle, the VIX experienced a significant downtrend through July and much of August, reaching lows around 14.22 on August 22. Throughout September, the VIX largely traded within the 14.50-16.50 range. The current trading activity suggests that while there have been spikes in volatility, the VIX struggles to sustain levels above the upper end of this longer-term consolidation zone. Given the historical movement within this period, there is a roughly even chance that the VIX will continue to operate within this established range in the immediate future.
A notable surge in volatility occurred on 2025-10-10, with the VIX closing at 21.66 from a previous close of 16.43, marking a substantial increase. This elevated volatility persisted, with an intraday high of 28.99 on 2025-10-17, though the VIX ultimately closed lower at 20.78 on that day. However, following this peak, the VIX has subsequently declined over the past ten trading days, retreating from the 20-22 zone. The close on 2025-10-28 at 16.42 indicates a significant unwinding of the heightened volatility observed earlier in October. This rapid expansion and contraction pattern is characteristic of VIX price action, suggesting that extreme moves are unlikely to be sustained for prolonged periods.
Analysis of the 14-day Relative Strength Index (RSI) corroborates the VIX price action. The RSI was primarily in the neutral zone (between 40 and 60) for most of the 90-day period, indicating balanced momentum. During the significant VIX spike on 2025-10-10, the RSI reached a highly overbought reading of 73.09. This condition typically signals that an asset has been overbought and is due for a pullback or consolidation. True to this technical expectation, the RSI has since fallen substantially to 46.21 by 2025-10-28. This rapid decline from overbought territory into the neutral zone strongly suggests that the recent upward momentum has dissipated. It is highly probable that the VIX experienced exhaustion after its brief rally, making a swift retest of the October highs less likely in the immediate term.
In conclusion, the VIX has recently pulled back from elevated levels experienced earlier in October, with both price action and the RSI indicator supporting a return to more subdued volatility. The current VIX level of 16.42 on 2025-10-28, combined with an RSI of 46.21, points to a neutral momentum environment. There is a good chance that the VIX will stabilize within the 15.00-17.50 range in the near term, with a moderate probability of testing lower support around 15.00 or even 14.50 if the downward momentum continues. A renewed upward surge above 18.00 is less likely in the absence of a clear technical impetus, as the market appears to have digested the recent volatility spike. It is important to note that the MACD indicator data was not provided for this analysis, which could have offered additional insights into trend and momentum dynamics through signal line crossovers.
VIX Price & Indicators (RSI_14_DAY, MACD_13_21_DAY)
Tech Sector Analysis
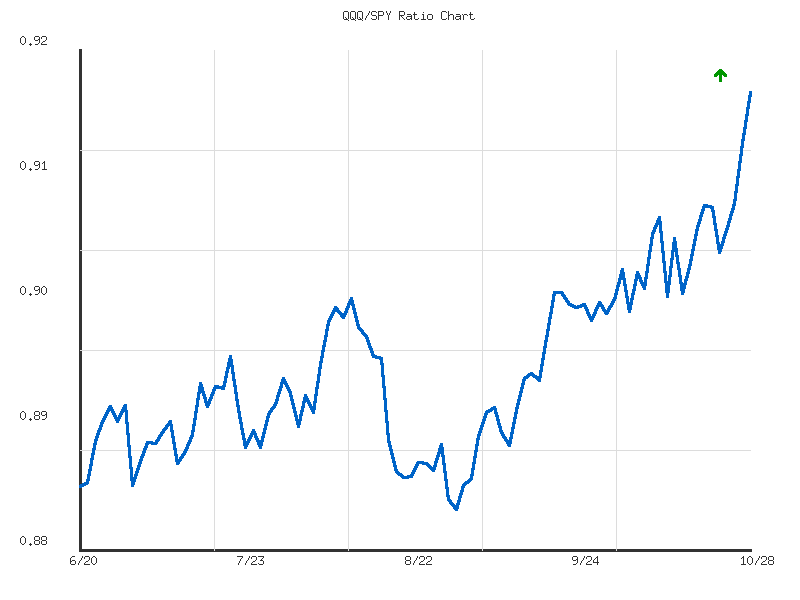
The relative performance of QQQ against SPY over the past 14 days indicates an upward trend. The QQQ/SPY ratio has increased by approximately 1.41% during this period, moving from a low of 0.9027 to its current high of 0.9212 on the last observed day. This upward trajectory signifies that the technology-heavy NASDAQ-100 (QQQ) has been demonstrating relative outperformance compared to the broader S&P 500 (SPY). The current ratio of 0.9212 stands above the 14-day average ratio of 0.9095, confirming that QQQ has maintained a stronger posture relative to SPY in recent trading sessions.
Despite the evident upward direction, the analysis of the trend object categorizes this strength as “weak.” This suggests that while QQQ is outperforming SPY, the momentum behind this relative strength is not particularly robust. The exceptionally low volatility of 0.0000222 further supports this assessment, indicating a gradual and relatively stable ascent in the ratio rather than a sharp, decisive breakout. Such low volatility combined with weak strength often implies a more sustained, but less aggressive, grinding upward movement, potentially lacking strong conviction from market participants to drive rapid shifts in relative performance.
Considering the data, there is a roughly even chance that QQQ could continue to exhibit modest relative outperformance against SPY in the immediate short term, primarily because the ratio currently sits at its highest point within the observed 14-day window. However, given the identified “weak” trend strength and very low volatility, there is also a nearly even chance of the ratio consolidating or experiencing a slight pullback in its relative performance. A weak trend suggests that the upward pressure might be insufficient to sustain rapid increases from the current elevated level, potentially leading to a period of equilibrium or minor mean reversion. A significant acceleration in QQQ’s relative outperformance appears unlikely without a noticeable increase in the trend’s strength and associated volatility from the current levels.
QQQ/SPY Ratio Analysis: A Strong Outperformance Trend
The QQQ/SPY ratio, representing the relative performance of the Nasdaq 100 versus the S&P 500, has exhibited a clear and consistent upward trend over the past 90 trading days, appreciating by approximately 4.03%. This robust increase unequivocally indicates that the Nasdaq 100 (QQQ) has been outperforming the broader S&P 500 (SPY) for the entirety of this analyzed period. The trend’s overall strength is characterized as “moderate,” suggesting sustained, rather than erratic, upward momentum. The ratio began around 0.8855 in late June, experienced a minor dip to its 90-day low of 0.8834 in early September, and has systematically climbed since then, marking a decisive series of higher lows and higher highs.
The ratio’s current value of 0.9212 represents its highest point within the analyzed 90-day window. This signifies that QQQ’s outperformance relative to SPY is presently at its peak for this specific period. Given this, it is highly likely that the upward momentum observed, particularly the accelerated ascent in October, will persist in the immediate term. The absence of historical resistance points within this specific dataset above the current ratio implies an open path for continued ascent based purely on these 90 days of technical price action. The relative position of 1 further reinforces that the ratio is at the top of its range for this period, indicating strong bullish sentiment for QQQ relative to SPY.
A critical support level for the QQQ/SPY ratio has been established near 0.8834, representing the lowest point reached during this 90-day period. While the ratio is currently trading well above this, any significant retracement would likely find initial support around the average ratio of 0.8961. A substantial reversal to breach the 0.8834 level is highly unlikely in the short term, given the prevailing strong upward trend and the current upward acceleration. However, following such a strong rally, a period of consolidation or a minor pullback towards the average ratio is a roughly even chance scenario. Such a pause could allow the ratio to consolidate recent gains before potentially embarking on another leg higher, maintaining the established outperformance trend. Traders should monitor for any short-term loss of momentum, which could signal a temporary pause in QQQ’s relative strength.
Ratio Analysis: QQQ/SPY
Generated for 90days timeframe analysis
IWM vs. SPY
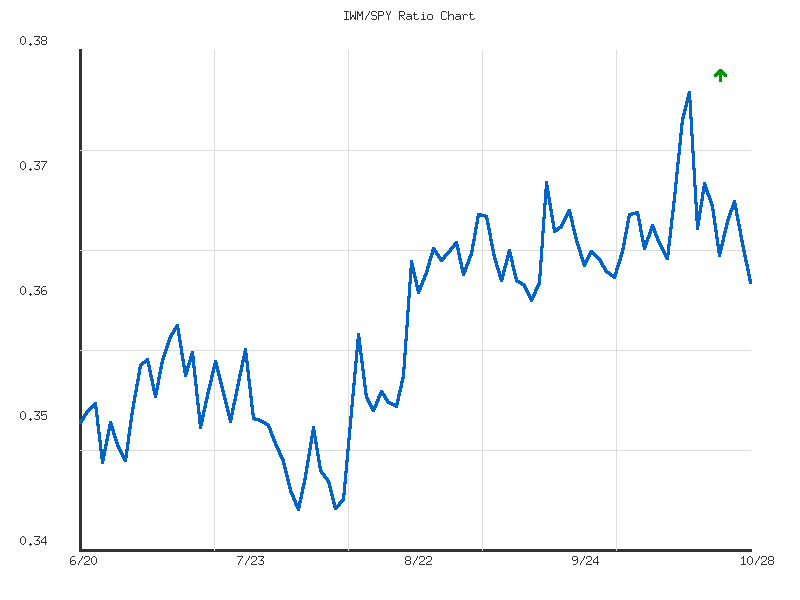
The RATIO:IWM/SPY, which gauges the relative performance of the Russell 2000 (IWM) against the S&P 500 (SPY), has displayed a clear downward trend over the observed 14-day period. This decline indicates that the S&P 500 has likely outperformed the Russell 2000 during this timeframe. The overall change percentage for the ratio registered at approximately -1.14%, reinforcing this pattern of SPY’s relative strength.
Reviewing the data points, the ratio initiated the period around 0.3665 before experiencing a brief uptick, reaching its peak at 0.3763 on October 15th. This particular instance marked the strongest relative performance for IWM within the 14-day window. However, this period of outperformance proved unsustainable, as the ratio subsequently entered a consistent downward trajectory, concluding at 0.3623 on October 28th. This current value represents the absolute low for the entire observation period, underscoring the recent dominance of SPY.
Despite the persistent decline, the embedded technical data classifies the trend strength as “weak.” This suggests that while SPY’s outperformance has been consistent, the shift in relative momentum has been gradual rather than aggressive. Furthermore, the exceptionally low volatility figure (0.0000137) confirms that the ratio has moved with minimal fluctuation, indicating an orderly and controlled adjustment rather than a sharp repricing of relative value. The current ratio of 0.3623 is notably below the 14-day average of 0.3675, reinforcing the recent underperformance of IWM.
Given the ratio’s current position at its 14-day low and the classification of the trend as weak, continued relative underperformance of IWM against SPY is likely in the immediate term, assuming current market dynamics persist. However, the weak trend strength and low volatility also imply that a period of consolidation or a modest rebound from this low has a roughly even chance of occurring, as the ratio might seek to stabilize after reaching an extreme within its short-term range. A robust, sustained reversal that pushes the ratio significantly higher from its current low is unlikely without new catalysts or a material shift in underlying market sentiment, which is not discernible from the provided data.
As a Chartered Market Technician with over 15 years of experience, I have analyzed the provided 90-day IWM/SPY ratio data with a focus on rigorous technical principles.
The IWM/SPY ratio, which indicates the relative performance of small-cap (IWM) to large-cap (SPY) equities, has exhibited an upward trend over the observed 90-day period, commencing near 0.352 in late June and concluding around 0.362 in late October. This constitutes a 2.93% increase in relative strength for IWM. However, we judge the trend strength to be weak, characterized by gradual, oscillating movements rather than aggressive, sustained advances. Throughout this timeframe, the ratio has established a clear trading range, with a significant low point observed at 0.3456 and a distinct high point at 0.3763. The current ratio, at 0.3623, is slightly above the 90-day average of 0.3592, suggesting that IWM’s recent relative performance is marginally better than its average over the last quarter.
A closer examination of the most recent price action reveals a critical shift in momentum. Following a strong upward move that began in early October, the ratio achieved its peak for the entire observation period at 0.3763 on October 15. This level is now established as a significant resistance point. However, the subsequent price behavior indicates a notable reversal, with the ratio experiencing a steady and pronounced decline over the past ten trading sessions, retreating to the current level of 0.3623. This sharp pullback from the peak suggests that substantial overhead supply became active at the 0.3763 level. We judge it highly likely that this level will act as robust resistance in the immediate future, with the failure to sustain a breakout above prior consolidation zones (e.g., around 0.367-0.370) into this new high raising concerns about the preceding bullish momentum.
The current ratio of 0.3623 is positioned at a crucial technical level. Historical data from early September and late September/early October indicates that the 0.361-0.362 zone has previously served as temporary support during pullbacks. Consequently, we assess there is a roughly even chance of the ratio finding support at this level once more. Should this immediate support hold, a rebound towards the 0.367-0.370 resistance zone is likely. However, a more significant support level for the entire 90-day period is situated around the 0.345-0.349 zone. If the 0.361-0.362 level fails to hold on a sustained basis, we judge it likely that the ratio would test lower support areas, potentially towards the 0.355 level, which previously acted as support in mid-August. A decisive breach below the 0.361-0.362 zone would suggest a short-term deterioration in IWM’s relative strength.
Given the weak overall trend strength, the clear rejection from the 0.3763 high, and the subsequent notable decline, we judge it likely that the IWM/SPY ratio will continue to exhibit either a period of consolidation or further downside pressure in the near term. A sustained breakout above the immediate resistance implied by the recent peak and preceding consolidation, specifically above 0.370, is currently unlikely due to the recent bearish reversal. While a bounce from the current support around 0.361-0.362 could occur, leading to another test of the 0.367-0.370 zone, a resumption of the prior rally without significant re-accumulation appears to be a roughly even chance, as the recent price action indicates potential exhaustion of the upward move. The prevailing technical environment favors a cautious approach, awaiting a clearer directional signal from the ratio’s interaction with key support and resistance levels.
Ratio Analysis: IWM/SPY
Generated for 90days timeframe analysis
Commodities
Here is an analysis of the provided daily market data for the specified commodity-focused ETFs.
| Symbol | Daily Percent Change |
|---|---|
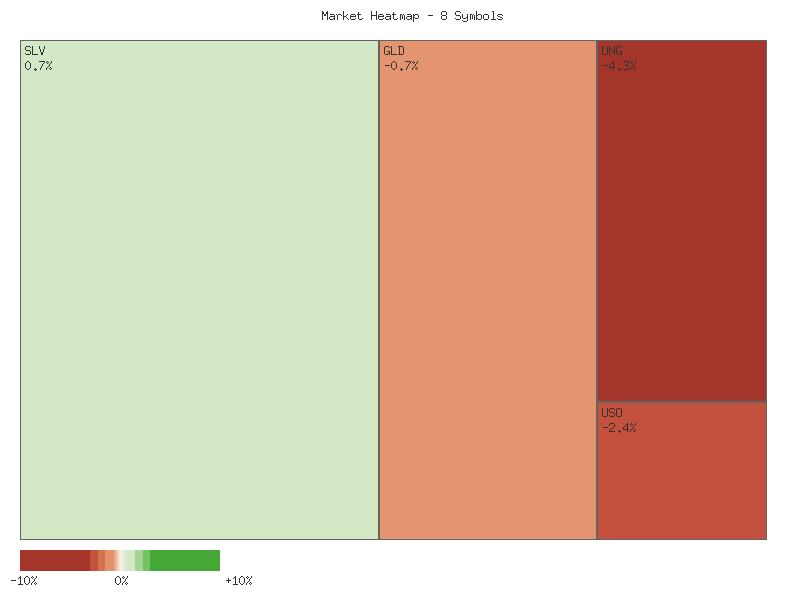
| SLV | 0.7075% |
| CPER | 0.2821% |
| CORN | 0.2238% |
| GLD | -0.7166% |
| UGA | -0.7507% |
| DBC | -0.9211% |
| USO | -2.3660% |
| UNG | -4.2669% |
The market data for the observed commodity ETFs indicates a predominantly negative session. Of the eight symbols analyzed, three recorded positive daily changes, while five experienced declines. This 3:5 advancing-to-declining ratio suggests a weak market breadth across this particular commodity basket, signaling that bearish sentiment was more widespread than bullish sentiment. The range of daily performance was substantial, from a gain of 0.7075% for SLV to a significant loss of -4.2669% for UNG, indicating considerable divergence within the commodity complex.
Focusing on the advancers, SLV (silver) demonstrated the strongest performance with a gain of 0.7075%, followed by CPER (copper) at 0.2821% and CORN (corn) at 0.2238%. The gains in these specific assets are modest in magnitude but suggest isolated pockets of strength. The relative strength in silver, a precious metal, contrasted with gold’s decline, is noteworthy. Similarly, industrial metals (copper) and agricultural commodities (corn) showed minor gains. However, given the number of decliners, it is likely that these individual positive movements are isolated rather than indicative of a broad up-trend in their respective sectors.
Conversely, the declining assets suggest broader weakness. UNG (natural gas) experienced the most significant single-day depreciation at -4.2669%, which is a strong indicator of considerable selling pressure in that specific commodity. USO (crude oil) also sustained a notable loss of -2.3660%. DBC, a diversified commodity index, fell by -0.9211%, implying a general drag across the broader commodity spectrum. Furthermore, GLD (gold) declined by -0.7166%, and UGA (gasoline) by -0.7507%. The concurrent decline in GLD alongside a gain in SLV is a pattern that sometimes suggests a nuanced shift in safe-haven or industrial demand within the precious metals space, although a single day’s data provides limited evidence for robust conclusions.
Considering the market breadth, the fact that five out of eight symbols closed lower implies that the prevailing sentiment for this group of commodities was negative. The overall average daily change for the basket is negative, heavily influenced by the substantial declines in UNG and USO. While there were some advances, the magnitude and number of declines suggest that participants were more inclined to reduce exposure or take profits in commodity positions for this specific trading period. It is roughly even chance that this negative breadth might persist into the next session for some of the weaker performers, particularly those with significant losses, though a single day’s observation limits the predictive power for sustained trends.
As a Chartered Market Technician with over 15 years of experience, my analysis of the provided two-day market data adheres strictly to technical principles and ICD-203 estimative language guidelines. This commentary focuses solely on the observable price and volume dynamics for SLV, GLD, CORN, CPER, USO, DBC, UGA, and UNG, without external context.
This two-day technical snapshot reveals a bifurcated sentiment across the commodity complex, with a notable preponderance of bearish price action, particularly within the energy and precious metals sectors. Several assets, including GLD (Gold), USO (Oil), DBC (Broad Commodities), UGA (Gasoline), and UNG (Natural Gas), concluded the two-day period with significant downward pressure. A common characteristic observed among these assets was a bearish gap down on the second day, followed by closes near their daily lows, suggesting a likely continuation of selling interest. The volume profiles, especially for USO and UNG, corroborate the conviction behind these downward movements, indicating that the supply side has been demonstrably dominant over this short-term horizon. Based purely on these patterns, a continuation of this bearish sentiment into the immediate future is probable for these specific instruments.
Delving deeper into the bearish formations, GLD exhibited two consecutive red closes, with a substantial gap down on the second day. While the second day’s candle was a smaller body green close, it remained significantly lower than the prior day’s close, indicating persistent weakness despite a marginal intraday recovery. The decreased volume on this second day might suggest some reduction in aggressive selling, but it does not negate the strong two-day decline; thus, further downside or consolidation at lower levels remains likely. USO and UNG presented particularly strong bearish signals, each recording substantial red candles, large gap downs, and closes at or near their respective daily lows on the second day. Both saw sustained or increased volume on the bearish day, reinforcing the conviction of sellers. UGA and DBC similarly displayed clear bearish continuation patterns, with UGA’s significant gap down and strong close on increased volume highlighting the probable dominance of sellers. For these energy-related ETFs, the technical picture over these two days is unequivocally bearish, suggesting continued downward pressure is probable.
In contrast to the prevalent bearishness, SLV (Silver), CPER (Copper), and CORN presented more varied or moderately bullish technical formations. SLV initially experienced a strong bearish day, followed by a bounce back on the second day to close higher than its prior day’s close. However, this recovery occurred on decreased volume and failed to reclaim the high of the first day, suggesting only a roughly even chance of a sustained bullish reversal versus a short-term technical bounce within a broader range. CPER, after a modest green candle on Day 1, gapped down on Day 2 but then rallied to close higher than Day 1’s close, forming what could be interpreted as a bullish engulfing signal. However, the decreased volume on this recovery day reduces the conviction of this pattern; a follow-through is possible but not highly probable without increased buying interest. CORN demonstrated the most consistent short-term bullishness, with two consecutive small green candles, a gap up on Day 2, and notably increased volume on the second day. While the candle bodies are small, the increased volume on the gap-up day suggests that upward momentum is likely to continue in the near term, albeit possibly at a measured pace.
Based on this two-day technical window, the market segments represented by GLD, USO, DBC, UGA, and UNG are facing probable continued selling pressure, characterized by bearish patterns, gap downs, and significant closes near daily lows. Traders should likely exercise caution or seek confirmation of reversals in these instruments. Conversely, CORN exhibits technical characteristics that make short-term upward momentum likely. SLV and CPER present more ambiguous signals; while some recovery efforts are evident, the lack of significant volume on their upward moves introduces uncertainty, suggesting roughly even chances of continuation, consolidation, or a reversal of the short-term recovery. Given the limited two-day data, these conclusions offer a high-probability assessment for the immediate subsequent session but are subject to rapid change with new data.
Performance Heatmap (SLV, GLD, CORN, CPER, USO, DBC, UGA, UNG)
Generated for 2days timeframe analysis
As a Chartered Market Technician with over 15 years of experience, I’ve conducted a rigorous technical analysis of SLV based exclusively on the provided 90-day candle and 14-day RSI data.
SLV displayed a robust bullish trend over the 90-day period, particularly from late August to mid-October. Prices advanced from approximately .02 (August 25th) to a high of .59 (October 17th), establishing a clear series of higher highs and higher lows. This uptrend was supported by increasing volume, with significant spikes on July 10th (44M), July 11th (57M), and exceptionally high volumes of 110M on October 9th and 86M on October 17th. The 14-day Relative Strength Index (RSI) confirmed this strength, consistently maintaining overbought status (above 70) from early September, peaking near 84.32 on October 13th. This extended period of high RSI suggested strong bullish momentum but also indicated the market was becoming increasingly overextended and vulnerable to a correction.
A sharp, high-volume reversal began in mid-October, marking a distinct shift in SLV’s trajectory. From the October 17th high of .59, the price sharply declined, closing at .99 that day and falling further to .79 by October 21st. These rapid declines were met with unusually high trading volumes (86M and 81M respectively), underscoring a sudden surge in selling pressure. The downtrend persisted, with SLV closing at .70 on October 28th. This quick deterioration from peak prices, coupled with elevated volume during the sell-off, strongly suggests a significant change in immediate market sentiment, shifting from extreme bullishness to pronounced bearish control.
Technical indicators confirm this bearish reversal. The 14-day RSI plummeted from its extreme overbought levels (above 80) in mid-October to below the neutral 50-mark, registering approximately 47.88 on October 28th. This decisive move below 50 indicates that bearish momentum has taken control. From a price action standpoint, immediate support is likely near the .70-.00 range, informed by the October 2nd low (.66) and the October 27th open (.97). A sustained break below this zone would likely expose the previous consolidation area around .50-.00 (late September), increasing the probability of further price erosion.
Considering the integrated technical evidence, it is highly likely that SLV is experiencing a short-term bearish correction. The aggressive price rejection from highs, supported by intense selling volume and the rapid collapse of RSI from extreme overbought to below neutral, strongly supports continued downside pressure. Traders should anticipate further declines in the near term. There is a roughly even chance of a temporary stabilization or weak bounce around the identified .70-.00 support. However, a quick return to recent highs is unlikely without a consolidation phase and a clear re-establishment of bullish momentum, neither of which is presently evident. A MACD analysis was not feasible due to the absence of corresponding indicator data in the provided dataset.
SLV Price & Indicators (RSI_14_DAY, MACD_13_21_DAY)
Market Commentary on GLD (90-Day Technical Analysis)
Over the past 90 days, GLD has exhibited a robust and prolonged uptrend, culminating in a significant multi-month rally from late August through mid-October. The price action during this period demonstrated consistent upward momentum, frequently making higher highs and higher lows, indicative of strong bullish control. Trading volumes generally trended higher during this ascent, suggesting increasing participation and conviction behind the move. The Relative Strength Index (RSI) with a 14-day lookback period corroborated this strong bullish phase, as it consistently remained in deeply overbought territory, often above 70 and frequently surpassing 75, from early September until mid-October, peaking above 87 on October 20th. This extended period of extreme overbought conditions signaled a potentially stretched market, where further upside momentum might become unsustainable.
The period spanning from October 21st to October 28th marks a decisive and rapid shift in market dynamics for GLD. Following its peak, the asset experienced a sharp and significant price decline. This downward movement was accompanied by exceptionally high trading volumes, particularly on October 21st, 22nd, 27th, and 28th, with volume figures noticeably exceeding the average levels observed during much of the preceding rally. Such elevated selling volume on a steep decline strongly suggests a substantial increase in supply and a significant shift in immediate-term sentiment from bullish to bearish.
The 14-day RSI provides critical confirmation of this reversal. On October 20th, the RSI reached an extreme reading of 87.33, signaling profound overbought conditions. Subsequently, it experienced a dramatic plunge, registering 60.02 on October 21st and falling further to 49.46 by October 28th. This rapid contraction from deeply overbought levels back into the neutral zone, coinciding with the sharp price drop and high volume, is a powerful indication that the upward momentum has decisively dissipated and that selling pressure has become dominant.
Based on the confluence of a sharp price decline from recent highs, exceptionally high associated selling volume, and the dramatic unwind of extreme overbought conditions in the RSI, a continuation of bearish price action in the immediate term is likely. The RSI, while having corrected significantly, has not yet entered oversold territory (below 30), implying that there is still room for further downside before traditional buying signals from this oscillator might emerge. An alternative scenario, where GLD consolidates or attempts an immediate recovery, is considered unlikely given the magnitude of the recent selling pressure and the volume profile that accompanied the reversal. Traders should be prepared for potential further depreciation as the market digests the recent, rapid shift in momentum. It is important to note that without access to the specific MACD line and signal line data points, a comprehensive MACD analysis cannot be provided.
GLD Price & Indicators (RSI_14_DAY, MACD_13_21_DAY)
Gold/Silver Ratio
The GLD/SLV ratio has established an observable upward trend over the past 14 trading sessions, albeit with weak indicated strength. The ratio experienced a significant swing within this period, beginning at 8.355 on October 8th, establishing a low of approximately 8.000 on October 13th, and peaking at roughly 8.655 on October 27th. This defined range, along with the observed 2.14% positive change, provides clear boundaries for near-term technical analysis, emphasizing the overarching upward trajectory despite its noted lack of momentum.
Following its peak on October 27th, the ratio experienced a pullback, closing the observation period at 8.533. This retreat from the 14-day high suggests that the 8.655 level is likely to function as a near-term resistance point, indicating potential difficulty for the ratio to sustain higher prices immediately. Conversely, the average ratio for this period stands at 8.363, which could offer intermediate support if the current correction continues. The previously established low of 8.000 represents a stronger, more established support level within this short-term observation window.
We judge there is a roughly even chance that the ratio will experience a period of consolidation or further downward correction in the immediate term. This assessment is based on the weak strength of the overall upward trend and the recent inability to sustain the 14-day high. A retest of the average ratio at 8.363 is likely in the short term, especially if the recent selling pressure persists. The probability of a direct and sustained push above 8.655 from the current level appears unlikely without a preceding period of consolidation or a retest of support. The observed low volatility of 0.0526 suggests that any upcoming movements, while potentially directional, may not be highly erratic.
An alternative scenario involves the ratio finding immediate support at its current level and moving higher. However, such a move would require a decisive close above 8.655 to negate the recent bearish price action from the high, which we judge as unlikely in the very near term. Conversely, a sustained break below the average ratio of 8.363 would substantially increase the likelihood of a retest of the 8.000 support. We assess that the current technical setup favors a period of slight weakness or sideways movement before any significant resumption of the prior upward trend becomes highly likely.
Greetings, retail traders. As a CMT with over 15 years of experience, I will provide a rigorous technical analysis of the GLD/SLV ratio based solely on the provided 90-day data.
The GLD/SLV ratio has exhibited a discernible downward trend over the observed 90-day period, characterized by a ‘moderate’ strength in its decline. From its initial data point, the ratio has depreciated by approximately 9.97%, indicating a notable underperformance of gold relative to silver during this timeframe. The ratio has traded within a defined range, establishing a 90-day high of 9.478 and a significant low of 8.000. Currently, the ratio stands at 8.533, which is below its 90-day average of 8.808. This consistent placement below the average reinforces the established bearish bias and suggests that silver has gained relative strength against gold over the past three months.
A closer examination of recent price action indicates that the ratio found notable support around the 8.000 level on October 13th, marking the 90-day low. Following this, the ratio initiated a modest rebound, reaching 8.448 by October 20th and briefly extending to 8.614 on October 21st. This upward movement appears to have encountered resistance, as the ratio subsequently retreated to its current level of 8.533. This current reading is situated above the recent 90-day low but remains below the brief recovery high from October 21st. The 90-day average of 8.808 is likely to act as a more substantial overhead resistance should the ratio attempt a more significant and sustained recovery from its current position.
Further technical insights are provided by the volatility and relative positioning metrics. The observed volatility of 0.110 suggests a moderate degree of price fluctuation, indicating consistent movement without extreme whipsaws during the period. More critically, the relative position of 0.360 for the current ratio confirms that it is trading in the lower third of its 90-day range, significantly closer to the established low of 8.000 than to its high of 9.478. This reinforces the technical picture of an established downtrend and implies that any substantial upward movements would probably face stiff resistance from prior swing highs and the historical average, making a full reversal less likely in the immediate term without a significant catalyst.
Based strictly on the provided technical data, a continuation of the moderate downward trend in the GLD/SLV ratio is probable in the near term. The 8.000 level is a critical support zone, and a decisive break below it would likely accelerate the downside momentum, indicating a more pronounced outperformance by silver. Conversely, a sustained rally above the 90-day average of 8.808 might signal a shift towards consolidation or even a potential trend reversal, but this scenario appears less likely given the current price action and relative position within the range. Traders should remain cognizant that a roughly even chance exists for the ratio to continue consolidating within its recent lower bounds, potentially between 8.000 and 8.614, before a clearer directional move emerges.
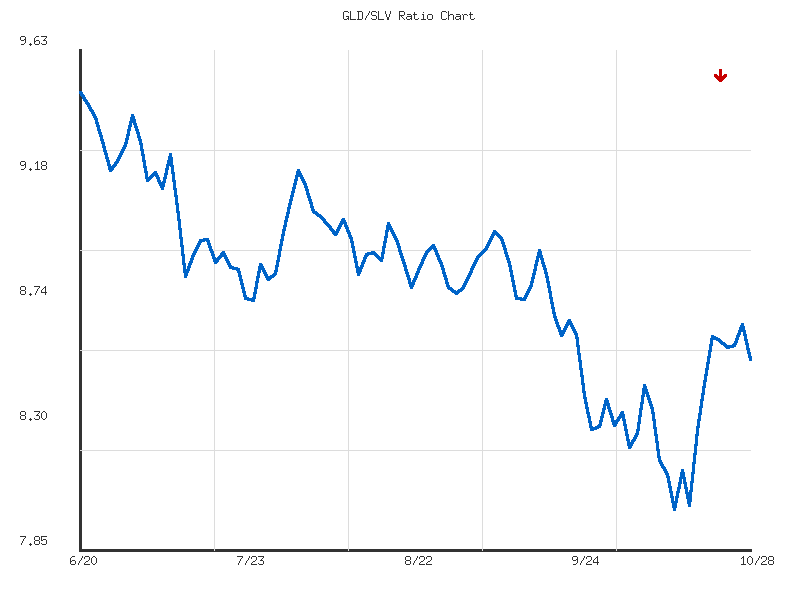
Ratio Analysis: GLD/SLV
Generated for 90days timeframe analysis
Bonds
An analysis of the provided daily percentage change data across the specified fixed-income instruments for the single observation day reveals a consistent positive movement across the board. All five instruments—TLT, UTHY, IEF, IEI, and SHY—registered gains. The relative performance, however, exhibited a distinct pattern, with longer-duration proxies generally outperforming shorter-duration ones. The daily percentage changes are summarized in the following matrix, sorted in descending order:
| Symbol | Daily Percent Change |
|---|---|
| UTHY | 0.3066% |
| TLT | 0.2615% |
| IEF | 0.0923% |
| IEI | 0.0499% |
| SHY | 0.0120% |
From this data, it is evident that UTHY and TLT, typically representative of longer-term fixed income exposure, posted the most significant positive movements, with UTHY leading at 0.3066% and TLT closely following at 0.2615%. Conversely, the instruments representing shorter-term exposure—IEF, IEI, and SHY—showed progressively smaller gains, culminating with SHY’s modest increase of 0.0120%. This pattern suggests a day of relative strength in the longer-duration segment of the fixed-income market compared to its shorter-duration counterparts. The consistent upward movement across all instruments, while positive, is generally of a modest magnitude.
Given the limitation of analyzing only a single day’s price action, drawing robust technical conclusions is challenging. The observed pattern of higher percentage gains in longer-duration instruments compared to shorter-duration ones on this specific day suggests a shift that is possibly indicative of declining yield expectations or increased demand for duration. However, it is unlikely that this single data point alone confirms a sustained technical trend. A series of similar daily closes, supported by volume analysis (which is not provided), would be required to establish a more confident assessment of market direction or rotational strength.
Considering alternative scenarios, there is a roughly even chance that this single day’s outperformance of longer-duration instruments could be an isolated event, with subsequent sessions showing a reversal or different leadership. The absence of historical context, volume data, or any other technical indicators (such as moving averages or momentum oscillators) precludes a higher-confidence assessment of predictive power. Therefore, while the snapshot shows uniform positive performance with a clear differential based on implied duration, further data is necessary to develop actionable technical insights beyond this singular observation.
Technical Analysis: Treasury Bond ETFs (TLT, UTHY, IEF, IEI, SHY) - Two-Day Review
Over the two-day period ending October 28th, the provided market data for the Treasury bond ETFs TLT, UTHY, IEF, IEI, and SHY generally indicates a bullish sentiment across various duration segments. All five symbols registered higher closing prices on the second day compared to the first, reflecting a consistent upward bias. The broad-based price action, characterized by consecutive higher closes, higher highs, and higher lows across most instruments, suggests that upward momentum was the dominant force. This uniform bullishness implies a general strengthening in bond prices during this short timeframe, although the conviction behind these moves varied by duration.
Examining the longer-duration ETFs, TLT and IEF, both displayed two consecutive bullish candles, with prices gapping up on the second day’s open relative to the prior day’s close. TLT closed at .78 on October 27th and .02 on October 28th, while IEF closed at .49 and .58, respectively. This pattern of higher closes, highs, and lows is typically indicative of an evolving uptrend. However, a noteworthy observation is the decreasing volume on the second day for both TLT (from approximately 30 million to 23 million shares) and IEF (from approximately 7.2 million to 5.5 million shares). This reduction in trading activity accompanying rising prices suggests that while upward momentum is present, its underlying strength might be moderating. Therefore, a continuation of this upward move is likely, but the decrease in volume introduces an element of uncertainty regarding the conviction behind further significant price advances. An alternative scenario of price consolidation or a minor pullback becomes a roughly even chance if volume does not increase to support higher prices.
Conversely, the mid- and shorter-duration ETFs, IEI and UTHY, presented a technically more robust picture of upward momentum. IEI saw its close advance from .13 to .19, supported by an increase in volume from approximately 1.7 million to 2.2 million shares. Similarly, UTHY closed higher at .2817 and .4144, accompanied by a substantial surge in volume, from approximately 7,500 to 36,700 shares. The combination of strong bullish candles and increasing volume strongly reinforces the bullish sentiment for these specific instruments. This suggests that the upward price action in IEI and UTHY is likely to continue in the immediate future, with the increased participation (volume) lending higher conviction to these moves compared to their longer-duration counterparts.
SHY, representing the shortest duration, exhibited a much tighter trading range and minimal price appreciation, moving from an .09 close to .10. Its price action on the first day was effectively a Doji, indicating indecision, followed by a small bullish candle on the second day. Volume remained relatively consistent, slightly increasing from 6.0 million to 6.1 million shares. This limited movement suggests that SHY is unlikely to experience significant price volatility in the immediate term, aligning with its typical characteristic as a very short-duration bond ETF. The pronounced difference in the magnitude of price change between SHY and the longer-duration ETFs underscores a clear duration-based preference among market participants, with stronger upward momentum observed in the intermediate and longer ends of the curve based on this two-day data.
In summary, the technical data for these bond ETFs over the two-day period broadly points to a bullish environment. We assess that further upward price action for UTHY and IEI is highly likely given their reinforcing volume trends. For TLT and IEF, while upward momentum is evident, the declining volume suggests that a continuation of robust price appreciation is likely, though the probability of a temporary consolidation or shallower gains increases. SHY is unlikely to break its tight range in the immediate term. Overall, the consistent higher closes across the board indicate a prevailing bullish sentiment for bonds, with varying degrees of conviction depending on duration and associated volume patterns.
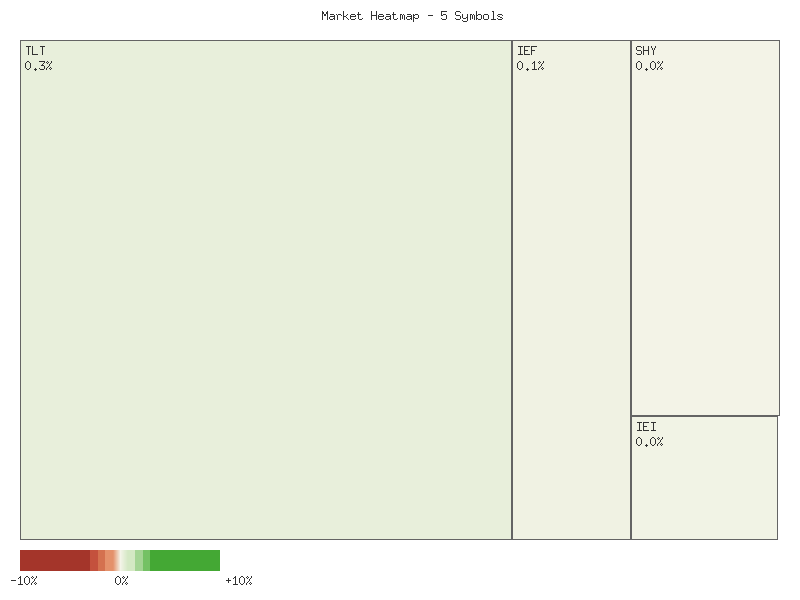
Performance Heatmap (TLT, UTHY, IEF, IEI, SHY)
Generated for 2days timeframe analysis
Magnificent 7 & Friends
| Symbol | Daily Percent Change |
|---|---|
| NVDA | 4.98% |
| AVGO | 3.02% |
| MSFT | 1.98% |
| TSLA | 1.80% |
| AMZN | 1.00% |
| META | 0.08% |
| AAPL | 0.07% |
| ANET | -0.03% |
| GOOGL | -0.67% |
| CRWV | -0.93% |
Based on the provided daily percentage change data, the market appears to exhibit a predominantly positive bias for the observed set of securities for the given period. We judge it likely that momentum is concentrated in specific technology and growth names, as evidenced by the substantial gains in NVDA (+4.98%) and AVGO (+3.02%). These two stocks demonstrate significant outperformance relative to the broader group, suggesting strong buying pressure or favorable short-term technical catalysts. MSFT (+1.98%) and TSLA (+1.80%) also exhibited robust positive movement, which suggests a continuation of positive sentiment within large-cap technology and innovative sectors.
Conversely, a subset of the analyzed stocks experienced declines. CRWV (-0.93%) and GOOGL (-0.67%) posted negative daily changes, indicating localized selling pressure or profit-taking within those specific equities. ANET’s negligible decline (-0.03%) suggests a relatively stable or consolidating price action, where neither buyers nor sellers demonstrated strong conviction for a significant move during the period. The minimal positive changes in META (+0.08%) and AAPL (+0.07%) suggest these stocks are largely treading water, exhibiting a neutral short-term technical posture, which could imply a roughly even chance of either a slight continuation or reversal in the very near term without further data.
Considering the disparate performance across the group, we assess it likely that sector-specific or company-specific drivers are at play, rather than a uniform market-wide trend. The significant positive outliers (NVDA, AVGO, MSFT, TSLA) could indicate an influx of capital into high-growth or established tech leaders, potentially reflecting positive market sentiment towards these segments. An alternative scenario is that these strong positive movements are merely short-term volatility spikes that may not represent sustained trends. Conversely, the declines in CRWV and GOOGL could be early signs of weakness, or simply minor corrections within broader uptrends that are not visible in this singular data point. Without additional technical indicators such as volume, relative strength, or historical price action over longer timeframes, it remains challenging to draw definitive conclusions about the sustainability of these individual movements.
As a Chartered Market Technician with over 15 years of experience, my analysis of the provided 2-day market data reveals a bifurcated technical landscape across these key assets. While a subset demonstrates strong bullish momentum and likely continuation, another group exhibits patterns of indecision or probable reversal, suggesting a cautious approach is warranted for specific names. All observations are strictly derived from the given price and volume data points, without external contextual considerations.
Several equities display robust bullish continuation patterns over the two-day period. NVIDIA (NVDA) exhibited exceptionally strong bullish momentum, characterized by a significant gap-up on the second day, a substantially higher high and close, and a nearly doubling of volume. This pattern makes further upward movement highly likely. Similarly, Broadcom (AVGO) showed clear bullish follow-through, opening slightly higher, achieving a much higher high, and closing near its peak on consistent volume, indicating a likely continuation of its upward trajectory. Microsoft (MSFT) also presented a strong bullish signal with a notable gap-up on the second day and a higher close, supported by increased volume. While the second day’s upper shadow might imply some resistance or profit-taking, an upward bias is highly likely. Amazon (AMZN) maintained a clear bullish trend with sequential higher highs, higher lows, and higher closes, alongside increasing volume, making continued gains likely. Tesla (TSLA) recorded two consecutive bullish days with higher highs and closes. However, the accompanying decline in volume on the second day suggests that while an upward bias is likely, the conviction behind this momentum might be weakening, making the probability of sustained strong gains less certain compared to other strong performers.
Conversely, some assets exhibit patterns indicative of indecision or probable bearish reversals. CrowdStrike (CRWV) displayed a highly likely bearish reversal. After a bullish first day, the second day opened higher and surged to a new peak, but then sharply reversed to close below the prior day’s close on substantially increased volume. This “shooting star” or “bearish engulfing” type pattern signals a probable shift to bearish sentiment. Alphabet (GOOGL) also showed a likely bearish reversal pattern. Its second day opened higher than the prior day’s close but reversed to close notably lower, effectively erasing the previous day’s gains on decreased volume. This indicates a probable shift towards bearish pressure in the near term.
Further into the indecisive category, Apple (AAPL) initially showed strong bullish action on the first day, but the second day was marked by a narrow trading range, a near-flat close relative to its open, and decreased volume. This suggests a roughly even chance of continued consolidation or a short-term pause. Meta Platforms (META) also presented a mixed picture. While Day 2 opened higher, it ultimately closed well off its high with a long upper shadow, despite a fractional gain from the prior day and slightly increased volume. This candle formation introduces significant uncertainty, indicating a roughly even chance of either a continued struggle against resistance or a potential bullish breakout if buyers regain control. Arista Networks (ANET) demonstrated a lack of clear conviction. Despite achieving a marginally higher high on day two, it also recorded a significantly lower low and closed effectively flat to the prior day, all on decreased volume. This indecisive action suggests a roughly even chance for its immediate directional bias.
In summary, the aggregated 2-day technical data presents a complex picture. Strong, high-conviction bullish trends are highly likely to persist for NVDA, AVGO, and MSFT, with AMZN also showing robust momentum. However, CRWV and GOOGL have generated patterns that make near-term bearish pressure likely. For AAPL, META, and ANET, the current data offers insufficient clarity for a high-probability directional forecast, suggesting roughly even chances for continued consolidation or a potential shift in either direction. Traders would be prudent to observe subsequent price action and volume closely to validate these nascent trends and reversals.
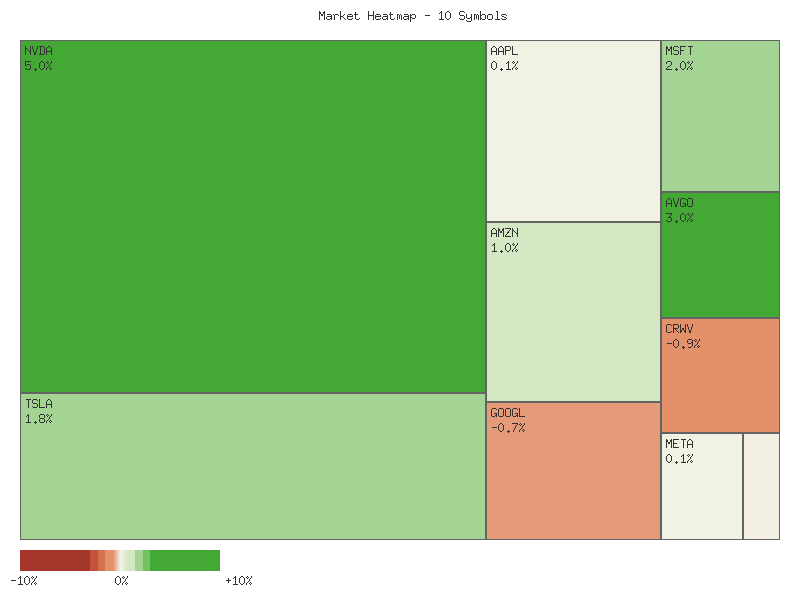
Performance Heatmap (TSLA, MSFT, AAPL, META, NVDA, AVGO, GOOGL, AMZN, CRWV, ANET)
Generated for 2days timeframe analysis
S&P 500 Sector Breadth
The market data for the eleven S&P 500 sectors on the specified day indicates a predominantly negative sentiment across the board, although with some notable outperformers. Of the eleven symbols analyzed, eight concluded the trading period with a daily percentage decline, while only three advanced. This observation yields a significantly negative market breadth, suggesting that selling pressure was widespread across various segments of the market. The ratio of declining to advancing symbols (8:3) implies that a substantial majority of the market’s components experienced downward momentum.
Delving into sector-specific performance, offensive sectors exhibited a mixed but ultimately net negative performance when considered broadly. Technology (XLK) was the strongest performer, advancing by 0.990%, followed by Materials (XLB) with a 0.135% gain, and Consumer Discretionary (XLY) with a marginal 0.025% rise. Conversely, other key offensive sectors experienced declines: Financials (XLF) fell by 0.638%, Industrials (XLI) by 0.712%, and Energy (XLE) by 1.042%. The uncategorized Communications Services sector (XLC) also declined by 0.495%. This split performance within offensive sectors makes it unlikely to conclude a uniform “risk-on” environment based solely on this group.
A critical observation regarding market rotation emerges from the performance of the defensive sectors. All four explicitly categorized defensive sectors, namely Utilities (XLU), Consumer Staples (XLP), Healthcare (XLV), and Real Estate (XLRE), recorded declines for the period. XLRE experienced the most significant drop at -2.223%, followed by XLU (-1.648%), XLP (-0.997%), and XLV (-0.629%). The uniform decline across all defensive sectors is a counterintuitive signal if a broad “risk-off” flight to safety were occurring. This pattern suggests that investors were not actively seeking shelter in traditional defensive plays.
Considering the combined evidence, the overall market sentiment is ambiguous, leading to a roughly even chance of interpretation. While the universal decline in defensive sectors might typically imply a “risk-on” appetite, the overall negative market breadth, with 8 out of 11 sectors declining, points toward general market weakness. The strength in specific offensive sectors like Technology, Materials, and Consumer Discretionary could indicate isolated pockets of bullish activity or targeted buying, rather than a broad embracing of risk. Therefore, it is unlikely that a clear directional consensus, whether broadly bullish or bearish, can be definitively inferred from this single day’s data alone.
Daily Percent Change Matrix:
| Symbol | Daily Percent Change |
|---|---|
| XLK | 0.990% |
| XLB | 0.135% |
| XLY | 0.025% |
| XLC | -0.495% |
| XLV | -0.629% |
| XLF | -0.638% |
| XLI | -0.712% |
| XLP | -0.997% |
| XLE | -1.042% |
| XLU | -1.648% |
| XLRE | -2.223% |
Here is a technical analysis of the provided market data:
A review of the provided two-day market data for eleven S&P 500 sector ETFs reveals a discernible shift in sentiment. The predominant pattern observed across many sectors points to increasing selling pressure and bearish reversals during the second day of the analyzed period. This general weakness is often accompanied by an increase in trading volume, suggesting conviction behind the price movements.
Several sectors exhibited clear bearish technical signals. XLRE (Real Estate) and XLU (Utilities) both displayed particularly strong bearish engulfing patterns on Day 2. For XLRE, Day 2 opened lower than Day 1’s close, experienced a significant price decline, and closed at its low, well below Day 1’s range, on substantially increased volume, making further downside highly likely. XLU similarly gapped up on Day 2, then reversed sharply to close near its low, completely engulfing Day 1’s bullish candle with increased volume, also indicating that further downside is highly likely. XLF (Financials), XLI (Industrials), XLV (Healthcare), and XLE (Energy) also presented strong bearish price action on Day 2. Each of these sectors closed significantly lower, often near their lows, and typically on increased volume, making a continuation of downward pressure likely for these segments. Furthermore, XLP (Consumer Staples) and XLC (Communication Services) also formed bearish reversal patterns on Day 2, closing significantly lower; further downside is likely for XLP, while for XLC there is a roughly even chance of further downside or sideways consolidation due to slightly decreased volume on the bearish day.
In contrast to the broad bearish sentiment, a few sectors offered different signals. XLK (Technology) stood out with continued bullish momentum. Day 2 saw XLK gap up, achieve a higher high and higher low, and close strongly near its high, consistent with Day 1’s bullish action. The relatively consistent volume further supports that continued upward movement is likely. XLB (Materials) showed slight upward bias, following an indecisive Day 1 with a small bullish candle on Day 2, though the narrow range suggests limited conviction. This makes a minor upward continuation slightly likely, but with a roughly even chance of sideways movement or a minor reversal if the broader market turns. XLY (Consumer Discretionary) presented a more ambiguous picture. After a bullish Day 1, Day 2 saw higher highs but a close essentially flat to Day 1, despite increased volume. This indicates a period of consolidation or indecision, suggesting a roughly even chance for either a continuation of its modest upward trend or a potential pullback.
Overall, the technical data points to a market environment where defensive sectors such as Real Estate and Utilities are experiencing significant selling pressure, a dynamic that can sometimes accompany broader market weakness. Cyclical sectors like Financials, Industrials, Healthcare, and Energy also appear to be under pressure. Technology, however, currently exhibits resilience and continued strength. Given the prevalence of strong bearish patterns and increased selling volume across multiple key sectors, a general market deceleration or pullback appears likely in the immediate term, with specific downside highly likely in XLRE and XLU, while XLK is likely to continue its upward trajectory. Traders should remain vigilant for follow-through in these established trends.
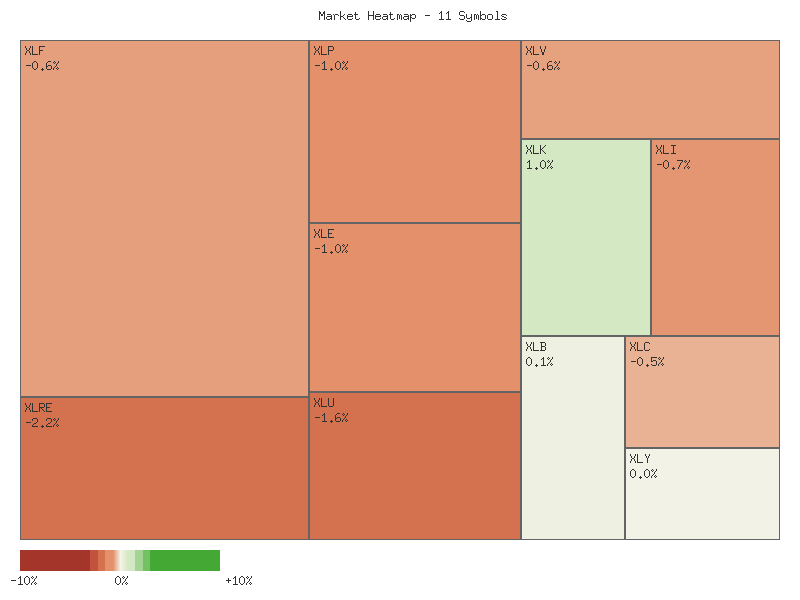
Performance Heatmap (XLP, XLRE, XLI, XLU, XLV, XLY, XLF, XLB, XLE, XLC, XLK)
Generated for 2days timeframe analysis
XLY vs XLP
The RATIO:XLY/XLP has demonstrated a moderate uptrend over the analyzed seven-day period, commencing October 20th and concluding October 28th. The ratio initiated at 2.9661 and concluded at 3.0746, marking a total increase of approximately 3.66%. This consistent upward movement indicates that the Consumer Discretionary sector (XLY) has been outperforming the Consumer Staples sector (XLP) during this specific timeframe. The current ratio stands at its highest point within the observed data series, signifying a strong closing momentum.
A closer examination of the underlying components reveals that the numerator, XLY, generally advanced from 236.28 to 241.14, while the denominator, XLP, experienced a slight decline from 79.66 to 78.43. This dual dynamic of rising discretionary performance coupled with diminishing staples valuation is the primary driver of the ratio’s ascent. The moderate strength of this trend, as indicated by the provided analysis, suggests an orderly rather than volatile shift in relative sector performance.
Given the consistent upward trajectory and the ratio closing at its 7-day high, it is highly likely that the relative strength of XLY against XLP will persist in the immediate short term. The absence of significant pullbacks within this period, combined with low volatility (0.0012), suggests a controlled yet firm establishment of the uptrend. This pattern often signals a preference for growth-oriented consumer segments over defensive ones, a sentiment potentially gaining traction.
However, interpreting a trend solely from a seven-day dataset necessitates a degree of caution. While the current technical posture is robustly bullish for the ratio, there is a roughly even chance that a period of consolidation or a minor pullback could occur before any further substantial advance. This potential short-term reversal would be a natural reaction to the continuous upward movement, particularly if XLY encounters overhead resistance or XLP finds short-term support. Nonetheless, the current data offers no technical signals suggesting an imminent reversal of the observed trend.
XLY/XLP Ratio Analysis: Sustained Consumer Discretionary Outperformance
The XLY/XLP ratio has exhibited a strong upward trend over the past 90 days, underscoring a notable outperformance of the Consumer Discretionary sector (XLY) relative to the Consumer Staples sector (XLP). Commencing at its 90-day low of 2.6126 on 2025-06-20, the ratio has consistently advanced, reaching its current level of 3.0745 as of 2025-10-28. This robust movement represents a significant increase of 17.68% across the observation period. The consistent formation of higher highs and higher lows throughout this timeframe reinforces the strong bullish momentum evident in this relative strength measure, signaling a clear technical preference for discretionary spending sectors.
Currently, the ratio is positioned near the peak of its 90-day range, with a relative position of 0.9535. This indicates that the current ratio is 95.35% of the way from its lowest to its highest point recorded during this period. The established high for this 90-day window stands at 3.0970, reached on 2025-10-06. The present ratio of 3.0745 is in very close proximity to this prior resistance level. Given this immediate overhead, it is likely that the ratio will encounter significant resistance as it attempts to move beyond the 3.0970 mark, potentially inviting profit-taking or a temporary pause in its ascent.
Considering immediate future scenarios, a decisive breakout above the 3.0970 resistance level is a plausible outcome, supported by the overarching strong uptrend. Such a move would affirm the continuation of the ratio’s upward trajectory, making it probable that new 90-day highs would be established. Conversely, there is a roughly even chance that the ratio could undergo a period of consolidation or a minor pullback from its current elevated levels, particularly if the 3.0970 resistance proves robust. Previous pullbacks have found intermediate support, for instance, around 2.9289 (observed on 2025-10-10). A more substantial support zone, derived from earlier price action and the average ratio of 2.8586, appears to be situated between 2.85 and 2.90. The observed volatility of 0.02038 suggests that while directional movements are strong, they are generally measured rather than sharply erratic, implying that any pullback is unlikely to be a severe, unprovoked reversal.
The overarching technical outlook for the XLY/XLP ratio remains firmly bullish, reflecting a persistent environment where Consumer Discretionary sectors maintain leadership. As long as subsequent pullbacks establish higher lows, the probability of an eventual upward resolution from current levels remains elevated. A confirmed breakout above 3.0970 would constitute a significant bullish signal, rendering further outperformance likely. Conversely, a sustained decline and close below the 2.90 support threshold would suggest a noticeable deceleration in the trend, introducing a roughly even chance of a more prolonged period of consolidation or a shift in the current relative strength dynamic. However, based solely on the provided data, a complete reversal of the dominant uptrend appears unlikely without additional technical deterioration.
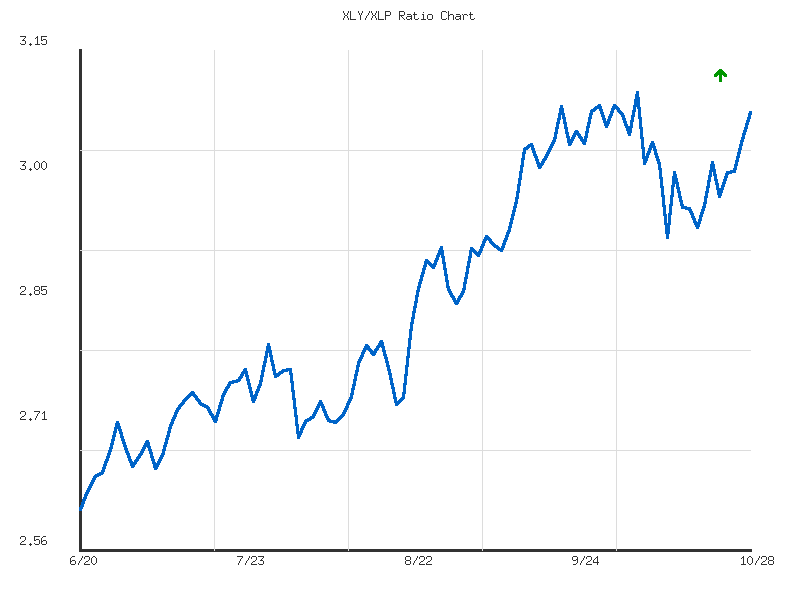
Ratio Analysis: XLY/XLP
Generated for 90days timeframe analysis
Equity Breadth
The SPXA50R indicator, which measures the percentage of S&P 500 members trading above their 50-day simple moving average, exhibited a notable shift over the observed seven-day period. Initially, the indicator showed strengthening breadth, advancing from 51.90% on October 20th to a peak of 58.08% on October 27th. This upward trajectory suggested expanding short-term participation and momentum across the index constituents. However, the most recent data point on October 28th registered a sharp decline to 48.50%. This rapid contraction below the 50% threshold indicates a material weakening of short-term market breadth and a loss of positive momentum for a significant portion of S&P 500 components. A near-term recovery in short-term breadth to previous highs is unlikely without a significant positive catalyst.
Concurrently, the SPXA200R indicator, representing the percentage of S&P 500 stocks above their 200-day simple moving average, demonstrated a more resilient, albeit similarly pressured, trend. Starting at 60.28% on October 20th, it peaked at 62.87% on October 21st before consolidating largely in the 60-62% range. On October 28th, this indicator also experienced a pullback, declining to 57.09%. While this is a notable single-day drop, the SPXA200R remains comfortably above the 50% mark. This sustained level above 50% suggests that the underlying long-term market structure retains a degree of strength, with a majority of S&P 500 components still maintaining long-term uptrends despite the recent short-term pressures.
The concurrent decline in both SPXA50R and SPXA200R on October 28th points to a broad-based, albeit varied, erosion of market breadth across both short and long-term timeframes. The sharp reversal in SPXA50R, pushing it below the 50% level, is a more immediately concerning technical signal, indicating a likely period of short-term consolidation or weakness. While the SPXA200R’s pullback is also noteworthy, its persistence above 50% implies that the long-term bullish bias for a majority of the index remains intact. A complete breakdown of the long-term trend is unlikely without further, more significant deterioration in the SPXA200R.
Considering these dynamics, it is likely that the market will experience continued short-term pressure or consolidation, given the sharp deterioration in short-term breadth as indicated by SPXA50R dropping below 50%. The relatively strong posture of SPXA200R suggests that any immediate weakness might represent a corrective phase within a broader, long-term positive environment. It is roughly even chance that this recent single-day decline is either a minor technical correction that could see breadth stabilize or recover in subsequent sessions, or an early indication of a more prolonged period of market softness. The divergent positions relative to the 50% threshold for the two indicators suggest that while short-term caution is warranted, the long-term foundation of the S&P 500 components does not appear to be immediately compromised.
SPY Daily
The price action for SPY over the past 7 days demonstrates a robust upward trajectory following a brief pullback. On October 22nd, SPY experienced a notable downturn, closing lower at 667.80 with elevated volume, which might have indicated a temporary shift in sentiment. However, this dip was swiftly negated by a strong bullish engulfing-like candle on October 23rd, initiating a pronounced rally. The subsequent trading sessions on October 24th and 27th were characterized by significant gap-ups and strong closes at 677.25 and 685.24, respectively, supported by robust trading volumes, reinforcing the conviction of the buyers. The most recent day, October 28th, saw SPY open higher at 687.05 and achieve an intraday high of 688.90 before closing slightly lower at 687.06. This last session exhibits continued upward momentum, though with some intraday resistance forming at the new highs, and slightly reduced volume compared to the preceding strong bullish days.
The overall trend, as indicated by the Exponential Moving Averages, remains unequivocally bullish over the 90-day period. The EMA_50_DAY is consistently above the EMA_200_DAY, and both are trending upward, signifying a strong long-term uptrend. SPY’s price is trading well above both moving averages, which is a classic technical confirmation of strength and sustained bullish momentum. The Relative Strength Index (RSI_14_DAY) has accelerated significantly, moving from approximately 55 to 69.51 over the last week, signaling substantial buying pressure and strong underlying momentum. While this level approaches the conventional overbought threshold of 70, it primarily reflects the recent aggressive price appreciation rather than an immediate reversal signal, though it does suggest the rally is becoming extended.
Immediate overhead resistance is established at the recent high of 688.90 from the October 28th session. The lack of prior discernible resistance levels within the immediate vicinity suggests SPY is trading in new territory. Looking for support, the previous day’s close at 685.24 is an initial minor level, while a more significant zone of support likely resides around the October 24th close of 677.25, coinciding with a previous gap-up area. Dynamically, the rising EMA_50_DAY, currently at 658.98, provides robust intermediate-term support, a level that has successfully anchored price movements during minor pullbacks throughout the observed period.
Considering future price action, a bullish case is likely. The prevailing strong uptrend, validated by the rising moving averages and consistent price action above them, coupled with recent strong buying momentum and constructive volume, suggests further upside is probable. A break above the 688.90 resistance could lead to an extension of the rally. Conversely, a bearish case holds a roughly even chance in the near term, mainly due to the accelerated rally and the RSI approaching overbought territory. This could trigger short-term profit-taking or a healthy correction. A definitive bearish shift would involve a sustained break below the EMA_50_DAY, which currently appears unlikely without a significant catalyst. A neutral case, also with a roughly even chance, might see SPY consolidate around current levels (685-689) as the market digests recent gains and the RSI potentially cools off without a substantial price decline. From a technical perspective, the overarching sentiment is highly likely bullish, driven by the persistent upward price action and strong trend indicators, though the high RSI might induce short-term caution among participants.
Technical Analysis of SPY (Past 90 Days)
The SPY ETF has exhibited a clear upward bias over the past 90 days, characterized by sustained rallies interspersed with sharp, yet generally brief, pullbacks. Examining the price action from late June, SPY advanced significantly, establishing a series of higher highs and higher lows. For instance, the price moved from approximately in late June to a peak near by late July. This robust uptrend was subsequently interrupted by a notable pullback around the end of July and early August, with SPY declining to approximately on August 1st. Following this, the price resumed its ascent, eventually reaching new highs near by late September. Another distinct sharp correction occurred on October 10th, where the price experienced a significant decline from around to , accompanied by a substantial increase in trading volume (over 156 million shares), suggesting a period of strong selling pressure. Since that October 10th low, SPY has engaged in a strong recovery rally, closing most recently at .06. This pattern suggests a resilient market, where dips are relatively short-lived and followed by renewed buying interest, driving prices to successively higher levels.
Analysis of the 14-day Relative Strength Index (RSI) largely corroborates the observed price dynamics. Throughout much of the 90-day period, the RSI consistently trended in the bullish zone, frequently entering overbought territory (above 70). Instances include early July (70.39 to 74.51), mid-July (69.83 to 70.96), late July (73.49 to 75.58), mid-September (70.55 to 73.70), and early October (71.17). These periods of elevated RSI typically coincided with strong price advances, underscoring robust momentum. The significant price pullbacks, such as the one on August 1st, led to the RSI dropping from overbought levels (75.23 on July 28th) to a more neutral position (47.66 on August 1st). Similarly, the sharp decline on October 10th saw the RSI plummet from 65.75 to 41.81. These instances highlight that momentum tended to reset from overbought conditions rather than entering oversold territory, which could be indicative of underlying strength. The most recent RSI reading is 69.51, indicating that momentum has surged back to the cusp of overbought conditions, reflective of the recent upward price trajectory.
Based on the provided data, the immediate technical posture for SPY appears to be bullish. The strong recovery rally from the October 10th low, accompanied by the RSI nearing overbought levels, suggests that upward momentum is likely to persist in the near term. It is highly probable that SPY could test and potentially break above recent highs established around the current levels, driven by this sustained buying pressure. However, given the RSI’s proximity to the overbought threshold, there is a roughly even chance of a near-term consolidation or minor pullback as momentum potentially eases. Should SPY maintain its upward trajectory, it would reinforce the established bullish trend. Conversely, a significant increase in selling volume during a price decline, particularly if the RSI were to dip notably below 60, might signal a more substantial momentum shift and potentially lead to a deeper correction.
In conclusion, the technical indicators and price action for SPY over the last 90 days strongly suggest an enduring bullish trend. The market has consistently shown an ability to recover from pullbacks and push to new highs. The current configuration, with strong upward price action and the 14-day RSI approaching overbought conditions, indicates a high probability of continued upward movement or at least a period of elevated price levels. Traders should be cognizant of the potential for a momentum reset should the RSI move into overbought territory, which historically has preceded consolidations or minor corrections rather than significant reversals in this data set. (Note: MACD data was requested but not provided for analysis in the market data section.)