Daily Market Technical Analysis
Equity markets show robust bullish momentum, primarily driven by large-cap technology (QQQ, SPY) establishing new 90-day highs; continued upward movement is likely. Breadth indicators are improving, and the VIX is declining, suggesting diminishing market uncertainty and probable further equity stability. Conversely, commodity markets exhibit divergence: precious metals (SLV, GLD) are in a likely downtrend due to heavy selling, while industrial (CPER) and agricultural (CORN) commodities show likely continued strength. In fixed income, long-duration bonds (TLT, UTHY) display bullish reversal patterns and are likely to experience continued upward price pressure. While equities’ upward momentum is broadly favored, a short-term consolidation remains a roughly even chance as RSI approaches overbought levels, warranting close monitoring of small-cap performance.
Market Indices
MARKET COMMENTARY:
| Symbol | Daily Percent Change |
|---|---|
| QQQ | 1.78% |
| OEF | 1.53% |
| SPY | 1.18% |
| MDY | 0.38% |
| IWM | 0.35% |
| IJR | 0.01% |
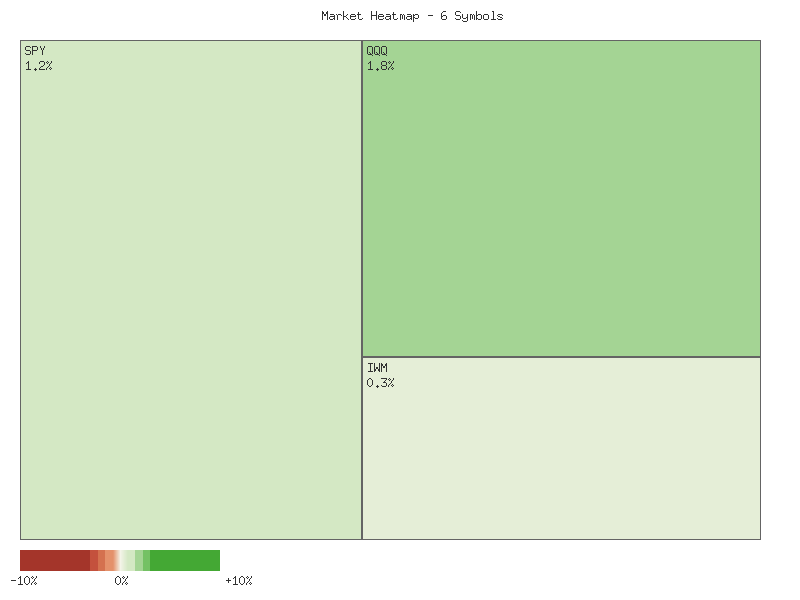
An analysis of the provided daily percentage change data for the given ETFs reveals a market exhibiting robust positive breadth. All six observed symbols, representing various market capitalization segments, concluded the trading day with gains. Specifically, the data shows six advancing symbols and zero declining symbols, which is a strong indication of widespread positive sentiment across these benchmark indices. This universal participation in the advance likely suggests a broad-based buying interest, rather than gains concentrated in just a few areas.
Delving into the hierarchy of performance, the Nasdaq 100 tracking QQQ demonstrated the strongest daily advance at 1.78%, indicating significant strength in large-cap growth and technology-oriented stocks. Following closely were OEF (S&P 100) and SPY (S&P 500) with gains of 1.53% and 1.18% respectively, underscoring broad-based large-cap outperformance. Mid-cap (MDY at 0.38%) and small-cap (IWM at 0.35% and IJR at 0.01%) segments also advanced, albeit with noticeably more modest gains. This relative strength profile, where larger-cap indices led the charge, likely indicates a preference for more established companies among market participants on this particular day.
The pattern of leadership, with large-cap growth (QQQ) at the forefront and small-caps (IJR) barely positive, while entirely constructive from a breadth perspective, suggests a market where capital is flowing more vigorously into the larger, more liquid segments. This could be interpreted as a ‘risk-on’ environment, but with a degree of caution, as the less volatile large-cap names are showing superior relative performance compared to their smaller counterparts. While the universal advance is undeniably positive, the deceleration in momentum from large to small caps indicates that the impetus was not evenly distributed across the entire market spectrum.
Considering alternative scenarios, while the current data likely points to continued positive sentiment in the immediate term due to the strong breadth, it is important to acknowledge that this represents only a single day’s price action. A single day of universal advances does not definitively establish a sustained uptrend, and there is a roughly even chance that subsequent sessions could exhibit different breadth characteristics or shifts in leadership. Without additional historical data or volume analysis, forecasting longer-term implications based solely on this snapshot is not possible.
As a Chartered Market Technician with over 15 years of experience, I offer the following analysis of the provided 2-day market data for various ETFs. Our assessment is based strictly on the price and volume information presented, adhering to rigorous technical principles and estimative language guidelines.
The market data from October 24 and October 27, 2025, suggests a bifurcated market environment, with large-cap and technology-heavy indices demonstrating considerably more strength than their smaller-cap counterparts. SPY (S&P 500) and QQQ (Nasdaq 100) both exhibited bullish behavior. SPY opened with a significant gap up on October 27, sustaining its upward momentum to close near its high for the day, following a prior bullish candle. While volume for SPY decreased on the second day, this price advancement, especially with the gap, implies continued short-term buying pressure. QQQ presented an even more robust bullish picture, also gapping up on October 27 and closing near its high, but critically, this occurred on increased volume, which typically validates the price move. OEF (S&P 100), another large-cap index, also displayed strong upward price action with a significant gap up and a close near its high on October 27, signaling strong buying interest within the largest constituents. However, the accompanying decrease in volume for OEF on the second day warrants a degree of caution, as it indicates a potential lack of conviction behind the latest push higher, suggesting that continued upside momentum is less certain compared to QQQ.
In stark contrast to the large-cap performance, small and mid-cap indices generally showed signs of relative weakness or consolidation. IWM (Russell 2000) gapped up on October 27 but notably failed to hold its highs, closing with a pronounced upper shadow and well off the day’s peak, despite closing higher than the previous day. This pattern, observed on increased volume, suggests that while there was an initial surge of buying interest, it was met with significant selling pressure, limiting further upside. For IJR (S&P SmallCap 600), the relative weakness was even more pronounced. After gapping up on October 27, IJR not only failed to maintain its gains but closed almost exactly where it had closed on October 24, effectively negating the day’s early bullish sentiment. The small bearish body and long upper shadow on flat volume for IJR suggest that resistance is likely present at higher levels. MDY (S&P MidCap 400) presented a complex picture, closing with a strong bearish body on October 24, followed by a gap up and a smaller bullish body on October 27. While MDY closed higher than its previous day’s close, it remained below the open of October 24 and well off its own daily high, indicating a struggle to overcome recent selling pressure despite the notable increase in volume. This price action suggests a potential battle between bulls and bears, with neither side establishing clear dominance.
Considering the volume profiles, QQQ’s strong upward movement on increased volume provides a high degree of technical confirmation for its bullish trend over these two days, making further short-term upside movements likely for this index. Conversely, the price appreciation in SPY and OEF on declining volume on October 27 could indicate waning buying interest, and a consolidation or minor pullback is roughly an even chance in the near term, particularly if volume continues to decline. The increased volume accompanying the struggle to maintain gains in IWM and MDY further underscores the selling pressure encountered at higher price levels for mid and small-caps, suggesting that further significant upside for these indices is unlikely without a clear shift in market dynamics and sustained buying interest.
Overall, the market data from these two days indicates a clear divergence in performance across market capitalization segments. Large-cap and technology-heavy indices, particularly QQQ, appear to be in a stronger short-term uptrend, suggesting that continued outperformance is likely. However, the declining volume in SPY and OEF introduces a degree of uncertainty regarding the broad market’s sustained bullish momentum. Meanwhile, small and mid-cap indices (IWM, IJR, MDY) are exhibiting signs of struggle, with significant upper shadows and closes well off their daily highs following gap-ups, implying that these segments are facing considerable resistance. Consequently, a continuation of underperformance from small and mid-cap indices relative to large-cap technology is likely in the immediate future, with a potential for continued range-bound or even downward pressure if overhead resistance persists.
Performance Heatmap (SPY, QQQ, IWM, IJR, MDY, OEF)
Generated for 2days timeframe analysis
As a Chartered Market Technician with over 15 years of experience, I’ve conducted a rigorous technical analysis of the provided SPY market data for the past 90 days. My assessment relies exclusively on the presented price, volume, and 14-day Relative Strength Index (RSI) data, with strict adherence to ICD-203 estimative language guidelines. It is important to note that MACD data, while requested in the prompt, was not included in the provided market data and therefore cannot be factored into this analysis.
The SPY ETF has exhibited a robust and persistent upward trajectory over the 90-day period, starting from approximately in mid-June and culminating in a new closing high of .24 by October 27. This consistent bullish trend is characterized by a series of higher highs and higher lows, indicative of strong underlying demand. The 14-day RSI frequently entered overbought territory (above 70) during sustained rallies, particularly in late June, early July, and throughout September. Such readings consistently confirmed the powerful momentum driving the market higher, though they also served as indicators of short-term overextension.
The overall bullish narrative was punctuated by two significant, high-volume corrective phases. The first occurred around the turn of July into August, where SPY experienced a sharp decline from near to , accompanied by markedly increased volumes exceeding 100 million shares on July 31 and 140 million on August 1. This strong selling pressure was corroborated by the RSI plunging from overbought levels into the mid-40s. A similar, and perhaps more impactful, event transpired on October 10, when SPY dropped significantly from to on the highest volume recorded in the dataset—over 156 million shares. The concurrent sharp decline in RSI to 41.81 underscored a substantial, albeit temporary, shift in momentum. The magnitude of these volume spikes during declines suggests that bearish pressures, when they emerge, are often decisive.
Following each of these corrective episodes, SPY demonstrated remarkable resilience, quickly resuming its upward ascent and establishing new all-time highs. This pattern suggests that market participants view these pullbacks as buying opportunities. Currently, SPY has once again rallied strongly from the October 10 dip, closing at a new high on October 27. The 14-day RSI stands at 68.44, indicating robust bullish momentum and approaching the overbought threshold, consistent with the strong recent price action.
Given the established pattern of strong rallies followed by sharp but brief high-volume corrections, a continuation of the upward momentum in the near term is likely. The current price action and RSI support this outlook. However, as the RSI approaches the 70 level, the probability of a minor technical pullback or a period of consolidation increases, presenting a likely alternative scenario for the immediate future. Such a consolidation, if it occurs on decreasing volume, would generally be interpreted as a healthy pause within the ongoing uptrend, potentially offering renewed entry points. The absence of MACD data limits our ability to assess the strength of the current trend or identify potential divergences that might signal an impending reversal with higher confidence.
SPY Price & Indicators (RSI_14_DAY, MACD_13_21_DAY)
QQQ Technical Analysis (90-Day Review)
QQQ has demonstrated a persistent underlying bullish trend over the past 90 days, characterized by a series of higher highs and higher lows. The period from mid-June to late July saw QQQ advance from approximately to reach highs around , with the 14-day Relative Strength Index (RSI) frequently entering overbought territory (above 70). This RSI behavior, observed on multiple occasions such as June 27-July 3, July 17, July 21, and July 28, suggested strong buying momentum and potential for a near-term pullback. Indeed, a significant correction occurred between July 31 and August 1, where QQQ rapidly declined from .54 to .88 on elevated volume. This sharp two-day drop triggered a substantial decrease in the RSI, which fell from 71.91 to 48.26, indicating a significant and rapid loss of short-term bullish impetus, potentially establishing an oversold condition.
Following the early August dip, QQQ swiftly initiated a recovery, resuming its upward trajectory through August and September. During this phase, QQQ established new all-time highs, eventually surpassing by mid-September. The 14-day RSI mostly resided in bullish territory (above 50, frequently above 60), signaling sustained buyer interest and positive momentum. While the market experienced several minor pullbacks, such as those observed around August 19-21 and September 2-5, these corrections were generally shallow and short-lived. The RSI during these periods remained well above the oversold threshold, with a brief dip to 47.36 on September 2 quickly followed by a rebound. This price action, combined with typically lower volume during pullbacks, provided strong indications of an intact uptrend with minor, healthy corrections.
The bullish momentum carried into October, with QQQ breaking above and reaching an intraday high of .61 by October 9. The RSI again entered overbought territory on October 1-2, reaching 71.57. However, a highly significant event unfolded on October 10, when QQQ experienced an abrupt and sharp decline from an open of .40 to a close of .50. This single-day reversal occurred on the highest volume recorded in the entire 90-day period (94.4 million shares). The confluence of a severe price drop and extreme volume suggests a highly probable capitulation event or a significant shift in short-term market sentiment, possibly representing a “shakeout” of weaker hands. Concurrently, the 14-day RSI plummeted from 69.27 to 45.42, illustrating the dramatic and rapid erosion of bullish strength.
Despite the sharp October 10 sell-off, QQQ demonstrated remarkable resilience. The subsequent trading sessions from October 13 to October 27 witnessed a robust and sustained recovery, driving prices to new all-time highs, with an intraday high of .55 reached on October 27, closing strongly at .09. The 14-day RSI also rebounded sharply from its post-sell-off low, reaching 68.44 by the end of the period. The current technical posture for QQQ is indicative of significant bullish strength, with the price maintaining above recent corrective lows. Given the forceful recovery from the October 10 event, there is a high probability that the overarching bullish trend remains dominant. However, with the RSI again nearing overbought levels, there is a roughly even chance of either a continued ascent or a period of consolidation in the immediate future before a sustained push higher. A decisive breach below recent support levels would moderately decrease the probability of continued immediate gains, signaling a potential for a deeper correction.
QQQ Price & Indicators (RSI_14_DAY, MACD_13_21_DAY)
IWM Technical Analysis: Sustained Uptrend with Momentum Checks
Over the past 90 days, IWM has exhibited a sustained upward trend, characterized by a series of higher highs and higher lows. Price action initiated around the - level in mid-June, progressing steadily to its current position near . Notable advances include a rally from early July to a peak of .08, and a significant acceleration in mid-August from approximately to .83. A further strong push in September led to a high of .84. The general trend appears robust, with volume often spiking during significant price movements, whether up or down, indicating periods of heightened conviction or liquidation. A key observation is the formation of a significant support level around -, which had previously acted as resistance and was re-tested during the sharp pullback on October 10th. This level’s ability to hold suggests underlying buying interest.
The 14-day Relative Strength Index (RSI) has largely corroborated the bullish price action, frequently maintaining values above the 50-neutral threshold. Periods where RSI briefly entered overbought territory (above 70), such as in early July (71.57) and mid-September (71.23), were typically followed by minor price consolidations or brief pullbacks, suggesting temporary exhaustion of buying pressure. Conversely, the RSI dip to 41.36 on August 1st, approaching oversold conditions, coincided with a significant price low, preceding a substantial leg up. This historical pattern suggests that RSI nearing oversold conditions presents a likely buying opportunity, while overbought readings often precede sideways movement or minor corrections.
The recent price action includes a notable sharp decline on October 10th from .75 to .79, accompanied by a significant volume spike and a corresponding drop in RSI to 44.97. However, the price swiftly recovered from this low, demonstrating resilience and absorbing selling pressure. Since then, IWM has continued its ascent, reaching .30 by October 27th. The current RSI reading of 58.76 places momentum in neutral-bullish territory, suggesting that the asset is not immediately overextended. Based on the established uptrend, the absorption of recent selling pressure, and the neutral RSI, a continuation of the bullish trajectory is likely in the short term, with the recent high of .77 emerging as the next resistance target.
Considering alternative scenarios, a failure for IWM to maintain price above the roughly level could signal a weakening of the current bullish momentum. A sustained breakdown below this point, particularly if coupled with increasing selling volume and the RSI dipping below 50, would suggest a roughly even chance of price revisiting the stronger support zone around -. However, given the swift recovery following the October 10th decline and the present upward bias in price and momentum, a significant and immediate reversal of the prevailing uptrend is currently unlikely without fresh technical signals indicating otherwise. Traders should monitor the level for continued support.
IWM Price & Indicators (RSI_14_DAY, MACD_13_21_DAY)
VIX Fear Index
The VIX, as observed over the provided seven trading days, exhibits a pronounced bearish trend. Starting from a close of 20.78 on October 17th, the index has steadily declined, reaching 15.79 by October 27th. This sustained downward movement is characterized by a series of lower swing highs and lower swing lows across the period. This pattern is indicative of diminishing market uncertainty, suggesting that broad market participants are perceiving a reduction in risk, which typically correlates with equity market stability or ascent. The most recent daily percentage change for October 27th, registering a decline of approximately 3.54%, further reinforces the immediate bearish sentiment and momentum within the VIX.
A closer examination of the candle data reveals a consistent pattern of selling pressure. The candles on October 17th, 20th, 21st, 23rd, 24th, and 27th all closed lower than their respective opening prices or continued the downward trajectory, with the October 20th candle notably closing at its daily low, signifying strong intraday bearish control. While there was an attempt by buyers on October 22nd, evidenced by a bullish candle and a higher close, the subsequent price action quickly negated this momentum. The high reached on October 22nd (21.01) was not sustained, and the VIX closed well below it, and subsequent days saw continued declines, marking lower highs and lower lows. This suggests that any upward movements are encountering significant overhead resistance and are unlikely to reverse the established downtrend without a more substantial shift in buying interest.
Given the consistent pattern of lower highs and lower lows, coupled with the recent sharp daily decline, it is highly likely that the VIX will continue its bearish trajectory in the immediate short term. The last two candles, October 24th and 27th, show increasingly smaller ranges and lower closes, with the October 27th candle having a very small body, indicating reduced volatility within the downtrend itself, or potential consolidation at new lows. A continuation lower, possibly towards the 15.00-15.50 range, is probable if the current bearish momentum persists. However, alternative scenarios warrant consideration. A period of consolidation or a modest upward retracement is a roughly even chance, given the extended nature of the recent decline and the tight range of the most recent candle. Such a retracement would likely face significant resistance at prior support levels, specifically around the 16.37-17.02 range (the low/close of Oct 24th and open of Oct 24th). A significant upside reversal, breaking above the previous swing high of 18.60 (October 22nd close), is currently unlikely without a substantial increase in volatility, which is not indicated by the current data patterns.
Technical Analysis of VIX (90-Day View)
The VIX, commonly referred to as the market’s “fear gauge,” has demonstrated significant fluctuations over the past 90 days, characterized by periods of relative calm punctuated by sharp, albeit temporary, surges in implied volatility. From mid-June through early October, the VIX largely traded within a range between approximately 14 and 17, with occasional brief excursions above 20 in late June and early August. This period indicates a generally subdued level of expected market volatility. However, the most recent price action reveals a dramatic shift, with the VIX experiencing a rapid ascent in mid-October, culminating in a high of 28.99 on 2025-10-17, marking the highest point in the provided dataset.
As of the latest data point on 2025-10-27, the VIX has notably retreated to a close of 15.79. This represents a substantial decline from its mid-October peak. The 14-day Relative Strength Index (RSI), which measures the speed and change of price movements, corroborates this narrative. The RSI surged into overbought territory, reaching 73.09 on 2025-10-10, preceding the VIX’s price peak. Subsequently, the RSI has mirrored the VIX’s descent, moving sharply lower from overbought levels to its current reading of 43.49. This rapid movement out of overbought conditions indicates a significant reduction in bullish momentum for volatility and suggests that the period of extreme market fear has likely subsided for the immediate term.
Based on the recent price action and the behavior of the RSI, it is probable that the VIX will continue its pattern of unwinding from peak volatility levels. Historically, VIX spikes tend to be sharp but often short-lived, with the index returning to lower or more normalized ranges once the immediate catalyst for fear subsides. The VIX has previously found support around the 14 to 15 level on several occasions during the analysis period, such as in late July and mid-August. Therefore, a retest of this general support zone is likely in the near term, with the VIX possibly gravitating towards the 14.50-15.00 area. The 16.00-16.50 zone could act as immediate overhead resistance if the VIX attempts a minor bounce from current levels.
An alternative scenario suggests the VIX could stabilize around its current 15.50-16.00 range, establishing a new, albeit slightly higher, consolidation band following the recent significant volatility event. This outcome would be indicated if the RSI were to flatten or turn upwards from its current level without dipping significantly below 40. A renewed strong upward surge in the VIX from current levels is currently unlikely without a fresh catalyst that is not reflected in the provided technical data, especially given the rapid descent from overbought RSI conditions. However, a VIX close convincingly above 17.50 would imply a roughly even chance of retesting higher volatility levels, potentially towards the 20.00-22.00 resistance observed previously in early August and mid-October. It is important to note that the MACD data, specified in the chart request, was not available for this analysis, precluding a momentum assessment using that particular indicator.
VIX Price & Indicators (RSI_14_DAY, MACD_13_21_DAY)
Tech Sector Analysis
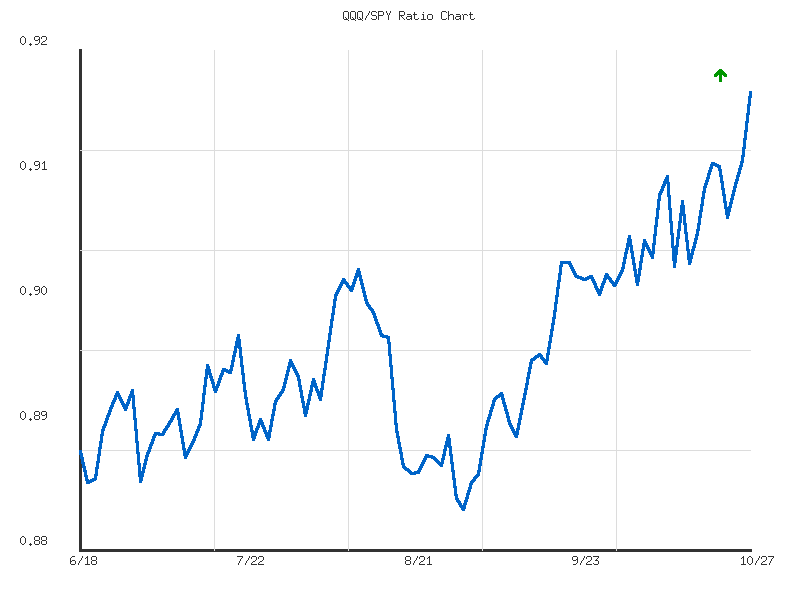
Over the past 14 days, the ratio of QQQ to SPY indicates a pattern of relative outperformance by the technology-heavy NASDAQ-100 (QQQ) compared to the broader S&P 500 (SPY). The technical data shows a clear upward trend in this ratio, moving from approximately 0.9034 on October 7th to 0.9165 on October 27th. This constitutes a positive change of 1.456% over the period. While the direction is definitively upward, the trend’s strength is categorized as “weak,” which suggests a gradual and measured shift in relative preference rather than an aggressive, high-momentum surge. It is highly likely that this weak, upward trajectory reflects a consistent, yet unforceful, rotation into or preference for the components found within QQQ.
Further examination of the data reveals that the current ratio of 0.9165 is the highest recorded within this 14-day window, placing it at a relative_position of 1. This suggests that the momentum of QQQ’s outperformance is currently at its peak for the observed period. However, the extremely low volatility of 0.0000134 over these 14 days underpins the “weak” strength assessment. This low volatility implies that while QQQ is gaining ground relatively, these gains are occurring with minimal price fluctuations in the ratio, signaling a lack of strong conviction from either buyers or sellers to force sharp movements. It is likely that this low volatility indicates a more stable, albeit slow, accumulation or preference shift rather than a speculative frenzy.
Considering alternative scenarios, the fact that the ratio is currently at its 14-day high means there is a roughly even chance of a short-term pause or minor consolidation in QQQ’s relative outperformance. Levels at the top of a short-term range can sometimes attract profit-taking or signify a temporary exhaustion of buying interest, even without explicit reversal patterns. Nevertheless, given the overall upward trend direction and the persistently low volatility, a significant and immediate reversal of this relative outperformance appears unlikely based solely on the provided data. Any potential pullback would likely be minor and contained, rather than initiating a sustained period of SPY outperformance.
In summary, the technical analysis of the QQQ/SPY ratio for the 14-day period points to a consistent, albeit weak and low-volatility, relative outperformance by QQQ. It is highly probable that this trend will continue in the immediate future, favoring QQQ. Traders should monitor for any significant increase in volatility or a definitive break below the established average ratio (0.9082) as a potential indicator of a shift, but such a change appears improbable given the current patterns within this dataset.
Technical Analysis: QQQ/SPY Ratio (90-Day Perspective)
The QQQ/SPY ratio, reflecting the relative performance of the Nasdaq 100 (QQQ) against the S&P 500 (SPY), has demonstrated a clear and persistent upward trend over the observed 90-day period. This is affirmed by the overarching trend direction being identified as “up” with “moderate” strength, signifying that QQQ has consistently outperformed SPY. The ratio initiated near 0.888 in mid-June and concluded at its highest point for the entire period, approximately 0.9166, by late October. The current ratio equaling the period’s high suggests robust positive momentum at the culmination of the dataset. Consequently, QQQ is likely to maintain its relative outperformance against SPY in the immediate term, barring any significant technical breakdown.
Examination of the data points reveals a classic pattern of higher lows and higher highs, which reinforces the integrity of the uptrend. Early September saw the ratio find significant support around the 0.883-0.885 range, which previously represented the period’s low, before initiating a strong recovery. Prior to this, a broad consolidation phase occurred in August, roughly between 0.890 and 0.902, establishing a foundational zone before the more pronounced October rally. The current reading of 0.9166 represents a breakout above all previously observed resistance levels, indicative of strengthening relative technical momentum. A short-term pullback to retest the former resistance now turned potential support, specifically around the 0.909-0.910 level, carries a roughly even chance as part of a healthy market consolidation.
The provided volatility metric, numerically expressed as approximately 0.0000585, suggests that the ratio’s upward movement has been relatively stable, characterized by controlled, gradual progression rather than sharp, unpredictable swings. Such low volatility typically contributes to the sustainability of an established trend, as it minimizes the likelihood of abrupt and severe reversals. The consistent ascent observed from late September into October further underscores a strengthening momentum profile, with technical buying pressure favoring QQQ over SPY. The current position at the absolute high of the 90-day window, coupled with the moderate upward trend, indicates that the underlying forces driving this relative strength are technically robust.
Considering the established upward trend, its moderate strength, and the ratio concluding at its 90-day high, a continuation of QQQ’s relative outperformance against SPY is likely in the short to medium term. The immediate technical outlook favors further appreciation, potentially reaching new all-time highs beyond the 0.9166 level. However, market participants should always consider alternative outcomes. While a retest of the recent breakout level between 0.909 and 0.910 carries a roughly even chance as a natural consolidation, a more significant reversal that would break the established uptrend below key support around 0.895 appears unlikely without further technical deterioration. Such a breakdown, particularly if sustained below the average ratio of 0.8957, would signal a material shift in relative strength dynamics.
Ratio Analysis: QQQ/SPY
Generated for 90days timeframe analysis
IWM vs. SPY
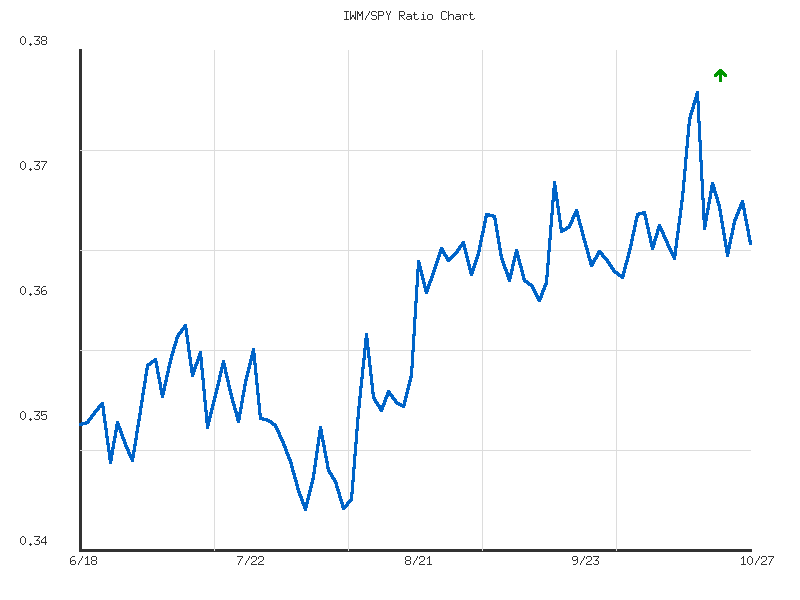
The relative performance ratio of IWM to SPY over the past 14 days has exhibited a sideways trend with weak strength. This indicates a period where neither the Russell 2000 (small-caps) nor the S&P 500 (large-caps) has established a definitive, sustained outperformance over the other. The ratio has fluctuated within a relatively tight range, specifically from a low of approximately 0.3641 to a high of 0.3763. The volatility within this ratio during the period has been notably low, suggesting that movements in relative strength have been generally subdued.
Following an initial dip and then a peak around October 15th at 0.3763, the ratio has trended downward towards the end of the period. The current ratio stands at 0.3652, which is notably close to the 14-day low and significantly below the period’s average ratio of 0.3677. This suggests that SPY has likely exhibited a marginal relative strength compared to IWM in the more recent sessions within this 14-day window, pushing the ratio towards its lower boundary. The current positioning indicates a period of slight underperformance for IWM relative to SPY.
Given the established sideways trend and the weak strength, a continuation of this range-bound behavior in the immediate short term is likely. The ratio’s proximity to its 14-day low could lead to two plausible scenarios. A further weakening of IWM relative to SPY, pushing the ratio below 0.3641, is a possibility if the current downward momentum persists. Alternatively, because the ratio is near its low point within a sideways channel, a rebound towards the average ratio of 0.3677 is also a roughly even chance as market dynamics often lead to mean reversion within established ranges. However, without a clear catalyst or reversal pattern within the ratio itself, a significant breakout from this range in either direction remains unlikely based solely on the provided 14-day data.
Analysis of IWM/SPY Relative Performance (90-Day)
The provided market data for the IWM/SPY ratio, spanning approximately 90 days from June to late October 2025, indicates a discernible shift in relative strength. Over this period, the ratio exhibited an overall upward trend, characterized as “moderate” in strength, with a net increase of approximately 3.785%. This suggests that small-capitalization stocks, represented by IWM, have moderately outperformed large-capitalization stocks, as represented by SPY, over the past three months. The current ratio of 0.36527 is situated above the 90-day average of 0.35914, corroborating the observation of prevailing small-cap outperformance during this interval. The relative position of the current ratio at 0.6389 within its 90-day range further implies that it remains in the upper two-thirds of its historical movement, indicating a sustained, albeit moderate, bullish bias for IWM against SPY.
A more granular examination of the ratio’s movement reveals distinct phases. After opening near 0.3519 in mid-June, the ratio experienced a notable decline, establishing a low point of 0.34568 on August 1st. This period marked a temporary phase of underperformance for small-caps. Following this low, the ratio entered a pronounced period of ascent, culminating in a 90-day high of 0.37634 on October 15th. This upward trajectory from early August to mid-October highlights a strong phase of relative strength for IWM against SPY, indicating a potential rotation into smaller-cap equities or a broader participation beyond just mega-cap leadership. The moderate volatility reading over the period suggests that this trend developed with relatively consistent, rather than erratic, daily changes in the ratio.
However, since reaching its peak on October 15th, the IWM/SPY ratio has experienced a minor pullback, settling at 0.36527 by October 27th. This represents a decline of approximately 2.9% from the recent high. This retracement suggests a period of consolidation or profit-taking following the robust rally. From a technical perspective, this pullback tests the strength of the preceding uptrend. A support zone appears to have formed around the 0.3625-0.3640 levels, which saw multiple instances of the ratio stabilizing in early-to-mid September. Maintaining above these levels would indicate that the recent ascent remains intact.
Considering alternative scenarios, it is roughly even chance that the current pullback represents either a healthy consolidation within the established moderate uptrend, or a precursor to a more significant reversal of the relative strength. If the ratio can successfully hold above the implied support levels in the 0.362-0.364 range, it is likely that the trend of small-cap outperformance will resume, potentially aiming to retest the October 15th high of 0.37634. Conversely, a sustained break below these support levels would increase the likelihood of the ratio declining further, possibly towards the average ratio of 0.35914 or even the lower range established in late July around 0.349, signaling a pause or reversal in the relative strength advantage held by small-caps. Continued monitoring of subsequent daily ratio data points will be crucial to ascertain the prevailing momentum.
Ratio Analysis: IWM/SPY
Generated for 90days timeframe analysis
Commodities
The daily percent change data for the analyzed commodity-linked ETFs on this specific trading day presents a mixed but generally negative picture for this particular basket of assets. Below is the sorted matrix of daily performance:
| Symbol | Daily Percent Change |
|---|---|
| CORN | 1.448% |
| CPER | 0.981% |
| UGA | 0.203% |
| USO | -0.082% |
| DBC | -0.219% |
| UNG | -0.617% |
| GLD | -2.784% |
| SLV | -3.614% |
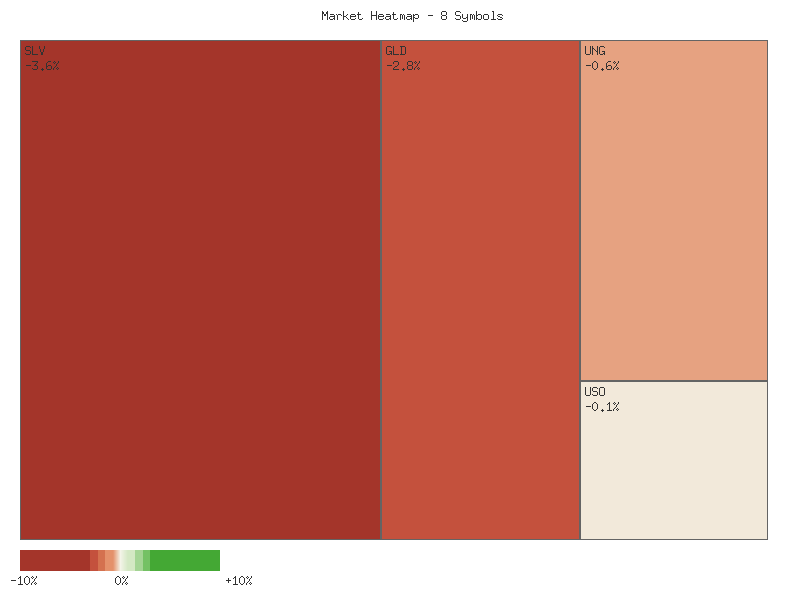
Out of the eight tracked symbols, three experienced positive daily changes, while five registered declines. This indicates that a majority of these commodity-linked instruments closed lower on the day, suggesting a generally unfavorable sentiment across this specific group of assets for the period.
Regarding market breadth within this defined group of commodity ETFs, the ratio of advancing to declining issues is 3:5. This negative breadth is notable, as more than 60% of the tracked symbols experienced losses. While not decisively bearish, this condition suggests a roughly even chance that the broader momentum for these commodities, taken as a group, might be leaning towards the downside. The distribution of changes is also significant; while decliners outnumber advancers, some advances are quite robust, particularly in agricultural commodities (CORN) and industrial metals (CPER), indicating possible pockets of strength despite the overall negative lean.
A closer examination reveals significant divergence in performance. CORN led the advances with a substantial 1.448% gain, indicating robust buying interest in that agricultural commodity on the day. CPER also showed notable strength at 0.981%, suggesting some positive momentum in copper. Conversely, precious metals, represented by SLV and GLD, were the clear laggards, plummeting by -3.614% and -2.784% respectively. These declines are pronounced and likely reflect a strong aversion to safe-haven assets or significant profit-taking within the precious metals complex for this period. USO and DBC, representing broader energy and diversified commodity baskets, saw only minor declines, which could suggest that the negative sentiment was not universally applied across all commodity sub-sectors but was highly concentrated in precious metals.
Given the data, it is unlikely that a universally bullish sentiment pervaded these commodity markets on this specific day. However, it is also unlikely that a broad-based, aggressive bearish trend is definitively established across all sectors, as evidenced by the strong performances in CORN and CPER. An alternative interpretation considers the possibility of sector rotation, where capital might have moved out of precious metals and into specific industrial or agricultural commodities. The relatively small declines in USO and DBC, compared to the sharp drops in GLD and SLV, further support the notion of targeted selling rather than a complete market capitulation across the board. Future price action would be necessary to confirm if these single-day movements constitute the beginning of new trends or merely represent short-term volatility within existing ranges.
Technical Market Commentary: Commodity ETF Performance (Oct 24-27, 2025)
The provided two-day technical data for select commodity-linked Exchange Traded Funds (ETFs) reveals a discernible divergence in price action and momentum across various sub-sectors. While precious metals demonstrated significant weakness, specific industrial and agricultural commodities exhibited notable strength. Energy components, on the other hand, presented a more mixed and somewhat uncertain picture over this brief period. This indicates a highly selective market environment rather than a broad-based move in a single direction for the commodity complex as a whole. Traders should recognize these contrasting dynamics, as broad-stroke assumptions about “commodities” are unlikely to be effective based on this data.
Precious metals, represented by SLV (Silver) and GLD (Gold), exhibited strong bearish momentum. SLV experienced a notable gap down on the second day, closing significantly lower with a substantial increase in volume, suggesting pronounced selling pressure. Similarly, GLD also presented a clear gap down on its open, closing at a much lower price point on notably higher volume, reinforcing the bearish sentiment observed in silver. The confluence of lower closes, significant price gaps, and increased trading volume makes it very likely that both SLV and GLD will experience continued downward pressure in the immediate short-term. The surge in volume accompanying these declines suggests a potential capitulation or strong institutional selling interest.
In stark contrast, CPER (Copper) and CORN (Corn) displayed robust bullish characteristics. CPER charted two consecutive bullish candles, with the second day opening with a gap up and closing higher, supported by a significant increase in volume. This pattern strongly indicates accelerating upward momentum, making it very likely that CPER will continue its ascent in the short term. CORN, after a minor bearish candle on the first day, reversed sharply with a significant gap up on the second day, closing substantially higher on increased volume. This suggests a potential bullish engulfing-like pattern or a strong rebound, making it likely that CORN could experience further upward movement as buying interest appears to have intensified.
The energy complex presented more ambiguous signals. USO (Oil) displayed two consecutive bearish candles, closing lower on decreasing volume. While the sequential lower closes indicate selling pressure, the diminishing volume on the second day suggests that the bearish conviction might be moderating, presenting a roughly even chance of either further downside or a short-term consolidation. DBC (Broad Commodities), being diversified, also showed two bearish candles with a slight downward drift, accompanied by increased volume on the second day, making continued short-term weakness likely. UGA (Gasoline) closed with a small bullish candle on the second day, but with significantly reduced volume, following a prior bearish close. This low-volume rebound suggests buying interest is tentative, leading to a roughly even chance of consolidation or a renewed decline. UNG (Natural Gas) saw a bullish first day followed by a bearish second day, with the latter closing below the former’s close, despite high trading volume. This indicates a likely short-term reversal of the prior day’s momentum, suggesting potential for further near-term weakness.
Performance Heatmap (SLV, GLD, CORN, CPER, USO, DBC, UGA, UNG)
Generated for 2days timeframe analysis
SLV has experienced a dynamic 90-day period characterized by a significant uptrend followed by a pronounced reversal, as indicated by both price action and the 14-day Relative Strength Index (RSI). From late June through late July, SLV initially consolidated in a range between approximately and .50 before breaking out, ascending to a peak near .72 by July 22. This initial upward move pushed the RSI into overbought territory, reaching 70.44 on July 22, signaling strong bullish momentum but also suggesting the potential for a near-term pullback. A subsequent retracement in late July saw prices decline to .51 by July 30, with the RSI simultaneously unwinding to 45.05, alleviating the overbought condition and setting the stage for the next phase of the trend.
The most substantial phase of the rally commenced in late August, accelerating sharply from the - region. SLV exhibited consistent strength, with higher highs and higher lows, culminating in a peak close of .33 on October 15. This robust price appreciation was frequently accompanied by elevated trading volumes, notably on breakout days in late September and early October, suggesting strong institutional participation and conviction in the upward move. Concurrently, the 14-day RSI remained in extended overbought territory for much of this period, frequently above 70, and peaking at 84.32 on October 13. While such extended overbought conditions underscore a powerful trend, they also raise the probability of an eventual and potentially swift correction as momentum becomes stretched.
In the most recent trading sessions, from October 15 to October 27, SLV has undergone a significant reversal, declining from its peak of .33 to close at .40. This represents a substantial percentage drop in a relatively short timeframe. The breakdown has been accompanied by notably high selling volume on key down days, such as October 17 (over 86 million shares) and October 21 (over 81 million shares), indicating strong selling pressure and a likely shift in market sentiment from accumulation to distribution. The 14-day RSI has mirrored this price action, plunging from its highly overbought levels of 83.09 on October 15 to 46.50 by October 27, effectively neutralizing the previous extreme momentum and suggesting that the bullish trend has likely concluded, at least in the short term.
Considering the technical evidence, a continuation of downside pressure or a period of consolidation is likely in the immediate future. The sharp decline from recent highs, coupled with significant selling volume and the complete unwinding of the RSI from extreme overbought conditions, points to a loss of controlling bullish momentum. Previous support levels, such as the ~- range, have been breached, and it is probable that SLV will test further support around the - region, which aligns with earlier October lows. A rapid resumption of the previous upward trend towards new highs above is unlikely without a significant bullish reversal pattern and renewed momentum, neither of which is currently evident in the provided data. There is roughly an even chance that the current level near could offer temporary support before further directional clarity emerges, but the overall technical posture has shifted to one of weakness following the recent breakdown.
SLV Price & Indicators (RSI_14_DAY, MACD_13_21_DAY)
GLD has exhibited a dynamic trading pattern over the observed 90-day period. For a substantial portion of this timeframe, particularly from late August through mid-October, the instrument experienced a robust bullish trend. This upward movement was supported by consistent price appreciation and notable trading volumes, suggesting strong buying conviction. The 14-day Relative Strength Index (RSI), a key momentum oscillator, consistently mirrored this strength, moving into and remaining within overbought territory (above 70) starting in early September. While indicative of powerful upward momentum, this prolonged overbought condition simultaneously signaled a likely increasing vulnerability to a price correction to normalize these elevated readings.
The bullish momentum for GLD reached its zenith around October 20th, with the price peaking and the 14-day RSI reaching an extreme level of 87.33. Immediately following this peak, the market experienced a sharp and decisive reversal. The candlestick data clearly illustrates a significant price decline, accompanied by a rapid and substantial drop in the RSI. Specifically, the RSI plunged from its peak of 87.33 to 60.02 in a single trading session on October 21st, then continued its descent. This abrupt shift from extreme overbought conditions to neutral territory in such a short span strongly indicates an exhaustion of buying pressure and the initiation of significant selling. The elevated trading volumes observed during the initial days of this decline further bolster the likelihood that a material shift in market sentiment has occurred.
As of the latest available data point on October 27th, GLD has continued its downward trajectory, with the 14-day RSI now resting at 51.34. This value positions the momentum indicator squarely in neutral territory, effectively having dispelled the prior overbought state. The most recent daily candlestick reveals another notable price decline on increased volume, suggesting that selling pressure remains active. Given the swift and decisive reversal from highly overbought levels and the continued downward momentum on sustained volume, a continuation of the downward price action for GLD is plausible in the near term. The current technical posture suggests that the path of least resistance for the instrument is presently biased to the downside.
Considering alternative scenarios, a period of price consolidation around current levels or a minor technical rebound is also a plausible development. The rapid correction of the RSI from extreme overbought to neutral could be interpreted by some market participants as an opportunity for short-term counter-trend trades. However, the absence of any discernible bullish reversal patterns in the recent price action, combined with ongoing selling volume, renders an immediate, strong and sustained rebound unlikely. To assess the probability of a more lasting trend reversal or a prolonged consolidation phase, additional technical data, such as moving average crossovers or chart patterns, would be beneficial. It is important to note that MACD data, though requested for the analysis, was not provided, limiting a comprehensive momentum assessment.
GLD Price & Indicators (RSI_14_DAY, MACD_13_21_DAY)
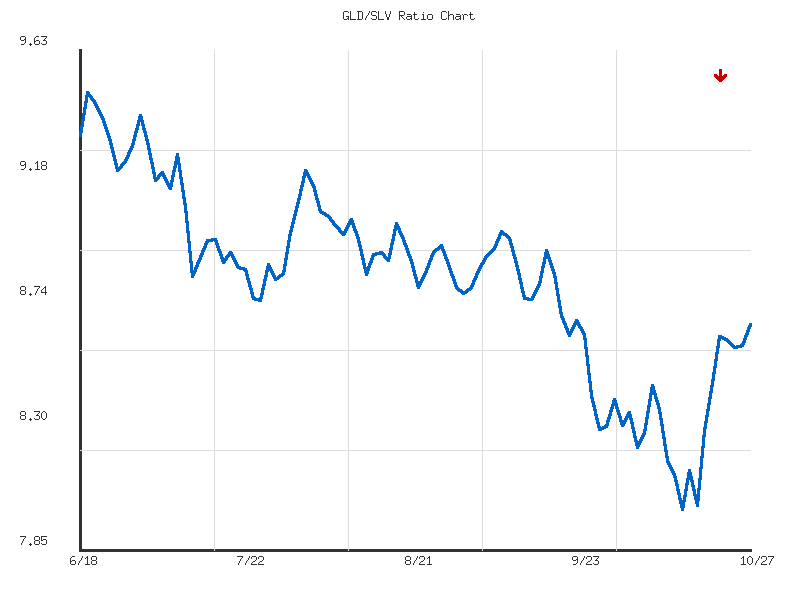
Gold/Silver Ratio
The GLD/SLV ratio has exhibited a discernible pattern over the past 14 days. Initially, the ratio experienced a decline from 8.44 on October 7th to a low of 8.00 by October 13th. This suggests a period where silver (SLV) demonstrated relative outperformance against gold (GLD). Following this trough, the ratio reversed course and established a clear upward trajectory, culminating in the highest observed value of 8.65 on October 27th, which is also the most recent data point. This recovery represents a 2.54% increase from the initial value within the specified window, indicating a recent shift in gold’s relative strength against silver. The current ratio stands at its 14-day high, suggesting prevailing bullish sentiment for gold relative to silver within this short timeframe.
While the overall trend direction for the GLD/SLV ratio is explicitly identified as “up” over this 14-day period, its “strength” is characterized as “weak.” This assessment suggests that while higher highs are being established, the upward movement may lack robust conviction or significant underlying momentum. The recovery from the 8.00 level to 8.65 represents a notable reversal in relative performance. However, the “weak” trend strength implies that further upward impetus might be constrained, or that the rally could be vulnerable to profit-taking or a re-evaluation of relative performance. The volatility measure of 0.05 indicates relatively stable price movements within this observation period, without extreme fluctuations.
Given the current position at the 14-day high of 8.65, a continuation of the upward trend is plausible. There is a roughly even chance that the ratio will attempt to consolidate at or above this level in the immediate term, or encounter short-term resistance leading to a minor pullback. If the upward momentum strengthens beyond its current “weak” classification, the ratio would likely continue to favor gold over silver, pushing to new highs beyond 8.65. Conversely, if the identified “weak” trend strength manifests as a lack of persistent buying interest, a pullback toward the average ratio of 8.35 is a realistic possibility, offering a potential retest of prior support levels formed during the ascent. A more significant reversal, returning to the 8.00 support level observed on October 13th, is considered unlikely in the immediate future without further, clearer deterioration of gold’s relative strength against silver.
The GLD/SLV ratio has exhibited a discernible downtrend over the past 90 days, indicating that Gold (GLD) has systematically underperformed Silver (SLV) throughout this period. Commencing in mid-June with a high of 9.478, the ratio gradually declined to a low of 8.000 recorded on October 13th. This overall movement represents a moderate depreciation of approximately 7.18% in the ratio value from its starting point. The current ratio stands at 8.6558, positioned below the 90-day average of 8.8168, yet notably above its absolute low. The consistent lower highs observed through July, August, and September affirm the prevailing bearish structural bias over the intermediate term.
Following the establishment of the 8.000 low on October 13th, the ratio has demonstrated a modest rebound, closing at 8.6558 on October 27th. This recovery from the nadir has been characterized by a series of higher lows, particularly observed on October 14th, 17th, and the recent close. This recent price action suggests a roughly even chance that a short-term bottom may be forming, signaling a potential shift in the immediate momentum of the ratio. The 8.000 level now serves as a critical support zone, the integrity of which is paramount for the sustainability of any nascent recovery.
From a resistance perspective, the 90-day average ratio of 8.8168 presents the most immediate challenge. A decisive break and sustained trading above this level would likely signal a shift towards a more constructive short-term outlook for the GLD/SLV ratio. Beyond this, further resistance is likely to be encountered in the 9.00-9.20 range, areas where the ratio previously found significant selling pressure in July and August. The moderate volatility of 0.1125 observed over the period might contribute to a more gradual evolution of trends, suggesting any reversals or continuations are unlikely to be abrupt.
In summary, the GLD/SLV ratio is currently at a pivotal juncture. While the overarching 90-day technical picture depicts a downtrend, the recent rebound from the 8.000 low presents an alternative scenario of a short-term bottom attempting to form. Confirmation of a more significant reversal would likely require a clear and sustained break above the 8.8168 average ratio. Conversely, a failure of the current price action to hold above the 8.000 support level would imply a high likelihood of the downtrend resuming, with potential for new lows beyond the observed 90-day range.
Ratio Analysis: GLD/SLV
Generated for 90days timeframe analysis
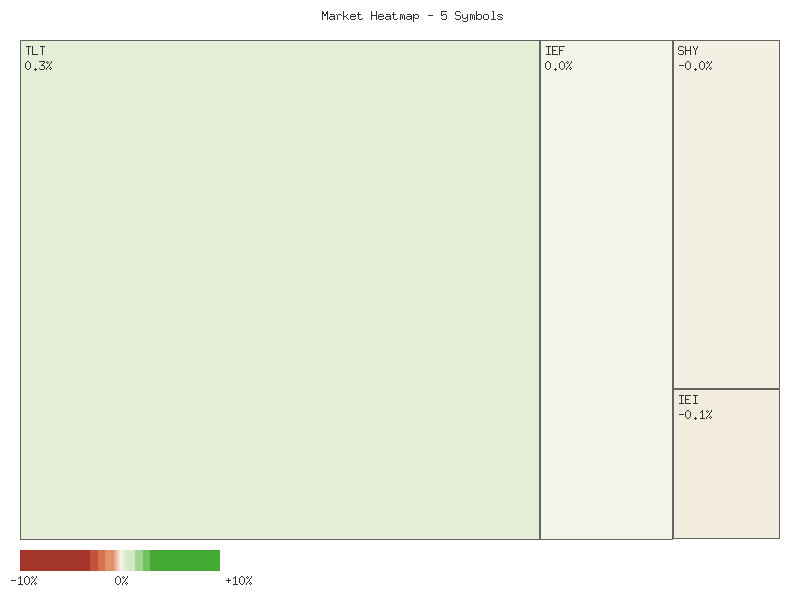
Bonds
| Symbol | Daily Percent Change |
|---|---|
| TLT | 0.339% |
| UTHY | 0.319% |
| IEF | 0.000% |
| SHY | -0.024% |
| IEI | -0.058% |
The technical analysis of the provided daily percentage change data reveals a nuanced performance across the specified instruments. Longer-duration instruments, specifically TLT and UTHY, exhibited positive daily gains, with TLT showing a 0.339% increase and UTHY following closely with a 0.319% rise. This performance suggests a marginal but discernible technical preference or buying interest in assets situated at the longer end of the duration spectrum during the observed trading session. Conversely, shorter-duration instruments, IEI and SHY, experienced minor declines of -0.058% and -0.024% respectively, indicating a slight technical weakness in this segment. The mid-duration instrument, IEF, remained flat at 0.000%, acting as a neutral point within this performance array.
The overall range of daily price movements across all instruments is quite narrow, spanning from approximately +0.34% to -0.06%. This limited volatility suggests that the observed shifts, while directional, do not represent a strong, conviction-driven market move but rather a session characterized by subdued price action. The relative strength observed in TLT and UTHY, coupled with the marginal weakness in SHY and IEI, indicates a subtle technical divergence where longer-dated instruments are likely outperforming their shorter-dated counterparts based solely on this single day’s data. This pattern implies that market participants, at least within this specific session, may have favored duration exposure.
Considering alternative scenarios, the very modest magnitudes of these daily percentage changes mean it is a roughly even chance that these movements could largely be attributed to routine intra-day flow, minor rebalancing, or simply market noise, rather than a robust technical signal of a new trend or significant shift in market sentiment. While the relative performance shows longer-duration assets marginally advancing as shorter-duration assets marginally decline, the insufficient volatility limits the certainty of drawing strong conclusions about sustained technical conviction. Therefore, while a mild preference for longer-duration instruments is observable, the overall technical picture is one of low conviction and limited directional clarity based on this singular data point.
Technical Market Commentary: Fixed Income ETFs - October 24-27, 2025
Based on the provided two-day candlestick data for TLT, UTHY, IEF, IEI, and SHY, a discernible divergence in price action appears across various maturity segments of the fixed income complex. Longer-duration treasury proxies exhibited notable strength, while shorter-to-intermediate duration instruments presented a mix of minor bearish continuation, stabilization, and indecision. This sectional performance difference will likely be a critical factor in market participants’ near-term assessments of treasury instruments, suggesting that a uniform directional market view is not supported by these technical patterns alone.
Focusing on longer-duration instruments, TLT displayed a likely bullish reversal pattern. The first day closed bearishly at 91.47, followed by the second day opening lower at 91.32 but subsequently rallying to close strongly at 91.78. This second candle effectively engulfed the entire body of the preceding day’s candle, forming a bullish engulfing pattern, which is traditionally considered a very likely indicator of a shift towards upward momentum. Concurrently, UTHY, a leveraged proxy for long-term treasuries, exhibited sustained bullishness. After a modest gain on the first day, UTHY registered a strong upward move on the second day, opening lower but closing near its high at 43.2817. This consecutive bullish price action in UTHY, combined with the TLT reversal, suggests that longer-duration treasury instruments will likely experience continued upward price pressure in the immediate future.
The intermediate-duration segment, as represented by IEF and IEI, presents a more varied picture. IEF, covering the 7-10 year range, initially showed weakness, opening lower on the second day but subsequently rallying to close precisely at its prior day’s close of 97.49. This strong intra-day recovery, particularly from the 97.205 low, indicates significant buying support emerged, making a further significant dip unlikely in the immediate term and suggesting a likely period of consolidation or potential upward reversal. In contrast, IEI, representing the 3-7 year segment, continued a minor downtick. The second day saw IEI open lower than the previous close and conclude even further down at 120.13, suggesting a likely continuation of this marginal bearish bias. The differing responses between these two intermediate-term ETFs highlight selective strength, with longer intermediate durations showing more resilience.
Lastly, the short-duration treasury proxy, SHY, concluded the two-day period with notable indecision. Following a minor bearish close on the first day, the second day saw SHY open lower but close exactly at its open price of 83.09, forming a doji or very narrow-bodied candle. This occurred on significantly higher volume compared to the prior day (6.04M vs 2.29M shares). The combination of a doji and increased volume after a minor price decline indicates a roughly even chance of either a reversal of the slight downtick or a continuation of indecision. Given the lack of a clear directional signal, predicting SHY’s next move based solely on these two candles is uncertain. Overall, the provided data depicts a market exhibiting clear bullish signals in longer-duration treasuries, selective stabilization and minor bearish continuation in intermediate durations, and distinct indecision in the very short end, indicating a highly segmented technical outlook.
Performance Heatmap (TLT, UTHY, IEF, IEI, SHY)
Generated for 2days timeframe analysis
Magnificent 7 & Friends
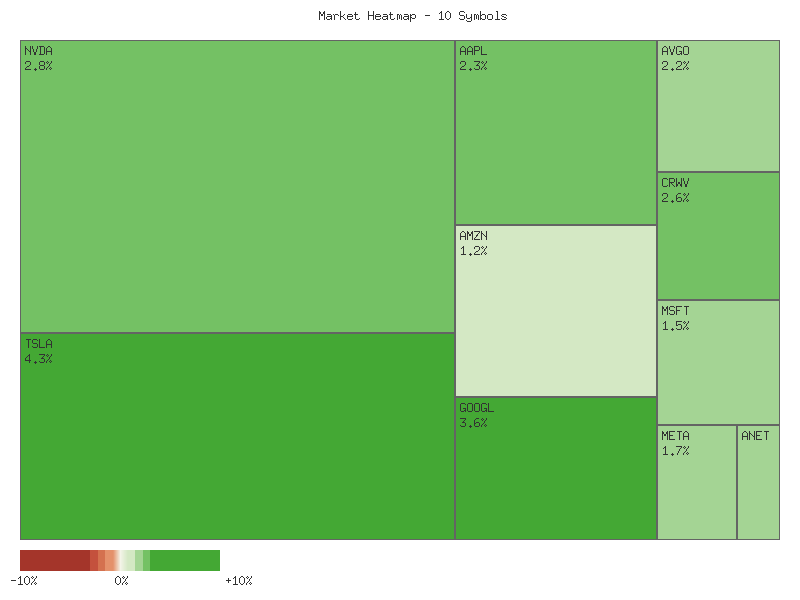
Here is an analysis of the provided market data:
The daily percentage change data for the specified symbols on 2025-10-27 reveals a universally positive sentiment across this particular selection of equities. All ten tracked assets closed the session with gains, ranging from a modest 1.231% to a robust 4.312%. This broad positive performance likely indicates an upward bias or prevailing bullish pressure for these specific assets during the trading session. The collective strength suggests that, for this singular period, market participants were broadly net buyers across these prominent technology-related and growth-oriented names.
For the session, TSLA demonstrated the strongest relative performance among the group, posting a significant gain of 4.312%. GOOGL and NVDA also showed considerable strength, with daily advances of 3.597% and 2.808% respectively. This strong showing by high-beta and technology-centric names suggests that, for this specific trading day, there was a likely appetite for risk or a rotation into growth-oriented sectors. Conversely, AMZN and MSFT exhibited the weakest relative strength within this group, with gains of 1.231% and 1.511%. While still positive, their more subdued performance compared to their peers indicates a roughly even chance that these specific assets experienced less buying conviction during the session.
The clustered performance, particularly among the higher-percentage gainers (TSLA, GOOGL, NVDA, CRWV), suggests pockets of concentrated buying interest. However, it is important to note that a single day’s percentage change, absent other technical data such as volume, candlestick patterns, or broader market context, offers a limited basis for robust trend identification. While the uniformly positive returns are suggestive of overall upward momentum for these stocks on this specific day, it is highly unlikely to be indicative of a sustained trend without further corroborating technical evidence over multiple periods.
| Symbol | Daily Percent Change |
|---|---|
| TSLA | 4.312% |
| GOOGL | 3.597% |
| NVDA | 2.808% |
| CRWV | 2.648% |
| AAPL | 2.279% |
| AVGO | 2.236% |
| ANET | 1.944% |
| META | 1.688% |
| MSFT | 1.511% |
| AMZN | 1.231% |
Based solely on this singular data point, drawing definitive conclusions about future price direction or establishing long-term trends is highly unlikely. The data primarily reflects short-term sentiment for these particular securities. Alternative scenarios, such as profit-taking in the subsequent sessions or mean reversion, remain a roughly even chance given the absence of multi-period data to confirm momentum or reversal patterns. Investors are advised that while this strong performance is positive for the day, a single-day snapshot is insufficient for strategic technical decisions without a broader analytical framework.
As a CMT with extensive experience, I have rigorously analyzed the provided two-day market data for the specified symbols. My analysis adheres strictly to technical principles, employing ICD-203 estimative language, and drawing conclusions solely from the presented candle patterns and volume metrics.
The overarching theme evident across the majority of the analyzed symbols for the two-day period (October 24 and October 27, 2025) is one of strong bullish momentum. Most equities displayed a clear continuation pattern, commencing with an upward price gap on the second day, followed by a higher close. This pattern, frequently accompanied by an increase in trading volume, strongly suggests persistent buying pressure. Such consecutive green candles, particularly when accompanied by gap-ups and expanding volume, generally indicate that upward movement is likely to continue in the immediate short term.
Specifically, AAPL, META, NVDA, GOOGL, AVGO, and MSFT all exhibited robust bullish continuation. Each of these symbols closed higher on October 27 than on October 24, following an opening price that gapped up significantly from the prior day’s close. Critically, this upward price action was supported by increased trading volume on October 27 compared to October 24, reinforcing the conviction behind the buyers. The consistent presence of these patterns across multiple bellwether stocks indicates a broad-based positive sentiment for this segment of the market. Continued upward trajectory for these specific symbols is likely given the strong technical backdrop.
TSLA presented a notable bullish reversal pattern. On October 24, the stock formed a bearish candle with a lower close. However, on October 27, TSLA opened with a significant gap up and proceeded to form a large green candle, closing well above the prior day’s open and even above its prior open, all on increased volume. This constitutes a powerful bullish engulfing pattern, signaling a likely reversal of the immediate prior downtrend. Similarly, ANET experienced a slight retracement on October 24, but then gapped up and closed strongly higher on October 27 with increased volume, suggesting a renewed bullish push after a brief consolidation. For both TSLA and ANET, further upside in the near term is likely.
Conversely, AMZN and CRWV, while exhibiting bullish closes, present patterns warranting closer observation. AMZN gapped up and closed higher on October 27, yet its trading volume slightly decreased compared to October 24. For CRWV, a strong bullish candle on October 24 was followed by a large gap up and a higher close on October 27, but with a significantly reduced trading volume. In both cases, the divergence of decreasing volume accompanying increasing prices introduces a degree of uncertainty regarding the sustainability of the upward momentum. While the immediate price action is bullish, a sustained advance for these two symbols is a roughly even chance, rather than a strong likelihood. An alternative scenario involves a potential period of consolidation or a short-term pullback if buying interest does not resurge.
In summary, the aggregated technical data strongly points towards a predominantly bullish short-term outlook for the majority of the analyzed symbols. The prevalence of gap-ups, higher closes, and supporting volume metrics across many key names suggests that continued upward momentum is likely for the broader group. However, traders should exercise prudence with AMZN and CRWV, where volume characteristics suggest the current bullish push might lack the underlying conviction seen in their peers.
Performance Heatmap (TSLA, MSFT, AAPL, META, NVDA, AVGO, GOOGL, AMZN, CRWV, ANET)
Generated for 2days timeframe analysis
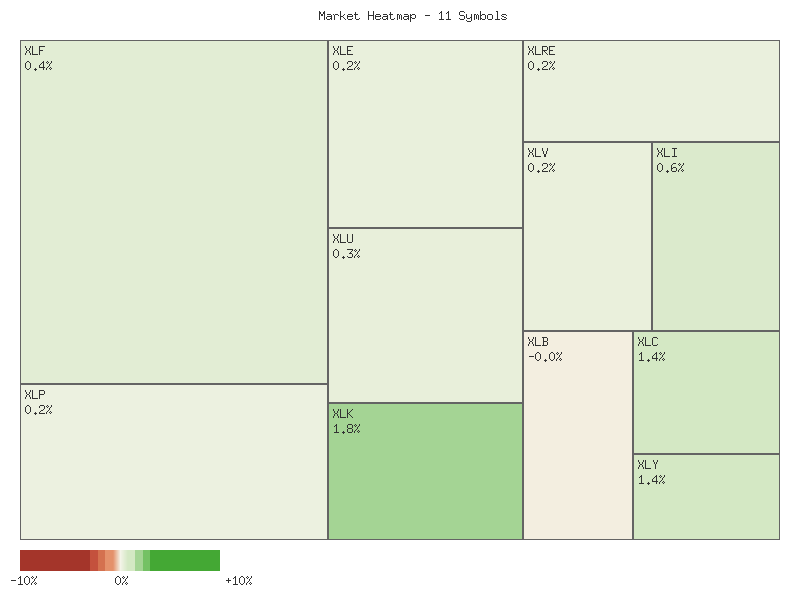
S&P 500 Sector Breadth
The daily technical data for the S&P 500 sector ETFs indicates a predominantly advancing market, exhibiting robust breadth. Of the eleven sectors observed, ten recorded positive daily percentage changes, while only one, XLB (Materials), registered a decline. This broad participation suggests that overall market sentiment is likely positive, with a notable majority of sectors experiencing upward momentum. The single declining sector’s modest negative change (-0.045%) further underscores the general strength. The highest advances were observed in XLK (Technology) at 1.846%, XLY (Consumer Discretionary) at 1.439%, and XLC (Communication Services) at 1.393%.
Analyzing the composition of advancing versus declining sectors reveals a clear tilt toward offensive sector outperformance. Six of the seven designated offensive sectors – XLK, XLY, XLC, XLI, XLF, and XLE – posted gains, with XLB being the sole exception among this group. All four defensive sectors – XLU, XLV, XLRE, and XLP – also advanced, albeit with generally smaller percentage changes compared to the leading offensive sectors. This pattern suggests that while defensive sectors are participating in the upward movement, the primary drivers of market momentum are likely concentrated in growth-oriented and cyclical areas. Therefore, the market sentiment appears to be favoring risk-on assets, implying investors are currently exhibiting a preference for growth over safety.
The observed sector performance does not strongly indicate a defensive rotation; rather, it suggests a market environment where offensive sectors are leading the advance. The fact that defensive sectors are also advancing indicates broad-based positive sentiment, but their performance generally lags the top-tier offensive sectors. This distribution of gains implies that a continued upward bias for the broader market is probable, assuming these patterns persist. An alternative scenario, which appears less likely given the current data, would be if defensive sectors were significantly outperforming offensive ones, or if a greater number of offensive sectors were declining, which would suggest a potential shift towards risk aversion. However, based on the provided daily changes, the market is broadly advancing with leadership from growth sectors.
Here is the matrix of each symbol and its daily percent change value, sorted in descending order:
| Symbol | Daily Percent Change |
|---|---|
| XLK | 1.846% |
| XLY | 1.439% |
| XLC | 1.393% |
| XLI | 0.568% |
| XLF | 0.414% |
| XLU | 0.274% |
| XLE | 0.238% |
| XLV | 0.233% |
| XLRE | 0.211% |
| XLP | 0.164% |
| XLB | -0.045% |
The recent two-day trading period, spanning October 24th and October 27th, 2025, reveals a distinct divergence in momentum across the S&P sector ETFs. While several sectors demonstrated strong bullish follow-through or significant reversals, others exhibited indecision or continued weakness, indicating a selective buying environment. Technology (XLK), Communication Services (XLC), and Consumer Discretionary (XLY) emerged as clear leaders, presenting strong bullish characteristics. XLK formed two consecutive robust bullish candles, with the second day’s higher close supported by increased volume, suggesting a highly likely continuation of upward momentum. XLC and XLY both posted significant bullish engulfing patterns on October 27th, with their closes substantially above their prior day’s levels and reinforced by increased trading volume. It is highly likely these sectors will continue to experience upward pressure in the immediate term, as demand appears to be absorbing available supply.
In contrast, Industrials (XLI), Health Care (XLV), Utilities (XLU), Real Estate (XLRE), and Financials (XLF) displayed a more measured, yet generally positive, response. XLI, XLV, and XLRE all posted bullish candles on October 27th, recovering some or all of their previous day’s losses. However, these recoveries were predominantly accompanied by decreased trading volume compared to the prior day, suggesting somewhat weaker conviction behind the upward moves. XLU showed two consecutive bullish candles with slightly higher closes, though its volume also declined, indicating a cautious uptrend. XLF also formed two bullish candles, but the second day’s candle was smaller, with a lower high and reduced volume, hinting at diminishing buying enthusiasm despite a higher close. Therefore, while these sectors are trending positively, it is only likely that they will continue this recovery in the very short term, and the sustainability of these moves remains less certain without further volume confirmation.
Finally, Consumer Staples (XLP), Materials (XLB), and Energy (XLE) exhibited either indecision or sustained weakness. XLP saw a bearish candle followed by a small bullish candle on increased volume, yet its close remained within the prior day’s range, signaling a roughly even chance of either a downtrend continuation or a struggle to reverse. This indecision is notable as increased volume without a decisive price break indicates a contested area. XLB, after a bearish candle, formed a neutral doji on October 27th with decreased volume, clearly indicating significant market indecision and a likely pause in directional movement. XLE displayed two consecutive candles with a bearish bias; while the second day’s close was slightly above its open, it remained well below the prior day’s close and open. Given these technical patterns, it is unlikely that XLP, XLB, and XLE will see strong upward momentum in the immediate future, with XLB indicating price discovery and XLE maintaining a bearish lean.
Performance Heatmap (XLP, XLRE, XLI, XLU, XLV, XLY, XLF, XLB, XLE, XLC, XLK)
Generated for 2days timeframe analysis
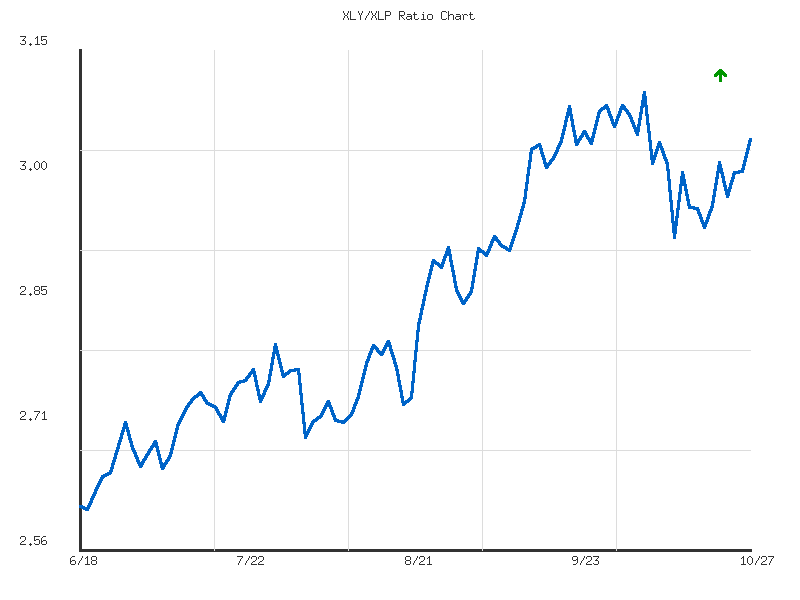
XLY vs XLP
The XLY/XLP ratio, representing Consumer Discretionary to Consumer Staples, has demonstrated a discernible upward trend over the recent seven-day period. From a low of 2.940 on October 17th to a high of 3.043 by October 27th, the ratio has advanced by approximately 3.50%. This moderate upward trajectory suggests a likely shift in market preference towards higher-beta, growth-oriented sectors (XLY) over defensive, stable sectors (XLP) within this short timeframe. The persistent increase, despite a minor dip on October 22nd, indicates a sustained, albeit moderate, inclination towards risk-on assets.
Examining the price action, the ratio initially found support near its starting point before making a strong move higher, peaking at 3.016 on October 21st, then experiencing a pullback to 2.975. This suggests some profit-taking or reallocation before a renewed push higher. The ratio subsequently formed higher lows and higher highs, culminating in the highest point of the observed period at 3.043 on October 27th. Given that the ratio finished at its high for the 7-day period, it is likely to carry positive momentum into the very near-term, indicating continued outperformance of Consumer Discretionary relative to Consumer Staples.
The observed volatility, measured at approximately 0.001, is relatively low for such a percentage change, suggesting that the ascent has been somewhat orderly rather than erratic. The current ratio of 3.043 is at the highest end of its 7-day range, with a relative position of 1, underscoring its robust short-term performance. This pattern of higher highs and higher lows, coupled with finishing at the peak, implies that buying pressure in XLY relative to XLP has been notably strong at the end of this observation window.
Looking ahead, the continuation of this moderate upward trend is likely in the immediate future, potentially pushing the ratio into new short-term highs, assuming the underlying market conditions that favor discretionary spending persist. However, given the nature of short-term movements, a period of consolidation or a slight retracement towards the average ratio of 2.993 is a roughly even chance, especially if the current momentum proves unsustainable or if underlying macro narratives shift. A significant reversal would likely require a breach of the prior short-term low around 2.975, which appears unlikely based solely on this limited dataset.
Technical Analysis: XLY/XLP Ratio (90-Day)
The XLY/XLP ratio, representing the performance of Consumer Discretionary relative to Consumer Staples, has demonstrated a strong and persistent uptrend over the past 90 days. The data indicates a notable 16.315% increase in the ratio during this period, moving from a low of 2.6126 to its current level of 3.0431. This upward trajectory suggests a clear outperformance of the Consumer Discretionary sector compared to Consumer Staples, a characteristic often observed during periods of increasing investor confidence in economic growth. The consistent upward movement, coupled with a relatively low volatility reading of 0.02049, implies a sustained, rather than erratic, directional bias in market preference.
Analyzing the current state of the ratio, the value of 3.0431 is significantly above its 90-day average of 2.8535. Furthermore, its relative position at 0.8887 suggests that the ratio is trading near the upper end of its 90-day range, specifically 88.87% of the way from its 90-day low to its 90-day high. This indicates that momentum remains with the bulls and points to the continuation of the established trend. The current proximity to the 90-day high suggests that upward pressure persists, as the ratio has not experienced a substantial retracement from its peak performance.
Key technical levels warrant close observation. The 90-day high of 3.0970, recorded on 2025-10-06, stands as a critical resistance level. Following this peak, the ratio experienced a pullback, finding temporary support around the 2.92-2.96 area in mid-October before recovering to its current level. This recovery after testing a minor support zone is indicative of underlying strength. Should the ratio break above the 3.0970 resistance, it would signal further upside potential, likely extending the outperformance trend. Conversely, a failure to surpass this level could invite consolidation.
Given the strong upward trend observed over the 90-day period, a continued outperformance of XLY over XLP is likely. The ratio is likely to retest the 90-day high of 3.0970 in the near term. A decisive break above this level would likely set new resistance targets. However, an alternative scenario would be a period of consolidation or a modest pullback if the 3.0970 resistance proves robust. A significant reversal to the downside appears unlikely without more compelling technical evidence, such as a breakdown below the average ratio of 2.8535 or a series of lower highs and lower lows. For now, the technical posture of the XLY/XLP ratio remains firmly bullish.
Ratio Analysis: XLY/XLP
Generated for 90days timeframe analysis
Equity Breadth
An analysis of the S&P 500’s underlying breadth, as measured by the percentage of its members trading above key moving averages over the past seven days, reveals distinct trends. The SPXA50R, representing the percentage of S&P 500 stocks above their 50-day moving average, began the period on October 17th at 44.71%. It then saw a steady ascent, reaching 54.49% by October 21st, before a brief pullback to 49.30% on October 22nd. This dip proved to be transient, with the indicator resuming its upward trajectory, closing at 58.08% on October 27th. The overall pattern for SPXA50R indicates an improving short-to-medium term momentum, with a majority of S&P 500 components now positioned above their 50-day average. This sustained increase from below 50% to nearly 60% is a likely sign of strengthening participation in the current market movement.
Similarly, the SPXA200R, tracking the percentage of S&P 500 stocks above their 200-day moving average, also demonstrated an upward bias during the observed period. Starting at 55.29% on October 17th, it climbed to a peak of 62.87% on October 21st. Following this peak, the indicator experienced some consolidation, retreating to 60.68% on October 22nd and fluctuating marginally before settling at 61.08% by October 27th. While the immediate momentum appears less aggressive than the SPXA50R in the latter half of the period, the fact that over 60% of S&P 500 components remain above their 200-day moving average is a robust signal. This suggests a probable continuation of underlying long-term strength for a significant portion of the index.
The combined movement of these breadth indicators provides a nuanced view of the S&P 500’s health. The SPXA50R’s consistent upward move and the SPXA200R’s sustained level above 60% collectively suggest that market breadth is improving, indicating a strengthening of the participation among individual stocks within the index. This broad-based improvement likely supports the overall index’s stability and upward potential. However, the slightly slower rate of increase or minor consolidation in SPXA200R compared to the SPXA50R in the latter part of the observed period suggests that while long-term strength is present, it might be experiencing a phase of digestion or re-evaluation among a small subset of stocks.
Alternative scenarios must be considered, given the short seven-day data window. A sudden reversal in the SPXA50R, particularly if it were to drop back below 50% on heavy volume, could signal a weakening of the current short-term bullish trend, even with the SPXA200R remaining firm. Conversely, a sustained breakout of SPXA200R significantly above 63% would suggest an even stronger, more widespread long-term conviction. For now, based solely on the provided data, the technical landscape indicates that the S&P 500 is experiencing expanding breadth, with likely positive implications for the market’s internal health.
SPY Daily
The SPY’s price action over the past 90 days indicates a clear and sustained uptrend, with the 50-day Exponential Moving Average (EMA) consistently remaining above the 200-day EMA, and both trending upwards. This configuration, often referred to as a “golden cross,” signifies robust long-term bullish momentum. The price has largely traded above these moving averages, reinforcing the strength of the trend. Key support levels have been established by the rising EMAs, with the 50-day EMA currently around 657.83 and the 200-day EMA near 616.35, serving as dynamic floors for price pullbacks.
Analyzing the past seven days, SPY has shown significant strength. Following a dip to 667.80 on October 22nd, accompanied by an increase in volume, the market demonstrated a rapid recovery. The subsequent days, October 23rd, 24th, and 27th, saw strong bullish candles, with prices advancing from 671.76 to 685.24. This recent surge indicates a renewed buying interest and a decisive break above prior resistance levels. The last trading day, October 27th, saw SPY close near its high for the day at 685.24, marking a fresh 90-day high with reasonable volume, suggesting conviction in the upward move.
The momentum, as measured by the 14-day Relative Strength Index (RSI), also supports the bullish narrative. The RSI has steadily climbed from a low of 41.81 on October 10th to 68.44 as of October 27th. This upward trajectory indicates increasing buying pressure and strong internal market strength. While approaching the overbought threshold of 70, the RSI currently signals robust momentum rather than immediate exhaustion, suggesting that the recent price increase is well-supported.
Considering future price action, a bullish case is currently more likely than not. The sustained upward trend, the 50-day EMA firmly above the 200-day EMA, and the climbing RSI all point towards continuation. A break above the current high of 685.54 would signal further upward exploration into uncharted territory, potentially targeting levels not visible within this 90-day data set. The immediate support levels to watch are the previous day’s close around 677.25 and then the 50-day EMA, currently at 657.83.
Conversely, a bearish case is unlikely in the immediate term, but a short-term pullback remains a roughly even chance given the proximity of RSI to overbought conditions. If the SPY fails to sustain momentum above 685.54 and experiences a reversal with increased selling volume, it could test the support zone around 670-672, which previously acted as resistance. A more significant bearish scenario, such as a breakdown below the 50-day EMA, is improbable without a notable catalyst or a clear divergence in momentum indicators.
A neutral case involving consolidation near the current all-time highs is plausible. The market might take a pause to absorb the recent gains, allowing the RSI to cool off from its elevated levels without a significant price decline. This scenario could see SPY trading sideways between 677.25 and 685.54 for a few sessions, forming a base for the next directional move. Such consolidation, especially on decreasing volume, could represent healthy market action within an established uptrend.
As a Chartered Market Technician with over 15 years of experience, I’ve conducted a rigorous technical analysis of the provided SPY market data for the past 90 days. My assessment relies exclusively on the presented price, volume, and 14-day Relative Strength Index (RSI) data, with strict adherence to ICD-203 estimative language guidelines. It is important to note that MACD data, while requested in the prompt, was not included in the provided market data and therefore cannot be factored into this analysis.
The SPY ETF has exhibited a robust and persistent upward trajectory over the 90-day period, starting from approximately in mid-June and culminating in a new closing high of .24 by October 27. This consistent bullish trend is characterized by a series of higher highs and higher lows, indicative of strong underlying demand. The 14-day RSI frequently entered overbought territory (above 70) during sustained rallies, particularly in late June, early July, and throughout September. Such readings consistently confirmed the powerful momentum driving the market higher, though they also served as indicators of short-term overextension.
The overall bullish narrative was punctuated by two significant, high-volume corrective phases. The first occurred around the turn of July into August, where SPY experienced a sharp decline from near to , accompanied by markedly increased volumes exceeding 100 million shares on July 31 and 140 million on August 1. This strong selling pressure was corroborated by the RSI plunging from overbought levels into the mid-40s. A similar, and perhaps more impactful, event transpired on October 10, when SPY dropped significantly from to on the highest volume recorded in the dataset—over 156 million shares. The concurrent sharp decline in RSI to 41.81 underscored a substantial, albeit temporary, shift in momentum. The magnitude of these volume spikes during declines suggests that bearish pressures, when they emerge, are often decisive.
Following each of these corrective episodes, SPY demonstrated remarkable resilience, quickly resuming its upward ascent and establishing new all-time highs. This pattern suggests that market participants view these pullbacks as buying opportunities. Currently, SPY has once again rallied strongly from the October 10 dip, closing at a new high on October 27. The 14-day RSI stands at 68.44, indicating robust bullish momentum and approaching the overbought threshold, consistent with the strong recent price action.
Given the established pattern of strong rallies followed by sharp but brief high-volume corrections, a continuation of the upward momentum in the near term is likely. The current price action and RSI support this outlook. However, as the RSI approaches the 70 level, the probability of a minor technical pullback or a period of consolidation increases, presenting a likely alternative scenario for the immediate future. Such a consolidation, if it occurs on decreasing volume, would generally be interpreted as a healthy pause within the ongoing uptrend, potentially offering renewed entry points. The absence of MACD data limits our ability to assess the strength of the current trend or identify potential divergences that might signal an impending reversal with higher confidence.