Daily Market Technical Analysis
The market exhibits significant divergence; SPY and QQQ have recovered to retest prior highs, with continued upward pressure likely for SPY but consolidation having a roughly even chance. Broad S&P 500 breadth is improving, indicating increasing underlying strength across the index. The VIX has undergone a strong bearish reversal, making further downside very likely, signaling reduced market uncertainty. Commodities are bifurcated, with energy highly likely to continue bullish, while precious and industrial metals face highly likely further declines. Select offensive sectors like Consumer Discretionary are highly likely to advance, contrasting with likely bearish continuation for defensive sectors, necessitating selective tactical positioning.
Market Indices
The analysis of the provided daily percentage change data for key market ETFs reveals a mixed, yet predominantly negative, market posture for the session.
| Symbol | Daily Percent Change |
|---|---|
| MDY | 0.352% |
| IJR | 0.285% |
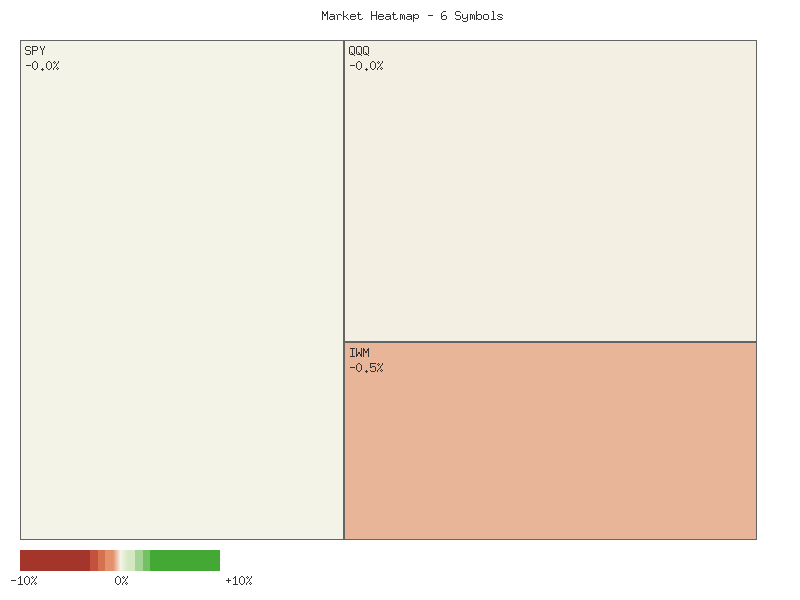
| SPY | -0.001% |
| QQQ | -0.026% |
| OEF | -0.131% |
| IWM | -0.471% |
Examining market breadth, two out of the six observed symbols registered positive daily percentage changes (MDY, IJR), while four symbols experienced declines (SPY, QQQ, OEF, IWM). This breadth reading, with a majority of key market proxies declining, likely indicates underlying weakness rather than broad market strength during this specific period. The prevalence of declining issues over advancing issues, particularly among widely followed indices, often suggests a cautionary shift in sentiment or active distribution within the market.
Within the dataset, MDY (Mid-cap) and IJR (Small-cap S&P 600) demonstrated modest positive performance, suggesting isolated pockets of strength. Conversely, IWM (Small-cap Russell 2000) was the weakest performer, exhibiting the largest decline. This divergence between two small-cap focused ETFs (IJR advancing, IWM declining) is noteworthy and likely highlights differing investor sentiment or sector-specific dynamics within the small-capitalization segment. The large-cap proxies, SPY and QQQ, registered marginal negative changes, while OEF, representing the S&P 100, also experienced a moderate decline. The relatively small magnitude of the changes in SPY and QQQ suggests a day without strong conviction for these mega-cap components.
Considering the technical landscape from this data, the overall market tone likely leans bearish for the day, primarily due to the negative breadth. The positive performance in MDY and IJR could represent a temporary rotational flow into mid- and specific small-cap segments or simply reflect their inherent resilience on this particular day. However, it is unlikely that this single day’s data, characterized by declining breadth and a weak IWM, signals the commencement of a robust upward trend. An alternative scenario is that the minimal changes in SPY and QQQ suggest a day of low volatility and minor price discovery; therefore, it is a roughly even chance that the slight declines in these major indices are merely noise. Nonetheless, the stronger decline in IWM and the overall negative breadth tilt the probabilities toward a continuation of mild selling pressure in the immediate term should this pattern persist.
As a CMT with over 15 years of experience, my analysis of the provided two-day market data reveals a nuanced and increasingly divergent landscape across various equity segments. The initial session on October 20th displayed broad-based bullish momentum, with SPY, QQQ, IWM, IJR, MDY, and OEF all recording positive closes near their daily highs, characterized by healthy upward price action and notable volume. However, the subsequent session on October 21st presented a more complex picture, with key indices exhibiting patterns of indecision, continuation, or reversal, suggesting a potential shift in market sentiment or at least a significant pause in the prevailing trend.
For the large-cap segments, represented by SPY and QQQ, the price action on October 21st created candlestick patterns that likely signal market indecision following the prior day’s gains. SPY opened higher, made a marginal new high, but closed almost precisely at its previous day’s closing price (671.30 vs. 671.29), forming a doji-like pattern. Similarly, QQQ opened higher, achieved a new high, but closed marginally below its prior close, also reflecting indecision. Both SPY and QQQ saw decreased trading volume on October 21st compared to the prior session, which typically accompanies pauses or weakens the conviction of a trend. The failure of these bellwethers to sustain their initial upward momentum and their closes effectively unchanged from the previous day suggest that continued upward momentum is unlikely without renewed buying pressure to break through this established equilibrium. OEF, representing the S&P 100, displayed a more pronounced bearish shift, opening higher but closing lower than its open and below the prior day’s close, forming a candlestick that likely indicates a bearish reversal or profit-taking.
Mid-cap performance, as observed in MDY, stood in contrast to the large caps, exhibiting strong bullish continuation on October 21st. MDY opened lower than its prior close but rallied significantly to form a new two-day high and close near its daily high, signaling robust buying interest. While its volume slightly decreased, the strong close indicates persistent upward momentum, making a continuation of its bullish trend highly likely in the immediate term. The small-cap segment, however, presented a significant divergence. IWM displayed a clear bearish reversal, opening below its prior close, making a lower high relative to the previous close, and closing near its daily low, forming a pattern that likely reflects distribution or profit-taking after the initial bullish surge. This suggests a potential weakening of demand for broad small-cap exposure.
Conversely, IJR, also a small-cap ETF, demonstrated robust bullish continuation. It opened lower than its prior close but rallied strongly, closing at a new two-day high and showing consistent upward pressure. Despite slightly decreased volume, this behavior strongly suggests sustained buying interest for IJR, making its continued upward trajectory likely. This contrasting behavior between IWM and IJR suggests that the underlying dynamics within small-cap indices are not uniform; while one composite (IWM) shows potential weakness, another (IJR) demonstrates strength, creating a mixed signal for the broader small-cap universe.
Considering the collective data, the broader market appears to be in a phase of significant transition and divergence. The indecision observed in large-cap indices, coupled with mixed signals across mid and small-cap segments, suggests that sustained uniform directional movement in the immediate future has a roughly even chance of being either bullish or bearish. While MDY and IJR demonstrate clear strength, the indecision in SPY and QQQ, alongside the outright bearish reversal in IWM and OEF, implies that market participants are assessing future direction. Traders should anticipate increased volatility and consider that a continuation of a broad-based rally is unlikely without a clear resolution of the indecision in large-cap benchmarks and renewed strength across all small-cap components. Monitoring key support and resistance levels established during these two days will be critical in discerning the market’s next directional move.
Performance Heatmap (SPY, QQQ, IWM, IJR, MDY, OEF)
Generated for 2days timeframe analysis
SPY Technical Outlook: October 21, 2025
Over the past 90 days, the SPY ETF has displayed a pronounced bullish trend, evidenced by a series of higher highs and higher lows from its June base around 600 to recent highs near 670. Initial strong upward momentum in late June and early July pushed prices from approximately 595 to 625, followed by a period of consolidation. A notable price surge in August lifted SPY from the low 620s to the mid-640s, indicating robust buyer interest. This upward trajectory continued into September and early October, where the SPY reached a peak around 673 on October 9th. This sustained advance suggests that the prevailing market sentiment has been largely optimistic.
However, the period under review was not without significant corrective movements. A sharp decline was observed on August 1st, where SPY dropped from 632.08 to 621.72 on elevated volume, temporarily interrupting the uptrend. More recently and notably, October 10th witnessed a substantial sell-off, with SPY falling from 671.16 to 653.02, accompanied by the highest trading volume in the provided dataset (156.6 million shares). This high-volume drop indicates strong selling pressure at that specific point. Post-October 10th, price action suggests a recovery attempt, with the SPY closing at 671.29 on October 21st, nearly retesting the previous highs prior to the sharp decline. This quick rebound from the October 10th low suggests underlying resilience.
Analyzing the 14-day Relative Strength Index (RSI) corroborates these price movements. The RSI entered overbought territory (>70) multiple times during periods of strong rallies, specifically in early July, late July, and mid-September, signaling that the asset was potentially overheated. The August 1st price correction coincided with a drop in RSI to 47.66, indicating a significant cooling of bullish momentum. Similarly, the sharp sell-off on October 10th propelled the RSI down to 41.81, approaching the oversold threshold, which historically can precede a rebound. Since this low, the RSI has recovered to 59.37, moving back towards the neutral zone and suggesting a restoration of positive momentum following the previous oversold condition. The RSI is currently not in overbought territory, implying there might be room for further upward movement before triggering another exhaustion signal.
Given the recent price recovery and the RSI moving out of potentially oversold conditions, it is likely that SPY will retest its recent highs around 673-674 in the near term. A sustained break above this resistance would imply a continuation of the broader bullish trend, with the next psychological resistance potentially around 675-680. However, the high-volume rejection on October 10th near these levels suggests that significant resistance exists. A roughly even chance exists for the market to consolidate around current levels before a clearer direction emerges. In an alternative scenario, failure to decisively breach the 673-674 resistance could lead to further sideways movement or a retest of the support established around the 653 level (the low from October 10th). A breakdown below 653 would be a bearish development, suggesting a deeper correction. It is important to note that the MACD (13-21 day) data was requested but not provided, thus limiting the breadth of momentum analysis.
SPY Price & Indicators (RSI_14_DAY, MACD_13_21_DAY)
As a CMT with over 15 years of experience, this analysis of QQQ focuses solely on the provided price, volume, and 14-day Relative Strength Index (RSI) data over the 90-day period. It is important to note that while the request specified MACD data, it was not included in the provided market information, thus no analysis of MACD can be performed.
QQQ has exhibited a robust uptrend over the past 90 days, characterized by a series of higher highs and higher lows. This sustained bullish momentum is clearly visible in the price action, which ascended from approximately in mid-June to recent highs above in October. Throughout this period, the 14-day Relative Strength Index (RSI) frequently entered overbought territory (above 70), confirming the strength of the bullish advances. Notable instances include the RSI climbing above 72 on June 30th and reaching over 73 on July 28th, alongside price peaks. However, the period also saw two distinct and sharp corrections, specifically on August 1st and October 10th. Both events were marked by significant declines in price on exceptionally high volume, suggesting strong selling pressure. On August 1st, QQQ dropped from an open of .54 to a close of .88 with nearly 70 million shares traded, correlating with a sharp decline in RSI from 65.47 to 48.26. Similarly, on October 10th, QQQ plummeted from an open of .40 to a close of .50 on record volume of over 94 million shares, which drove the RSI down from 69.27 to 45.42. These instances represent significant, albeit temporary, shifts in short-term momentum.
Following the sharp decline on October 10th, QQQ demonstrated a considerable recovery over the subsequent trading sessions. From its closing low of .50, the price rallied consistently, reaching .54 by October 20th and .38 on October 21st. This recovery has effectively retraced most of the losses incurred on October 10th and positions QQQ near its prior all-time highs around the level. The 14-day RSI also recovered rapidly, rising from its low of 45.42 post-October 10th to approximately 61.07 by October 20th and 60.92 by October 21st. This upward movement in RSI signifies the re-establishment of positive momentum. The current RSI level suggests that while buying pressure is present, it is not yet in an extreme overbought condition, which might otherwise signal an imminent pullback due to exhaustion. The rapid recovery from the October 10th plunge, occurring on decreasing but still substantial volume compared to the drop day, indicates resilient buying interest at lower price levels.
Considering the strong historical uptrend and the robust recovery from recent pullbacks, a continuation of the bullish trend for QQQ is likely in the near term. The ability of the market to swiftly recover from significant selling events, as seen on August 1st and October 10th, suggests underlying strength. The immediate challenge for the price will be to decisively break above the recent resistance zone around -, which coincides with the October 9th high. A breakout above this level would probably lead to new all-time highs. However, a period of consolidation or a minor pullback before a sustained move higher is a roughly even chance, particularly if the - resistance proves resilient initially, or if the RSI quickly re-enters overbought territory. A significant bearish reversal from current levels, leading to a breakdown below the October 10th low of .50, appears unlikely without additional technical deterioration or a failure to break new highs over several sessions. Should such a breakdown occur, the next significant support would likely be around the mid-August lows in the - range, which aligns with the price levels before the late-August rally.
QQQ Price & Indicators (RSI_14_DAY, MACD_13_21_DAY)
Technical Analysis of IWM over the Past 90 Days
IWM has exhibited a discernible uptrend over the past 90 available trading days, characterized by a series of higher highs and higher lows. This upward trajectory has been punctuated by several notable pullbacks and consolidations. Analysis of the daily candle data reveals significant price action, with key resistance zones emerging around the 223, 226, 238, and 245-247 levels as the equity advanced. The most recent price action pushed IWM to a high of 250.33 on October 15th, representing the peak within this observed period. Volume analysis indicates that while some upward moves were accompanied by strong volume, several significant declines also saw elevated trading activity, suggesting that price advances faced notable selling pressure at times.
The 14-day Relative Strength Index (RSI) has largely corroborated the underlying bullish momentum, though it has frequently registered in overbought territory (above 70). Instances such as July 3rd (RSI 71.57) and September 18th (RSI 71.23) were followed by periods of price consolidation or minor pullbacks, which is a common characteristic of an overbought condition. Despite these short-term retracements, the RSI has demonstrated remarkable resilience, rarely dipping below the 40-mark; its lowest reading was 41.36 on August 1st. This pattern suggests that underlying buying interest remains robust, with dips tending to attract demand rather than leading to extended declines. The current RSI reading of 55.72 (as of October 21st) positions momentum in neutral territory, offering no strong directional bias from this indicator alone.
A critical period for IWM occurred in early October. On October 10th, the equity experienced a sharp decline on exceptionally high volume (nearly 70 million shares), which is a significant bearish signal, possibly indicating aggressive profit-taking or a shift in investor sentiment. This price drop coincided with the RSI falling to 44.97, its second-lowest point within the 90-day window. However, the subsequent trading days saw a robust bounce, with IWM reclaiming much of the lost ground by October 15th, closing at a new high of 250.33, also on elevated volume. This rapid recovery suggests that demand quickly re-emerged following the sharp sell-off, indicating continued underlying strength.
Given the recent volatile price action and the neutral RSI, the immediate future direction of IWM appears finely balanced. There is roughly an even chance that IWM could either re-test the support level around the October 10th low of 237.79 if selling pressure resurges, or resume its upward trend toward new highs if buyers can maintain their recent momentum. A sustained move and close above the October 15th high of 250.33 on strong volume would likely indicate a continuation of the broader uptrend. Conversely, a decisive breakdown below the 237.79 level, especially if accompanied by high volume, would likely signal a deeper correction. The absence of strong overbought or oversold signals from the RSI at present reinforces the expectation of a more balanced market, pending a clear breakout or breakdown from these recent price levels.
IWM Price & Indicators (RSI_14_DAY, MACD_13_21_DAY)
VIX Fear Index
The VIX experienced a significant increase in volatility early in the observed seven-day period, reaching a high of 22.44 on October 10th and closing at 21.66. After some consolidation, a critical technical event occurred on October 17th. On this day, the VIX opened significantly higher at 28.41 and momentarily touched an intraday high of 28.99. However, it failed to sustain these elevated levels, closing sharply lower at 20.78. This price action formed a distinct candlestick pattern characterized by an exceptionally long upper shadow, commonly known as a “shooting star.” Such a pattern is a strong bearish reversal signal, indicating that buying pressure was overwhelmed by selling pressure at higher prices. It is very likely that this rejection signifies a peak in short-term fear or uncertainty, as market participants aggressively sold into the initial surge.
Following the decisive rejection of higher prices on October 17th, the VIX has exhibited persistent bearish momentum. The subsequent trading session on October 20th saw a clear continuation of this downward trend, with the VIX opening at 20.53 and closing markedly lower at 18.23, marking its intraday low. This robust bearish candle reinforced the weakening sentiment established by the prior session’s reversal. The decline continued into October 21st, with the VIX opening at 18.65 and closing at 17.87, again near its intraday low of 17.40. The daily percentage change for October 21st, indicating a nearly 2% decline, further corroborates the immediate bearish pressure. The sequence of lower highs and lower closes, alongside the VIX consistently finishing near its intraday lows for the past two days, makes it likely that downward pressure will continue in the immediate future.
The VIX’s recent price action, characterized by a sharp rise followed by a swift and sustained decline from 28.99 to 17.87, suggests a reduction in immediate market uncertainty. The dominant technical signal is the strong bearish rejection on October 17th, which has been confirmed by subsequent lower closes. Therefore, it is very likely that the VIX will continue to trend lower, seeking out potential support levels. A roughly even chance exists that the current level around 17.87 could offer temporary consolidation before further downside. However, an alternative scenario, though less likely, involves the VIX finding a short-term bottom and attempting a bounce. This would necessitate a new catalyst for fear not evident in the provided data. Based solely on the observable data patterns, the prevailing technical indication is for continued VIX weakness rather than a significant rebound or prolonged sideways movement.
As a Chartered Market Technician with over 15 years of experience, I’ve analyzed the provided 90-day VIX candle and 14-day RSI data to assess the current market volatility outlook. It is important to note at the outset that the MACD indicator data was not provided in the dataset, therefore this analysis will focus exclusively on the available VIX price action and Relative Strength Index (RSI).
Over the past three months, the VIX index has exhibited a characteristic pattern of pronounced spikes followed by retreats, rather than a clear directional trend. The period began with VIX fluctuating between approximately 16.00 and 22.00 in June and July. A notable surge on August 1st pushed the VIX to 20.38, after which it retreated and established a lower trading range, frequently finding support around the 14.00-15.00 level through mid-September. The most significant volatility event in this dataset occurred on October 10th, when the VIX closed at 21.66, representing one of the highest daily closes observed. This surge, however, was immediately followed by a decline, with the index closing at 17.87 on October 21st. The consistent absence of volume data for all entries in the provided dataset precludes any analysis of underlying buying or selling pressure based on volume metrics.
The 14-day Relative Strength Index (RSI) largely mirrored these price movements, effectively signaling momentum shifts. For much of the 90-day period, the RSI generally oscillated within the neutral 40-60 range, correlating with the VIX’s fluctuating, non-trending price action. During major VIX rallies, such as the one on August 1st, the RSI climbed to 65.38, approaching overbought conditions. The most prominent signal from the RSI occurred on October 10th, when it reached a distinctively overbought level of 73.09, coinciding precisely with the VIX’s peak close of 21.66. This strong overbought reading typically signals a high probability of a near-term price reversal or consolidation. Subsequently, the RSI has experienced a significant decline, currently standing at 51.13, which is near the midpoint of its neutral zone.
Considering the recent data, the VIX is currently at 17.87, having pulled back significantly from its mid-October highs of over 21.00. The 14-day RSI, now at 51.13, has moved from deeply overbought territory to a neutral level. This indicates a strong dissipation of the upward momentum that drove the VIX higher earlier in October. A further decline in the VIX towards the established support zone of 16.00-17.00, which held through much of late September and early October, is likely in the near term. Conversely, a re-acceleration of the VIX back towards or above 19.00 would require new upward momentum, and this scenario is currently considered less likely given the RSI’s current trajectory. There is roughly an even chance that the VIX could consolidate around current levels before making a more decisive move. Market participants should monitor for sustained breaks below 17.00 or above 19.00 for directional confirmation.
VIX Price & Indicators (RSI_14_DAY, MACD_13_21_DAY)
Tech Sector Analysis
The provided 14-day technical data for the QQQ/SPY ratio indicates a clear sideways trend, characterized by weak strength. Over this period, the ratio has fluctuated within a narrow band, ranging from a low of approximately 0.9013 to a high of 0.9109. This tight trading range suggests a period of consolidation where the technology-heavy NASDAQ-100 (QQQ) has largely maintained its relative performance against the broader S&P 500 (SPY), exhibiting neither significant outperformance nor underperformance on a consistent basis. The net change in the ratio over the full 14 days, approximately 0.9189%, reflects a marginal upward drift, but this is within the bounds of what is considered a weak, sideways movement. The average ratio during this period was approximately 0.9061, with the current ratio standing at 0.9107.
A closer examination of the individual data points reveals that the ratio spent the initial part of the observation period testing the lower bound around 0.9013, before advancing towards the upper end of its range. The ratio reached its high point of 0.9109 on 2025-10-20 and closed marginally below it at 0.9107 on 2025-10-21. This places the current ratio at approximately 97.67% of its 14-day range, suggesting it is trading near the upper boundary of its recent consolidation. A notable technical characteristic is the extremely low volatility, recorded at roughly 0.00001029. This low volatility is highly consistent with the described weak, sideways trend, indicating a lack of strong conviction from market participants to push the relative performance in a definitive direction during this period. The established resistance level is at approximately 0.9110, while immediate support appears to be forming near the average ratio of 0.9061, with a stronger support at the 0.9013 low.
Given the established weak sideways trend and extremely low volatility, a continuation of range-bound trading for the QQQ/SPY ratio is likely in the immediate term. The ratio’s current position near the upper end of its 14-day range, specifically at 0.9107, suggests it is testing the resistance at 0.9110. There is a roughly even chance that the ratio could experience a minor breakout above this resistance, indicating a temporary period of modest QQQ outperformance. However, due to the weak underlying trend strength, such a breakout would likely lack significant follow-through, potentially leading to a return to the consolidation range. Conversely, a reversal from current levels and a move back towards the average ratio of 0.9061 or the lower bound of 0.9013 is also a roughly even chance scenario. A decisive breakdown below 0.9013, signaling significant QQQ underperformance, is unlikely without a preceding increase in volatility and a clear shift in the trend’s reported strength.
Technical Analysis: QQQ/SPY Ratio (90-Day)
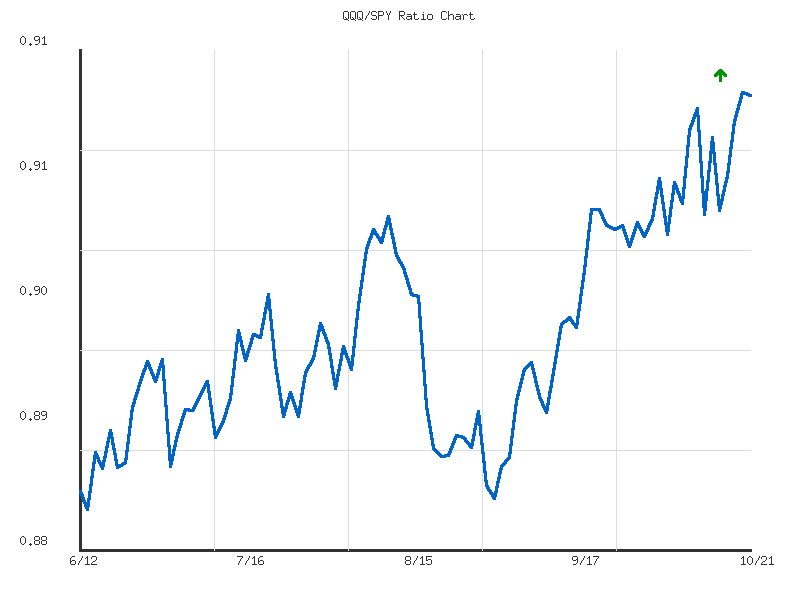
The QQQ/SPY ratio over the past 90 days exhibits a clear and moderately strong upward trend, indicating consistent outperformance of the Nasdaq 100-tracking QQQ relative to the S&P 500-tracking SPY. Starting near 0.8839 in mid-June, the ratio has systematically advanced, closing on the most recent data point at 0.91075. This represents a cumulative relative strength gain of approximately 3.04% throughout the observed period. The trend’s moderate strength, coupled with a notably low volatility figure of 0.00005, suggests a controlled and persistent accumulation of relative strength in QQQ, rather than volatile, high-momentum swings. This sustained upward movement is a dominant technical characteristic evidenced in the provided data.
Currently, the ratio’s position is particularly noteworthy, closing at 0.91075, which is just shy of its 90-day high of 0.91097, recorded on the preceding trading day. This extreme relative position, quantified at 0.992, signals that the ratio is actively testing the upper boundary of its historical range for the past three months. From a technical vantage, this level functions as immediate overhead resistance. A decisive breakout above 0.91097 would establish a new short-term peak for QQQ’s relative performance, which would likely be interpreted as a continuation of the established upward trend. Conversely, the ratio’s proximity to a multi-month high suggests that bullish momentum may encounter increased selling pressure or profit-taking, leading to potential hesitation at these elevated levels.
Should the ratio encounter substantial resistance at its current highs, a short-term pullback or consolidation is a plausible scenario. Immediate support levels would likely form around previous minor swing highs, specifically the 0.908 to 0.910 zone observed earlier in October, and the more significant 0.900 to 0.903 zone from late September and early August. A more robust support area could be found at the 90-day average ratio of 0.89455. A retracement to these levels would generally be viewed as a healthy consolidation within the broader ascending channel. However, a sharp and significant reversal below the 0.890 level appears unlikely in the immediate term, given the moderate, persistent upward momentum and the absence of any distinct bearish reversal patterns or divergences within this dataset.
Considering the established upward trend, moderate strength, and the ratio’s current proximity to its 90-day high, it is likely that the QQQ/SPY ratio will continue to probe and attempt to surpass the 0.91097 resistance level in the near future. A successful breakout above this ceiling would increase the likelihood of further relative outperformance by QQQ. Conversely, a failure to decisively breach this resistance, especially if followed by a close below proximate support levels like 0.908, would suggest a roughly even chance of a short-term consolidation or a minor pullback towards the 0.895-0.900 range before any renewed attempts at higher ground. A substantial deterioration of the moderate upward trend would necessitate a more pronounced break below key support, which is not currently indicated by the provided data.
Ratio Analysis: QQQ/SPY
Generated for 90days timeframe analysis
IWM vs. SPY
The IWM/SPY ratio, representing the relative performance of the Russell 2000 against the S&P 500, exhibits a weak upward trend over the observed 14-day period, as explicitly indicated by the provided trend analysis. The ratio commenced on 2025-10-01 at approximately 0.3628 and concluded on 2025-10-21 at 0.3679. This movement translates to a modest 1.42% increase in the ratio over the fourteen trading sessions. This overall weak positive drift suggests a slight, albeit limited, outperformance of small-cap stocks relative to large-cap stocks during this specific timeframe.
A more detailed examination of the data points reveals a nuanced trajectory within this weak upward trend. The ratio advanced from its initial value, peaking at 0.3763 on 2025-10-15. Subsequent to this peak, the ratio experienced a discernible retreat, closing at 0.3679 on 2025-10-21. This decline from the high suggests a likely shift in short-term momentum. The formation of a lower high on 2025-10-20 at 0.3697, followed by the current closing value, strongly implies that the previous upward impulse has weakened considerably, and a period of consolidation or further decline is likely.
The volatility for the period, measured at 0.00001336, indicates a relatively contained trading range for the ratio itself, suggesting that while the direction was weakly upward, the daily fluctuations were not extreme. The current ratio’s relative position within its 14-day range, at approximately 0.38, further corroborates the recent decline from the high, placing it closer to the lower end of its observed range. This positioning, alongside the recent price action, provides an additional technical indicator reinforcing the likely loss of upward momentum.
Considering the technical patterns observed, it is likely that the IWM/SPY ratio will either consolidate sideways or continue to decline in the immediate short-term. A retest of the 0.3763 high from 2025-10-15 is unlikely without a clear and sustained breakout above recent resistance levels, such as the 0.3697 mark from 2025-10-20. Alternatively, there is a roughly even chance the ratio could stabilize around its current level before a clearer directional bias emerges. Based solely on this data, it is likely that large-cap stocks (SPY) will exhibit stronger performance or lesser decline compared to small-cap stocks (IWM) in the sessions immediately following 2025-10-21.
Technical Analysis: IWM/SPY Relative Performance (90-Day View)
Our analysis of the 90-day IWM/SPY ratio data indicates a moderate upward trend in the relative performance of the Russell 2000 (IWM) compared to the S&P 500 (SPY). Over this period, the ratio has seen a net increase of approximately 4.4%, reflecting a consistent, albeit moderate, outperformance by small-cap equities. The average ratio across this timeframe stands at 0.3584, with the current ratio of 0.3679 positioning it above this average, suggesting the recent strength aligns with the broader trend. The observed volatility for the period is notably low (0.00005266), which suggests that while the trend is upward, movements have been relatively stable rather than highly erratic.
A closer examination of the ratio’s price action reveals a discernible range. The lowest point was established at 0.3456 on August 1st, 2025, from which the ratio mounted a steady advance, forming a series of higher lows and higher highs. The most recent peak occurred on October 15th, 2025, reaching 0.3763. This level appears to have acted as a temporary resistance, as the ratio subsequently experienced a pullback, declining to 0.3663 by October 17th. Following this retreat, the ratio attempted a rebound, briefly touching 0.3696 before settling at its current value of 0.3679 as of October 21st, 2025. The current relative position, at approximately 72.6% of the way from its 90-day low to its high, indicates that the ratio remains in the upper quartile of its recent range.
From a pattern perspective, the sequence of higher lows observed since early August, notably around the 0.3456 area, and subsequent rallies implies a constructive environment for small-cap relative strength. Intermediate support appears to have formed around the 0.361-0.362 area, based on prior consolidations in mid-September. The recent rejection from the 0.3763 level suggests this point will likely represent the immediate overhead resistance. A sustained break above this level would be a strong indication of continued small-cap outperformance. Conversely, a failure to hold above the intermediate support levels would increase the probability of a more pronounced correction in relative strength.
Given the moderate upward trend and the current position near the upper end of its 90-day range, continued small-cap outperformance is probable, particularly if the ratio can challenge and overcome the October 15th high. However, the recent pullback from the 0.3763 resistance suggests that a period of consolidation or a minor retracement is possible before another attempt to push higher. It is roughly even chance that the ratio tests the 0.361-0.362 support zone in the near term if the current rebound attempt falters. Should this support hold, renewed upward momentum would be likely, reinforcing the established trend. If that support were to fail, a more significant shift in relative strength, possibly towards the 0.350-0.355 range, would become likely.

Ratio Analysis: IWM/SPY
Generated for 90days timeframe analysis
Commodities
| Symbol | Daily Percent Change |
|---|---|
| UNG | 1.701% |
| USO | 0.649% |
| UGA | -0.114% |
| CORN | -0.626% |
| DBC | -1.030% |
| CPER | -2.209% |
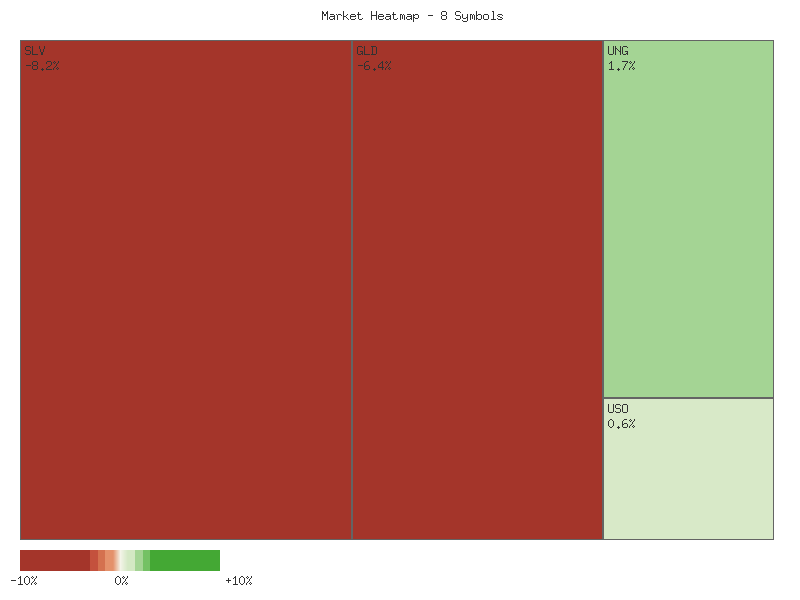
| GLD | -6.427% |
| SLV | -8.236% |
The analysis of the provided daily percent change data for the selected commodity-related symbols indicates a predominantly negative market breadth for the observation period. Out of the eight symbols, six registered declines, while only two experienced gains. This translates to an advancing-to-declining ratio of 1:3, suggesting a clear bearish sentiment across a majority of the observed commodity and precious metal assets. The significant numerical dominance of declining symbols implies that a broad-based upward momentum was unlikely in this specific sector during the trading day, with market participants exhibiting a preference for exiting or shorting positions in several key areas.
Further examination of the individual performance highlights specific areas of weakness and strength. UNG (Natural Gas) and USO (Oil) emerged as the only advancers, with UNG showing a notably strong gain of 1.701%, making it the top performer. USO also posted a respectable, albeit more modest, gain of 0.649%. This suggests that energy-related commodities might be demonstrating a degree of resilience or specific bullish drivers that are not present in other sectors. However, the gains in these two symbols are largely overshadowed by the widespread declines elsewhere, preventing a more robustly bullish assessment for the broader commodity complex.
On the downside, SLV (Silver) and GLD (Gold) experienced substantial losses, with SLV plummeting by -8.236% and GLD by -6.427%. Such significant single-day declines in precious metals are noteworthy and suggest a pronounced shift in sentiment or significant selling pressure within this segment. CPER (Copper) also registered a notable decline of -2.209%, indicating weakness in industrial metals. The broad-based commodity fund DBC, along with CORN, also posted negative returns, although their magnitudes were less extreme than those of precious metals and copper. UGA (Gasoline) saw a marginal decline of -0.114%, indicating relative stability compared to other decliners.
Considering the collective performance, it is likely that selling pressure was concentrated in precious and industrial metals, as evidenced by the sharp drops in SLV, GLD, and CPER. The observed market breadth, where a significant majority of symbols are declining, indicates that traders with exposure across a diversified basket of these commodities would likely have experienced negative returns for the day. While the energy sector (UNG, USO) showed isolated strength, the overall technical picture, based solely on this single day’s percentage changes, suggests that the sentiment for the broader commodity and precious metals complex was notably bearish. It remains uncertain whether this represents a transient retracement or the initial phase of a more prolonged downturn for the underperforming assets; however, the widespread nature of the declines makes a positive continuation for the broader market on a subsequent day seem unlikely, unless external factors not present in this data fundamentally shift sentiment.
As a seasoned CMT observing the recent two-day trading activity, a focused analysis of the provided market data reveals distinct short-term technical patterns and momentum shifts across various commodity instruments. It is crucial to remember that this analysis is strictly confined to the given two daily candlesticks and associated volume, limiting the scope for long-term projections but allowing for clear identification of immediate directional biases.
The energy sector, represented by USO (US Oil Fund) and UNG (US Natural Gas Fund), exhibits a notably bullish short-term structure. USO printed two consecutive green candlesticks, with the second day showing higher volume compared to the first. Although the second day’s candle (2025-10-21) had a noticeable upper wick, suggesting some intraday selling pressure near the highs, the overall close was positive and above the prior day’s close. UNG presents an even more compelling bullish picture, with two robust green candles closing near their respective daily highs, accompanied by increasing volume. This price action, combined with rising volume, makes a continuation of the upward momentum highly likely for UNG and likely for USO in the immediate future, barring any significant shifts in subsequent price action.
Conversely, the precious metals complex, specifically SLV (iShares Silver Trust) and GLD (SPDR Gold Shares), demonstrated a pronounced bearish reversal. Both assets experienced a significant gap down at the open on 2025-10-21, followed by a large bearish candle closing near the daily lows. The volume on this bearish day for both SLV and GLD dramatically increased, nearly doubling for SLV and showing a substantial rise for GLD, indicating strong conviction behind the selling pressure. This combination of a gap down, large bearish candle, and surging volume constitutes a highly potent bearish signal, making further downside price action highly likely for both silver and gold in the near term.
Moving to broader and industrial commodities, DBC (Invesco DB Commodity Index Tracking Fund) and CPER (United States Copper Index Fund) also showed signs of bearish sentiment. DBC experienced a clear bearish reversal on 2025-10-21, with its close significantly below the open of the prior bullish day, all on increased volume. This pattern suggests a shift in short-term control to sellers, making a continued bearish bias likely. CPER similarly showed a bearish engulfing pattern on 2025-10-21, opening with a gap down and closing well below the prior day’s range, supported by increased volume. This setup also indicates likely bearish continuation for copper.
The agricultural commodity, CORN (Teucrium Corn Fund), displayed a more subdued and less decisive picture. After an almost flat candle on 2025-10-20 with exceptionally low volume, 2025-10-21 presented a small bearish candle with only a slight increase in volume. Given the minimal price movement and persistently low volume, a strong directional move in the immediate term appears unlikely for CORN, although a marginal bearish bias is present. UGA (US Gasoline Fund) presented a mixed signal: a bullish candle on 2025-10-20 was followed by a mildly bearish candle on 2025-10-21 with reduced volume. However, the second day’s candle featured a notable lower wick, suggesting some intraday buying interest. The conflicting signals of a slightly lower close but evidence of support from the lower wick indicate a roughly even chance for either short-term direction for UGA, necessitating further confirmation.
In summary, the provided two-day data suggests a divergence in immediate technical outlooks across the observed commodity spectrum. The energy complex (USO, UNG) exhibits strong bullish momentum, while precious metals (SLV, GLD) are undergoing significant bearish reversals. Broader commodity indices and industrial metals (DBC, CPER) also lean bearish. Agricultural commodities like CORN show limited conviction, and UGA presents an ambiguous picture, with buying interest contesting bearish pressure. Traders should be mindful that these observations are based on limited data, and while the identified patterns provide immediate directional bias, any subsequent candle could present a counter-signal.
Performance Heatmap (SLV, GLD, CORN, CPER, USO, DBC, UGA, UNG)
Generated for 2days timeframe analysis
Technical Analysis of SLV (90-Day View)
Over the past 90 days, SLV has exhibited a discernible primary uptrend, commencing from approximately .85 in mid-June and culminating in a peak near .40 in mid-October. The initial phase of this period, spanning from mid-June to early July, involved price consolidation within a roughly .50 to .50 range, characterized by generally moderate trading volumes. A significant breakout occurred in early July, with volumes surging on July 10-11 as the price moved from .31 to .03. Following a brief correction, the uptrend re-established itself with notable momentum from late August, pushing SLV to progressively higher highs. This strong bullish phase was consistently supported by elevated trading volumes, particularly during breakout periods, indicating robust buying interest.
The Relativ Strength Index (RSI) for SLV (14-day) broadly correlated with price movements, reflecting the underlying momentum. During the initial consolidation in June and July, RSI oscillated primarily in the mid-50s to low-60s. As the uptrend gained traction from late August into September and October, the RSI frequently entered overbought territory, exceeding 70 on multiple occasions. Notably, on October 13, the RSI reached an extreme reading of 84.32, signaling that the asset was significantly overbought. This extreme overbought condition occurred just before the recent sharp decline, which commenced from the peak observed on October 15. The rapid descent of RSI from this highly overbought level to 52.87 by October 21 suggests a substantial and rapid shift in short-term momentum.
Recent price action, specifically from October 15 to October 21, presents a critical inflection point. After peaking at .405 on October 15, SLV experienced a sharp and significant decline, closing at .79 on October 21. This roughly 9.5% drop occurred over a few trading days and was accompanied by substantial trading volumes on October 17 (.04M) and October 21 (.01M). The close on October 21 near the day’s low suggests strong selling pressure into the end of the period. This rapid deterioration in price, combined with the swift return of the RSI from extreme overbought levels to neutral territory, indicates a likely reversal of the immediate short-term bullish momentum.
Based solely on the provided technical data, a continuation of the near-term downward pressure is likely. The sharp decline from an overextended position, coupled with the cooling of the RSI and significant selling volume, increases the probability of further price correction or at least a period of consolidation. The lack of MACD data, which was requested but not provided, prevents a more comprehensive assessment of momentum divergence or crossover signals. An alternative scenario is that the current decline represents a healthy correction within the broader 90-day uptrend. However, given the magnitude and velocity of the recent price drop, a period of stabilization or potential further retracement toward previous support levels, perhaps around the .00 - .00 range (which acted as resistance in mid-September before becoming support), is roughly even chance as a next technical development. A swift resumption of the prior uptrend from current levels appears unlikely without new technical catalysts or a significant deceleration in selling pressure.
SLV Price & Indicators (RSI_14_DAY, MACD_13_21_DAY)
GLD has exhibited a dynamic shift in its price action over the past 90 days, transitioning from a period of consolidation and minor declines to a robust and accelerated uptrend, culminating in a dramatic bearish reversal. From early June to late July, GLD traded largely sideways or with a slight downward bias, marked by fluctuations primarily within the - range. Volume during this initial phase was generally moderate, consistent with a period lacking strong directional conviction. However, starting in August and intensifying through September and early October, GLD commenced a powerful upward trajectory, consistently carving out higher highs and higher lows. This sustained rally saw the price advance from below in late July to surpass the mark by October 20.
The strength of this uptrend was substantially supported by momentum as observed in the 14-day Relative Strength Index (RSI). After residing in neutral territory throughout the earlier period, the RSI decisively moved into overbought conditions (above 70) by early September and remained profoundly overextended for an extended period. The indicator reached extreme readings, peaking at 86.11 on October 8 and an even more elevated 87.33 on October 20. While such elevated RSI values underscore intense buying pressure, they also frequently suggest an increasingly precarious price level, indicating that the asset is vulnerable to a pullback as momentum becomes unsustainable. The significant increase in trading volume on days like October 17 (over 61 million shares), which saw a high of 397.28 but closed lower at 388.99, likely points to an initial emergence of selling pressure or profit-taking at higher levels, even as the overall trend remained positive.
A critical shift in market sentiment is evident from the most recent data points. Following GLD’s peak close of 403.15 on October 20, accompanied by a historically high RSI reading of 87.33, the subsequent trading day on October 21 presented a stark reversal. GLD experienced a substantial decline, opening lower and failing to recover, ultimately closing at 377.24. This significant single-day drop of over 6% from the prior close, forming a large bearish candle, suggests a decisive change in short-term direction. Crucially, this downturn occurred on exceptionally high volume (53.69 million shares), surpassing even the heavy volume of October 17. The concurrent plunge of the RSI from its extreme overbought level of 87.33 down to 60.02 in a single session dramatically illustrates the abrupt exhaustion of upward momentum and the capitulation of bullish sentiment.
Considering the confluence of these strong technical signals—a substantial price reversal on very high volume from an extended uptrend, confirmed by a dramatic decline from extreme overbought RSI levels—it is highly likely that GLD has entered a period of significant short-term correction. Continued downside pressure is likely in the immediate future, with GLD testing potential support levels at lower price points. A re-test of the recent highs above in the coming days is highly unlikely. There is a roughly even chance that prices may consolidate or attempt to rebound modestly after such a sharp move, but without fresh buying impetus, any such rebound is likely to be met with renewed selling pressure. Traders are advised to exercise considerable caution, as the prevailing technical pattern strongly suggests further bearish momentum for GLD in the near term.
GLD Price & Indicators (RSI_14_DAY, MACD_13_21_DAY)
Gold/Silver Ratio
The GLD/SLV ratio has exhibited a moderate upward trend over the observed 14-day period, increasing by approximately 3.83% from October 1st to October 21st. The ratio commenced at 8.297 and concluded at its peak of 8.614, positioning it at the highest point of its recent trading range. This relative performance indicates a period where gold (GLD) has generally outperformed silver (SLV) on a comparative basis within this timeframe.
A closer examination reveals a significant strengthening of the ratio in the latter part of the period. After establishing a low of 8.000 on October 13th, the ratio then rallied consistently, culminating in a sharp advance on October 20th and 21st. The final day’s substantial increase from 8.448 to 8.614 is particularly notable. This surge was primarily driven by a larger percentage decline in SLV (approximately -8.2%) compared to GLD (approximately -6.5%) on October 21st, indicating that silver’s underperformance intensified during a broader commodity pullback, thereby propelling the ratio higher. While the overall volatility measured at 0.027 suggests relatively stable movement, it does not fully capture the recent acceleration in the ratio’s upward momentum.
Given the strong close at the period’s high and the established “up” trend, it is likely that the GLD/SLV ratio will attempt to sustain its upward trajectory in the immediate short term. This suggests continued favoritism towards gold, or at least a lesser degree of selling pressure, compared to silver. However, it is also important to consider alternative scenarios. A ratio at its high implies an extended move, making it roughly even chance that we could see a consolidation or a minor pullback in the near future as market participants digest the recent gains. Should profit-taking intensify on GLD, or should SLV demonstrate renewed relative strength, a retracement towards the average ratio of 8.265 is a plausible outcome. The absence of volume data precludes a deeper assessment of the conviction behind these recent price movements.
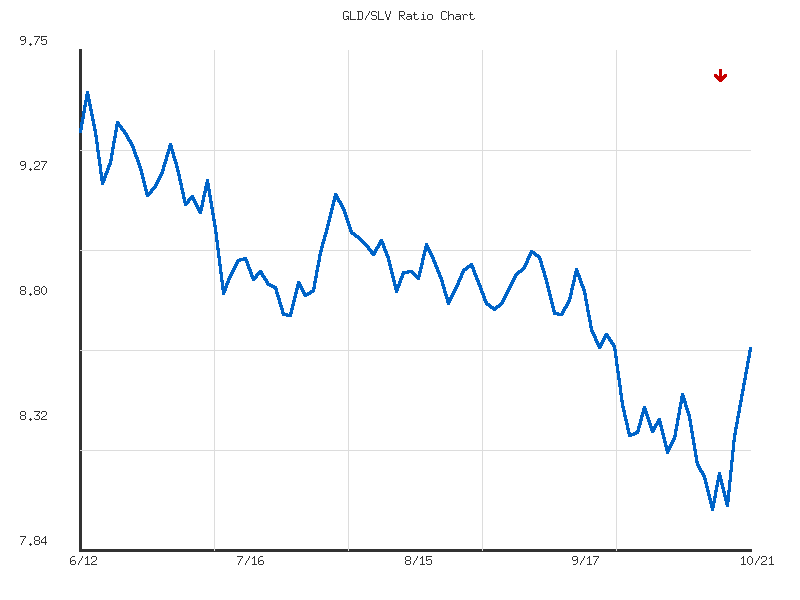
As a Chartered Market Technician with over 15 years of experience, my analysis of the provided GLD/SLV ratio data indicates a clear and sustained bearish trend over the observed 90-day period. The ratio commenced near its 90-day high of 9.593 on June 13th, gradually declining to its current value of 8.614 as of October 21st. The explicit trend analysis in the data confirms a “down” direction with “moderate” strength, marking an approximate -8.77% change. The current ratio trades well below the 90-day average of 8.853, reinforcing the technical observation that GLD has been consistently underperforming SLV throughout this timeframe. The overall price action exhibits a pattern of lower highs and lower lows, which is a classic characteristic of a downtrend.
Key support and resistance levels are discernible from the data. The initial trading range from mid-June, particularly around 9.40-9.60, established a significant resistance ceiling after the ratio failed to sustain those levels. Subsequent movements confirm intermediate resistance around the 9.00-9.20 zone, which acted as a temporary support in July before being decisively broken, subsequently converting it into resistance. On the downside, the ratio established a critical 90-day low at 8.000 on October 13th. This level has proven to be an important short-term support, prompting a bounce. The current ratio of 8.614 suggests it is trading within the lower bounds of its 90-day range, specifically at 0.3857 relative to its high and low, indicating proximity to the floor.
The short-term momentum for the GLD/SLV ratio appears to remain bearish. While the ratio found temporary support at the 8.000 level and staged a modest recovery, it has struggled to overcome prior consolidation areas or significant resistance. The moderate strength of the downtrend combined with the lack of a strong bullish reversal signal suggests that further downward pressure or consolidation is likely. The calculated volatility of 0.126 indicates a somewhat predictable, rather than erratic, decline, which aligns with the moderate strength trend. Continued trading below the average ratio of 8.853 further underpins the prevailing technical bias favouring SLV relative to GLD.
Considering alternative scenarios, a sustained and convincing break above the 8.90-9.00 resistance zone would introduce a roughly even chance of a shift in the technical outlook, potentially signaling a move towards a neutral or even an emerging ascending pattern. In such an event, the next upside targets would likely be in the 9.20-9.40 range. However, without such a clear breakout, the primary technical interpretation remains bearish. Conversely, a decisive move below the established 90-day low of 8.000 would be a significant bearish trigger, making it likely that the ratio would accelerate its downtrend into a new, lower trading range. Therefore, based on the current technical data, the GLD/SLV ratio is likely to continue its overall downtrend or consolidate within its lower range in the immediate future, with 8.000 representing crucial support and 9.000 a critical resistance level for a potential trend alteration.
Ratio Analysis: GLD/SLV
Generated for 90days timeframe analysis
Bonds
Based on the provided daily percentage change data for October 21, 2025, a distinct performance hierarchy is evident across various Treasury bond maturities. Longer-duration instruments, specifically UTHY and TLT, led the observed gains, posting increases of approximately 0.498% and 0.492% respectively. Intermediate-duration bonds, represented by IEF, saw a more modest rise of about 0.185%, while shorter-duration counterparts, IEI and SHY, exhibited the weakest positive movement at approximately 0.091% and 0.024% respectively. This single-day snapshot suggests a relative strength favoring the longer end of the Treasury curve.
| Symbol | Daily Percent Change |
|---|---|
| UTHY | 0.498% |
| TLT | 0.492% |
| IEF | 0.185% |
| IEI | 0.091% |
| SHY | 0.024% |
The relative outperformance of longer-duration Treasury instruments (UTHY, TLT) compared to their shorter-duration peers (IEF, IEI, SHY) is noteworthy. This pattern suggests that market participants, at least for this particular session, were showing a preference for longer-dated fixed-income exposure. From a technical perspective, such a divergence can occasionally precede or coincide with expectations of declining long-term interest rates or a flight to quality. However, without additional historical price or volume data, it is difficult to ascertain whether this represents a nascent trend or an isolated daily fluctuation. The magnitude of the moves, while positive across the board, is generally modest for all observed instruments.
Given the constraint of observing only a single day’s percentage change, drawing definitive conclusions about underlying market trends is challenging. It is roughly an even chance that this observed performance is merely a short-term technical adjustment or an isolated session’s activity, rather than the initiation of a sustained shift in bond market sentiment. There is a low likelihood that this data alone signals a significant, immediate reversal in any established trends, should they exist. Alternatively, there is a modest probability that this session could represent an early indication of increasing demand for duration, potentially signaling an anticipation of future economic shifts that favor longer-term fixed income assets. Traders should remain aware that relying on a single data point without contextual indicators like trend lines, support/resistance levels, or volume analysis carries inherent limitations.
Technical Analysis: Short-Term Bond ETF Overview (2025-10-20 to 2025-10-21)
This analysis focuses exclusively on the two days of provided technical data for TLT, UTHY, IEF, IEI, and SHY, representing various durations of U.S. Treasury bonds. Across all five instruments, the short-term technical picture indicates a general upward bias. Both trading days concluded with higher closing prices than their respective openings for most instruments, and crucially, all symbols experienced an upward gap at the open on the second day (October 21st) relative to the prior day’s close. This broad-based positive price action suggests that buying interest was dominant over the observed period.
Examining the longer-duration segment, TLT (20+ Year Treasury Bond ETF) displayed notable strength. On October 20th, TLT showed a bullish candle with a close near its high, supported by substantial volume. The following day, October 21st, saw an even stronger bullish candle, opening with a significant gap higher and closing almost at its daily peak. This sustained buying pressure makes a continuation of the upward momentum likely in the immediate term. Similarly, IEF (7-10 Year Treasury Bond ETF) exhibited parallel bullish behavior, with consecutive positive closes and an upward gap on the second day. However, for both TLT and IEF, the trading volume on October 21st was lower than on October 20th. While price closed strongly near highs, this decrease in volume following the gap-up suggests that the intensity of buying interest might be moderating, implying that rapid, strong upward moves beyond the gap area are less probable without renewed conviction from market participants.
The shorter-duration bond ETFs, IEI (3-7 Year Treasury Bond ETF), SHY (1-3 Year Treasury Bond ETF), and UTHY (0-5 Year US Aggregate Bond ETF), also displayed bullish tendencies but with some nuanced differences. IEI registered two consecutive bullish candles with an upward gap on the second day, maintaining consistent volume. This suggests a more stable, albeit perhaps less aggressive, bullish trend. SHY showed a small-bodied bullish candle on October 20th and an upward gap followed by another small bullish candle on October 21st, accompanied by increasing volume. The increased volume in SHY coinciding with relatively modest price appreciation could indicate that some resistance or profit-taking is emerging, even as prices push slightly higher. UTHY, while exhibiting two bullish candles and an upward gap, traded on extremely low volumes. Such low liquidity renders the price action for UTHY less reliable as a strong technical signal or indicator of sustained market conviction.
Considering the collective evidence, a continuation of the positive price action is likely across these Treasury bond ETFs in the very short term, particularly for TLT and IEF, given the clear upward gaps and strong closes. However, for TLT and IEF, the diminishing volume on the second day presents an alternative scenario where a period of consolidation or more subdued gains is a roughly even chance compared to further aggressive advances. A significant reversal of the two-day upward trend for the entire group appears improbable without further bearish technical developments, such as a close below the open of October 21st or the formation of distinct bearish candlestick patterns. Traders should monitor volume trends and subsequent price action closely to confirm whether the recent buying interest is sustained.
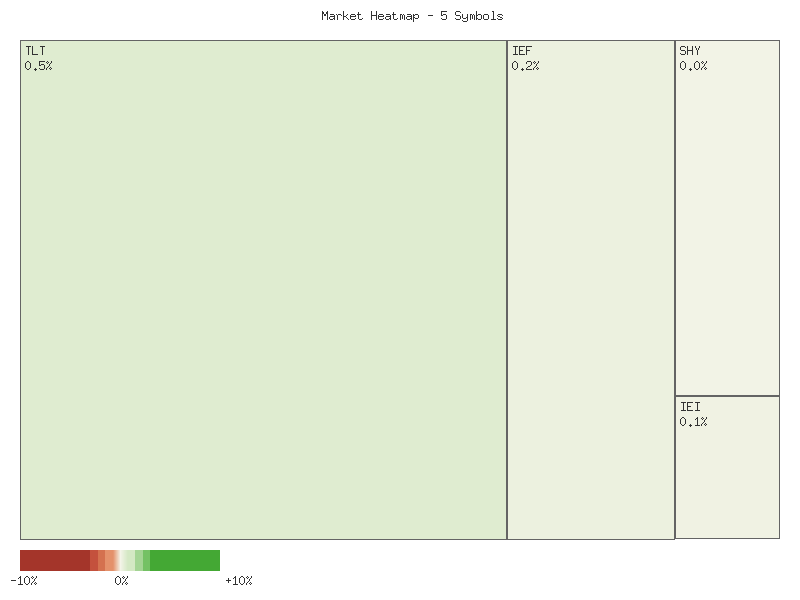
Performance Heatmap (TLT, UTHY, IEF, IEI, SHY)
Generated for 2days timeframe analysis
Magnificent 7 & Friends
Here is the technical analysis of the provided market data:
| Symbol | Daily Percent Change |
|---|---|
| AMZN | 2.564% |
| AAPL | 0.202% |
| MSFT | 0.168% |
| META | 0.150% |
| ANET | -0.369% |
| NVDA | -0.810% |
| TSLA | -1.079% |
| CRWV | -1.574% |
| AVGO | -1.884% |
| GOOGL | -2.374% |
Analysis of the daily percentage change across the ten provided symbols indicates a notably bifurcated performance for the observed period. AMZN was the clear outlier, posting a significant gain of 2.564%. This substantial upward movement makes it the strongest performer within this dataset, suggesting a distinct positive momentum solely for this equity, at least for the current trading day. Following AMZN, AAPL, MSFT, and META recorded modest positive changes, clustering between 0.150% and 0.202%. This indicates a slight bullish bias for these specific assets, though their magnitude of gain is considerably less impactful than AMZN’s.
Conversely, the bottom performers exhibited more substantial declines. GOOGL led the downside with a significant drop of -2.374%, representing the most pronounced negative movement within this cohort. AVGO and CRWV also experienced notable losses, with changes of -1.884% and -1.574% respectively. These deeper negative percentage changes at the bottom of the spectrum suggest a stronger bearish pressure or capitulation for these particular equities compared to the modest positive gains observed at the top, exclusive of AMZN.
A middle tier of negative performance includes TSLA, NVDA, and ANET, with daily changes of -1.079%, -0.810%, and -0.369% respectively. These declines, while less severe than GOOGL’s or AVGO’s, still contribute to an overall negative drift for a majority of the observed symbols. The dispersion of these values indicates varied technical responses across different segments of the market represented by these specific stocks, rather than a uniform directional trend.
Based solely on this singular day’s data, it is roughly an even chance that the broader market sentiment for these specific assets is mixed, without a clear, overwhelming bias in either direction. While four symbols advanced and six declined, the magnitude of AMZN’s gain somewhat balances the more substantial declines seen in GOOGL, AVGO, and CRWV. It is unlikely that this data alone provides sufficient evidence to conclude a strong bullish or bearish trend for the overall market, as the performance is highly stock-specific. Further analysis incorporating volume, chart patterns, and multi-day data would be necessary to derive more robust technical conclusions.
As a Chartered Market Technician with over 15 years of experience, my analysis of the provided two-day market data across ten prominent symbols reveals a mixed short-term technical landscape, indicating a lack of uniform directional bias within this specific cohort. While several equities display clear bullish patterns, an equally significant number exhibit strong bearish signals or reversals. This divergence suggests that short-term price action is primarily driven by individual stock dynamics rather than a broad market tide, implying that a consistent directional move for the entire group is unlikely in the immediate future.
Within the bullish camp, AMZN stands out with two consecutive strong bullish candles, marked by a notable gap-up on Day 2 and a robust close, all supported by a significant increase in volume. This pattern suggests a continuation of upward momentum is likely. Similarly, MSFT shows consistent, albeit less aggressive, bullish action with two higher closes and slightly increased volume on Day 2, making further upside likely. META also posted two bullish closes; however, the smaller body and decreased volume on Day 2 suggest that while upward movement is likely to continue, the pace may moderate. AAPL mirrored this sentiment, with a strong initial bullish surge followed by a smaller, less conviction-filled bullish candle on significantly reduced volume, indicating a continuation of the rally is likely but with a roughly even chance of consolidation or slowing momentum.
Conversely, several symbols exhibit clear bearish tendencies. CRWV and AVGO both registered two consecutive bearish candles, with AVGO’s second day showing a significant drop on increased volume, making further price depreciation likely. GOOGL presented a strong bearish reversal, with Day 2’s large bearish candle completely engulfing Day 1’s bullish advance, on substantially increased volume, pointing to a likely shift towards downward momentum. NVDA also indicated persistent selling pressure with two bearish closes on very high volume, suggesting further weakness is likely. These patterns collectively point to a probable continuation of short-term downtrends for these individual names.
Lastly, TSLA shows a clear reversal pattern, shifting from a bullish Day 1 to a bearish Day 2, with the second day’s close undercutting Day 1’s open, a classic dark cloud cover type formation. Although Day 2’s volume decreased, this pattern still suggests a downward continuation is likely. ANET also transitioned from an indecisive Day 1 (small bullish body with an upper wick indicating resistance) to a bearish Day 2 with a lower close on significantly reduced volume. This indicates weakening demand and a likely continuation of bearish sentiment, although the low volume on Day 2 could suggest less aggressive selling. The overall technical picture for these two days therefore presents a distinctly bifurcated market within this specific selection of stocks.
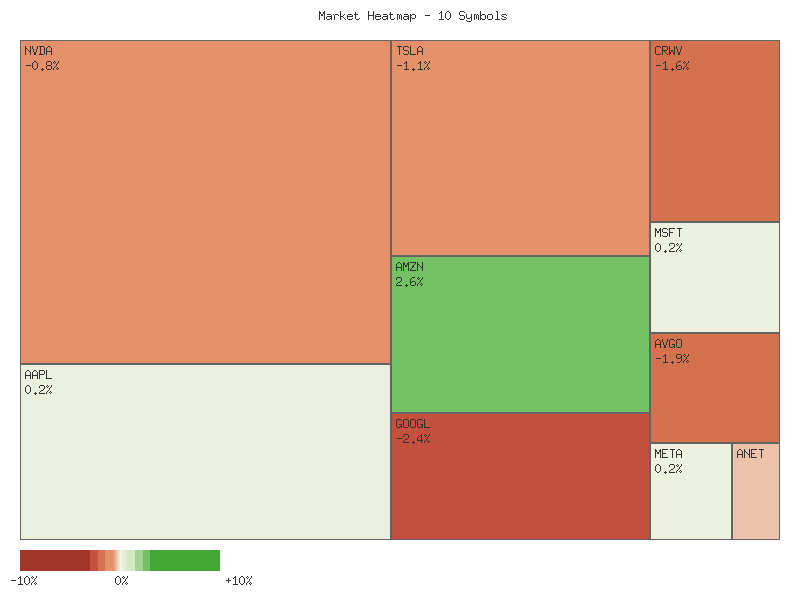
Performance Heatmap (TSLA, MSFT, AAPL, META, NVDA, AVGO, GOOGL, AMZN, CRWV, ANET)
Generated for 2days timeframe analysis
S&P 500 Sector Breadth
Based on the provided daily percentage change data for the eleven S&P 500 sectors, market breadth appears to be slightly negative. Of the eleven sectors analyzed, six concluded the period with a decline, while five advanced. This narrow distribution, with more declining symbols than advancing ones, suggests a lack of broad-based upward momentum, implying the underlying market is facing some headwinds. The overall performance indicates a mixed environment rather than a decisive directional move, with individual sector dynamics driving the observed price action.
Examining the advancing sectors, Consumer Discretionary (XLY) led the gains with a notable 1.223% increase, followed by Industrials (XLI) at 0.886%. Communication Services (XLC) also registered a positive movement of 0.353%, while Health Care (XLV) and Technology (XLK) saw more modest advances of 0.235% and 0.052%, respectively. It is noteworthy that four out of these five advancing sectors—XLY, XLI, XLC, and XLK—are classified as offensive, pointing to selective strength in risk-on areas of the market. This pattern could indicate that participants are willing to allocate capital to growth-oriented sectors, at least for some specific segments.
Conversely, six sectors experienced declines. Utilities (XLU) showed the most significant daily loss, dropping 1.016%. This was followed by Consumer Staples (XLP), down 0.464%, and Materials (XLB), declining 0.382%. Real Estate (XLRE) decreased by 0.306%, Energy (XLE) by 0.230%, and Financials (XLF) by a modest 0.114%. Of these declining sectors, XLU, XLP, and XLRE are typically considered defensive. The prominent decline in XLU, traditionally a defensive haven, is particularly noteworthy and could suggest a more complex market narrative than a simple flight from defensive assets.
The pattern of sector performance provides a mixed signal regarding market rotation and overall sentiment. The strong performance in offensive sectors like XLY and XLI, combined with a modest gain in XLK, could be interpreted as an indication of investor preference for growth and economic sensitivity. However, the simultaneous declines in other offensive sectors such as XLB, XLE, and XLF suggest that this risk appetite is not uniform across all offensive segments. Furthermore, the significant decline in a typically defensive sector like XLU, alongside other defensive sectors XLP and XLRE, complicates a clear “risk-on” or “risk-off” interpretation. The data presents a picture of selective strength within offensive sectors concurrent with weakness in defensive sectors, but this does not entirely clarify the predominant market sentiment, which is likely to be considered ambiguous.
Here is the matrix of each symbol and its daily percent change value, sorted in descending order:
| Symbol | Daily Percent Change |
|---|---|
| XLY | 1.223% |
| XLI | 0.886% |
| XLC | 0.353% |
| XLV | 0.235% |
| XLK | 0.052% |
| XLF | -0.114% |
| XLE | -0.230% |
| XLRE | -0.306% |
| XLB | -0.382% |
| XLP | -0.464% |
| XLU | -1.016% |
As a Chartered Market Technician with over 15 years of experience, my analysis of the provided two-day sector ETF data reveals a distinct divergence in short-term technical postures across the market. The collective price and volume action over the 20th and 21st of October, 2025, suggests that broad market momentum is not uniformly distributed. While several growth-oriented sectors exhibit robust upward trajectories, a notable contingent of defensive and cyclical sectors display signs of weakness or bearish reversals. This bifurcated market dynamic indicates that a universally directional outlook is unlikely in the immediate term, with traders needing to be selective in their approach.
Several sectors demonstrated strong bullish continuation, making further upside movements likely. Consumer Discretionary (XLY) charted a significantly higher high and close on the second day, solidifying its upward momentum with an increase in trading volume. Similarly, Communication Services (XLC) and Industrials (XLI) both produced strong bullish candles, closing near their daily highs with expanded volume, which typically reinforces the prevailing trend. For these sectors, a continuation of their upward trends is highly likely, provided no significant shifts occur in subsequent sessions.
Conversely, a substantial number of sectors displayed notable bearish tendencies. Consumer Staples (XLP) and Utilities (XLU), often considered defensive plays, showed clear bearish continuation patterns. XLP experienced a lower high and lower low on significantly increased volume, strongly suggesting that downward pressure is likely to persist. XLU also posted lower highs and lows, though on slightly decreased volume, still indicating probable further declines. Materials (XLB) and Energy (XLE) both presented bearish reversal patterns. XLB formed a bearish outside bar on the second day with increased volume, signaling a probable shift to downward momentum, while XLE closed significantly below its open after an initial rally, also on increased volume, making further declines likely. Real Estate (XLRE) likewise formed a bearish dark cloud cover pattern, where the second day’s bearish candle closed well into the body of the prior bullish candle, suggesting at least a roughly even chance of further downside or consolidation.
Technology (XLK) and Healthcare (XLV) provided a more nuanced picture. XLK maintained a modest upward drift over the two days, but the second day’s closing price was only marginally higher than its opening, and volume decreased. This pattern suggests diminishing bullish conviction, implying a period of consolidation or a minor pullback is a roughly even chance against continued strong ascent. XLV, after a strong bullish first day, saw a higher high on the second day but closed below its open, forming a candle indicative of some profit-taking or resistance encountered at elevated levels. Despite ending the second day higher than its previous close, this pattern, coupled with increased volume, suggests a roughly even chance of continued general upward trajectory or a period of consolidation before a clearer trend emerges. Financials (XLF) also showed signs of decelerating momentum, with a minor retreat on the second day and decreased volume, indicating that immediate upward thrust has waned, making short-term consolidation or a minor pullback likely.
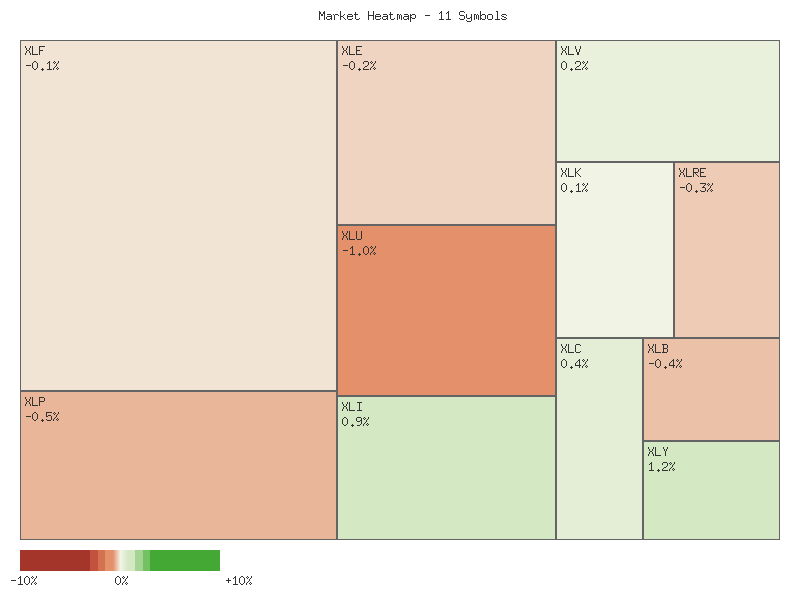
Performance Heatmap (XLP, XLRE, XLI, XLU, XLV, XLY, XLF, XLB, XLE, XLC, XLK)
Generated for 2days timeframe analysis
XLY vs XLP
The XLY/XLP ratio has exhibited an upward trend over the recent seven-day period, as explicitly stated by the provided technical data. Starting at 2.9289 on October 10th, the ratio reached its highest point of 3.0164 on October 21st, marking a net increase of approximately 2.99% for the period. Despite this clear upward direction, the trend strength is categorized as “weak,” which we judge suggests that while XLY has outperformed XLP during this timeframe, the underlying momentum for this outperformance may not be exceptionally robust or sustained without further evidence. The range of movement was contained between the low of 2.9289 and the high of 3.0164.
A closer examination of the ratio’s price action reveals an initial ascent from 2.9289 to 3.0044, followed by a period of retracement and consolidation. The ratio dipped to 2.9402 on October 17th before resuming its upward trajectory and closing at the period’s high of 3.0164. This closing at the high suggests a renewed bullish sentiment for XLY relative to XLP at the end of the observation window. The reported volatility for the period is exceptionally low at 0.00086. We judge this low volatility indicates that the price movements within this 7-day span have been relatively stable and orderly, lacking significant erratic swings, even with the “weak” trend strength.
Given the current ratio closed at its period high of 3.0164, it is likely that the upward bias will persist in the immediate term, indicating a continued preference for XLY over XLP. However, the stated “weak” trend strength introduces an element of uncertainty; there is a roughly even chance that sustained follow-through could be challenged, potentially leading to a period of consolidation around current levels rather than an aggressive breakout. Alternatively, a failure to maintain the recent high could see the ratio retest levels closer to its 7-day average of 2.9687, although a significant reversal below this average is unlikely given the closing strength and overall upward trend for the period.
Market Commentary: XLY/XLP Ratio Analysis (90-Day)
As a Chartered Market Technician, my analysis of the XLY/XLP ratio over the past 90 days reveals a robust uptrend, indicating a period of significant outperformance by the Consumer Discretionary sector (XLY) relative to the Consumer Staples sector (XLP). The ratio initiated this period around 2.607 in mid-June and has since ascended to 3.016 as of October 21st, reflecting a strong increase of approximately 15.68%. This sustained upward trajectory, characterized by higher highs and higher lows through most of the observation period, suggests a prevailing “risk-on” sentiment within the market, where investors are favoring growth-oriented discretionary spending over defensive, necessity-based consumption. The consistently increasing ratio, with a relatively low volatility of 0.0216 in the context of its overall move, makes a continuation of this bullish bias highly likely in the near term.
Delving into the price action, the ratio exhibited a steady climb throughout June and July, breaking above the 2.70 level and establishing new higher trading ranges. A more accelerated phase of the uptrend became evident from August into mid-September, pushing the ratio through 2.80 and then decisively past 2.90. This ascent culminated in a peak ratio of 3.097 on October 6th. Following this peak, the ratio experienced a notable pullback, retreating to a low of 2.928 by October 10th. This retracement, though significant at roughly 5.4%, appears to be a healthy consolidation within the established uptrend rather than a reversal. The prior resistance zone around 2.90-2.92, observed during early September, potentially acted as a support level during this recent decline, a common technical occurrence where old resistance becomes new support.
The price action since the October 10th low suggests that the underlying bullish momentum remains largely intact. The ratio has rebounded from the 2.928 level, climbing back to its current reading of 3.016. This recovery indicates that buyers have stepped in to defend the uptrend, absorbing the selling pressure and pushing the ratio higher. The current ratio is now positioned near the upper end of its 90-day range, with a relative position of 0.835, implying it is approximately 83.5% of the way from its lowest point to its highest point over this period. Considering the strength of the preceding uptrend and the recent rebound, it is likely that the ratio will attempt to retest the recent high of 3.097 in the near term.
While the primary trend remains bullish, alternative scenarios warrant consideration. If the ratio fails to overcome the 3.097 resistance level and instead reverses direction, particularly if it breaks below the recent support established around 2.928, it would suggest a higher probability of a deeper consolidation or a potential shift in the short-term trend. However, based solely on the data provided, with the strong positive momentum and the constructive bounce from the recent pullback, the continuation of the XLY/XLP outperformance is likely. A decisive break above 3.097 would open the path to new 90-day highs, whereas a failure to do so, followed by a break below 2.928, would indicate a roughly even chance of further downside consolidation.
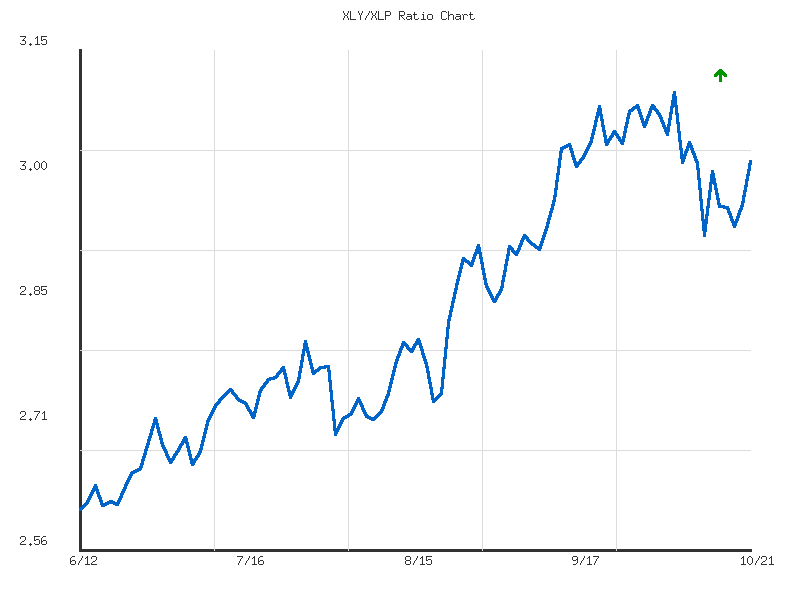
Ratio Analysis: XLY/XLP
Generated for 90days timeframe analysis
Equity Breadth
The technical data for the S&P 500 breadth indicators over the past seven days, specifically the percentage of members trading above their 50-day (SPXA50R) and 200-day (SPXA200R) moving averages, reflects a likely strengthening of the underlying market. Both indicators show a clear upward trajectory, suggesting broadening participation in the recent market movement. SPXA50R commenced the period at 33.73% and concluded at 54.49%, while SPXA200R began at 50.30% and significantly advanced to 62.87% by the end of the observation period. This concurrent upward movement in both short-term and long-term breadth indicators implies a probably improving overall health of the S&P 500.
Focusing on SPXA50R, the initial surge from 33.73% to 48.10% by October 14th indicated a likely increase in short-term buying interest. A notable dip to 44.71% on October 17th, after holding 48.10% for two days, marked a temporary pullback in breadth. However, this dip was unlikely to signify a reversal, given the subsequent strong recovery. The indicator then decisively pushed above the critical 50% threshold, reaching 51.90% and then 54.49% by October 21st. This move above 50% suggests that a majority of S&P 500 constituents are now participating in the short-term uptrend, which is likely to provide positive reinforcement for near-term market momentum.
The SPXA200R data presents an even more compelling picture of market strength. Starting just above 50% at 50.30%, this long-term breadth indicator experienced a consistent and robust climb, reaching 62.87% by October 21st. This sustained ascent, with only a minor, brief retracement on October 17th, suggests that the market is experiencing significant underlying strength, with an expanding number of stocks maintaining positions above their long-term moving average. The fact that over 60% of S&P 500 stocks are above their 200-day MA indicates a very likely broad-based uptrend, making a significant market reversal in the immediate short-term unlikely without further deteriorating breadth readings.
The simultaneous increase in both SPXA50R and SPXA200R over the seven-day period is a strong indicator of improving market breadth and underlying strength within the S&P 500. The SPXA50R moving above 50% after some fluctuation, combined with the SPXA200R consistently climbing higher and maintaining levels well above 50%, points to increasing bullish sentiment and participation across the index. While the single day dip on October 17th presented a remote chance of momentum loss, the immediate and strong recovery of both indicators suggests it was a minor pause within a broader positive trend. Given these patterns, the S&P 500 is likely to experience continued upward pressure from expanding internal market strength.
SPY Daily
SPY’s technical posture over the past week indicates a robust recovery from a sharp downturn. On October 10th, SPY recorded a significant price drop, closing at 653.02 with exceptionally high volume, which pushed the 14-day Relative Strength Index (RSI) to 41.81, nearing oversold conditions. From October 13th to October 20th, however, SPY exhibited strong upward momentum, reclaiming much of the lost ground to close at 671.30. This rally was initially well-supported by increased buying volume (79.2M on Oct 13, 88.3M on Oct 14, 95.8M on Oct 17). The most recent trading day, October 21st, saw a narrow-range candle closing at 671.29, suggesting a momentary pause in upward thrust. Critically, volume decreased to 55.9M on this day, falling below the 90-day average, which could indicate a potential moderation in buying conviction. The RSI has rebounded to 59.37, positioning momentum in a neutral-to-bullish zone without overextension. The broader 90-day trend remains unequivocally bullish, with both the 50-day and 200-day Exponential Moving Averages (EMAs) trending upward and the 50-day EMA (654.71) consistently above the 200-day EMA (613.93), reaffirming a strong long-term uptrend. SPY’s current price of 671.29 is comfortably positioned above both EMAs, underscoring ongoing strength.
Immediate resistance for SPY is observed in the 673-674 zone, derived from the high of 673.95 on October 10th (prior to the sharp decline) and the intraday high of 672.99 on October 21st. A sustained breakout above this level, ideally confirmed by a surge in volume, would make a continuation of the rally towards new highs probable. Conversely, critical immediate support for SPY lies within the 653-655 range, encompassing the significant October 10th low of 652.84 and the ascending 50-day EMA at 654.71. This convergence suggests a robust support cluster. A decisive close below this confluence, especially if accompanied by heightened selling volume, would constitute a strong bearish signal, making a decline towards the prior consolidation zone of 640-645, or even the 200-day EMA at 613.93, likely. The rapid recovery from the October 10th dip suggests a prevailing bullish technical sentiment among market participants to defend key moving average support.
Considering future price action, a bullish case is supported by the established uptrend and the recent strong rebound. It is likely that a breakout above the 673-674 resistance zone would propel SPY higher, targeting new peaks. For a bearish case, there is a roughly even chance that SPY could retest the 653-655 support. A failure to hold this level would invalidate the recent rally and suggest a deeper correction, potentially towards the 640-645 area or the 200-day EMA. Lastly, a neutral case involving a period of consolidation within the 660-673 range is a distinct possibility. This sideways movement would allow the market to digest the recent gains and for momentum indicators to normalize further. The decreasing volume observed on the most recent upward price movements supports the notion of a near-term pause or a period of indecision before the next significant directional move.
SPY Technical Outlook: October 21, 2025
Over the past 90 days, the SPY ETF has displayed a pronounced bullish trend, evidenced by a series of higher highs and higher lows from its June base around 600 to recent highs near 670. Initial strong upward momentum in late June and early July pushed prices from approximately 595 to 625, followed by a period of consolidation. A notable price surge in August lifted SPY from the low 620s to the mid-640s, indicating robust buyer interest. This upward trajectory continued into September and early October, where the SPY reached a peak around 673 on October 9th. This sustained advance suggests that the prevailing market sentiment has been largely optimistic.
However, the period under review was not without significant corrective movements. A sharp decline was observed on August 1st, where SPY dropped from 632.08 to 621.72 on elevated volume, temporarily interrupting the uptrend. More recently and notably, October 10th witnessed a substantial sell-off, with SPY falling from 671.16 to 653.02, accompanied by the highest trading volume in the provided dataset (156.6 million shares). This high-volume drop indicates strong selling pressure at that specific point. Post-October 10th, price action suggests a recovery attempt, with the SPY closing at 671.29 on October 21st, nearly retesting the previous highs prior to the sharp decline. This quick rebound from the October 10th low suggests underlying resilience.
Analyzing the 14-day Relative Strength Index (RSI) corroborates these price movements. The RSI entered overbought territory (>70) multiple times during periods of strong rallies, specifically in early July, late July, and mid-September, signaling that the asset was potentially overheated. The August 1st price correction coincided with a drop in RSI to 47.66, indicating a significant cooling of bullish momentum. Similarly, the sharp sell-off on October 10th propelled the RSI down to 41.81, approaching the oversold threshold, which historically can precede a rebound. Since this low, the RSI has recovered to 59.37, moving back towards the neutral zone and suggesting a restoration of positive momentum following the previous oversold condition. The RSI is currently not in overbought territory, implying there might be room for further upward movement before triggering another exhaustion signal.
Given the recent price recovery and the RSI moving out of potentially oversold conditions, it is likely that SPY will retest its recent highs around 673-674 in the near term. A sustained break above this resistance would imply a continuation of the broader bullish trend, with the next psychological resistance potentially around 675-680. However, the high-volume rejection on October 10th near these levels suggests that significant resistance exists. A roughly even chance exists for the market to consolidate around current levels before a clearer direction emerges. In an alternative scenario, failure to decisively breach the 673-674 resistance could lead to further sideways movement or a retest of the support established around the 653 level (the low from October 10th). A breakdown below 653 would be a bearish development, suggesting a deeper correction. It is important to note that the MACD (13-21 day) data was requested but not provided, thus limiting the breadth of momentum analysis.