Daily Market Technical Analysis
The market exhibits a short-term bullish bias across broad indices and most S&P 500 sectors, with small-caps showing relative leadership. SPY, QQQ, and IWM demonstrate robust recoveries, indicating continued upward momentum is likely for the immediate term, supported by improving RSI readings. However, reduced volume in many bullish moves, including most Magnificent 7 stocks, suggests sustained rallies are less probable without renewed buying conviction. Conversely, the VIX shows a strong bearish reversal, making further declines likely and a significant rebound highly unlikely. Commodity performance is mixed, with Natural Gas and Gold showing strong bullish signals, while Silver appears poised for further downside. Overall, while a continuation of the market’s upward bias is likely, the divergence in volume trends and selective weaknesses warrant cautious monitoring for sustainability.
Market Indices
| Symbol | Daily Percent Change |
|---|---|
| IWM | 1.951% |
| IJR | 1.582% |
| QQQ | 1.260% |
| MDY | 1.204% |
| SPY | 1.040% |
| OEF | 1.039% |
Analysis of the provided daily percentage change data reveals a universally positive market session across the sampled U.S. equity indices. All six symbols—IWM (Russell 2000), IJR (S&P SmallCap 600), QQQ (Nasdaq 100), MDY (S&P MidCap 400), SPY (S&P 500), and OEF (S&P 100)—registered advances for the period. This indicates strong market breadth, with six advancing symbols and zero declining symbols, implying widespread positive participation in the day’s gains across different capitalization segments.
A closer look at the performance hierarchy shows notable leadership from the small-cap segment. The Russell 2000 ETF (IWM) posted the highest daily gain at 1.951%, closely followed by the S&P SmallCap 600 ETF (IJR) with an increase of 1.582%. This outperformance by smaller capitalization stocks over broader market and large-cap benchmarks is a significant technical observation for the session, suggesting a potential increase in risk appetite or rotational strength towards these segments. The Nasdaq 100 (QQQ) also exhibited strong momentum with a 1.260% advance, placing it third in performance.
The mid-cap segment, represented by MDY, contributed to the overall positive tone with a 1.204% gain. In contrast, the large-cap indices, SPY and OEF, showed more conservative increases of 1.040% and 1.039% respectively. While still positive, their relative underperformance compared to IWM and IJR indicates that the most significant buying pressure was concentrated outside of the largest market capitalization names for this specific period. The pervasive positive movement suggests that bullish sentiment was broadly distributed across various market segments, making it highly likely that the immediate market bias is positive.
Given the uniform positive performance and strong market breadth, a continuation of positive momentum in the very short term is more likely than not. However, it is crucial to acknowledge that this assessment is based on a single day’s data. A potential alternative scenario, though currently less likely given the strong and broad advance, involves a period of consolidation or a reversal if the observed leadership in smaller-cap segments fails to sustain, or if larger-cap indices do not accelerate their gains in subsequent sessions. For now, the technical evidence points to robust underlying buying interest.
Good morning, traders. Today, we’ll examine the recent two days of market activity across a selection of key exchange-traded funds (ETFs) including large-cap, mid-cap, and small-cap segments. The overarching theme emerging from the data for October 17th and 20th, 2025, is one of broad-based strength. All observed ETFs—SPY, QQQ, OEF (large-cap), IWM, IJR (small-cap), and MDY (mid-cap)—demonstrated two consecutive bullish candles, characterized by higher opens, strong closes near their daily highs, and overall positive price action. This consistent pattern across market capitalization segments strongly suggests that the market is experiencing robust short-term upward momentum, making a continuation of this trend likely in the immediate future.
Drilling down, the large-cap indices, SPY, QQQ, and OEF, exhibited particularly strong bullish signals. On October 17th, each closed near their respective daily highs, indicating significant buying pressure throughout the session. This strength was compounded on October 20th, as all three gapped higher at the open compared to the previous day’s close, maintaining their upward trajectory and once again closing near their daily highs. Such price action, where gains are solidified with gaps and strong closes, is generally interpreted as a powerful technical buy signal. While volume on October 20th decreased for these large-cap ETFs relative to October 17th, the compelling price action, particularly the gap-up opens and closes near highs, suggests that this reduced volume is roughly an even chance to be a function of decreased selling pressure rather than an immediate signal of weakened conviction among buyers.
The small-cap and mid-cap segments, represented by IWM, IJR, and MDY, largely mirrored the bullish sentiment. Both IWM and IJR also presented two consecutive bullish candles, with the October 20th session for both beginning with a notable gap higher and concluding near the day’s high. This widespread participation, extending beyond just the large-cap stalwarts, reinforces the notion of a broad market rally. Intriguingly, MDY, the mid-cap representative, was the only ETF in our dataset to record a slight increase in volume on October 20th while also showing a strong bullish candle with a gap-up. This increasing volume on an up-day for MDY specifically provides stronger confirmation of buying interest in the mid-cap space, rendering further near-term upside for MDY somewhat more likely than for indices where volume declined.
Considering the data in its entirety, the technical picture for the immediate term is largely constructive. The consistent pattern of higher opens, closes near highs, and the prevalence of upward gaps across all monitored ETFs are compelling bullish signals. While the declining volume in most ETFs on the second day warrants observation, the strong price behavior currently mitigates its immediate bearish implications. For the next few sessions, a continuation of the upward trajectory is likely. Traders might eye the gaps created on October 20th as initial short-term support levels should any selling pressure emerge. The current data presents no immediate bearish reversal patterns, indicating that a continuation of higher prices remains the more probable scenario.
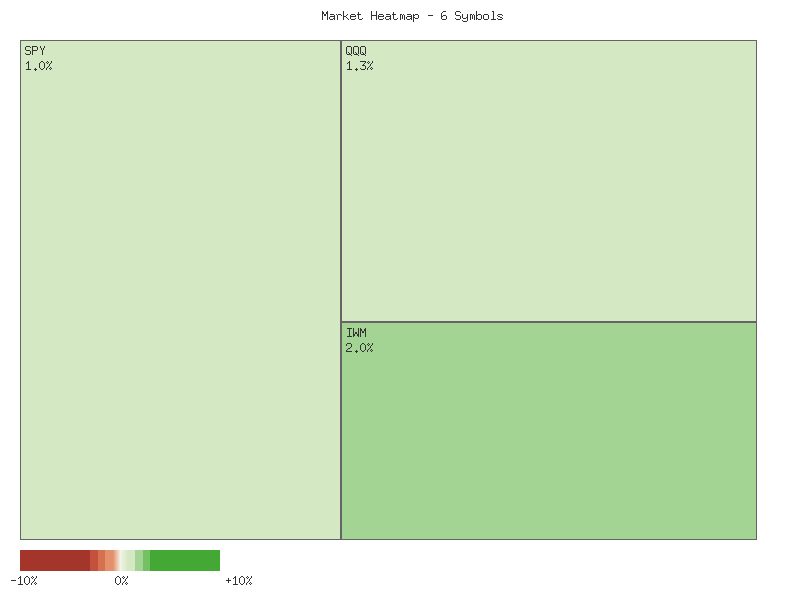
Performance Heatmap (SPY, QQQ, IWM, IJR, MDY, OEF)
Generated for 2days timeframe analysis
SPY has exhibited a discernible upward trend over the past 90 days, marked by successive higher highs and higher lows, peaking near 673 in early October. This robust price action has been punctuated by two notable high-volume pullbacks: one on August 1st and a more recent, significant decline on October 10th. The August 1st drop, occurring from approximately 639 to 621, was followed by a recovery that led to new highs. The October 10th event saw prices fall sharply from around 673 to 653 on unusually high volume, suggesting a strong burst of selling pressure. However, in the days following this sharp decline, SPY has shown signs of a rebound, closing at 671.30 on the most recent trading day, reclaiming a substantial portion of the losses. The overall price structure suggests that despite corrections, the underlying momentum has historically favored the upside within this period.
Analysis of the 14-day Relative Strength Index (RSI) corroborates periods of strong bullish momentum and subsequent momentum shifts. During sustained rallies, the RSI frequently entered overbought territory, exceeding 70, indicating strong buying interest (e.g., late June, early July, mid-September, early October). The two significant price pullbacks were accompanied by sharp descents in the RSI: it dropped to 47.66 after the August 1st decline and plunged to 41.81 following the October 10th sell-off. Currently, the RSI has recovered to 59.39, moving away from oversold conditions and into neutral territory. This upward movement from lower levels suggests that selling pressure has alleviated, and a constructive momentum shift may be underway.
The 13-day and 21-day Moving Average Convergence Divergence (MACD) provides further insight into momentum and trend dynamics. Throughout much of the 90-day period, particularly from mid-August to early October, the MACD line remained above its signal line, with a positive histogram, confirming the bullish price trend. A crucial shift occurred on October 9th, where the MACD line crossed below its signal line, and the histogram turned negative. This bearish crossover accurately preceded the pronounced price decline on October 10th, indicating a significant short-term loss of upward momentum. Following this, the MACD line remains below the signal line; however, the MACD histogram has shown a trend of becoming less negative in the most recent days, suggesting that the bearish momentum is potentially waning. The MACD line itself still resides above the zero line, which typically indicates that the broader, intermediate-term trend remains positive despite recent weakness.
Considering the combined technical picture, it is likely that SPY will attempt to consolidate or continue its recovery in the immediate term. The recent price action, recovering from the October 10th plunge, coupled with the rising RSI from neutral territory, supports this view. A sustained move above the recent high around 673 would likely confirm a resumption of the previous uptrend. However, an alternative scenario involves a retest of the support level around the 653 mark, especially if buying interest wanes and the MACD histogram fails to turn positive. A reversal of the current MACD histogram trajectory and a subsequent bullish crossover of the MACD line above the signal line would further strengthen the case for upward movement. Conversely, a failure to hold current levels, leading to the MACD line crossing below the zero line, would make a deeper, more sustained correction probable. Based on the current data, a full trend reversal to a bearish regime is considered unlikely without further evidence from both price and indicator deterioration, given the MACD line’s position above zero and the overall 90-day uptrend.
SPY Price & Indicators (RSI_14_DAY, MACD_13_21_DAY)
QQQ Technical Outlook: Sustained Uptrend Amidst Recent Volatility
QQQ has demonstrated a robust upward trend over the past 90 trading days, characterized by a series of higher highs and higher lows, from roughly in mid-June to a peak around on October 9th. This strong bullish bias has been a consistent feature throughout the observed period. The overall price action suggests underlying buying interest, with dips generally met by renewed demand. While the general trend remains upward, the latest period indicates a potential increase in volatility, necessitating careful examination of recent price and indicator behavior.
Within this overarching bullish framework, the price action has shown specific points of interest. Notable among these was the sharp decline on October 10th, where QQQ fell from .48 to .50 on exceptionally high volume (94.4 million shares). This event likely represented a significant bout of profit-taking or short-term capitulation. However, the subsequent price recovery has been equally compelling, with QQQ closing at .54 on October 20th, effectively retesting the pre-decline peak. Earlier, a high-volume pullback occurred around July 31st to August 1st, where prices dropped from approximately to before resuming the uptrend, indicating the market’s capacity to absorb selling pressure. The current ability to recover swiftly from the recent large decline suggests resilient demand.
The 14-day Relative Strength Index (RSI) has consistently reflected the prevailing bullish momentum. Throughout significant rallies, the RSI frequently moved into overbought territory (above 70), notably in late June, mid-July, late July, and early October. These excursions were typically followed by periods of consolidation or minor pullbacks rather than outright trend reversals, reinforcing the strength of the underlying trend. The RSI generally remained well above the oversold threshold of 30, even during price corrections. On October 20th, the RSI stands at approximately 61.08, indicating positive momentum but not currently in an extreme overbought condition. This position suggests there is likely room for further upward price movement before the indicator signals significant overextension.
Considering the strong recovery in price since the October 10th decline and the current RSI reading, a continuation of the upward trajectory is likely in the immediate term. The retest of the prior highs around - will likely serve as a critical short-term resistance area; a decisive break above this level would confirm renewed bullish conviction. Conversely, a failure to sustain prices above this resistance could lead to consolidation or a retest of the - support, which holds a roughly even chance as an alternative scenario given the recent volatility. A sustained break below the level would make further downside likely. It is important to note that a comprehensive MACD analysis could not be performed as the indicator’s data points were not provided in the market data.
QQQ Price & Indicators (RSI_14_DAY, MACD_13_21_DAY)
As a Chartered Market Technician with over 15 years of experience, I provide the following technical analysis of IWM based solely on the provided 90-day price and 14-day Relative Strength Index (RSI) data. It is important to note that while the analysis requested MACD (13,21-day) data, this information was not provided, therefore, the commentary will rely exclusively on the available technical indicators.
A rigorous technical analysis of IWM over the past 90 days reveals a dominant bullish trend, characterized by higher highs and higher lows despite intermittent corrections. Price action commenced with a mid-June decline from approximately .58 to a low of .22, followed by a robust recovery establishing a clear upward trajectory to a recent high near .09. Volume data indicates heightened activity during significant price movements, such as the initial June decline, the August 1 drop, and the sharp correction on October 10.
Recent price behavior suggests increased volatility and a test of the prevailing uptrend. Following a strong rally through late August and September, IWM climbed from the range to a peak of .09 on October 3. A significant one-day reversal then occurred on October 10, with IWM opening at .75 and closing sharply lower at .79, accompanied by exceptionally high volume. This candle strongly suggests potential exhaustion of buying momentum. Subsequent trading days recorded a constructive recovery towards the .33 level, though the .75 open from October 10 has not yet been sustainably surpassed. The latest data shows a close at .16, continuing this recovery.
The 14-day Relative Strength Index (RSI) provides crucial insight into momentum shifts. RSI readings mirrored price, often entering overbought territory (above 70) during strong rallies, such as July 3 (71.57) and September 18 (71.23). Critically, a bearish divergence pattern emerged prior to the October 10 price drop. As IWM recorded marginally higher price highs between October 3 (.09) and October 6 (.475), the RSI printed lower highs (66.55 on Oct 3, 68.07 on Oct 6) compared to the Sept 18 peak. This divergence signaled decelerating upward momentum, making a significant pullback likely. The sharp price decline on October 10 drove the RSI from 60.08 to 44.97, shifting from neutral to near oversold, confirming intense selling pressure. The subsequent recovery has lifted RSI to 57.42, indicating stabilizing selling pressure and a return to neutral momentum.
Given recent technical developments, the immediate outlook for IWM presents a roughly even chance of continued consolidation or a renewed attempt to break higher. The recovery in price and RSI from the October 10 sell-off is constructive, yet the price has not definitively cleared the pre-drop candle’s high (.885). A sustained move above this level would likely signal a resumption of the broader bullish trend, targeting resistance near - and potentially new highs. Conversely, a failure to establish firm support above -, particularly if accompanied by weakening RSI below 50, would render a retest of the October 10 low of .56 likely. Should this support fail, a deeper correction towards the August highs in the - area would become a distinct possibility. The current RSI in the mid-50s supports neutral short-term momentum, suggesting a clear directional catalyst is presently absent.
IWM Price & Indicators (RSI_14_DAY, MACD_13_21_DAY)
VIX Fear Index
The VIX experienced a significant surge in volatility, initiating with a strong upward move on 2025-10-10, pushing from the mid-16s to the 21.66 level. This initial bullish expansion was followed by a period of elevated readings, broadly fluctuating between the 19 and 22 range. The data indicates a notable increase in market uncertainty during this phase. Subsequently, on 2025-10-17, the VIX opened with a substantial gap up, reaching an extreme high of 28.99. This sharp spike to nearly 29.00 strongly suggests a capitulation event, where market fear reached a crescendo.
However, the price action on 2025-10-17 reveals a significant rejection of these extreme levels. Despite the massive gap up, the VIX closed at 20.78, barely higher than the previous day’s close and substantially below its open and high. This formed a powerful bearish reversal candlestick pattern, characterized by an exceptionally long upper shadow, indicative of aggressive selling pressure emerging at the peak of market anxiety. Such price behavior, particularly after a dramatic spike, suggests that the market’s initial burst of fear was not sustained and was met with strong counter-selling. This pattern makes a sustained move above the 29.00 level highly unlikely in the immediate future, absent new, extreme market-moving catalysts.
Following this critical reversal signal, the VIX on 2025-10-20 opened slightly lower and continued its decline, closing at its daily low of 18.23. The daily percentage change for 2025-10-20, indicating a -12.27% decrease, further confirms the downward momentum. This close below the 19-20 support zone established earlier suggests a potential shift towards lower volatility. Given the pronounced bearish candlestick on 2025-10-17 and its confirmation, it is likely the VIX will continue to track lower in the near term, with initial support potentially emerging around the 16.23-16.31 range observed at the beginning of the seven-day period.
An alternative scenario, albeit less likely based on the current data, would involve the VIX finding renewed support near the 18.23 level and attempting to retest the 20-21 range. However, this would require a strong bullish engulfing candle or a significant upward gap in the next session to negate the recent bearish price action. A complete re-evaluation would be necessary if the VIX were to close convincingly above 21.00, as this would indicate renewed market apprehension and a potential failure of the recent volatility contraction. The absence of volume data limits our ability to gauge the conviction behind these price moves, thus a degree of uncertainty remains regarding the strength of current technical signals.
Technical Analysis of VIX: 90-Day Overview (as of 2025-10-20)
The VIX has exhibited a pattern of periodic spikes followed by subsequent retracements over the past 90 days, largely fluctuating within a range from the low 14s to the low 20s. Notable periods of increased volatility, marked by VIX surges, occurred in mid-June (to ~22.00), early August (to ~21.90), early September (to ~19.38), and most recently in mid-October, reaching a high of 22.94 on October 14th. Following each of these upward movements, the VIX has generally reverted towards its historical mean, often finding temporary support in the 15.00-17.00 range. The current closing price of 18.23 on October 20th indicates that the VIX is in a phase of retracement from its recent peak.
Analysis of the 14-day Relative Strength Index (RSI) provides further insights into momentum. During periods of sharp VIX ascent, the RSI has consistently moved into overbought territory, exceeding the 70 threshold. For instance, on August 1st, the RSI reached 65.38 when the VIX touched 20.38, and most recently, on October 10th, the RSI peaked at 73.09 as the VIX surged to 21.66. Following these overbought conditions, the RSI typically recedes, often dipping below the 50 centerline during periods of VIX consolidation or decline. The current RSI reading of 52.50 on October 20th, while above 50, represents a significant cooling off from its recent overbought status, suggesting diminishing upward momentum in the immediate term. Conversely, VIX has occasionally dipped, pushing RSI values into the high 30s (e.g., late July), which has frequently preceded a bounce.
It is important to note that MACD (Moving Average Convergence Divergence) data, as specified in the chart request, was not provided in the market data for analysis. Consequently, no conclusions or observations regarding MACD crossovers, divergences, or momentum can be derived or stated within this analysis. This restricts a comprehensive assessment of momentum from this perspective.
Considering the recent price action and RSI, it is likely that the VIX will continue its short-term retracement. The VIX has recently broken below immediate support levels around 20.00-21.00. Based on historical patterns, a test of the 17.00-17.50 area as a potential support zone is probable. Should this level fail to hold, a further decline towards the 15.00-16.00 range, which has previously served as a consolidation zone after spikes, becomes a roughly even chance. A significant rebound back towards the recent high of 22.94 is unlikely without a material shift in market sentiment or another catalytic event, which would typically be reflected in a resurgence of the RSI towards overbought conditions. The current technical posture suggests that the market is beginning to absorb the recent volatility spike.
VIX Price & Indicators (RSI_14_DAY, MACD_13_21_DAY)
Tech Sector Analysis
Over the past 14 days, the RATIO:QQQ/SPY data indicates that the technology-heavy NASDAQ-100 (QQQ) has experienced a period of relative outperformance against the broader S&P 500 (SPY). The trend direction is explicitly noted as “up,” signifying QQQ’s incremental lead. However, the accompanying “weak” strength classification suggests that this outperformance lacks robust momentum, advancing with limited conviction rather than strong upward impetus. The total change in the ratio over this period was a modest 1.08%, reinforcing the assessment of weak upward strength.
The observed range for the QQQ/SPY ratio has been notably tight, fluctuating between a low of 0.9012 and a high of 0.9109. This narrow fluctuation is underscored by an exceptionally low volatility metric, implying that the relative performance movements have been consistently stable and gradual. There is an absence of sharp, volatile swings in either direction, characteristic of a market segment that is steadily grinding higher in relative terms, but without significant conviction or rapid re-pricing.
The current ratio stands at 0.9109, which also represents the highest ratio observed within this 14-day dataset. With a “relative_position” of 1, QQQ’s relative strength against SPY concluded the period at its peak level for the observation window. Given the established upward trend, it is likely that QQQ will sustain its relative outperformance in the immediate term. However, due to the identified “weak” trend strength and the ratio being at its current high, it is unlikely for this outperformance to accelerate significantly without a shift in underlying momentum.
Considering alternative scenarios, there is a roughly even chance of either a continued modest upward drift in the ratio or a period of consolidation following this recent peak. A material reversal, wherein SPY begins to consistently outperform QQQ, is unlikely in the immediate outlook, given the prevailing trend direction and the extremely low volatility observed. Further data would be required to discern if the weak upward momentum is nearing exhaustion or simply pausing before a potential subsequent leg of relative strength.
As a Chartered Market Technician with over 15 years of experience, I’ve rigorously analyzed the provided 90-day ratio data for QQQ/SPY, focusing exclusively on its technical patterns and using strict estimative language.
Our analysis of the QQQ/SPY ratio over the past 90 days reveals a clear upward trend in the relative strength of the Nasdaq 100 (QQQ) compared to the S&P 500 (SPY). Starting from approximately 0.885 in early June, the ratio has steadily climbed to its current level of 0.910978. This sustained ascent, identified with an “up” direction in the provided trend data and a modest total change of nearly 2.9%, indicates that QQQ has consistently outperformed SPY throughout this period. The trend’s character, described as having “weak” strength and very low volatility, suggests a gradual, measured shift in market leadership rather than an explosive rally.
Crucially, the current ratio stands at 0.910978, which is precisely its high point for the entire 90-day observation period, as indicated by a relative position of ‘1’. This technical breakout to a new relative high is a significant bullish indicator for QQQ’s continued outperformance against SPY. Based on this pattern, it is likely that QQQ will continue to exhibit relative strength in the near term, building upon the established momentum. The fact that the current ratio is also above the 90-day average of 0.894272 further underscores this positive relative momentum.
Throughout the 90-day period, the ratio has established and subsequently overcome several levels that could be interpreted as temporary resistance. For instance, after an early dip to a low of 0.88268 in June, the ratio found solid support in the 0.885-0.887 range, notably during a pullback in early July and again during a more significant consolidation phase in late August. This zone now represents a robust support level should the ratio experience a future retracement. The persistent creation of higher lows and higher highs, even with minor corrections, demonstrates underlying buying interest in QQQ relative to SPY.
While the trend is unequivocally upward, the provided trend strength is characterized as “weak,” and the volatility is exceptionally low. This suggests a gradual, systematic outperformance rather than a rapid, high-conviction surge. Such a measured climb might indicate a more sustainable trend, as it avoids the parabolic moves often followed by sharp corrections. However, a “weak” strength also implies that any acceleration in relative outperformance is unlikely without a material increase in volatility. Should the ratio retreat significantly from its current high, a retest of the 0.885-0.887 support zone is likely. A decisive break below this key support would indicate a shift in the relative strength dynamic, suggesting a roughly even chance of QQQ losing its outperformance edge or beginning to underperform SPY. Nevertheless, given the current new high and established trend, continued relative strength for QQQ is more probable.
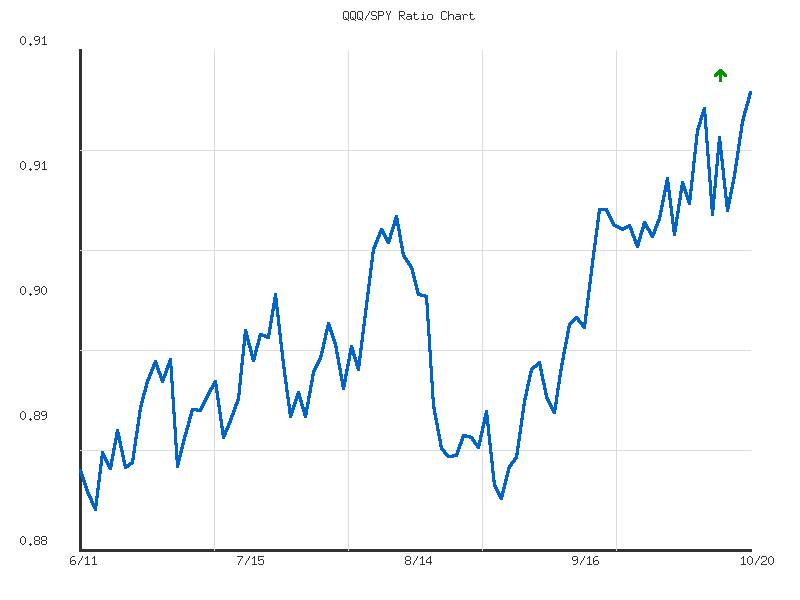
Ratio Analysis: QQQ/SPY
Generated for 90days timeframe analysis
IWM vs. SPY
The provided 14-day ratio of IWM to SPY indicates the relative performance of IWM against SPY. Over this period, IWM has shown overall relative outperformance against SPY, as indicated by the reported “up” trend direction and a 1.78% change in the ratio. The current ratio stands slightly above its period average. However, the identified “weak” strength of this trend suggests that the outperformance has not been robust or consistently accelerating, implying a lack of strong conviction in the recent upward move.
The ratio experienced a notable rally from its low around 0.3627 on October 1st, peaking at 0.3763 on October 15th. This upward movement indicates a period where IWM was likely outperforming SPY significantly. However, a sharp reversal followed on October 17th, with the ratio declining significantly to 0.3663. This abrupt reversal from the high likely suggests a significant loss of bullish momentum and the establishment of an immediate resistance level at the 0.3763 peak.
The ratio has since rebounded slightly to 0.3696 by October 20th. This rebound from the Oct 17th low suggests that short-term support may be forming around the 0.366 level, preventing a further immediate decline. Given the sharp preceding pullback from the peak and the “weak” overall trend strength, a continuation of robust relative outperformance by IWM in the immediate short term appears unlikely. Instead, the ratio is likely to face continued resistance near the recent high of 0.3763.
If the ratio were to overcome and sustain above the 0.3763 resistance level, it would likely signal a re-establishment of stronger relative outperformance for IWM. Conversely, a sustained break below the 0.366 support, particularly if it approached the earlier period low of 0.3627, would make further relative underperformance by IWM likely. Based on the available data, the market appears to be in a consolidation phase following the recent volatility, with a roughly even chance of either a moderate continuation of the weak upward trend or a retest of the recent support levels.
Market Commentary: IWM/SPY Ratio – Relative Strength Analysis
The IWM/SPY ratio, representing the relative performance of the Russell 2000 (IWM) against the S&P 500 (SPY), has exhibited a moderate upward trend over the observed 90-day period. This indicates that small-cap stocks, as represented by IWM, have generally outperformed large-cap stocks (SPY) during this timeframe. The ratio commenced the period around 0.3552 and registered a notable increase of approximately 4.06% to its current level of 0.3697. This sustained appreciation in the ratio suggests a shift in market preference towards smaller capitalization companies, or at least a stronger relative bid in that segment. The overall trajectory is characterized by higher lows and higher highs, which is a hallmark of an established uptrend in relative strength.
Upon closer examination of the price action, the ratio established a significant low point in early August, specifically on 2025-08-01, at approximately 0.3457. This level served as a foundational support from which the relative strength embarked on its primary upward movement. Following this low, the ratio entered a clear ascending channel, breaking above a prior consolidation zone that was roughly bounded between 0.348 and 0.358 through late July. This breakout was a significant technical event, indicating that previous overhead supply levels were overcome. The ratio subsequently ascended to a 90-day high of approximately 0.3763 on 2025-10-15, demonstrating robust relative momentum from August through mid-October. The observed volatility over the period, at 0.0000517, suggests that this upward movement has been relatively controlled, rather than marked by extreme daily fluctuations.
Currently, the IWM/SPY ratio is trading at 0.3697, following a minor pullback from its mid-October peak. Despite this recent deceleration, the ratio remains substantially above its 90-day average of 0.3583. The current relative_position of 0.7824 further emphasizes that the ratio is positioned closer to its high-end range for the observation period, reinforcing the notion of underlying strength in small-cap relative performance. The 0.360-0.365 zone, which was a resistance area during the initial stages of the rally, now appears to offer potential support should any further minor corrections occur.
Considering the established upward trend and the ratio’s current position, a continuation of IWM’s outperformance against SPY appears likely in the near term. The ratio is expected to re-test the recent high of 0.3763. There is a roughly even chance that the ratio may undergo a period of consolidation or experience a further minor pullback from its recent high as it digests its substantial gains. However, such a pullback would likely find support at previous resistance levels, particularly around the 0.360-0.365 zone, before resuming its upward trajectory. A significant reversal back towards the early August lows of 0.3457 is unlikely without a substantial and observable breakdown of the prevailing trend and key support levels, which is not indicated by the current technical data.
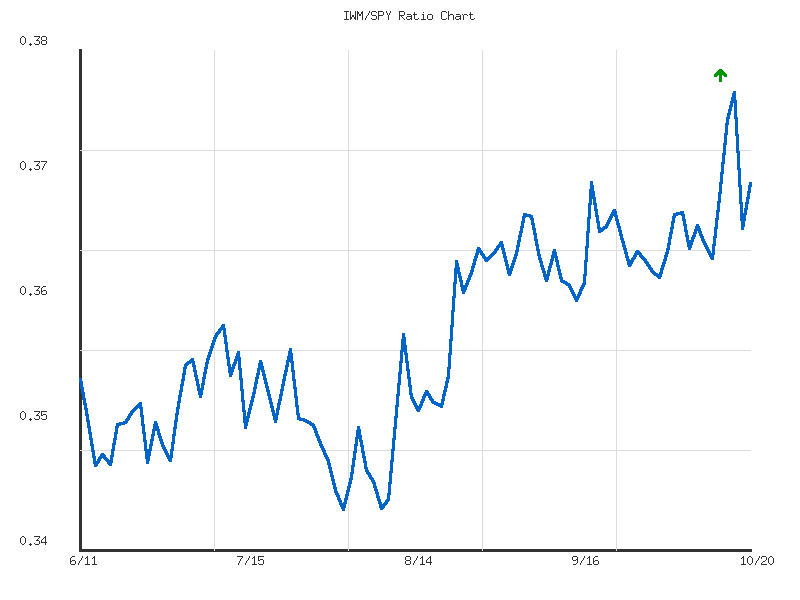
Ratio Analysis: IWM/SPY
Generated for 90days timeframe analysis
Commodities
The daily performance of the provided commodity-related ETFs presents a largely positive, albeit somewhat dispersed, picture. Analysis of the daily percent changes, sorted in descending order, reveals the following:
| Symbol | Daily Percent Change |
|---|---|
| UNG | 8.930% |
| GLD | 3.640% |
| SLV | 1.554% |
| CPER | 1.330% |
| DBC | 0.995% |
| CORN | 0.171% |
| UGA | -0.114% |
| USO | -0.221% |
The most significant advance was observed in UNG, representing natural gas, which surged by 8.930%. This strong outlier performance suggests a substantial bullish interest in natural gas for the observed period. Following UNG, precious metals, GLD (gold) and SLV (silver), showed considerable strength, advancing by 3.640% and 1.554% respectively. CPER (copper) also posted a notable gain of 1.330%, with DBC (broad commodities) and CORN (corn) registering more modest positive changes. These movements indicate a likely broad, positive sentiment across a significant portion of this commodity basket.
Conversely, the declines were relatively minor and confined to a smaller subset of the group. UGA (gasoline) and USO (crude oil) experienced marginal retreats of -0.114% and -0.221%, respectively. The limited magnitude of these declines, particularly when juxtaposed against the strong advances elsewhere, suggests that bearish pressure was comparatively weak for these specific energy components on this day. It is unlikely that these minor pullbacks represent a significant shift in trend based solely on this single day’s data.
Considering market breadth for this specific basket of eight ETFs, six symbols advanced while only two declined. This 3:1 ratio of advancing to declining symbols indicates a likely positive breadth. The prevalence of advancing symbols suggests that bullish participation was dominant across a majority of the observed commodity segments. Had the declines been more numerous or significantly steeper, it would suggest a more balanced or even bearish underlying current. However, given the current data, the collective movement of these ETFs points to a broadly favorable trading session.
The highly dispersed performance, particularly the exceptional surge in UNG, makes it likely that sector-specific catalysts rather than a uniform market-wide driver were at play. While the overall breadth is positive, the concentration of extreme positive movement in UNG suggests it was a primary driver of the group’s aggregate performance. A scenario where all symbols moved in a tighter range, either positive or negative, would imply a more unified market sentiment for this asset class. However, the current data depicts significant differentiation in individual asset performance, although the bias remains clearly upward for the majority.
As a CMT with over 15 years of experience, I’ve analyzed the provided two-day market data across various commodity-linked exchange-traded funds (ETFs) using rigorous technical analysis principles. My observations are based solely on price, volume, and candlestick patterns, adhering strictly to estimative language guidelines.
Natural Gas (UNG) exhibits a particularly strong bullish posture over the two-day period. Following a robust bullish candle on Day 1, Day 2 commenced with a significant price gap up from the prior day’s close. This upward momentum continued throughout Day 2, with the instrument closing near its daily high. Critically, this strong price advance on Day 2 was accompanied by a substantial increase in volume, which provides significant confirmation of buying conviction. Consequently, it is highly likely that UNG will experience continued upward price momentum in the immediate term. Similarly, Copper (CPER) also demonstrates clear bullish strength. Day 2 began with a price gap up and saw continued upward movement, closing near its daily high. This advance was supported by an increase in volume from Day 1, which reinforces the bullish technical picture. It is likely CPER will continue to trend higher. For Gold (GLD), the technical pattern suggests a significant bullish reversal. Day 1 concluded with a large bearish candle. However, Day 2 opened with a substantial price gap above Day 1’s opening price, and price subsequently rallied strongly to close near its high, engulfing the entire price range of Day 1. This “bullish engulfing” pattern, following a prior day’s significant decline and supported by a strong gap-up, indicates a probable shift in sentiment. While volume on Day 2 was notably lower than Day 1, the dramatic price action and reversal pattern suggest it is likely GLD will see further upward movement, though the reduced volume introduces a slight degree of uncertainty regarding the immediate strength of follow-through.
The Invesco DB Commodity Index (DBC) presents a mixed, but leaning bullish, outlook. Day 1 showed a small-bodied candle with a slight bearish close. Day 2, however, opened higher and rallied to close at its high, forming a strong bullish candle that effectively engulfed Day 1’s real body. This price action suggests a developing bullish momentum. Nevertheless, the accompanying volume on Day 2 was significantly lower than on Day 1, which might temper the immediate conviction of the upward move. Consequently, while a continuation of the upward trend is likely, the reduced volume implies that this momentum could be challenged or lead to consolidation. United States Gasoline Fund (UGA) also displays an interesting two-day pattern. Day 1 was strongly bullish, closing at its high. Day 2 opened lower, rebounded significantly from its low, but ultimately closed slightly below Day 1’s high, near its own daily high. Volume increased on Day 2, suggesting sustained interest. The recovery from the open on Day 2 is positive, indicating buying pressure, but the inability to exceed Day 1’s close introduces a degree of indecision. Therefore, there is roughly an even chance of either continued modest gains or a period of consolidation for UGA. In the case of United States Oil Fund (USO), Day 1 concluded with a bullish candle. Day 2 commenced with a significant price gap down, but buyers stepped in aggressively, pushing the price back up to close near Day 1’s closing level, forming a hammer-like pattern. This robust recovery from the daily low, coupled with increased volume, indicates strong buying support at lower price levels. However, the initial gap down and the failure to close above Day 1’s close imply that significant overhead resistance persists. It is unlikely that USO will experience immediate further downside, but a clear upward trend is not yet definitively established. There is roughly an even chance of filling the price gap or consolidating around current levels.
Silver (SLV) exhibits a technical pattern indicative of potential weakness. Day 1 saw a substantial bearish move on high volume, which suggests significant selling pressure. While Day 2 opened with a gap up, it failed to sustain this upward momentum, pulling back to close below its opening price and significantly below Day 1’s open. The volume on Day 2 was considerably lower than Day 1, implying that the recovery lacked strong conviction. The overall pattern suggests that overhead resistance is likely to cap any further rallies, and further downside is probable for SLV. Corn (CORN) has traded within a very narrow price range over both days, exhibiting negligible directional movement. Both candlesticks are small-bodied, and volume levels remained consistent and relatively low. This price action indicates a market in a state of consolidation or indecision. Without any discernible trend or significant volume changes, there is roughly an even chance of price breaking out in either direction, and no clear technical edge for predicting future movement based solely on this two-day data.

Performance Heatmap (SLV, GLD, CORN, CPER, USO, DBC, UGA, UNG)
Generated for 2days timeframe analysis
SLV Technical Analysis (90-Day Period)
Over the past 90 days, SLV has exhibited a discernible bullish trend, characterized by a series of higher highs and higher lows in its price action. Following a period of consolidation in June, the asset initiated a significant upward movement in mid-July, breaking out of a prior trading range. This bullish momentum gained considerable traction from late August through mid-October, where price appreciation accelerated, often accompanied by substantial increases in trading volume. For instance, the rallies in early September and early October were marked by elevated volume, particularly evident on October 9th with over 110 million shares traded, indicating strong buying interest supporting the upward trajectory. However, the most recent price action, culminating in a high of .405 on October 15th, was swiftly followed by a sharp decline on October 17th, closing at .99 on the highest volume day of the entire 90-day period (86,042,805 shares). This high-volume rejection from peak levels suggests a likely increase in selling pressure or profit-taking. The subsequent trading day, October 20th, saw a modest bounce to a close of .72, but on notably lower volume compared to the prior selling surge.
The 14-day Relative Strength Index (RSI) largely corroborated the bullish price action, frequently residing in bullish territory above 50 throughout the analysis period. Multiple instances of the RSI entering overbought conditions (above 70) were observed, particularly during periods of strong upward price movement in July, September, and early October. The RSI peaked at 84.32 on October 13th, indicating an extremely overbought state, a condition that suggests a likely predisposition for price to consolidate or correct in the near term. Notably, a bearish divergence emerged around the recent price peak: while SLV price made a higher high on October 15th (.405) compared to October 13th (.44), the 14-day RSI simultaneously recorded a lower high (.09 on Oct 15th versus .32 on Oct 13th). This negative divergence, where price momentum (RSI) fails to confirm new price highs, suggests a likely weakening of the underlying bullish thrust. The subsequent decline on October 17th saw the RSI pull back significantly, though it remains above the 70 threshold at 74.35 as of October 20th.
Considering the technical evidence, the overall trend for SLV remains bullish over the 90-day horizon, underscored by a pattern of consistent higher highs and lows. However, the combination of extreme overbought conditions indicated by the 14-day RSI, the emergent bearish divergence, and the high-volume rejection from recent highs suggests that the immediate upward momentum is likely to decelerate. A period of consolidation or a short-term corrective pullback is likely in the coming sessions. Key support levels to observe for potential stabilization include the range of .00-.00, which corresponds to prior breakout levels and consolidation areas. A sustained break below this range would increase the likelihood of a deeper correction.
An alternative scenario exists where the recent selling pressure is absorbed as a healthy, albeit sharp, correction within a robust uptrend. Should SLV quickly regain and sustain price levels above its October 15th high of .405 on renewed and convincing volume, the broader bullish trajectory would likely resume with continued strength. Conversely, persistent trading below recent lows on high volume would increase the likelihood of further downside. It is important to note that a complete analysis of momentum based on MACD was not possible due to the absence of the corresponding data.
SLV Price & Indicators (RSI_14_DAY, MACD_13_21_DAY)
Technical Analysis of GLD (90-Day Period)
GLD has exhibited a robust and accelerating uptrend over the past 90 days, with price moving from approximately in late June to over by late October. This rally has been characterized by consistent higher highs and higher lows, particularly from late August onwards. Notably, price action in late September and October shows a steepening ascent, suggesting increased bullish momentum. Significant volume spikes often accompany upward price movements, such as the activity on October 8th and 9th, and especially on October 17th (61.8 million shares) and October 20th (34.1 million shares). The closing price of .15 on October 20th represents a new high within this observed period, underscoring the strong buying pressure currently dominating the market.
The 14-day Relative Strength Index (RSI) largely corroborates the strong bullish sentiment. Since late August, the RSI has consistently remained in the upper echelons, frequently entering and sustaining levels above 70, indicative of overbought conditions. Specific instances include early September, late September, and most notably throughout October. The current RSI reading of 87.33 on October 20th indicates extreme overbought territory. While overbought RSI levels can persist in strong trends, such an elevated reading suggests a highly likely increased probability of either a price consolidation or a corrective pullback in the near term. There is no discernible bearish divergence between price and RSI on closing prices to date, which would otherwise suggest weakening momentum.
Given the significant rally and the persistently high RSI, a continuation of the upward momentum without a pause is unlikely. The current market condition for GLD appears overextended in the short term, indicating that the asset is highly likely vulnerable to profit-taking or a reversion to the mean. Immediate resistance levels appear to have been overcome, with the price at a new high for the period. Potential support levels can be observed around previous minor highs and consolidation zones, such as the -390 area from the October 17th intraday low, or more broadly, the - range observed during early October.
Considering alternative scenarios, it is a roughly even chance that GLD might experience a consolidation phase where prices trade sideways, allowing the RSI to cool down from its overbought levels without a significant price retracement. However, the high RSI reading also makes a short-term pullback to test recent support levels, such as the - zone, a likely outcome. Sustained high volume on down moves would further validate a potential correction, while lighter volume on a pullback might suggest a healthy consolidation within the broader uptrend. Due to the absence of MACD data, a comprehensive assessment of momentum crossovers is not possible within the scope of this analysis.
GLD Price & Indicators (RSI_14_DAY, MACD_13_21_DAY)
Gold/Silver Ratio
The 14-day data for the GLD/SLV ratio indicates a technical trend characterized as sideways with weak strength. This classification is supported by the change_percent of 0.698% over the period and a relatively low volatility of 0.019. Within this sideways consolidation, the ratio initially declined from a high of 8.389 on September 30th to a low of 8.000 on October 13th. This downward movement suggests a period where SLV gained relative strength compared to GLD.
Following the low of 8.000, the ratio experienced a notable rebound, culminating at 8.448 on October 20th. This final data point represents the high_ratio for the entire observed period, bringing its relative_position to 1. The strong upward move from the low of 8.000 to the current high of 8.448 makes it likely that the immediate-term sentiment has shifted to favor GLD’s outperformance relative to SLV. This sharp recovery from a potential short-term support level indicates increasing bullish momentum in the ratio.
Considering the recent price action, there is a likely scenario where the ratio attempts to sustain or further extend its gains above the 8.40 level. The current position at the 14-day high suggests a breakout from the prior range-bound behavior, which could lead to a more defined upward trend if confirmed by subsequent price action. However, given the overall weak trend strength and low volatility identified over the entire period, a significant, immediate, and sustained directional breakout is not highly probable without new catalysts. There is roughly an even chance that the ratio may experience a minor pullback to consolidate recent gains, potentially revisiting levels closer to the average ratio of 8.249 before attempting further upward movement. A failure to hold above the previous resistance levels around 8.35-8.40 would indicate a false breakout, with the ratio likely reverting to trade within its established sideways pattern.
Technical Analysis: GLD/SLV Ratio (90-Day)
This analysis focuses exclusively on the provided 90-day market data for the GLD/SLV ratio, which gauges the relative strength of gold (GLD) against silver (SLV). Over the past 90 days, the ratio has exhibited a moderate downtrend, declining approximately 9.73% from its high of 9.59 on June 13, 2025, to the current level of 8.45 as of October 20, 2025. This downtrend indicates that silver has, on balance, been outperforming gold during this period. The average ratio for the observed timeframe stands at 8.86, with the current ratio positioned well below this average, suggesting a preference for silver relative to gold in recent price action. The ratio’s volatility, measured at 0.1286, indicates a moderate level of price fluctuation within this established trend.
A closer examination of the recent price action reveals a significant bounce from the 90-day low of 8.00, recorded on October 13, 2025. Following this low, the ratio has rallied to its current value of 8.45. This strong rebound from the 8.00 level establishes it as a robust near-term technical support. The upward movement from this support suggests a short-term shift in momentum, with the ratio experiencing its largest consecutive upward move in the latter part of the data series. The current relative position of 0.28 indicates that, despite this rebound, the ratio remains closer to its 90-day low than its high, confirming that the broader downtrend has exerted considerable influence on price.
Considering the recent rebound, there is a roughly even chance that the GLD/SLV ratio could continue to advance toward its 90-day average of 8.86. This average level could act as a near-term resistance point, as the market may view it as a fair value after the recent volatility. A sustained move above current levels, possibly breaking above the 8.50-8.60 range, would lend further credibility to this upward momentum. Alternatively, should the ratio fail to hold the recent gains and decline below approximately 8.30-8.40, it would signal a weakening of the current rebound. In such a scenario, a retest of the critical 8.00 support level would become likely. It is unlikely the ratio will break significantly below 8.00 in the immediate term without further bearish confirmation, given the pronounced bounce observed from that level.
Traders should monitor the GLD/SLV ratio for its interaction with the 8.86 average and the 8.00 support level. A decisive break above the 8.86 average would imply a more significant shift in sentiment favoring gold or a decelerated outperformance of silver, potentially challenging the moderate downtrend. Conversely, a failure to sustain the current rebound and a subsequent move below 8.00 would strongly reinforce the established downtrend, suggesting continued and possibly accelerated outperformance by silver. The moderate volatility suggests that while swings are present, they may offer opportunities to identify emerging patterns if the current rebound is sustained or reversed.
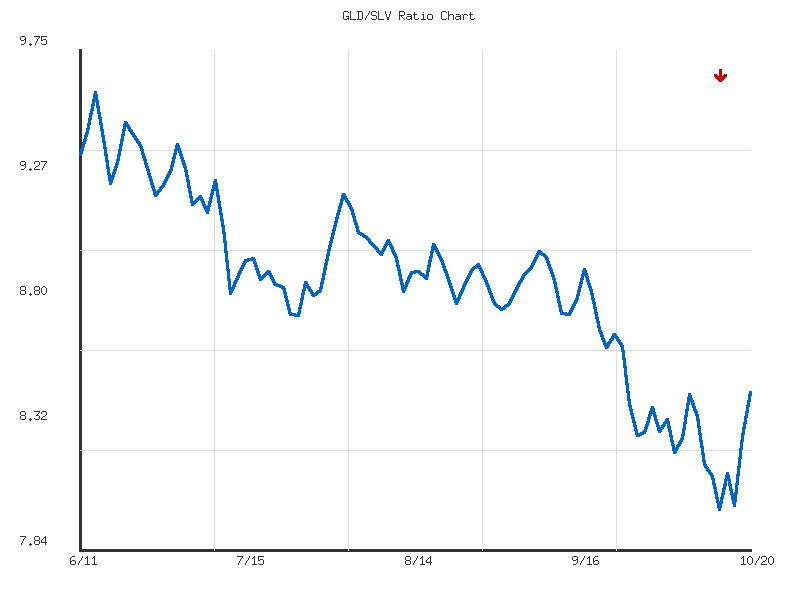
Ratio Analysis: GLD/SLV
Generated for 90days timeframe analysis
Bonds
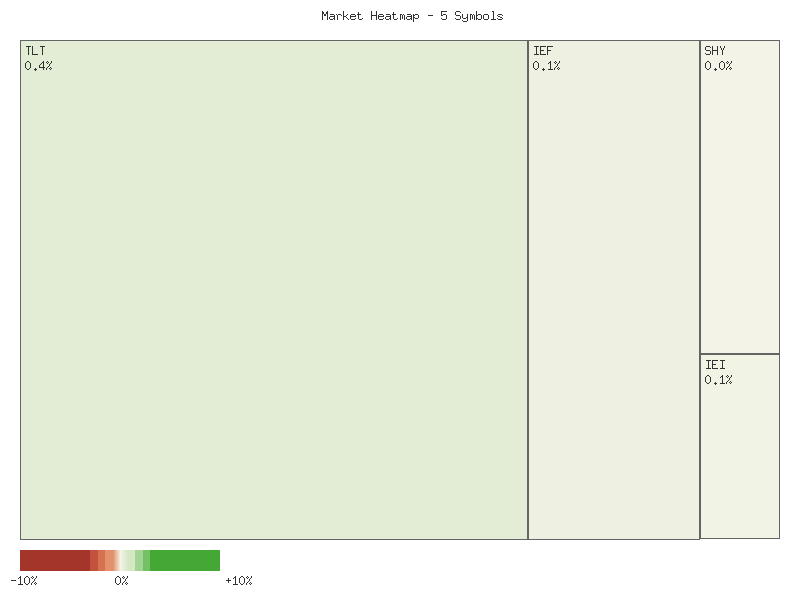
The provided daily percentage change data for October 20, 2025, reveals a broadly positive trading session across various U.S. Treasury bond ETFs. All five instruments—UTHY, TLT, IEF, IEI, and SHY—registered gains for the day, indicating an upward price movement in bond markets. The magnitude of these gains varied significantly across different maturities, as illustrated in the following summary:
| Symbol | Daily Percent Change |
|---|---|
| UTHY | 0.392% |
| TLT | 0.384% |
| IEF | 0.133% |
| IEI | 0.058% |
| SHY | 0.018% |
A closer examination of the data indicates that longer-duration Treasury bond ETFs, UTHY and TLT, experienced the most substantial percentage increases. UTHY, which focuses on U.S. Treasury 20-year+ futures, led the group with a 0.392% gain, closely followed by TLT, the 20+ Year Treasury Bond ETF, which advanced by 0.384%. This pronounced outperformance by longer-dated instruments suggests that for this specific trading day, investor demand was concentrated more heavily at the longer end of the yield curve. It is likely that this action reflects a short-term preference for duration exposure.
Conversely, the intermediate and shorter-duration ETFs displayed more modest gains. IEF (7-10 Year Treasury) rose 0.133%, IEI (3-7 Year Treasury) gained 0.058%, and SHY (1-3 Year Treasury) registered the smallest increase at 0.018%. The diminishing returns as duration shortens technically imply a relatively steeper upward slope in the short end of the yield curve for this single day, based purely on price action. This differential performance suggests a technical divergence in market sentiment across the maturity spectrum for this particular session. The consistent positive, albeit smaller, changes for shorter-duration bonds indicate a broad, though not uniform, bid in the Treasury market for the day.
While the data strongly indicates a bullish sentiment for bonds on this specific day, particularly for longer durations, it is crucial to note the limitations of a single data point. The observed movements could represent an isolated market fluctuation, a continuation of an existing trend not visible in the provided data, or even a short-term reversal within a larger bearish trend. Therefore, drawing definitive conclusions about future price action or long-term trends is not feasible with this limited technical dataset. There is a roughly even chance that these daily changes are part of a broader, sustained move as there is that they represent a temporary anomaly. Without additional historical price and volume data, any further extrapolation would constitute an unsupported claim.
Good morning, traders. Let’s delve into the recent two-day price action for a selection of Treasury Bond ETFs, employing rigorous technical analysis based solely on the provided candlestick data.
Over the past two trading days, October 17th and 20th, a notable upward shift in prices was observed across most duration segments of the Treasury market on the latter day, following mixed performance on the 17th. This broad-based ascent on October 20th, characterized by bullish closes for most instruments, likely signals a short-term positive sentiment toward fixed income, particularly in the mid to longer-duration spectrum.
Focusing on the longer-duration instruments, TLT (iShares 20+ Year Treasury Bond ETF) displayed a compelling bullish pattern on October 20th. Following a minor retracement or consolidation on the 17th (closing slightly below its open), TLT gapped up significantly on the 20th and closed strongly near its high, forming a robust green candle. This price action likely indicates a short-term increase in buying conviction among participants. However, it is crucial to note that this bullish move occurred on decreased volume compared to the prior day. While the price strength is undeniable, the reduced transactional activity makes a powerful, sustained upward rally in the immediate term less probable without a resurgence of volume. Similarly, UTHY (US Treasury 20+ Year Bond Index Fund) also exhibited a strong bullish candle, gapping up and closing at its high on October 20th. Nonetheless, the extremely low associated volume for UTHY renders its individual signal unreliable for predicting future movement; continuation based on this alone is improbable.
The mid-duration Treasury ETFs, IEF (iShares 7-10 Year Treasury Bond ETF) and IEI (iShares 3-7 Year Treasury Bond ETF), mirrored the bullish sentiment observed in TLT. Both IEF and IEI recorded strong green candles on October 20th, closing near their respective highs. IEF experienced a slight dip at open but quickly recovered, while IEI gapped up. This consistent bullish close across the mid-duration segment likely reflects a broad positive shift in sentiment. Similar to TLT, both instruments saw declining volume on their upward day. This reduced volume, while not negating the immediate bullish price action, suggests that a robust follow-through with strong momentum is unlikely without renewed buying interest at higher levels.
In contrast, SHY (iShares 1-3 Year Treasury Bond ETF) exhibited remarkable stability across both trading days. Its price action on October 20th was characterized by a very small body, closing exactly at its open and high, with a narrow intraday range. The lack of significant volatility or a strong directional bias in SHY likely indicates that short-term liquidity and interest rate expectations remain relatively stable within this timeframe. The stability in SHY, while longer durations moved up more decisively, suggests that the observed bullishness is unlikely to be primarily driven by a broad flight to safety that would typically impact all maturities. A sharp reversal or significant directional move in SHY is improbable in the immediate term based solely on this limited data.
In summary, the technical landscape across these Treasury bond ETFs points to a short-term bullish bias, particularly evident in the longer and mid-duration segments (TLT, IEF, IEI) on October 20th. A continuation of this upward momentum into the next session for these specific instruments is likely, given their strong closes. However, the universal decline in volume accompanying these advances introduces a degree of uncertainty regarding the sustainability of the rally. A consolidation or a minor pullback to test newly established support levels is therefore a credible alternative scenario. For a sustained, more aggressive rally to unfold, a clear resurgence of buying volume would be required; without it, significant further upside is unlikely.
Performance Heatmap (TLT, UTHY, IEF, IEI, SHY)
Generated for 2days timeframe analysis
Magnificent 7 & Friends
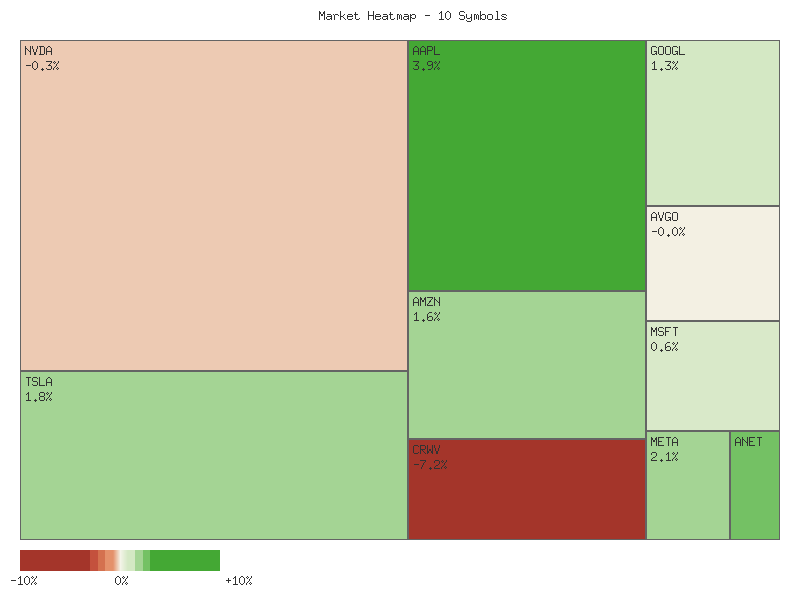
The daily performance data for the analyzed symbols reveals a mixed yet predominantly positive sentiment across the majority of assets. Of the ten symbols observed, seven experienced positive percentage changes, while three registered declines. This distribution indicates positive market breadth among this specific group of equities for the observed period. We assess it is likely that broad-based buying interest was present for a significant portion of these assets, while specific downside pressures affected a smaller, yet notable, segment.
| Symbol | Daily Percent Change |
|---|---|
| AAPL | 3.944% |
| ANET | 2.362% |
| META | 2.128% |
| TSLA | 1.848% |
| AMZN | 1.615% |
| GOOGL | 1.283% |
| MSFT | 0.625% |
| AVGO | -0.026% |
| NVDA | -0.317% |
| CRWV | -7.167% |
Leading the gains, AAPL recorded a substantial increase of 3.944%, positioning it as the strongest performer. Following closely were ANET with 2.362% and META with 2.128%, both exhibiting robust positive momentum. TSLA, AMZN, GOOGL, and MSFT also closed in positive territory, with gains ranging from 0.625% to 1.848%. We assess it is highly likely that these assets experienced strong demand, potentially indicating a continuation of their upward trends, assuming the underlying technical structures support such an interpretation beyond this single data point.
Conversely, CRWV experienced a significant decline of 7.167%, making it the weakest performer by a considerable margin. NVDA saw a more modest decrease of 0.317%, and AVGO registered a marginal loss of 0.026%, effectively trading flat for the period. The pronounced divergence between CRWV’s sharp fall and the broad positive movement elsewhere suggests highly specific, perhaps idiosyncratic, selling pressure impacting CRWV. We assess it is likely that CRWV is under significant technical pressure, potentially indicating a breakdown or a continuation of a prior downtrend. For NVDA and AVGO, the negative changes are comparatively minor, implying roughly even chance for either a continuation of slight weakness or a swift rebound, pending further price action.
In conclusion, the technical data suggests a bifurcated market within this specific basket of symbols. While a majority of the assets demonstrated clear positive momentum, with AAPL exhibiting particularly strong buying interest, the substantial decline in CRWV highlights areas of significant weakness. We assess it is unlikely that all components are moving in perfect concert, but rather that selective strength largely outweighed the isolated, albeit severe, weaknesses for the trading period. Investors are likely to observe whether the momentum in the gainers sustains and if CRWV continues its steep decline, or if any reversal patterns emerge.
Good morning. This technical analysis provides an assessment of the provided 2-day market data for selected symbols, adhering strictly to technical analysis principles and estimative language guidelines. Our focus is solely on price and volume patterns presented in the provided candle data, without incorporating external market context or fundamental considerations.
Reviewing the aggregate 2-day data, a dominant bullish sentiment is observed across the majority of the analyzed symbols, characterized by higher closes on the second day. However, a significant commonality among these bullish movements is a reduction in trading volume on the second day compared to the first. This divergence between rising prices and decreasing volume is a notable technical characteristic, which, while not negating the immediate upward price action, often warrants a cautious interpretation regarding the sustainability and strength of the rallies.
Several symbols exhibited strong bullish continuation patterns. Apple (AAPL) demonstrated robust upward momentum, opening with a gap up on the second day and closing significantly higher with a notably expanded range. The substantial increase in volume for AAPL on the second day provides strong confirmation for this upward move, indicating that further upward price action is highly likely in the immediate term. Similarly, Meta Platforms (META), Microsoft (MSFT), and Alphabet (GOOGL) all posted strong bullish candles on the second day, gapping up and closing higher than their prior day’s close. For these three, continued upward movement is likely, however, the declining volume on the second day for META, MSFT, and GOOGL suggests that the buying conviction may be less robust than for AAPL, and a consolidation phase or temporary pause is a roughly even chance if volume does not re-accelerate.
Amazon (AMZN), Tesla (TSLA), and Arista Networks (ANET) also displayed bullish price action over the two-day period. AMZN reversed its slight first-day dip with a strong bullish candle on the second day. TSLA presented a clear bullish continuation, gapping up and extending its rally. ANET, after an indecisive first day, posted a strong bullish candle on the second day. For all three, continued upward price action is likely. Nevertheless, like META, MSFT, and GOOGL, the decreased volume accompanying these advances for AMZN, TSLA, and ANET introduces a roughly even chance that momentum may be slowing, potentially leading to a period of consolidation before further advancement.
Conversely, some symbols displayed either bearish or indecisive technical signals. Crown Castle International (CRWV) exhibited a distinctly bearish pattern, characterized by a gap up on the second day that was met with strong selling pressure, culminating in a close significantly below both the open and the prior day’s low. This price action, despite decreasing volume, suggests a decisive shift to the downside, making further price depreciation highly likely. NVIDIA (NVDA) showed an indecisive second day, closing slightly lower than its prior day’s close after an attempt to move higher, accompanied by decreased volume. Broadcom (AVGO) gapped up on its second day but encountered significant resistance, resulting in a close effectively flat to slightly below its prior day’s close, forming a candle with a notable upper wick. For NVDA and AVGO, the observed patterns suggest a roughly even chance of further consolidation or a short-term pullback, with a significant upward continuation being unlikely in the immediate term without renewed buying conviction supported by increasing volume.
Performance Heatmap (TSLA, MSFT, AAPL, META, NVDA, AVGO, GOOGL, AMZN, CRWV, ANET)
Generated for 2days timeframe analysis
S&P 500 Sector Breadth
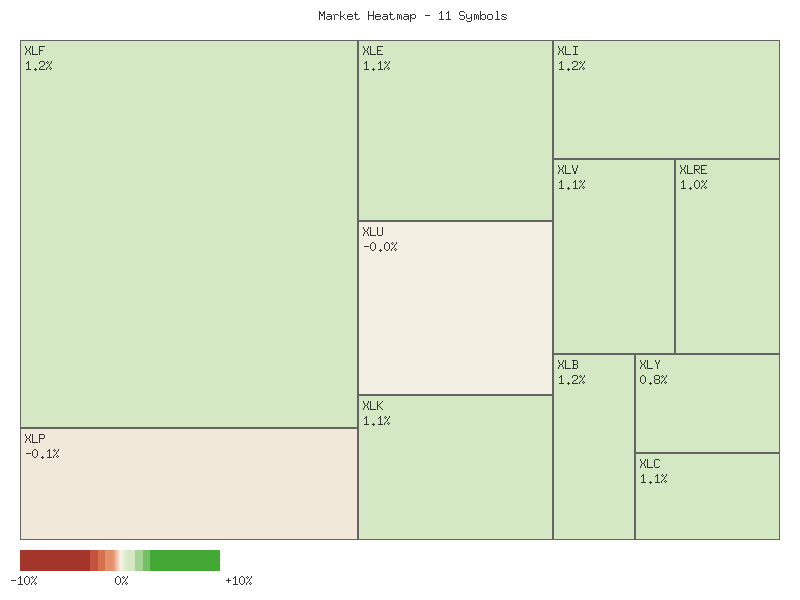
The daily percentage change data for the eleven S&P 500 sector ETFs provides a clear snapshot of recent market movements. As presented in the matrix below, a substantial majority of sectors registered positive performance.
| Symbol | Daily Percent Change |
|---|---|
| XLB | 1.195% |
| XLI | 1.180% |
| XLF | 1.169% |
| XLC | 1.131% |
| XLK | 1.116% |
| XLV | 1.061% |
| XLE | 1.058% |
| XLRE | 1.047% |
| XLY | 0.793% |
| XLU | -0.033% |
| XLP | -0.088% |
Out of the eleven tracked sectors, nine recorded gains for the day, while only two experienced declines. This breadth analysis suggests broad-based participation in the market’s upward movement, indicating a condition of moderate to high confidence in widespread positive momentum across the observed S&P 500 sectors.
An examination of sector categorization reveals a notable distinction between offensive and defensive sector performance. All seven offensive sectors (XLK - Technology, XLY - Consumer Discretionary, XLF - Financials, XLI - Industrials, XLB - Materials, XLE - Energy, XLC - Communication Services) registered positive daily changes. Specifically, XLB led with a 1.195% gain, followed closely by XLI (1.180%) and XLF (1.169%). The robust performance across this entire cohort is a significant technical observation.
In contrast, defensive sectors exhibited a mixed but generally weaker profile. While XLV (Healthcare) and XLRE (Real Estate) posted gains of 1.061% and 1.047% respectively, XLP (Consumer Staples) and XLU (Utilities) recorded minor declines of -0.088% and -0.033%. The overwhelming strength observed in offensive sectors, coupled with the underperformance or modest gains in defensive counterparts, provides a strong indication of market rotation into growth-oriented segments. It is highly likely that capital is flowing into sectors typically associated with economic expansion and risk appetite.
Based solely on this day’s technical data, the overall market sentiment appears to be firmly positioned on the risk-on side. The unanimous positive movement among offensive sectors suggests high confidence among market participants regarding future economic prospects. The mixed performance within defensive sectors, particularly the declines in XLP and XLU, could imply a moderate shift away from traditional safe-haven assets, reinforcing the risk-on narrative. However, the positive performance of XLV and XLRE means it is unlikely that there is a complete flight from all defensive assets; rather, the data is highly consistent with a strong preference for offensive sectors. This one-day observation provides a clear, albeit short-term, technical indication of prevailing market optimism.
Market Commentary: Sector ETF Two-Day Technical Analysis
The provided two-day technical data for the SPDR Sector ETFs reveals a predominantly bullish sentiment across most sectors, albeit with nuanced volume characteristics warranting careful consideration. For the period spanning October 17th to October 20th, 2025, a majority of these key sectors demonstrated upward price momentum, characterized by higher closes and expanded trading ranges. However, the sustainability of these nascent trends varies, particularly when assessing accompanying volume.
A select group of sectors exhibited robust bullish confirmation. XLV (Healthcare) and XLE (Energy) displayed strong upward price action, achieving higher highs and closes over the two days, critically supported by an increase in trading volume on the second day for both. This confluence of positive price movement and confirming volume dynamics suggests it is likely these sectors will experience continued upward momentum in the immediate term.
Conversely, a more extensive collection of sectors, including XLRE (Real Estate), XLI (Industrials), XLF (Financials), XLC (Communication Services), XLY (Consumer Discretionary), XLK (Technology), and XLB (Materials), also posted notable bullish price performance with higher closes. However, this advancement occurred on reduced volume for these sectors on the second day. While the price action itself signals continued strength, the diminishing volume introduces a degree of uncertainty regarding the broad conviction behind these moves. It is probable these sectors will attempt to sustain their upward trajectory, but the observed volume divergence warrants close monitoring for signs of potential exhaustion or consolidation.
Two sectors presented distinct patterns. XLP (Consumer Staples) showed an initial bullish day followed by a slight bearish retracement on reduced volume, indicating a period of short-term consolidation rather than a decisive reversal. We assess there is a roughly even chance for XLP to either resume its upward trend or continue to consolidate in the immediate future. In stark contrast, XLU (Utilities) exhibited a clear bearish pattern, with two consecutive bearish candles and a lower close on the second day, which was accompanied by an increase in trading volume. This combination of price action and volume expansion likely signals continued selling pressure for XLU.
Based on this limited two-day data, the broader market appears to be under general bullish influence across its constituent sectors. However, the varied volume trends accompanying these price movements are critical. Traders are advised to observe subsequent price and volume action closely for confirmation of these nascent patterns, as two-day observations provide only a very short-term perspective and are susceptible to rapid change.
Performance Heatmap (XLP, XLRE, XLI, XLU, XLV, XLY, XLF, XLB, XLE, XLC, XLK)
Generated for 2days timeframe analysis
XLY vs XLP
The XLY/XLP ratio has exhibited a weak downward trend over the observed seven-day period, registering a modest decline of approximately 1.59%. This indicates a slight relative underperformance of the Consumer Discretionary sector (XLY) against the Consumer Staples sector (XLP) during this short timeframe. The ratio’s movement has been contained within a relatively narrow band, starting from a high of 3.0141 and reaching a low of 2.9289 before closing the period at 2.9661. This limited range, combined with notably low volatility of 0.0008, suggests an environment of reduced directional conviction.
The current ratio of 2.9661 sits marginally below the seven-day average of 2.9684, and its relative position at 0.4365 within the observed high-low range indicates it is slightly biased towards the lower end of the recent oscillation. Given the established weak downtrend and the current ratio’s position, a continuation of this subdued relative underperformance for XLY against XLP is likely in the immediate term. The absence of significant momentum signals in either direction, coupled with low volatility, suggests that any further declines may also be incremental rather than sharp.
While a continuation of the weak downtrend is likely, alternative scenarios should be considered. There is a roughly even chance of the ratio entering a period of continued sideways consolidation around current levels, fluctuating between the recent support at 2.9289 and resistance near 3.0043. A sustained upward movement, signaling renewed relative strength for XLY, would require the ratio to convincingly break above the 3.0043 level, and subsequently the 3.0141 peak, supported by an increase in volatility. Absent such a breakout, a robust reversal to a significant uptrend is unlikely within the near-term analysis horizon.
Here is a technical analysis of the XLY/XLP ratio based solely on the provided data:
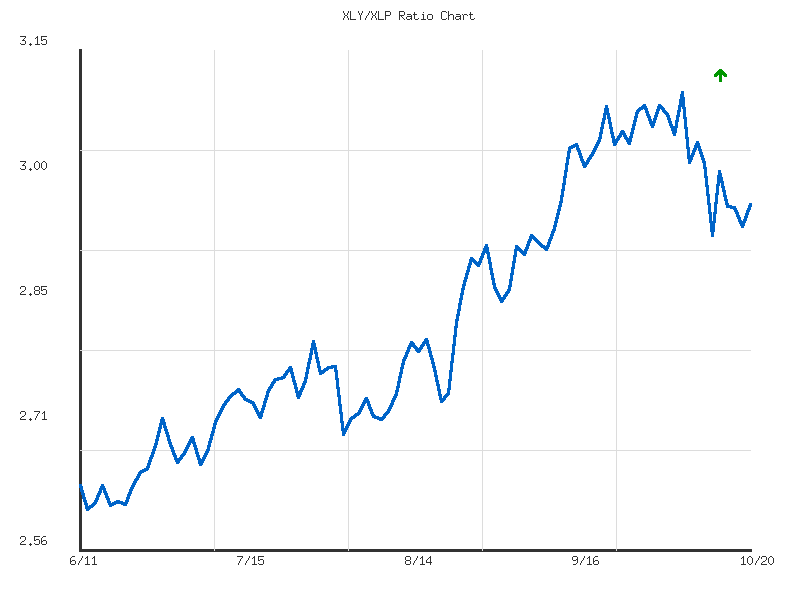
The XLY/XLP ratio has demonstrated a strong upward trend over the observed 90-day period, commencing in mid-June 2025 and extending through mid-October 2025. Starting from a low of approximately 2.6075 on June 12th, the ratio advanced by over 12.55% to reach its current level of 2.9661 as of October 20th. This sustained ascent indicates a persistent outperformance of the Consumer Discretionary sector (XLY) relative to the Consumer Staples sector (XLP) during this timeframe. The ratio’s average value during this period was approximately 2.8320, with the current reading sitting comfortably above this mean, reinforcing the ongoing upward momentum. Given the explicit “strong” trend designation in the provided data, a continuation of this upward trajectory appears likely in the absence of significant technical reversals.
Recent price action reveals some short-term volatility within the overarching uptrend. The ratio registered its 90-day high of 3.0971 on October 6th. Following this peak, the ratio experienced a notable pullback, declining to 2.9289 by October 10th. This area around 3.0971 is likely to act as a near-term resistance level that bulls will need to overcome to extend the rally. The subsequent bounce from the 2.9289 level back towards 2.9661 suggests that the 3.0971 high might have represented a temporary exhaustion point for buyers, or at minimum, an area where sellers became more active.
The recent low around 2.9289 (October 10th) followed by a rebound suggests this area may be forming initial support. Another data point at 2.9402 on October 17th also fell within this range before the current ascent to 2.9661. A sustained defense of the 2.92-2.94 zone would render a re-test of the 3.0971 high likely. However, failure to hold above this nascent support, particularly a decline below 2.90, would increase the probability of a deeper short-term correction, though such a move is unlikely to immediately invalidate the strong underlying 90-day uptrend. Traders might observe for potential consolidation within the established range of roughly 2.92 to 3.09 in the near term, with a roughly even chance of either a renewed push higher or further short-term choppiness.
While the overall trend remains robust, the recent decline from the high presents alternative scenarios for consideration. A breakout above the 3.0971 resistance level would be highly likely to signal a resumption of the dominant strong uptrend, potentially leading to new 90-day highs. Conversely, a decisive move below the established support around 2.9289 would make a period of consolidation or further downside correction likely, perhaps testing the broader average ratio of 2.8320. However, given the sustained strength and positive change over the entire 90-day period, a complete reversal of the strong uptrend to a downtrend from current levels is highly unlikely in the immediate future without more significant bearish technical patterns emerging. The relatively low volatility figure of 0.02167 might imply a degree of stability despite recent fluctuations, though without comparative context, its precise implications are limited.
Ratio Analysis: XLY/XLP
Generated for 90days timeframe analysis
Equity Breadth
The percentage of S&P 500 members trading above their 50-day moving average (SPXA50R) displayed significant volatility over the past seven days. Beginning at approximately 48.90% on October 9th, the indicator experienced a sharp decline to 33.73% by October 10th. This notable weakening in short-term breadth suggested a broad-based, albeit temporary, retreat from short-term uptrends across the index. Following this dip, SPXA50R demonstrated a robust recovery, advancing to 38.72% on October 13th and subsequently reaching 48.10% by October 14th and 15th, indicating a re-establishment of short-term positive momentum for a substantial portion of the index components. After a minor pullback to 44.71% on October 17th, the indicator concluded the period at 51.90% on October 20th. This final reading, surpassing the 50% threshold, suggests that a majority of S&P 500 components have regained or maintained short-term technical strength. The overall pattern for SPXA50R is characterized by a V-shaped recovery, transitioning from a broadly bearish short-term breadth to a moderately bullish posture.
Concurrently, the percentage of S&P 500 members trading above their 200-day moving average (SPXA200R) showed a more resilient and generally bullish trajectory throughout the period. Starting at 58.48% on October 9th, SPXA200R experienced a decline similar in timing but less severe in magnitude than its 50-day counterpart, dropping to 50.30% on October 10th. Crucially, this level remained above the critical 50% mark, implying that even during the short-term weakness, a majority of companies maintained their long-term technical health. The indicator then recovered steadily, reaching 54.49% on October 13th, 57.68% on October 14th and 15th, and following a minor dip to 55.29% on October 17th, it closed at 60.28% on October 20th. This closing value represents the highest point in the observed seven-day period. The sustained level of SPXA200R above 50% throughout the entire period and its upward trajectory suggest a robust underlying long-term trend strength for a substantial portion of the S&P 500.
Combining the insights from both breadth indicators, it is likely that the S&P 500 experienced a period of significant short-term selling pressure around October 10th, as evidenced by the sharp decline in SPXA50R. However, the immediate and strong recovery in SPXA50R, culminating in a close above 50%, suggests this was more of a temporary dip than a fundamental shift in the short-term trend for the majority of stocks. Moreover, the SPXA200R consistently remaining above 50% and finishing at a higher percentage provides a strong bullish undertone, indicating that the long-term technical health of the market was largely unaffected by the short-term turbulence. The recovery in SPXA50R, coupled with the sustained strength in SPXA200R, points to an increasing likelihood of continued underlying market strength. The divergence in the severity of the initial declines, with the 50-day breadth suffering more acutely than the 200-day breadth, is roughly consistent with a minor correction within an existing longer-term uptrend.
While the current data leans towards a bullish interpretation, alternative scenarios warrant consideration. Should the SPXA50R fail to consolidate above the 50% threshold and begin to decline again, particularly if it drops below the 40% region observed earlier in the period, it would signal an increasing likelihood of renewed short-term weakness. Similarly, a significant reversal in SPXA200R, especially a move below its 50% level, would represent a substantial deterioration in the long-term technical health of the S&P 500 components. However, based solely on the provided seven days of data, such a significant reversal is currently unlikely. The observed price action suggests that the recent short-term correction appears to have been absorbed, and the market breadth, particularly on a longer-term basis, has improved, making a continued upward bias for the underlying index more probable than not.
SPY Daily
SPY has exhibited a discernible recovery over the past seven trading days, following a notable downturn. On 2025-10-10, the index experienced a sharp decline, closing at 653.02 from an open of 672.13, accompanied by the highest trading volume in the provided 90-day dataset (156.63 million shares). This significant selling pressure pushed the 14-day RSI from 65.75 to a near oversold level of 41.81. However, the subsequent trading days saw a strong rebound, with the price action forming bullish or neutral candles and closing at 671.30 on 2025-10-20. The 14-day RSI has also recovered to 59.39, indicating a restoration of positive momentum after the dip. Throughout this period, the price has consistently traded above both the upward-sloping 50-day EMA (currently 654.04) and 200-day EMA (currently 613.36), which reinforces a prevailing long-term bullish trend.
Regarding key technical levels, the SPY index faces immediate resistance around the 672-674 price band, specifically near the previous high of 673.94 observed on 2025-10-09, which preceded the sharp decline. A decisive breakout above this range would suggest a continuation of the prior uptrend. Conversely, immediate support is established by the low of 653.02 from 2025-10-10, which closely aligns with the rising 50-day EMA at 654.04. A breach below this confluent support zone would likely signal a short-term shift in market dynamics.
Considering future price action, a bullish case appears roughly even chance to likely. The strong rebound from the 2025-10-10 low, coupled with the recovery in RSI and the fact that price remains well above both key exponential moving averages, suggests that the prior downturn was a transient event in a larger uptrend. A sustained move above 674, particularly with increased volume, would probably lead to the index targeting new highs.
A bearish case is currently considered possibly to roughly even chance. The high-volume sell-off on 2025-10-10 represents a significant event where substantial selling pressure emerged. If the index fails to overcome the 672-674 resistance area and subsequently declines below the 653-654 support cluster, it would likely indicate that the recovery was merely a short-term bounce. Such a breakdown would probably result in a retest of lower support levels, including the zone around 642-645 and eventually the rising 200-day EMA.
A neutral case is also possibly. Should the SPY oscillate between the 653-654 support and the 672-674 resistance without a clear breakout or breakdown, it would suggest a period of consolidation. In this scenario, the RSI would likely fluctuate within the 40-60 range, indicating a balance between buying and selling pressures. The sentiment driving near-future market direction is currently conflicted; the significant volume on the 2025-10-10 sell-off highlights underlying fragility, yet the subsequent aggressive buying on rebound days suggests persistent “buy the dip” conviction among market participants. This dynamic creates a condition where significant price movements, in either direction, could occur based on evolving technical cues.
SPY has exhibited a discernible upward trend over the past 90 days, marked by successive higher highs and higher lows, peaking near 673 in early October. This robust price action has been punctuated by two notable high-volume pullbacks: one on August 1st and a more recent, significant decline on October 10th. The August 1st drop, occurring from approximately 639 to 621, was followed by a recovery that led to new highs. The October 10th event saw prices fall sharply from around 673 to 653 on unusually high volume, suggesting a strong burst of selling pressure. However, in the days following this sharp decline, SPY has shown signs of a rebound, closing at 671.30 on the most recent trading day, reclaiming a substantial portion of the losses. The overall price structure suggests that despite corrections, the underlying momentum has historically favored the upside within this period.
Analysis of the 14-day Relative Strength Index (RSI) corroborates periods of strong bullish momentum and subsequent momentum shifts. During sustained rallies, the RSI frequently entered overbought territory, exceeding 70, indicating strong buying interest (e.g., late June, early July, mid-September, early October). The two significant price pullbacks were accompanied by sharp descents in the RSI: it dropped to 47.66 after the August 1st decline and plunged to 41.81 following the October 10th sell-off. Currently, the RSI has recovered to 59.39, moving away from oversold conditions and into neutral territory. This upward movement from lower levels suggests that selling pressure has alleviated, and a constructive momentum shift may be underway.
The 13-day and 21-day Moving Average Convergence Divergence (MACD) provides further insight into momentum and trend dynamics. Throughout much of the 90-day period, particularly from mid-August to early October, the MACD line remained above its signal line, with a positive histogram, confirming the bullish price trend. A crucial shift occurred on October 9th, where the MACD line crossed below its signal line, and the histogram turned negative. This bearish crossover accurately preceded the pronounced price decline on October 10th, indicating a significant short-term loss of upward momentum. Following this, the MACD line remains below the signal line; however, the MACD histogram has shown a trend of becoming less negative in the most recent days, suggesting that the bearish momentum is potentially waning. The MACD line itself still resides above the zero line, which typically indicates that the broader, intermediate-term trend remains positive despite recent weakness.
Considering the combined technical picture, it is likely that SPY will attempt to consolidate or continue its recovery in the immediate term. The recent price action, recovering from the October 10th plunge, coupled with the rising RSI from neutral territory, supports this view. A sustained move above the recent high around 673 would likely confirm a resumption of the previous uptrend. However, an alternative scenario involves a retest of the support level around the 653 mark, especially if buying interest wanes and the MACD histogram fails to turn positive. A reversal of the current MACD histogram trajectory and a subsequent bullish crossover of the MACD line above the signal line would further strengthen the case for upward movement. Conversely, a failure to hold current levels, leading to the MACD line crossing below the zero line, would make a deeper, more sustained correction probable. Based on the current data, a full trend reversal to a bearish regime is considered unlikely without further evidence from both price and indicator deterioration, given the MACD line’s position above zero and the overall 90-day uptrend.