Weekly Market Technical Analysis
The market is currently in a volatile, corrective phase, initiated by a significant high-volume sell-off across major indices and cyclical sectors on October 10th. This event prompted a defensive rotation, with Utilities and Consumer Staples highly likely to continue outperforming while Financials and Energy sectors struggle. Key equity indices like SPY and QQQ face a roughly even chance of retesting their October 10th lows or consolidating. Conversely, Treasury ETFs show a likely continuation of their broad-based short-term uptrend, particularly for longer-duration assets. In commodities, energy prices are highly likely to remain bearish, and silver (SLV) is likely to experience further short-term downside or consolidation despite gold’s (GLD) strong, but potentially tiring, uptrend. Overall, broad short-term equity strength is unlikely given current technical patterns.
Market Indices
| Symbol | Daily Percent Change |
|---|---|
| QQQ | 0.284% |
| OEF | 0.060% |
| SPY | -0.117% |
| MDY | -1.019% |
| IJR | -1.475% |
| IWM | -2.764% |
As of October 17th, the daily percentage changes across the observed indices present a mixed picture with a discernible negative bias in market breadth. Only two of the six observed symbols, QQQ (+0.284%) and OEF (+0.060%), recorded advances. Conversely, four symbols experienced declines, ranging from a minor -0.117% for SPY to a more substantial -2.764% for IWM. This 2:4 advancer-to-decliner ratio strongly suggests that market breadth is likely negative, indicating that the majority of the market, particularly smaller and mid-cap segments, faced selling pressure on this specific day.
The price action over the preceding 14 days has been characterized by elevated volatility and swings in sentiment. A notable event occurred on October 10th, where all six indices experienced significant, broad-based declines, with QQQ falling by -3.471% and IJR by -3.120%. This broad and substantial downturn strongly suggests a period of significant bearish momentum. This sharp decline was followed by a robust, broad-based rebound on October 13th, where all indices posted gains, with IWM leading at +2.784% and QQQ at +2.122%. However, the subsequent two days (Oct 14th and 15th) showed mixed performance, indicating a lack of decisive directional conviction following the rebound.
Considering the full 14-day period, the market appears to be in a volatile phase, transitioning from earlier minor positive momentum into a more corrective, and potentially consolidative, pattern. The sharp, broad-based sell-off on October 10th and the subsequent, though not full, recovery on October 13th are characteristic of a market wrestling with strong bearish forces. While the most recent day shows mixed results, the heavier losses in IWM and IJR, representing small-cap segments, suggest a likely weakening in risk appetite among market participants. It is a roughly even chance that the market could either attempt to build upon the Oct 13th rebound or succumb to renewed selling pressure, potentially retesting the lows of Oct 10th, especially given the negative breadth observed on October 17th.
Throughout this period, small-cap indices (IJR, IWM) consistently exhibited higher volatility than large-cap benchmarks (SPY, QQQ, OEF), experiencing more pronounced swings both upward and downward. For instance, on October 10th, IJR and QQQ had the largest declines, while on October 13th, IWM showed the strongest rebound. This heightened sensitivity of smaller-cap assets makes them a key watchpoint for shifts in overall market sentiment. The relative strength of QQQ and OEF on October 17th, despite overall negative breadth, suggests a potential divergence where large-cap technology and broader large-cap segments might be holding up better than their smaller counterparts.
As a Chartered Market Technician with over 15 years of experience, I offer the following technical analysis based strictly on the provided 14-day candlestick data for SPY, QQQ, IWM, IJR, MDY, and OEF. Our assessment focuses entirely on price and volume patterns during this period, without external context.
Our analysis of the 14-day candlestick data for SPY, QQQ, IWM, IJR, MDY, and OEF reveals a significant market shift, predominantly influenced by the broad-based downturn on October 10th. Prior to this, a general upward trajectory was evident across most of these ETFs. However, October 10th saw large red candles with notably higher trading volumes across all six instruments. This synchronized, high-volume sell-off strongly suggests a pronounced increase in bearish sentiment, which effectively broke prior short-term upward trends and established new immediate-term resistance and support levels.
Following the October 10th decline, larger-cap indices (SPY, QQQ, OEF) exhibited attempts at recovery but generally stalled below their pre-event highs. SPY rebounded from its .84 low, but the - region now appears to be forming a zone of overhead resistance. QQQ similarly struggled to reclaim the - pre-event highs, with current resistance observed near -. OEF, tracking the S&P 100, also recovered from its .63 low, yet it remains below its prior high of . While some buying interest was evident in the days immediately following the sell-off, the overall recovery momentum appears stalled. We assess it is likely these indices will face continued resistance at these re-established prior price levels in the near term.
The small and mid-cap segments present a divergent picture following the widespread downturn. IWM, representing the Russell 2000, displayed notable relative strength post-drop. It rebounded robustly, even surpassing its pre-October 10th high of .09 to reach .77 by October 15th, despite a slight pullback on October 17th. This suggests stronger underlying buying interest in this segment compared to its larger-cap counterparts. Conversely, MDY (S&P MidCap 400) and IJR (S&P SmallCap 600) have shown relative weakness. Both struggled significantly to reclaim their respective pre-October 10th peak levels, with MDY’s recovery stalling near - and IJR’s attempts held back near -. We judge it is highly likely MDY and IJR will face continued challenges overcoming these established resistance levels in the immediate future, reflecting less conviction from buyers in these specific segments.
Considering the cumulative technical evidence from this 14-day period, the market appears to be in a phase of post-correction consolidation with a general bias towards weakness for most segments. The high-volume October 10th sell-off established clear overhead resistance for many, with subsequent recovery attempts largely failing to reclaim pre-event highs, IWM being a notable exception. We estimate there is a roughly even chance of either a continued modest recovery attempt or a retest of the October 10th lows in the immediate future. A decisive break below these October 10th lows on increased volume would suggest a likely continuation of the bearish trend. Conversely, a sustained breakout above the pre-event highs on strong volume would shift the technical outlook to more bullish, but based solely on the provided data, such a broad breakout appears unlikely in the immediate term.
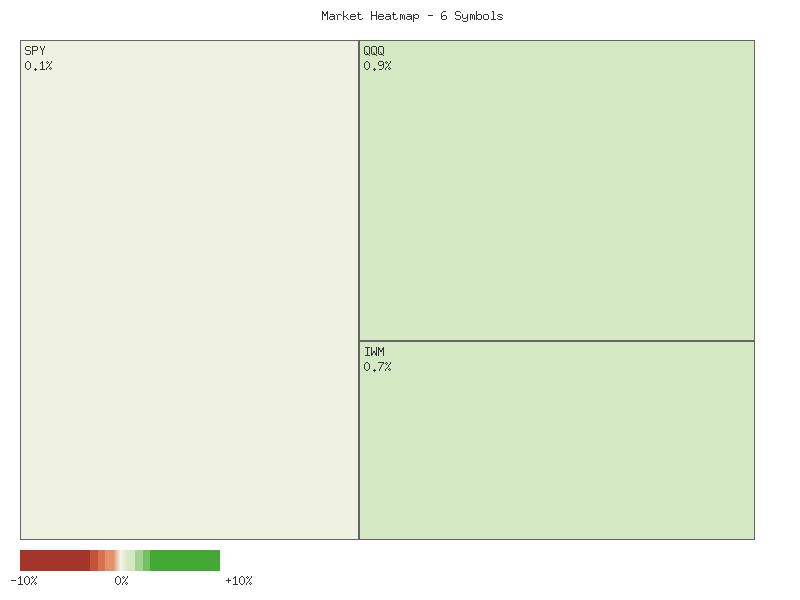
Performance Heatmap (SPY, QQQ, IWM, IJR, MDY, OEF)
Generated for 14days timeframe analysis
SPY Technical Analysis: Navigating a Shifting Momentum Landscape
The SPDR S&P 500 ETF Trust (SPY) has exhibited a generally bullish trend over the 90-day period from June 10th to October 17th, 2025, characterized by sustained price appreciation. This analysis relies solely on the provided candlestick data and the 14-day Relative Strength Index (RSI), as data for the MACD indicator was not available within the provided market data for evaluation. The price action demonstrates a robust upward trajectory from approximately in early June to a peak near in early October, suggesting a prevailing buying interest throughout much of the period.
Initial momentum from June to early July saw SPY advance steadily, with the 14-day RSI frequently entering overbought territory (above 70), indicating strong bullish sentiment. A notable acceleration occurred in late July, propelling the price higher, but this was followed by a sharp and significant pullback on July 31st and August 1st. This two-day decline, which saw price drop from over to , was accompanied by exceptionally high volume, peaking at over 140 million shares on August 1st. Such a high-volume sell-off following an extended rally is a key technical event, suggesting a significant level of profit-taking or a shift in short-term sentiment. The RSI concurrently dropped from over 75 to below 50, further confirming this momentum change.
Following the early August correction, SPY resumed its upward trajectory, displaying another sustained rally that carried prices to new highs into early October. Volume during this period was generally healthy but did not consistently match the intensity seen during the August 1st sell-off. The 14-day RSI mirrored this renewed strength, consistently holding above its 50-level and frequently re-entering overbought conditions, particularly around mid-September and early October. However, a critical development emerged in late September to early October. While SPY recorded a higher price high on October 9th at .94 compared to its previous high of .29 on September 22nd, the 14-day RSI registered a lower high (65.75 on October 9th versus 73.70 on September 22nd). This constitutes a clear bearish divergence, suggesting that the underlying buying momentum was weakening despite the price pushing to new highs.
The bearish divergence proved to be a significant warning, preceding a dramatic decline on October 10th. On this day, SPY experienced a sharp drop from .94 to .02, once again on exceptionally high volume (over 156 million shares). This high-volume selling strongly implies a breakdown of the prevailing uptrend’s immediate strength. The 14-day RSI plummeted from 65.75 to 41.81, moving from a near-overbought state to the lower end of the neutral zone, reinforcing the significant shift in momentum. In the days following this sharp decline, SPY has staged a partial recovery, closing at .39 on October 17th. However, this bounce has occurred on lighter volume compared to the October 10th sell-off, and the RSI remains in the neutral zone around 53.
Considering the recent price action and indicator signals, a sustained continuation of the robust bullish trend observed prior to October 10th is unlikely in the immediate term. The bearish RSI divergence, followed by a high-volume price rejection at new highs, indicates a considerable loss of bullish momentum. It is highly likely that SPY will enter a period of consolidation or experience further downward pressure. A retest of the October 10th lows or a deeper correction is a roughly even chance scenario if buying volume does not increase significantly on upward movements. For the bullish trend to reassert itself convincingly, SPY would likely need to reclaim and hold above the October 9th high of .94 on strong volume, a scenario that appears unlikely given current technical patterns.
SPY Price & Indicators (RSI_14_DAY, MACD_13_21_DAY)
Technical Analysis: QQQ 90-Day Outlook (As of 2025-10-17)
QQQ has exhibited a robust upward trend over the past 90 trading days, characterized by a consistent series of higher highs and higher lows, climbing from approximately in June to over by early October. This long-term price action indicates a dominant bullish sentiment throughout the observed period. However, this ascent has not been without significant, albeit temporary, corrections, which frequently coincided with signs of overextension in momentum indicators and surges in selling volume. The overall market structure suggests a strong underlying demand, punctuated by periods of profit-taking.
The 14-day Relative Strength Index (RSI) frequently entered overbought territory (above 70) at various points, notably in late June, late July, mid-September, and early October. These instances of overbought readings were consistently followed by price pullbacks, suggesting that the RSI was effective in signaling short-term exhaustion of buying pressure. Specifically, the sharp price decline on 2025-08-01 saw the RSI drop from the low 70s to below 50. Similarly, the 2025-10-10 decline caused the RSI to plummet sharply from nearly 70 to 45.42. These rapid decelerations in momentum, as indicated by the RSI, were coincident with considerable bearish price movements, underscoring the indicator’s utility in identifying short-term turning points.
Several significant price corrections occurred within this 90-day period. Of particular note are the declines around late July/early August, mid-August, late September, and most recently on 2025-10-10. The 2025-10-10 event is particularly salient, featuring a sharp price drop from .40 to a close of .50, accompanied by exceptionally high trading volume of 94.4 million shares. Elevated volume during significant declines, such as this one and others in late July (69M) and late September (70M), generally suggests a high degree of conviction among sellers, reinforcing the potential for sustained downside pressure in the immediate term. While price has recovered somewhat in the days following 10-10, closing at .93 on 2025-10-17, the RSI remains in neutral territory at 56.16, indicating that strong upward momentum has not yet decisively re-established itself.
The technical evidence suggests that while the overarching trend for QQQ remains bullish, the recent sharp correction on 2025-10-10, coupled with very high volume and a significant RSI drop, makes it roughly even chance that QQQ will experience further short-term volatility or a consolidation phase around current levels. A retest of the .50 level is a likely near-term scenario should bullish momentum fail to quickly re-establish. Alternatively, if price can decisively sustain above the immediate resistance formed by the pre-10-10 highs, it is likely that the longer-term uptrend will reassert itself, with price aiming for new highs. However, the absence of MACD data limits a comprehensive assessment of trend strength and potential momentum crossovers. Based solely on the provided data, traders should be prepared for increased chop or a deeper correction, given the strong bearish signal from the 10-10 candle and RSI collapse, even if the longer-term trend remains positive.
QQQ Price & Indicators (RSI_14_DAY, MACD_13_21_DAY)
IWM Technical Analysis: Navigating Recent Volatility (October 17, 2025)
This analysis focuses on the recent 90-day price action of IWM, as depicted by candlestick data, in conjunction with the 14-day Relative Strength Index (RSI). It is important to note that MACD data for the period was not provided, precluding its inclusion in this assessment. Over the past three months, IWM has experienced a notable uptrend characterized by distinct rallies and intermittent pullbacks, with price advancing from approximately in early June to a recent high near in mid-October. Volume has shown spikes during significant price movements, particularly during sharper declines or reversals.
Throughout much of the observed period, the 14-day RSI has consistently reflected the bullish bias, frequently operating in the upper half of its range, generally above the 50-level. Instances where the RSI moved into overbought territory (above 70), such as on July 3rd (71.57), September 18th (71.23), and prior to October 6th (68.07), were often followed by periods of price consolidation or minor pullbacks. These patterns suggest that readings above the 65-70 threshold are likely indicative of short-term exhaustion in buying momentum, making a near-term price consolidation or minor retracement a highly likely outcome.
Conversely, significant price bottoms were often identified when the RSI dipped into the lower part of its neutral range, particularly around the 40-50 level. A notable example occurred on August 1st, when the RSI reached 41.36, preceding a robust rally. More recently, on October 10th, following a sharp price decline, the RSI dipped to 44.97, which corresponded with a swift price rebound in subsequent sessions. This pattern suggests that an RSI reading in the 40-50 zone has a roughly even chance of marking a significant short-term price support or reversal point for IWM.
Looking at the most recent data, IWM reached a closing high of .33 on October 15th, with the RSI at 62.99, indicating strong but not yet overextended momentum. However, the latest available data for October 17th shows a notable price decline to .41 on high volume, accompanied by a sharp drop in RSI to 51.87. This sudden bearish engulfing-like candle, coupled with increased selling volume and the RSI retreating towards the 50-level, makes a continued short-term downward pressure on price a likely outcome. An alternative scenario is that the RSI finds support at or just below 50, similar to prior instances where it bottomed in the 40-50 range, leading to a stabilization or bounce. However, the magnitude of the recent price drop and volume suggests that further retesting of prior support levels, potentially in the - range, is more probable in the immediate future.
IWM Price & Indicators (RSI_14_DAY, MACD_13_21_DAY)
VIX Fear Index
The CBOE Volatility Index (VIX), often referred to as the “fear index,” exhibited a distinct shift in market sentiment over the observed 14-day period. Initially, from 2025-09-29 to 2025-10-09, the VIX largely traded within a relatively tight range, broadly between 16.00 and 17.50. During this phase, daily percentage changes were mostly modest, typically below 6% in either direction, suggesting a period of contained volatility and a likely moderate level of market complacency or equilibrium. The candlesticks in this preliminary phase often displayed smaller bodies and limited ranges, indicating a lack of strong directional conviction.
A significant shift occurred on 2025-10-10, when the VIX experienced an explosive upward movement. The daily close surged to 21.66 from an open of 16.36, representing a remarkable 31.83% daily increase. This large bullish candlestick, characterized by an extensive upper wick reaching 22.44, signifies a sudden and substantial increase in implied market volatility and, by extension, heightened fear or uncertainty among investors. This event decisively broke the VIX out of its prior consolidation range, establishing a new, higher plateau for volatility expectations.
Following this sharp rise, the VIX entered a phase of elevated, but somewhat erratic, behavior. On 2025-10-13, it retraced significantly by 12.14%, closing at 19.03. However, subsequent days, 2025-10-14 and 2025-10-15, saw the VIX attempt to rebound, with a 9.35% increase followed by a minor decline. The final data point on 2025-10-17 is particularly instructive: despite opening significantly higher at 28.41 and hitting an intraday high of 28.99, the VIX closed substantially lower at 20.78. This large bearish engulfing pattern, following the prior elevated levels, suggests a strong intraday rejection of higher volatility and a probable capitulation in “fear” at extreme levels.
Considering the recent price action, particularly the bearish reversal candle on 2025-10-17, it is likely that the VIX may experience a period of decline or consolidation in the immediate short term. The significant intraday rejection of prices near 29.00 indicates that the peak fear observed around 2025-10-10 to 2025-10-14 might be encountering resistance. There is a roughly even chance that the VIX could retest levels around 19.00-20.00 as market participants digest the recent spike and potential easing of immediate concerns. A sustained move above the 2025-10-17 high of 28.99 is unlikely without a new catalyst.
VIX Technical Analysis: Elevated Volatility Amidst Recent Surge
This analysis focuses on the VIX’s 90-day price action alongside its 14-day Relative Strength Index (RSI). It is important to note that while the analysis request included the MACD_13_21_DAY indicator, the provided market data does not contain MACD values, thus it cannot be incorporated into this assessment. Over the past 90 days, the VIX has primarily fluctuated within a range, albeit with distinct periods of elevated volatility. The recent trading activity indicates a significant shift, suggesting a likely continuation of higher volatility in the immediate term, though short-term retracement is a plausible alternative scenario.
The VIX price data reveals a pattern of consolidation periods interspersed with sharp upward spikes. Notable spikes occurred around June 13, when VIX reached 22, and again on August 1, where it peaked intraday at 21.9 before receding. These events suggest that the 20-22 level has historically acted as a significant resistance zone. The most recent price action, particularly from October 10 to October 17, demonstrates a pronounced surge. On October 10, the VIX experienced a strong upward move, closing at 21.66. This was followed by an extreme intraday high of 28.99 on October 17, which notably opened at 28.41 before closing significantly lower at 20.78. This candle pattern, characterized by a substantial upper shadow, implies strong selling pressure or profit-taking at the highest levels, but still represents an elevated closing value compared to the preceding period.
The 14-day RSI largely confirms these periods of increased volatility. During the June 13 VIX spike, the RSI climbed to 53.58. The August 1 surge saw RSI reach 65.38, indicating strong momentum approaching overbought conditions. Critically, on October 10, coinciding with the VIX’s breakout, the RSI registered a clear overbought signal at 73.09. Although the VIX subsequently pulled back on October 13, the RSI remained elevated, closing at 59.12. By October 17, despite the VIX’s intraday reversal, the RSI continued to show strong momentum at 63.72. The sustained RSI above the 60 threshold, even after a daily close below the open, suggests that the underlying upward pressure on volatility may persist.
Based on the technical evidence, it is likely that market participants anticipate continued higher levels of volatility. The break above the historical 20-22 resistance zone, despite the upper shadow on the October 17 candle, suggests a shift in the perceived baseline for volatility. While the sharp intraday rejection on October 17 could signal a short-term top, making a minor pullback to retest the 20-22 level (now potential support) a roughly even chance, the overall momentum as indicated by the still-elevated RSI suggests that the VIX is unlikely to retreat quickly to its prior lower range. Further analysis on subsequent price action would be necessary to confirm whether the October 17 candle forms a definitive reversal pattern or simply a temporary pause within an extended period of heightened market uncertainty.
VIX Price & Indicators (RSI_14_DAY, MACD_13_21_DAY)
Tech Sector Analysis
Analysis of the QQQ/SPY ratio over the past 28 days indicates a general upward trend in the relative performance of the technology-heavy NASDAQ-100 compared to the broader S&P 500. The ratio commenced the period around 0.8926 and concluded at approximately 0.9090, representing a modest increase of 1.83%. Despite this upward trajectory, the internal trend strength is characterized as “weak,” suggesting that while QQQ has generally outperformed, this outperformance has not been particularly forceful or decisive. The ratio has traded within a defined range, oscillating between a low of 0.8892 and a high of 0.9099. The current ratio of 0.90899 is notably above the average ratio of 0.90102, underscoring the recent relative strength, albeit within the context of a weak overall trend.
The price action reveals a gradual ascent from the September lows, punctuated by minor corrections. A significant support zone for the ratio appears to reside around the 0.8892 level, which marked the lowest point observed. On the upside, the 0.9099 level established on October 9th functions as a clear resistance. The ratio recently experienced a notable pullback to approximately 0.9027 on October 10th, testing an intermediate support level near the average ratio, before swiftly recovering towards the period’s high. This rapid recovery suggests underlying technical demand for QQQ relative to SPY at those lower levels. The current proximity to the 0.9099 resistance is therefore a critical juncture.
A bullish scenario would likely develop should the QQQ/SPY ratio achieve a decisive breakout above the 0.9099 resistance level. Such a breach, particularly if sustained, would signal a renewed acceleration in QQQ’s relative outperformance against SPY. The recent recovery from the October 10th dip lends some credence to the potential for a fresh upward impulse. Should the ratio clear this resistance, it is probable that new highs in relative performance would be established, potentially confirming a strengthening of the ‘up’ trend previously categorized as ‘weak’.
Conversely, a bearish case would emerge if the ratio fails to overcome the 0.9099 resistance and instead reverses downwards. Given the “weak” trend strength, a failure at resistance could lead to a double top pattern if a subsequent decline materializes. A breakdown below the intermediate support zone, roughly around the 0.901 to 0.902 area (near the average ratio and the October 10th low), would likely indicate a loss of momentum and initiate a phase of underperformance or consolidation. In this scenario, it is probable the ratio would retest lower support levels, potentially moving towards 0.895 and, ultimately, the period low of 0.8892.
A neutral outcome presents a roughly even chance if the ratio continues to trade within its established range without a definitive breakout or breakdown. This could involve consolidation below the 0.9099 resistance, signifying that the relative strength of QQQ has peaked for the time being, but without sufficient bearish pressure to trigger a significant decline. The observed low volatility over the period might contribute to such a range-bound environment. From a purely technical standpoint, the provided data offers limited direct insight into external market sentiment drivers. However, the consistent upward bias, despite its weak strength, suggests a prevailing, albeit cautious, technical preference for the growth-oriented QQQ. A sustained rejection from the 0.9099 resistance would technically imply waning confidence in QQQ’s immediate outperformance, while a breakout would indicate strengthening bullish sentiment within this specific relative performance metric.
Good morning, traders. As a CMT with over 15 years of experience, I’ve analyzed the provided 90-day QQQ/SPY relative strength ratio data to offer a purely technical perspective on the market’s current dynamics. This analysis relies solely on the given data, eschewing any external market context.
The QQQ/SPY relative strength ratio has exhibited an upward trend over the past 90 days, advancing approximately 2.62% from its early June levels to its current reading of approximately 0.9090. This upward trajectory indicates that the Nasdaq 100-tracking QQQ has, on balance, outperformed the broader S&P 500-tracking SPY during this period. However, the provided data characterizes this upward trend as “weak.” This assessment suggests that while the overall direction is positive, the momentum behind QQQ’s outperformance has not been consistently robust, implying a degree of indecision or lack of strong conviction in the market’s preference for growth-oriented assets over a diversified market exposure. The ratio’s average during this period was roughly 0.8940, with a range spanning from a low of 0.8827 to a high of 0.9099. The current ratio is situated near the upper end of this 90-day range, specifically at approximately 96.6% of its journey from the low to the high, which is a significant observation for short-term analysis.
Upon closer examination of the daily ratio data, the initial phase in June saw the ratio fluctuate, with a notable dip to its 90-day low of 0.88268 around June 13th. This level could be considered a short-term support zone if the ratio were to decline significantly. Following this dip, the ratio commenced a gradual ascent, punctuated by minor pullbacks, demonstrating QQQ’s emerging relative strength. A more pronounced leg up began in early August, pushing the ratio towards new highs. The recent highest ratio was recorded on October 9th at 0.909917, which stands as the current 90-day peak and a formidable resistance level. The current ratio of 0.9090 is marginally below this peak, suggesting that the ratio is presently confronting resistance or experiencing a slight consolidation just under its recent high. A sustained break above the 0.9099 level would likely signify renewed bullish momentum for QQQ relative to SPY.
The ratio’s recent behavior leading up to October 17th shows it testing the upper boundary of its 90-day range. From October 8th to October 9th, the ratio reached its peak at 0.9099. Subsequent to this, a notable retracement occurred on October 10th, with the ratio dropping to approximately 0.9027. This sharp, single-day decline from a high is a cautionary sign, suggesting that profit-taking or a shift in sentiment may be present. While the ratio has since recovered to 0.9090, it remains just shy of the prior peak. The reported “weak” trend strength, coupled with the noticeable but relatively low volatility of 0.000047, suggests that while the upward bias exists, sharp movements in either direction are less common, but not absent, as shown by the Oct 10th drop. Given the current proximity to the 90-day high, there is a roughly even chance that the ratio could either consolidate further beneath this resistance or attempt a definitive breakout. A breakout above 0.9099 is likely to lead to continued short-term outperformance for QQQ, while a rejection at this level would likely lead to a test of lower support levels, potentially in the range of 0.9000-0.9020.
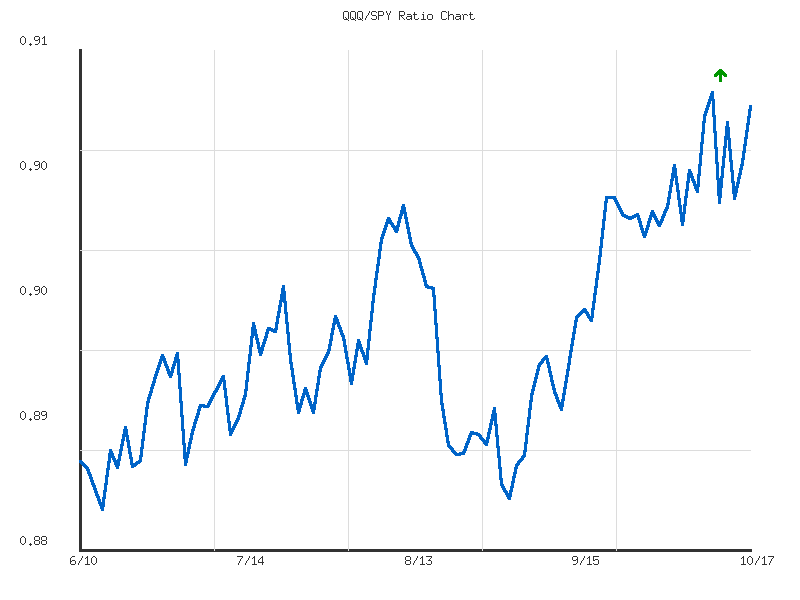
Ratio Analysis: QQQ/SPY
Generated for 90days timeframe analysis
IWM vs. SPY
Over the past 28 days, the RATIO:IWM/SPY, representing the relative performance of the Russell 2000 (small-caps) against the S&P 500 (large-caps), has exhibited a weak sideways trend. The ratio commenced near 0.3642 and concluded the period at 0.3664, yielding a marginal overall increase of approximately 0.59%. This directional ambiguity, combined with the “weak” strength attribute, indicates a persistent lack of decisive momentum for either index to establish clear relative outperformance. The oscillation within a defined range suggests a period of consolidation in market leadership, where neither small-cap nor large-cap equities are likely to assert sustained dominance based on this specific data window.
Analysis of the price action reveals several key technical levels. The ratio found a strong support zone in the vicinity of 0.3610, evidenced by the lowest observed ratio of 0.3610 on September 16th and subsequent rebounds from levels around 0.3625. On the upside, a significant resistance level emerged around 0.3763, which was the peak reached on October 15th. This high was quickly followed by a sharp retracement, indicating a rejection of higher relative valuations for small-caps at that juncture. Intermediate resistance appears to exist around the 0.3675-0.3700 region, where several attempts to advance were met with selling pressure or a loss of momentum throughout September and early October. The current ratio of 0.3664 is positioned closer to the middle of this established range, albeit slightly below the period’s average ratio of 0.3657.
Considering future price action, a neutral case is likely to persist, with the ratio continuing its range-bound behavior between the identified support at 0.3610 and resistance at 0.3763. The weak trend strength and low volatility support this scenario. A bullish case for IWM relative to SPY would develop if the ratio could decisively break and sustain above the 0.3763 resistance level, which would be an indication of small-cap outperformance gaining significant traction; this outcome carries a roughly even chance given the recent rejection from that level. Conversely, a bearish case for IWM’s relative performance would involve a breakdown below the 0.3610 support, which would make it likely that large-caps would continue to outperform small-caps with increasing conviction.
Sentiment drivers, as inferred from this technical data, suggest a lack of strong directional conviction among market participants regarding relative asset allocation. The observed low volatility within the ratio’s movements implies a period of market indecision rather than a strong consensus. The repeated failure to sustain advances above intermediate resistance levels and the swift reversal from the 0.3763 high indicate that any temporary surge in small-cap preference has been met with skepticism or profit-taking. This could reflect a likely prevailing sentiment that, while small-caps may offer pockets of opportunity, the broader market remains hesitant to shift decisively away from the established leadership of larger, potentially more stable, S&P 500 components.
As a Chartered Market Technician with over 15 years of experience, I offer the following analysis of the IWM/SPY ratio based strictly on the provided 90-day market data. This ratio serves as a valuable indicator of small-cap (IWM) relative strength against large-cap (SPY) performance, with an upward trend signifying small-cap outperformance.
Over the observed 90-day period, the IWM/SPY ratio has established a moderate upward trend, increasing by approximately 3.00% from its starting point. The ratio’s value has fluctuated between a low of 0.3457 recorded on August 1st and a high of 0.3763 on October 15th. This persistent upward trajectory suggests a period where the Russell 2000 has generally outperformed the S&P 500, indicating a prevailing bullish sentiment for small-capitalization stocks relative to their larger counterparts within this timeframe. The current ratio of 0.3664 sits notably above the 90-day average of 0.3581, reinforcing the notion of sustained relative strength.
Reviewing the more recent price action, the ratio reached its 90-day zenith on October 15th at 0.3763. Following this peak, the ratio experienced a two-day pullback, declining to the current level of 0.3664. This peak at 0.3763 now presents itself as a significant resistance level. On the downside, the 90-day average of 0.3581 is likely to act as an intermediate support, while the August 1st low of 0.3457 represents a critical, more distant support level for the current uptrend. The ratio’s current position, residing within the upper quartile of its 90-day range and well above its average, suggests that underlying relative momentum remains robust despite the recent minor retracement. The exceptionally low volatility figure provided, when contextualized against the overall moderate trend strength, implies that daily fluctuations are relatively contained, rather than indicative of erratic movements.
Considering the established moderate uptrend, a continuation of small-cap outperformance relative to large-caps is likely. The recent pullback from the October 15th high appears to be a test of prior support levels. Should the ratio find firm support above the 0.3581 average, a re-test of the 0.3763 resistance level is likely in the near term. However, a failure to find immediate support could lead to a period of consolidation, or even a deeper retracement towards the 0.352 range, which carries a roughly even chance. A sustained breach above 0.3763 would imply an acceleration of the relative strength. Conversely, a significant reversal of the observed moderate uptrend, which would be technically confirmed by a sustained break below the critical 0.3457 low, is currently unlikely given the overarching positive trend observed over the full 90-day period.
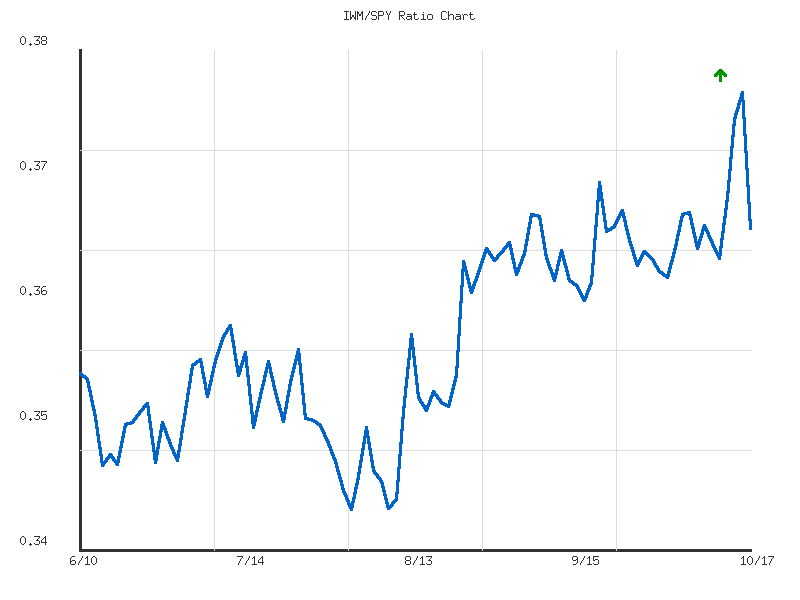
Ratio Analysis: IWM/SPY
Generated for 90days timeframe analysis
Commodities
| Symbol | Daily Percent Change |
|---|---|
| CORN | 0.689% |
| GLD | 0.413% |
| CPER | 0.260% |
| UNG | -0.084% |
| DBC | -0.271% |
| UGA | -0.292% |
| USO | -1.464% |
| SLV | -2.773% |
The provided daily percentage change data for various commodities paints a mixed, though arguably net-negative, picture across the complex. Leading the gains is CORN, showing a robust advance of 0.689%, suggesting positive momentum in the agricultural sector. Gold (GLD) and Copper (CPER) also posted modest gains of 0.413% and 0.260% respectively, indicating some underlying strength in select industrial metals and precious metals. However, the declines in other key components are notable. Silver (SLV) experienced a significant drop of -2.773%, which is the largest daily decline among the analyzed instruments, indicating substantial bearish pressure. Crude oil (USO) also saw a considerable decline of -1.464%. Natural gas (UNG), broader energy (UGA), and a general commodity basket (DBC) registered minor losses, implying a widespread, albeit less severe, weakness across these energy and diversified commodity segments. This divergence suggests a market exhibiting highly selective price action rather than a uniform trend.
Given only a single day of data, traditional support and resistance zones cannot be rigorously identified. However, the magnitude of the daily movements implies critical near-term reference points. For assets like SLV and USO, which experienced substantial declines, the prior day’s closing price could tentatively act as a resistance area should a near-term bounce attempt to materialize. Conversely, for CORN, GLD, and CPER, the prior day’s close could tentatively provide a near-term support level if profit-taking or a reversal in sentiment occurs. The extreme move in SLV, in particular, suggests that current levels may attract either significant buying interest on capitulation or sustained selling pressure if the downtrend is confirmed.
Looking at alternative scenarios, a bullish case for the near future appears to have a low probability. It would likely depend on the positive momentum in CORN, GLD, and CPER extending to other sectors, particularly a sharp reversal in SLV and USO. If agricultural and industrial demand signals strengthen, this could eventually lift broader sentiment. The bearish case appears to have a roughly even chance, primarily driven by the significant declines in SLV and USO. If this weakness propagates or intensifies across the energy and precious metals complex, it is likely to drag the broader commodity market lower. The mixed performance, with large diverging moves, suggests a neutral case is also a significant possibility, where individual commodities continue to trade based on their specific supply-demand dynamics without a cohesive directional trend for the entire complex. This could lead to range-bound trading for an aggregated commodity index (DBC).
Sentiment drivers influencing market direction in the near future are difficult to precisely ascertain solely from this technical data. However, the sharp drop in SLV, despite GLD’s modest gain, might imply a selective flight from silver, potentially due to changing perceptions of its industrial demand or safe-haven appeal, or simply aggressive profit-taking. The decline in USO suggests a reduction in bullish sentiment toward crude oil, which could be indicative of broader economic growth concerns or shifts in supply/demand expectations. Conversely, the strength in CORN and CPER could point to isolated optimism regarding agricultural harvests or specific industrial demand for copper. The overall picture, dominated by the significant pullbacks in two major commodity segments, implies an underlying cautious or risk-aoff sentiment in those specific areas, while others hold firm or make modest gains, indicating a highly segmented market outlook.
Technical Market Commentary: Divergent Trends Across Commodity ETFs
Over the past fourteen trading days, a clear divergence in technical trends has emerged across the observed commodity Exchange Traded Funds (ETFs). Precious metals generally exhibit bullish momentum, albeit with some areas of concern, while the energy complex demonstrates a robust bearish inclination. Industrial metals show signs of a potential short-term reversal, and agricultural commodities remain largely range-bound. Our analysis is based purely on price and volume action over the provided timeframe, utilizing rigorous technical principles.
In the precious metals sector, GLD (Gold ETF) has maintained a compelling uptrend throughout the period, establishing a series of higher highs and higher lows. This upward movement has frequently been supported by increasing volume, signaling conviction among buyers. However, the most recent trading day (October 17) saw GLD open significantly higher, reach a new peak near 397.28, but then close substantially lower than its open, forming a candle with a large upper wick on exceptionally high volume. This price action suggests strong supply entering the market at higher levels. While the overall uptrend remains intact, it is likely that GLD will experience some consolidation or a minor pullback from current levels before any further sustained upward progression, as profit-taking pressure appears to be building.
SLV (Silver ETF) also entered the period in an uptrend, mirroring GLD’s general direction. However, SLV’s price action exhibits more pronounced signs of rejection from resistance levels. Notably, both October 9 and October 17 displayed large bearish candles, opening strong but closing significantly lower, each on exceptionally high volume. The October 17 candle effectively erased the gains of the prior two days. This pattern, particularly the strong rejection from the 48.40-48.60 zone on two separate occasions, indicates a substantial overhead supply. Given these clear technical signals, it is likely that SLV will experience further short-term downside or prolonged consolidation. A continuation of its prior strong upward momentum without a significant correction or pause is unlikely.
The energy sector ETFs—USO (US Oil ETF), UGA (Gasoline ETF), and UNG (Natural Gas ETF)—all display convincing bearish trends. USO has consistently carved out lower highs and lower lows, reinforced by high volume on significant down days, such as October 10 and 17. Similarly, UGA has been in a well-defined downtrend, with rallies being shallow and short-lived, failing to break the established bearish structure. UNG initially saw some bullish momentum but swiftly reversed into a strong downtrend from October 7, marked by large bearish candles on high and increasing volume, particularly on October 10 and 13. For all three, further declines are highly likely, as the technical data offers no compelling evidence of an impending reversal within this timeframe.
CPER (Copper ETF) initially showed an upward trajectory but encountered significant resistance. The October 10 trading day saw a large bearish reversal candle, closing near its low on the highest volume of the period, unequivocally signaling a shift in short-term momentum. Since then, CPER has remained in a tight range, unable to reclaim its prior highs. It is likely that CPER will continue in a consolidation phase or experience modest further declines in the immediate term, with a return to a sustained uptrend above the 32.40 peak being unlikely without new bullish catalysts. CORN (Corn ETF) has remained largely range-bound between approximately 17.20 and 17.70, demonstrating an absence of strong directional conviction. Volume has been relatively subdued, and a significant breakout in either direction appears to be a roughly even chance in the near future. Lastly, DBC (Diversified Commodities ETF) transitioned from a period of mild bullishness into a confirmed downtrend following a notable bearish candle on October 10 on elevated volume. This confirms the overall weakness seen in its underlying energy components. Further downside for DBC is likely.
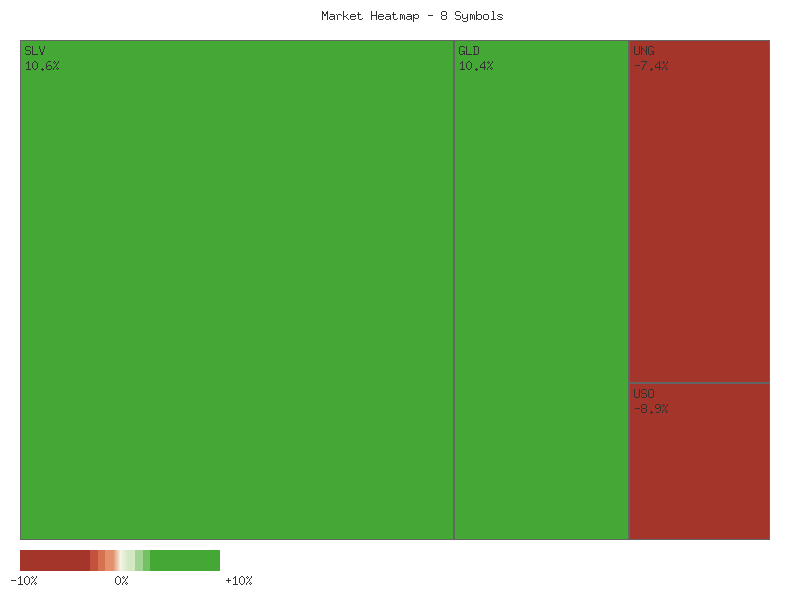
Performance Heatmap (SLV, GLD, CORN, CPER, USO, DBC, UGA, UNG)
Generated for 14days timeframe analysis
SLV Technical Analysis: Probable Near-Term Pullback After Extended Rally
The market data for SLV over the past 90 days indicates a highly probable sustained uptrend, as evidenced by a consistent series of higher highs and higher lows in the daily candle chart. This bullish price action commenced around early June and continued robustly into mid-October, driving prices from approximately to nearly . Concurrently, the 14-day Relative Strength Index (RSI) largely corroborated this upward momentum, frequently residing in overbought territory, particularly from late August onwards. The prolonged period of elevated RSI values, often above 70, signaled strong buying pressure and an extended phase of asset appreciation, suggesting a mature stage of the rally.
A more granular examination of the RSI readings reveals increasingly extreme overbought conditions in recent weeks. The RSI breached 70 multiple times in September, reaching 75.38 on September 15 and subsequently pushing even higher to 81.50 on September 29, 81.55 on October 6, and peaking at an extreme 84.32 on October 13. While SLV recorded a new price high of 48.405 on October 15, the RSI on this date did not match its earlier peak. More significantly, the RSI declined to 72.42 on October 17, following its October 13 peak of 84.32. This pattern—a higher price high (October 15) unaccompanied by a corresponding higher high in the momentum indicator—introduces a probable bearish divergence between price and the 14-day RSI. Such a divergence typically indicates that the underlying buying momentum is weakening, despite the asset’s ability to briefly achieve new price peaks, and it often presages a forthcoming price correction or consolidation.
Further support for a potential shift in the near-term outlook is observed in the recent candle and volume data. Following the aforementioned price peak of 48.405, SLV experienced a notable decline to close at 46.99 on October 17. This price depreciation occurred on exceptionally high volume, totaling 86,042,805 shares, which is among the highest recorded volumes within the 90-day period. High volume accompanying a significant price decline after an extended uptrend and overbought RSI conditions is often interpreted as a sign of distribution, where larger market participants may be exiting their positions. Therefore, the confluence of the bearish RSI divergence and strong selling volume on October 17 makes a short-term pullback or consolidation highly likely.
Considering alternative scenarios, there remains a remote chance that the recent pullback is merely a temporary pause within the broader, robust uptrend, and that SLV could quickly resume its ascent, particularly if the RSI were to rebound swiftly without deeper price concessions. However, given the sustained extreme overbought readings and the clear bearish divergence on the 14-day RSI, coupled with the significant volume on the recent down day, the balance of technical evidence strongly suggests that a period of cooling off is probable. Traders should therefore exercise caution and observe for potential support levels or further confirmation of a trend reversal, such as consecutive lower closes or a definitive break below a prior swing low, neither of which are explicitly established by the provided data up to October 17.
SLV Price & Indicators (RSI_14_DAY, MACD_13_21_DAY)
GLD has exhibited a discernible shift in its price action over the past 90 days. From early June through late July, the asset primarily traded within a broad consolidation range, fluctuating roughly between and . During this phase, price often found support near the lower end of this range, notably around the level in late June and late July, with rallies failing to sustain above . Following the late July low, GLD initiated a more persistent upward trajectory throughout August, establishing a series of higher lows and higher highs. This uptrend intensified significantly from late August into October, characterized by robust price appreciation and notably higher trading volumes. The period observed culminates in a strong acceleration, with GLD reaching its highest point in the dataset on October 17th, hitting an intraday high of .28.
The 14-day Relative Strength Index (RSI) provides valuable insights into momentum. During the initial consolidation phase from June to late July, RSI mostly oscillated within neutral territory, generally between 40 and 60. Brief dips below 45, such as the 42.25 on June 27th and 39.55 on July 30th, coincided with price testing lower boundaries, suggesting a potential for short-term buying interest at those points. As the uptrend gained traction in August, RSI consistently held above the 50-mark, confirming bullish momentum. However, the most striking feature is the sustained and extreme overbought readings from early September onwards. RSI values frequently exceeded 75, peaking at 86.11 on October 8th, and notably at 83.53 on October 17th. This prolonged period above 70 indicates a high level of buying pressure that has propelled GLD significantly higher.
The recent price action, particularly in October, shows a continuation of the strong rally but also presents some technical considerations. GLD experienced rapid appreciation, with multiple consecutive days closing higher, often on elevated volume. For instance, the days leading up to October 8th saw strong closes and surging volume, culminating in an RSI reading of 86.11, which suggests an extreme overbought condition. The price on October 9th saw a substantial pullback from a high of .22 to close at .43 on very high volume (33.5M), accompanied by a sharp dip in RSI from 86.11 to 72.86. While price subsequently recovered and pushed to new highs, the latest data point on October 17th is noteworthy. GLD printed a wide range candle, with an intraday high of .28, but closed significantly lower at .99, forming a noticeable upper wick. This occurs on the highest volume recorded in the dataset (61.8M) and with RSI still elevated at 83.53. This combination of a large upper wick, very high volume, and extreme overbought RSI values suggests that selling pressure may be increasing at these elevated price levels.
Considering the evidence, a continuation of the current aggressive upward trajectory without a period of consolidation or a pullback is unlikely. The persistent and extreme overbought readings on the RSI indicate that GLD is in an extended state, making it likely to experience profit-taking. The strong rejection from the intraday high on October 17th, marked by the large upper wick and exceptional volume, suggests that a short-term top might be forming. Therefore, a pullback to re-test prior support levels or to relieve the overbought condition is a likely scenario in the immediate future. An alternative scenario, though less likely given the current technical posture, would be a brief consolidation phase followed by another push higher, possibly after a minor RSI reset. However, the sheer momentum and extreme RSI values, coupled with the recent price rejection, make a more significant retracement a good chance. Traders would likely look for the RSI to return towards more neutral levels (e.g., below 70) and for price to consolidate or pull back to establish new support before considering renewed aggressive long positions.
GLD Price & Indicators (RSI_14_DAY, MACD_13_21_DAY)
Gold/Silver Ratio
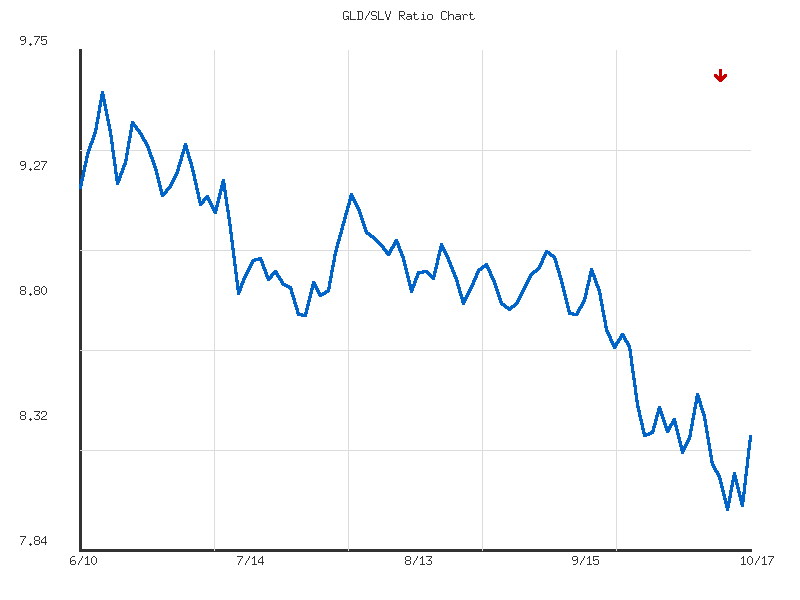
The GLD/SLV ratio has exhibited a moderate downtrend over the observed 28-day period, declining by approximately 7.87% from an initial high of 8.984 on September 9th to its most recent value of 8.278 on October 17th. This sustained move suggests that SLV (silver) has generally outperformed GLD (gold) in relative strength terms during this timeframe. The price action, characterized by a series of lower highs and lower lows for much of the period, indicates a prevailing bearish momentum in the ratio. Although there were intermittent rallies, these were largely contained within the broader downward channel, confirming the trend’s strength.
From a structural perspective, a notable resistance level was established around 8.98 in early September, with subsequent peaks near 8.91 on September 17th and 8.79 on September 16th reinforcing a declining trendline. More recently, the ratio encountered resistance around 8.44 on October 7th. On the downside, a significant support level emerged at approximately 8.00 on October 13th, representing the lowest point within the provided data. An intermediate support zone appears to be present around the 8.28-8.29 area, which saw price action consolidate between September 26th and September 29th. The current ratio of 8.278 rests precisely within this historically tested zone.
Considering a bullish scenario for the GLD/SLV ratio, the primary evidence would involve the ratio successfully holding above the 8.00 support level. The recent bounce from 8.00 to 8.278 suggests short-term buying interest or profit-taking from bearish positions. A sustained advance that breaks above the 8.44 resistance, particularly if accompanied by increasing momentum, would lend credibility to a potential trend reversal or a more significant corrective rally. A subsequent move above the 28-day average ratio of 8.481 would further bolster the bullish argument. However, based on the prevailing downtrend, such a sustained bullish reversal is currently assessed as unlikely without further confirming price action.
Conversely, the bearish case appears more likely given the established trend. A failure of the ratio to clear the 8.44 resistance, followed by a decline that breaches the 8.00 support level, would strongly reaffirm the existing downtrend. A breakdown below 8.00 would likely accelerate the downside momentum, as there are no discernible technical support levels below this point within the provided dataset. Such an outcome would reinforce the relative strength of silver over gold, suggesting further underperformance of GLD relative to SLV.
A neutral scenario, where the ratio consolidates, presents a roughly even chance in the immediate term. If the ratio were to trade within the range of 8.00 support and 8.44 resistance, it would suggest a period of indecision or accumulation/distribution. The current position at 8.278 places it near the middle of this recent range, implying a roughly even chance of testing either the lower or upper boundary in the near future. Such consolidation could lead to the formation of a new chart pattern, which would subsequently provide a clearer directional bias.
From a sentiment perspective, based purely on the technical data, the persistent decline in the GLD/SLV ratio indicates a prevailing investor preference for silver over gold throughout much of the observed period. The consistent establishment of lower highs and lower lows reflects a moderately bearish sentiment toward the ratio, suggesting participants are either selling gold relative to silver or buying silver relative to gold. The bounce from the 8.00 low on October 13th could be interpreted as temporary relief from oversold conditions or short-term counter-trend buying, yet it does not fundamentally alter the underlying moderately bearish sentiment without sustained follow-through.
As a seasoned CMT with over 15 years of experience, my analysis of the GLD/SLV ratio over the past 90 days reveals a clear and sustained technical pattern. The provided data indicates a strong downward trend in the GLD/SLV ratio, with a total decline of approximately 10.31% over the observed period. This signifies a pronounced outperformance of SLV (silver) relative to GLD (gold) during this timeframe. The ratio commenced the period near its high of 9.593 on June 13, 2025, and has since exhibited a consistent bearish bias, culminating in its lowest point for the 90-day window at 8.000 on October 13, 2025. The current ratio of 8.278 remains significantly below the period’s average of 8.870, indicating that the prevailing sentiment continues to favor silver.
The journey to the recent low was not entirely linear, yet the overall directional momentum was undeniably bearish. Notable declines were observed in early July, late July, and most recently a sharp drop through late September into early October. The robust strength of this downtrend suggests that the underlying technical pressure against the GLD/SLV ratio is considerable. Despite a stated volatility of 0.128, which provides context to price movements without external comparative data, the directional conviction of the market has been paramount. The ratio’s current relative position at 0.174 from its 90-day low indicates that it is positioned closer to the extreme bearish end of its observed range, reinforcing the long-term trend.
In the immediate term, price action around the 90-day low warrants closer inspection. After reaching the nadir of 8.000 on October 13, the ratio experienced a noticeable bounce, recovering to 8.136 the following day. While there was a slight pullback to 8.015 on October 15, the subsequent move to the current level of 8.278 on October 17 represents a more significant rebound from the absolute low. This could represent either a short-term corrective rally within the overarching downtrend or the nascent stages of a consolidation phase. Given the strength of the preceding downtrend, it is unlikely that this modest bounce signals a complete reversal without further corroborating technical evidence, such as higher highs and higher lows on a multi-day basis.
Considering these dynamics, several scenarios appear probable. It is likely that the strong downward trend in the GLD/SLV ratio will attempt to re-establish itself. Should the current bounce prove to be merely a corrective movement, it is very likely the ratio will revisit and potentially challenge the recent 90-day low of 8.000. A definitive break below this level would open the door for new lows, further extending silver’s outperformance. Conversely, there is a roughly even chance that the ratio could consolidate in the region between the recent low (8.000) and the average ratio (8.870), with the area around the average potentially acting as resistance. For a sustained reversal to be considered likely, the ratio would need to demonstrably trade and hold above its average of 8.870, a level which currently appears distant given the prevailing technical structure.
Ratio Analysis: GLD/SLV
Generated for 90days timeframe analysis
Bonds
As a Chartered Market Technician, my analysis of the provided daily percentage change data for TLT, UTHY, IEF, IEI, and SHY over the past 14 days reveals shifting dynamics across the bond yield curve. The latest available data point, October 17th, shows all symbols closing positively, with long-duration bonds TLT and UTHY leading the gains at 0.5956% and 0.5799% respectively. Intermediate-term IEF posted a gain of 0.2987%, while shorter-duration IEI and SHY recorded more modest increases of 0.1834% and 0.1145%. This immediate price action suggests a short-term bullish bias, particularly for the longer end of the curve, indicating a likely increase in demand for duration.
Reviewing the 14-day history, the price action has been characterized by notable volatility. Significant upward momentum was observed around October 10th, with TLT and UTHY experiencing substantial daily gains of 1.6147% and 1.4914%, respectively. This was preceded by notable declines on October 6th, where TLT dropped -0.7943% and UTHY -0.6821%, marking periods of strong selling pressure. These sharp swings suggest that while there is buying interest, it is not consistently sustained. The overall pattern implies a market attempting to establish a direction after periods of significant indecision and rapid price corrections.
While explicit price levels are not provided for support and resistance, we can infer zones based on the magnitude of percentage changes. The pronounced selling pressure observed on October 6th, particularly in TLT and UTHY, suggests a psychological support area was likely tested around the values that led to those percentage declines, as a rebound followed. Conversely, the strong upward surges on October 10th for TLT and UTHY, followed by subsequent smaller gains or slight pullbacks, indicate that resistance was probably encountered as these instruments approached levels corresponding to those peak percentage changes, making further immediate advancement more difficult. For instance, the approximately 1.5% to 1.6% daily gain could be considered a short-term resistance threshold for significant single-day advances.
Looking ahead, several scenarios are plausible. A bullish case appears likely if the recent positive momentum, especially in longer-duration bonds, is sustained. The outperformance of TLT and UTHY on the latest day could signal that the market anticipates lower future interest rates, drawing investors into longer-duration assets. This scenario would involve prices pushing past inferred resistance levels established by the strong gains on October 10th. Conversely, a bearish case holds a roughly even chance, given the historical volatility and periods of significant declines. If the current positive momentum fails to translate into sustained gains, particularly if short-duration bonds (SHY, IEI) begin to show stronger negative trends, it would suggest a broader market reticence towards bonds, potentially leading to further tests of the implied support levels from early October. A neutral case is also highly probable, where the market continues to oscillate within its established range of recent volatility, reflecting indecision. This would mean price action remains constrained by the peaks and troughs observed in the 14-day data, with no clear breakout or breakdown in the near term. The mixed performance and swift reversals observed make a sustained trend difficult to ascertain without further confirmation. The relative demand for duration, as indicated by the differential performance across the curve, will be a key sentiment driver to watch.
As a Chartered Market Technician with 15+ years of experience, my analysis of the provided 14-day market data for TLT, UTHY, IEF, IEI, and SHY reveals a clear and synchronized shift in technical posture across these treasury bond ETFs. The initial segment of the observed period, approximately the first nine trading days from September 29th to October 9th, was broadly characterized by price consolidation. During this phase, all five instruments traded within relatively narrow ranges or experienced a slight downward drift, accompanied by moderate, and at times declining, trading volumes. This period suggested a market in equilibrium or undergoing minor price discovery without a definitive directional bias.
However, a pivotal change in market dynamics became evident starting around October 10th. All five ETFs demonstrated a decisive upward breakout from their prior consolidation patterns, accompanied by notable increases in trading volume. TLT, representing long-duration bonds, exhibited a particularly strong bullish candle on October 10th, opening near its prior resistance and closing significantly higher with its highest trading volume of the entire 14-day dataset. This concurrent surge in price and volume for TLT suggests a strong influx of buying interest. Similarly, IEF, IEI, UTHY, and SHY—representing mid to short-duration bonds—also experienced robust bullish moves with elevated volumes on or around this date. This synchronized action across diverse durations is a compelling technical signal, indicating a likely broad-based increase in demand for fixed-income assets.
Following this initial breakout, the upward momentum in all five instruments has largely sustained through October 17th. Each ETF consistently recorded higher closes, printing higher highs and higher lows since the October 9th/10th pivot. For instance, TLT concluded the period at 91.20, marking a significant advance from its earlier consolidation lows, supported by continued healthy volume on subsequent up days. This sustained bullish price action, coupled with the prior volume confirmation, likely indicates that these treasury ETFs have established a new short-term uptrend. The current technical posture suggests that continued upward price movement is likely in the near term, provided the recently established support levels hold. Specifically, for TLT, the price area around 90.00-90.50, which previously acted as resistance, is now likely to function as a significant support level. Analogous shifts from resistance to support are observed in IEF, IEI, UTHY, and SHY.
While the prevailing technical evidence points toward a continued uptrend, it is crucial to consider alternative scenarios. A sudden and sharp reversal, characterized by large bearish candles with significantly increased selling volume, would challenge the current bullish momentum. Such price action could indicate a weakening of demand or a shift in market sentiment. A decisive break below the recently established support levels (e.g., approximately 90.00-90.50 for TLT, and comparable levels for the other ETFs) would suggest that the upward trend has a roughly even chance of stalling or reversing into either a new consolidation phase or a nascent downtrend. Conversely, should the pattern of higher closes and strong volume on upward movements continue, it would strongly reinforce the bullish thesis, making further gains highly likely. However, given the limited 14 days of data, these conclusions are restricted to the short-term horizon depicted.
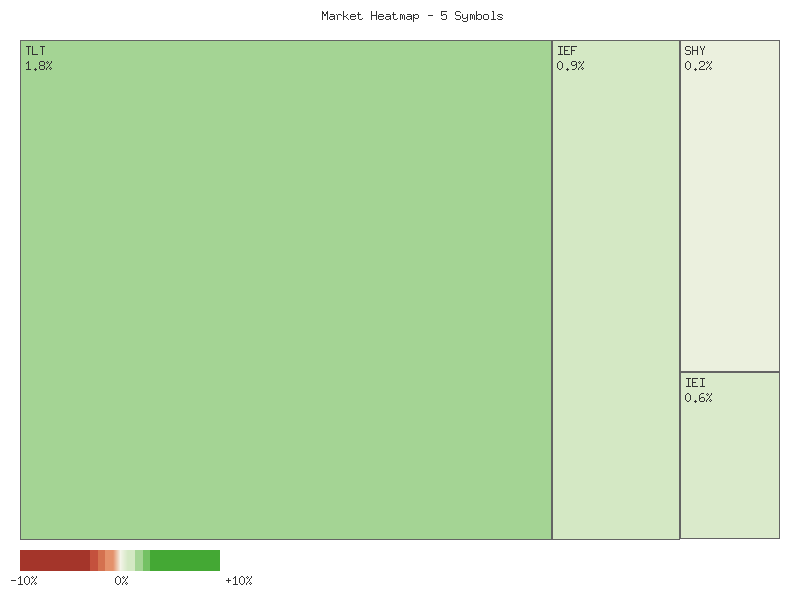
Performance Heatmap (TLT, UTHY, IEF, IEI, SHY)
Generated for 14days timeframe analysis
Magnificent 7 & Friends
Analysis of the provided 14-day daily percentage change data across the selected equities reveals a market characterized by pronounced volatility and shifting momentum, with few establishing clear directional trends. A significant number of these large-cap technology and semiconductor names, including TSLA, NVDA, AVGO, ANET, and CRWV, display highly erratic price movements, marked by substantial gains immediately followed or preceded by sharp declines. Conversely, AAPL, GOOGL, MSFT, and META exhibit relatively more constrained daily movements, suggesting a segment of the market experiencing more consolidation or less extreme speculative interest.
Specifically, the high-volatility cohort demonstrates a pattern of aggressive buying and selling. TSLA experienced multiple days with changes exceeding +/- 4%, notably a -5.10% decline followed by a 5.44% rebound, and a -5.06% dip preceding a 5.41% surge. This suggests a roughly even chance of continued significant price swings. NVDA displayed similar behavior, with a -4.88% drop followed by a 2.81% recovery, then a -4.40% decline, and subsequently a 1.88% rise. AVGO shows extreme swings, marked by a near 10% gain followed by a -3.52% pullback, suggesting strong but contested price action. ANET and CRWV also experienced large percentage moves, including an 8.30% gain for ANET and an 11.69% initial surge for CRWV, both later undergoing notable retracements, indicating persistent price discovery rather than stable trends.
In contrast, AAPL, GOOGL, MSFT, and META exhibit somewhat more tempered, though still notable, price action. AAPL, after a -3.45% decline, saw a series of four consecutive positive closes, indicating a potential near-term bullish momentum shift. GOOGL also bounced strongly after a -2.05% day, posting three consecutive positive closes. These recovery patterns suggest that short-term support levels were likely established around the points where buying volume overcame selling pressure following the declines. MSFT and META show more subdued volatility; MSFT’s recent price action is largely flat, indicating a neutral or consolidating phase, while META’s slight gains after a -3.84% drop suggest a tenuous recovery.
Considering future price action, a bullish case would entail a continuation of the recovery momentum observed in AAPL and GOOGL, with these stocks pushing higher from their implied support levels. For the more volatile names, if the sharp rebounds seen in TSLA (5.41%) and NVDA (2.81%) find sustained follow-through without immediate strong selling pressure, it is likely they could test higher resistance zones. The large positive percentage changes that reversed prior declines suggest immediate support levels for these equities formed around those turning points. Conversely, a bearish case is supported by the rapid reversals and large negative swings across many symbols. Should the recent modest gains in AAPL, GOOGL, and MSFT fail to sustain, or if the implied support levels in TSLA, NVDA, and AVGO are re-tested and break down, further downside is probable. For AMZN, its failure to sustain recent gains and a latest -1.17% close implies that resistance is likely forming above current levels, and it may continue to drift lower. A neutral case appears roughly even for the highly volatile names, implying continued oscillation within the recent 14-day trading ranges, with sentiment drivers primarily reactive to immediate price momentum rather than sustained directional conviction. This could also be the most probable near-term scenario for MSFT and META, given their recent consolidated movements.
Market Commentary: 14-Day Technical Review of Select Equities
The past 14 trading days have presented a highly varied technical landscape across these select equities, characterized by significant volatility and divergent price action rather than a uniform market direction. Several symbols experienced sharp reversals, where strong trending movements were abruptly negated by counter-trend shifts, often on elevated volume. This pattern suggests underlying uncertainty and a potential struggle for directional control in several key names. We observe a clear bifurcation, with some stocks demonstrating strong upward momentum while others show distinct bearish trends or highly indecisive, range-bound behavior following reversals.
On the bullish side, Alphabet (GOOGL) and Broadcom (AVGO) exhibit patterns indicating likely further appreciation. GOOGL’s strong rally from the 235.84 low on October 10th, closing at its 14-day high of 253.30 on October 17th with increasing volume, suggests robust upward momentum. It is highly likely that this upward trend will continue in the immediate short term, with the prior high of 254.22 acting as a near-term resistance level. Similarly, AVGO, after a significant dip on October 10th, staged a powerful recovery with heavy volume on October 13th, breaking above previous resistance. Its consolidation near the 14-day high of 359.40 on October 15th, closing at 349.33 on October 17th, makes it likely to retest or exceed its recent highs, confirming a short-term bullish bias.
Conversely, Amazon (AMZN) and Meta Platforms (META) demonstrate clear bearish tendencies. AMZN established a peak around October 9th/10th and subsequently initiated a distinct downtrend, characterized by lower highs and lower lows. The significant selling volume accompanying this decline, culminating in a close near its 14-day low of 213.04 on October 17th, makes it highly likely that AMZN will experience continued downward pressure. META also exhibits a net decline over the 14 days, though its price action has been more volatile. After an initial downtrend, a bounce occurred, but the stock remains significantly below its starting point. It is likely to continue struggling against resistance levels, indicating a prevailing bearish sentiment for this period.
The remaining symbols present more complex and volatile scenarios. NVIDIA (NVDA) and Arista Networks (ANET) both experienced strong rallies followed by sharp, high-volume reversals around October 10th, suggesting potential blow-off tops or exhaustion. While both saw some stabilization by October 17th, the preceding strong bearish engulfing patterns make it roughly even chance for either a continuation of the corrective phase or a consolidation before a reattempt at higher levels. Apple (AAPL) followed a similar pattern of initial strength, a sharp decline on October 10th, and a partial recovery. The recovery could be a dead cat bounce, making a further retest of the 244 support level likely. Microsoft (MSFT) shows a general downtrend over the 14 days, with some attempts at stabilization, but remains below initial price levels, indicating a slight bearish tilt. CrowdStrike (CRWV) and Tesla (TSLA) were notably volatile, with large daily swings and high volume. CRWV’s major reversal on October 10th suggests that upward momentum has likely stalled, while TSLA’s broad swings within a wide range make a clear directional prediction unlikely without further confirmation of breakout or breakdown. Overall, the market exhibits a lack of broad directional consensus, with individual technical patterns driving distinct outcomes within this set of securities.
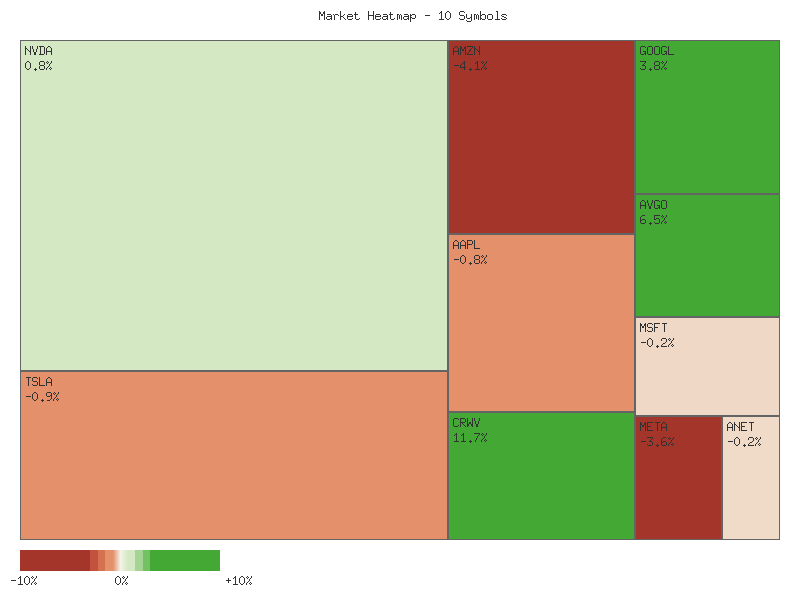
Performance Heatmap (TSLA, MSFT, AAPL, META, NVDA, AVGO, GOOGL, AMZN, CRWV, ANET)
Generated for 14days timeframe analysis
S&P 500 Sector Breadth
The market data over the past 14 trading days presents a mixed and volatile picture across the S&P 500 sectors. While several defensive sectors like Utilities (XLU) and Healthcare (XLV) have demonstrated notable cumulative advances, registering over 5% growth, certain offensive sectors such as Energy (XLE) and Financials (XLF) have experienced significant declines, dropping over 7% and 3% respectively. Technology (XLK) showed a modest cumulative gain. This divergence suggests a lack of a clear, unified market trend, with capital seemingly rotating between different segments. The price action, characterized by sharp declines around October 10th for many offensive sectors, followed by a rebound on October 13-14, points to increased volatility rather than a consistent upward or downward trajectory for the broader market represented by these sectors. It’s improbable to characterize the overarching trend as strongly bullish or bearish over this two-week period; instead, a fluctuating, range-bound environment is more likely.
Focusing on the most recent trading day, October 17, 2025, market breadth appears negative, with only 4 out of 11 observed S&P 500 sectors advancing, while 7 declined. The advancing symbols were predominantly defensive: Consumer Staples (XLP) gained 0.63%, Real Estate (XLRE) rose 0.33%, and Healthcare (XLV) advanced 0.50%. Notably, Technology (XLK), an offensive sector, also recorded a modest gain of 0.25%. Conversely, the declining symbols included a strong contingent of offensive names such as Industrials (XLI), Consumer Discretionary (XLY), Financials (XLF), Materials (XLB), Energy (XLE), and Communication Services (XLC). Interestingly, Utilities (XLU), typically a defensive sector, was the largest decliner among defensive plays on this specific day, dropping 1.43%, which presents an alternative scenario to a uniform flight to safety.
The performance on October 17 likely indicates a defensive tilt in market sentiment, with three of the four advancing sectors being defensive, while six of the seven declining sectors were offensive. This pattern suggests a probable rotation of capital out of riskier, growth-oriented sectors into more stable, defensive plays. However, the notable decline in XLU, a defensive sector, alongside the advance in XLK, an offensive sector, introduces some ambiguity, suggesting that this rotation is not entirely uniform. While a prevailing cautious sentiment is probable, the mixed performance among defensive sectors (XLU decline) and offensive sectors (XLK advance) suggests that a definitive bullish or bearish sentiment for the overall market on this specific day is less certain, though a risk-averse posture is arguably more probable among the majority of participants.
The daily percent changes for the sectors on 2025-10-17, sorted in descending order, are as follows:
| Symbol | Daily Percent Change |
|---|---|
| XLP | 0.631% |
| XLV | 0.498% |
| XLRE | 0.334% |
| XLK | 0.250% |
| XLY | -0.115% |
| XLE | -0.394% |
| XLC | -0.399% |
| XLI | -0.570% |
| XLB | -0.936% |
| XLU | -1.432% |
| XLF | -1.991% |
As a Chartered Market Technician with over 15 years of experience, my analysis of the provided 14-day market data across eleven sector ETFs reveals a bifurcated market sentiment, characterized by a distinct divergence in performance and a notable shift following a mid-period, high-volume selling event. The overall technical landscape suggests a market grappling with uncertain momentum, where defensive positioning appears to be favored.
Cyclical sectors, including Financials (XLF), Materials (XLB), Energy (XLE), Industrials (XLI), Consumer Discretionary (XLY), and Technology (XLK), demonstrated significant technical weakness around the October 10th timeframe. Each of these sectors experienced sharp, high-volume price declines, indicating strong selling pressure. For example, XLF saw its highest volume day on October 10th coinciding with a substantial price drop, and despite a subsequent bounce, it closed on October 17th near its recent lows. Similarly, XLI also experienced a significant volume surge during its descent, with its recovery attempts being modest. While some sectors like XLK showed a more vigorous rebound from its October 10th low, its final close on October 17th still sits well below its pre-decline highs. Based on these patterns, a continued struggle for these cyclical sectors to sustain upward momentum and overcome identified resistance levels is likely, with a retest of their respective October 10th lows being a roughly even chance scenario if current recovery attempts fail to gain traction.
In stark contrast, defensive sectors have exhibited remarkable resilience and, in some cases, outright strength. Utilities (XLU) and Consumer Staples (XLP) have shown consistent upward trends throughout the 14-day period, characterized by a series of higher highs and higher lows. XLU, for instance, steadily climbed from approximately .06 to .57, closing strong on multiple days. XLP also demonstrated robust demand, culminating in a strong close at .73 on October 17th, marking a clear uptrend despite broad market volatility. Real Estate (XLRE), after an initial dip, staged a decisive reversal, recovering most of its losses and closing strong at .04. This sustained outperformance, coupled with generally solid volume during upward movements, indicates that a continuation of this relative strength and potential leadership from XLU and XLP is highly likely. For XLRE, a short-term continuation of its recovery is likely, although it still needs to prove it can overcome potential resistance from its early October highs.
The technical patterns suggest that the high-volume sell-off around October 10th served as a pivotal point, reinforcing a defensive bias within the market. Key resistance levels for the weaker cyclical sectors are positioned at their recent bounce highs (e.g., XLF around .70, XLI around .60). Failure to breach these levels makes a renewed downward pressure towards the October 10th lows likely. Conversely, the established uptrends in XLU and XLP are indicative of strong underlying demand. The broad technical setup suggests that a continuation of this bifurcated market, with defensive sectors outperforming, is likely in the immediate term. However, an alternative scenario of a more synchronized market recovery, where cyclical sectors manage to decisively break above their short-term resistance levels supported by sustained buying volume, remains a roughly even chance if market sentiment broadly improves in the coming trading sessions.
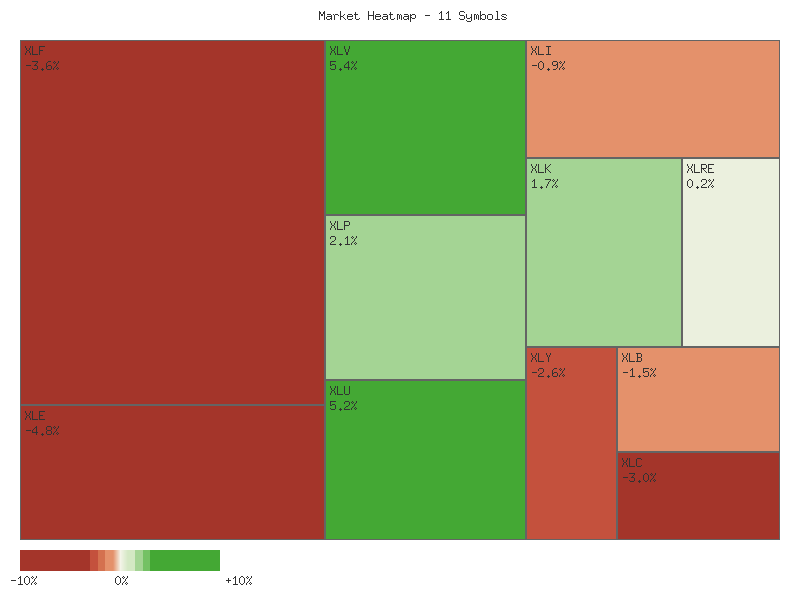
Performance Heatmap (XLP, XLRE, XLI, XLU, XLV, XLY, XLF, XLB, XLE, XLC, XLK)
Generated for 14days timeframe analysis
XLY vs XLP
The XLY/XLP relative strength ratio has exhibited a discernable downward trend over the observed 14-day period, declining by approximately 4.61% from its initial value of 3.0823 on September 29, 2025, to 2.9401 by October 17, 2025. This moderate directional shift indicates a period where the Consumer Discretionary sector (XLY) has been underperforming the Consumer Staples sector (XLP) on a relative basis. Such a trend typically suggests a rotation away from growth-oriented and economically sensitive sectors towards more defensive, stable areas of the market, reflecting a shift in investor preference as observed within this specific timeframe.
Analyzing the price action more closely, the ratio peaked early in the period at 3.0970 on October 6, 2025, before initiating a more pronounced descent. A significant dip occurred on October 10, 2025, establishing the 14-day low at 2.9289. Following this low, the ratio experienced a brief, modest recovery to 3.0043 on October 13, 2025. However, this recovery proved short-lived, with the ratio subsequently resuming its decline into the period’s close. The current ratio of 2.9401 resides very near the lower bound of its 14-day range, specifically at the 6.68% percentile relative to its observed high and low, suggesting that the recent relative weakness persists as of the last data point.
Given the established “moderate” downward trend and the current positioning near the 14-day low, a continuation of relative underperformance by XLY compared to XLP is likely in the immediate term, based solely on this short-term data. The relatively low volatility (0.00288) suggests a somewhat orderly decline rather than sharp, erratic movements, which further supports the persistence of the current trajectory. However, it is also important to consider alternative scenarios. While a reversal of this trend without additional confirming price action is unlikely, there is a roughly even chance that the ratio could consolidate around current levels before providing a clearer directional signal. Sustained moves below the recent low of 2.9289 would reinforce the bearish relative strength narrative.
As a seasoned CMT, my analysis of the provided XLY/XLP ratio data for the 90-day period concluding on October 17, 2025, is strictly confined to the technical information presented. The dataset reveals a distinct and robust uptrend in the ratio of the Consumer Discretionary sector (XLY) relative to the Consumer Staples sector (XLP). The provided trend object explicitly highlights an “up” direction with “strong” strength, reflecting an 11.07% appreciation in the ratio over the observation window. This performance is significant, indicating consistent outperformance of XLY over XLP throughout the period. The ratio commenced near 2.647 on June 10th, reaching a peak of 3.097 on October 6th, and currently stands at 2.940. This trajectory suggests an environment where market participants have favored growth-oriented sectors over defensive ones.
Examining the price action within this 90-day window, several phases are discernible. From early June through mid-July, the ratio exhibited a gradual ascent, largely oscillating between 2.60 and 2.75, with temporary pullbacks providing opportunities for trend reconfirmation. A more pronounced acceleration in the uptrend became evident from late August through mid-September, propelling the ratio above the 2.90 psychological level and subsequently past 3.00. This period of accelerated upward momentum points to increasing conviction in the relative strength of the Consumer Discretionary sector. The average_ratio for the period is 2.828, with the current ratio of 2.940 remaining comfortably above this mean, reinforcing the ongoing bullish posture.
However, recent activity in the ratio suggests a short-term corrective phase. Following its peak at 3.097 on October 6th, the ratio experienced a noticeable pullback, declining to 2.928 by October 10th. While there was a minor rebound, the ratio closed at 2.940 on October 17th. This movement indicates that the rally might have encountered temporary resistance at the recent high, prompting some profit-taking or a rebalancing of positions. The relative_position of 0.6795 suggests that, despite the recent correction, the ratio still resides in the upper third of its 90-day trading range, implying that the overarching bullish sentiment has not been entirely eroded. The volatility of 0.0218 suggests relatively contained, albeit persistent, price movements.
Looking ahead, a continuation of the established uptrend is likely, given the “strong” trend strength identified over the 90-day period. The recent pullback could be interpreted as a healthy consolidation within an ongoing bullish channel, potentially allowing the ratio to re-energize before attempting to challenge the October 6th high of 3.097 again. However, there is a roughly even chance of further near-term consolidation or a deeper correction if the momentum from the peak continues to wane. A significant technical support level appears to reside in the 2.90-2.92 vicinity, based on the October 10th low and prior price action in early September. A decisive break below this level would increase the probability of a test of the average ratio of 2.828, which would warrant close monitoring for a potential shift in the short-term directional bias.
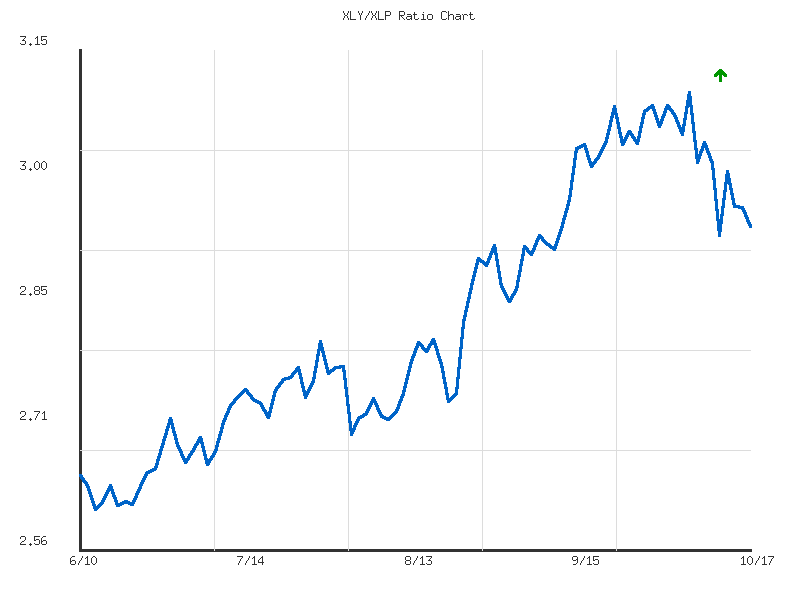
Ratio Analysis: XLY/XLP
Generated for 90days timeframe analysis
Equity Breadth
The data for SPXA50R, representing the percentage of S&P 500 members trading above their 50-day moving average, began the observed 14-day period near 58%. It briefly peaked at 59.28% on September 30th before experiencing a pronounced and rapid decline. From 55.29% on October 8th, the indicator sharply fell to a low of 33.73% by October 10th. This precipitous drop indicates a significant and broad-based deterioration in short-term momentum across a large portion of the S&P 500 constituents. Following this severe contraction, SPXA50R mounted a partial recovery, reaching 48.10% by October 14th and 15th, before dipping to 44.71% by October 17th. This suggests that despite the rebound, less than half of the S&P 500 members are currently maintaining their short-term uptrends.
Concurrently, the SPXA200R, which tracks the percentage of S&P 500 members above their 200-day moving average, also showed a weakening trend. It started the period near 62.48% and peaked at 63.67% on October 3rd, indicating robust longer-term underlying strength initially. However, mirroring the SPXA50R’s movement, this indicator also experienced a significant drop, falling from 60.88% on October 8th to 50.30% by October 10th. This synchronized movement suggests that the mid-period weakness was not confined to short-term trends but also began to erode the longer-term market structure, impacting the percentage of stocks in established uptrends. A subsequent recovery saw the SPXA200R rise to 57.68% by October 14th and 15th, before settling at 55.29% on October 17th.
The overall story told by this price action in breadth indicators is one of a market that experienced a sharp and broad-based internal correction during the initial half of the observed 14-day period. The initial stability in both indicators around the 60% mark suggested fairly broad underlying strength. The subsequent, abrupt decline in both, especially the SPXA50R falling below 50%, indicates a decisive shift towards short-term bearish sentiment for a majority of stocks. The observed trend for the SPXA50R is currently downward biased, with a partial recovery failing to regain the 50% threshold. The SPXA200R’s trend also demonstrates a weakening from its earlier robust state, although it maintains a majority above its 200-day moving average.
The SPXA50R’s latest reading below 50% makes it unlikely that broad short-term strength has been re-established. Conversely, the SPXA200R, while having fallen, remains above 50%, making it likely that a majority of constituents still maintain a longer-term uptrend, albeit with a reduced margin. Considering alternative scenarios, there is a roughly even chance that the market is currently in a phase of consolidation following the recent volatility, attempting to establish a new equilibrium. Given the recent dip after the recovery in both metrics, it is slightly more likely that the market’s internal health could experience further near-term pressure, potentially signaling a re-engagement of the mid-period bearish momentum if the SPXA200R were to sustain a break below 50%. Conversely, a sustained push back above 50% for the SPXA50R, alongside a rally in the SPXA200R, would be required to suggest a renewed broad-based bullish impetus.
SPY 180 Days
The SPY experienced a significant shift in trend over the past 180 days. From late January into late February, the price maintained an upward trajectory, with the EMA_50 consistently above the EMA_200, signaling a robust bullish trend. The RSI generally remained in bullish territory, mostly above 50. However, a sharp and considerable decline materialized from late February through early April, characterized by significantly elevated selling volume. During this period, the EMA_50 decisively crossed below the EMA_200, forming a “Death Cross,” which is a reliable bearish indicator. The RSI plummeted into oversold conditions, dipping below 30, underscoring the intense selling pressure. Subsequently, the market initiated a strong recovery from mid-April, leading to a “Golden Cross” as the EMA_50 recaptured a position above the EMA_200, confirming a renewed bullish trend that largely persisted into early October.
The market currently appears to be navigating a key area. Historically, the SPY found support around the 550-560 range in mid-March following its sharp decline, and a significant zone of consolidation and support emerged around 620-630 post-July, where the price interacted with both EMAs. Resistance levels were notably present around 610-612 in late February and then near the 630-638 range during the late July peak before the recent push higher. The most recent price action indicates strong resistance near the 670 level, tested multiple times in early October. The sharp sell-off on October 10th encountered immediate support around 653, an area that could now serve as an immediate, albeit minor, support level.
For a bullish scenario to unfold, it is likely that SPY would need to decisively break and hold above the 670 resistance level, preferably on increasing volume. Such a move would reinforce the prevailing bullish trend indicated by the Golden Cross and the price maintaining above both key EMAs. The RSI, currently recovering from a dip, would also need to demonstrate sustained strength above the 60 level. A confirmed breakout could project further upside, with a moderate probability of establishing new highs in the near-term.
Conversely, a bearish case would gain traction if SPY fails to surmount the 670 resistance and subsequently breaks below the immediate support at 653. A decisive close below the EMA_50 would elevate the probability of further downside, potentially retesting the 620-630 support zone. The sharp, high-volume decline on October 10th, although followed by a rebound, suggests underlying selling pressure could reappear. A breakdown below the EMA_200, which currently sits considerably lower, would likely signal a more significant trend reversal, with a high probability if accompanied by increasing bearish volume and RSI falling below 40.
A neutral scenario, where the market consolidates, has a roughly even chance in the immediate future. Price action oscillating between the 650-670 range, with the EMA_50 flattening its ascent, would support this view. The recent rebound from the October 10th dip shows buying interest, but the overall volume profile since July’s high has not been overwhelmingly convincing during rallies compared to some selling spikes. If the RSI continues to hover in the 40-60 range without a clear break, it would further reinforce a short-term period of range-bound trading. The high volume observed during previous sharp declines and rallies implies that investor sentiment remains reactive, susceptible to sudden shifts based on technical triggers, making sustained conviction for either direction somewhat uncertain without a clear breakout or breakdown.
Technical Analysis of SPY (180-Day View)
SPY’s price action over the past 180 days exhibits distinct phases, transitioning from a notable downturn to a strong upward trend, culminating in recent increased volatility. Initial price stability in late January 2025 around the - range was followed by a significant decline throughout February and early March, culminating in a sharp capitulation event in early April, driving SPY to lows around -. This period was characterized by substantial selling pressure and increased volume, especially on down days. Following this low, SPY initiated a robust recovery, establishing a clear uptrend from April through late September, consistently printing higher highs and higher lows. This bullish phase saw the index climb to new highs, peaking around in early October, demonstrating sustained buying interest.
The 14-day Relative Strength Index (RSI) largely corroborated these price movements. During the sharp decline in late February through early April, the RSI frequently dipped into oversold territory (below 30, reaching as low as 21.47 on April 8th), indicating significant bearish momentum and capitulation, consistent with the price bottoming process. The strong rebound on April 9th, where price surged and RSI jumped to 47.75, provided an early signal of renewed upward momentum. As the market entered its prolonged uptrend from May to September, the RSI consistently maintained levels above 50, frequently pushing into overbought conditions (above 70, such as 74.51 on July 3rd and 75.58 on July 25th, and a peak of 73.70 on September 22nd). This pattern suggests that the buying pressure during this period was strong and sustained, reflecting robust bullish sentiment.
More recently, SPY experienced a significant price reversal on October 10th, marked by a sharp decline from .16 to .02, accompanied by a considerable increase in volume (156.6 million shares). This abrupt move led to a steep drop in the 14-day RSI from a strong 65.75 to a neutral 41.81. This sudden shift in momentum suggests a likely short-term exhaustion of buying pressure and a re-engagement of sellers. While the subsequent trading days have seen a partial price recovery and the RSI has climbed back to approximately 53.25, it remains firmly in neutral territory. This indicates that the robust bullish momentum observed prior to October 10th has been significantly diminished.
Considering the recent price action and RSI behavior, it is roughly even chance that SPY will continue to consolidate or experience further downward pressure in the immediate term. The rapid decline in RSI from previously overbought levels points to a loss of conviction among buyers at higher price points. An alternative scenario, where SPY resumes its prior uptrend, would likely require a sustained move back above the level with increasing volume and the RSI re-entering overbought territory. Conversely, a break below the recent low established on October 10th at .02 would likely signal a more significant correction and could lead to a test of lower support levels. It is important to note that analysis involving the MACD (13, 21-day) could not be performed as the necessary indicator data was not provided.