Daily Market Technical Analysis
The market exhibits diverging trends, with large-cap indices like QQQ showing resilience and bullish reversals, while small and mid-cap indices (IWM, IJR, MDY) face significant weakness; continued downtrends here are highly probable. The broader S&P 500 (SPY) maintains a long-term bullish trend but recent high-volume selling likely indicates a short-term shift to bearish or consolidative dynamics. Market breadth reveals a rotation into defensive sectors, with continued downward pressure highly likely for several offensive sectors. The VIX remains elevated, but a short-term retracement is likely after recent intraday rejection. In commodities, GLD is overbought, making consolidation or a pullback a roughly even chance, while SLV’s bearish reversal suggests a likely corrective phase. The IWM/SPY ratio’s upward trend is likely to continue, favoring small-cap outperformance, but the GLD/SLV ratio is likely to decline, favoring silver over gold.
Market Indices
Based on the provided daily percent change data for the selected ETFs, the market exhibited a mixed performance with a discernible bias toward declines across several key segments. The following matrix illustrates the performance for the most recent day:
| Symbol | Daily Percent Change |
|---|---|
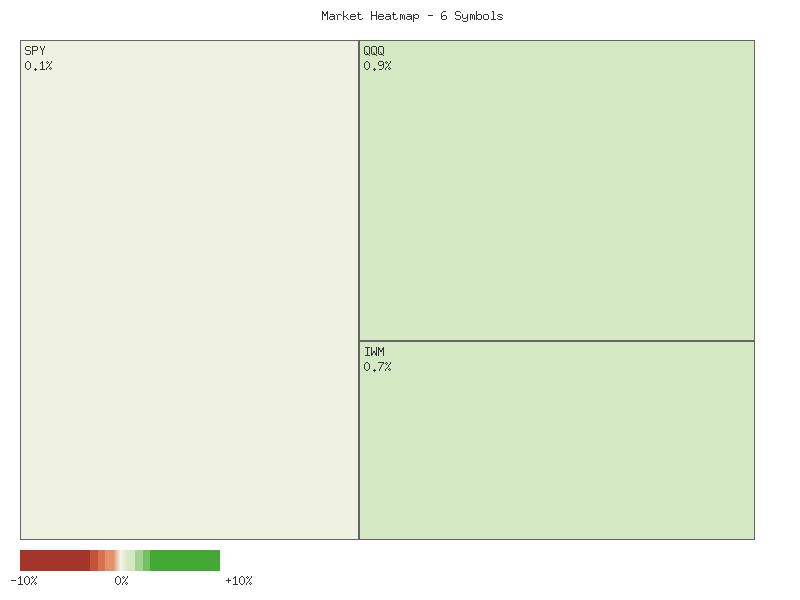
| QQQ | 0.284% |
| OEF | 0.060% |
| SPY | -0.117% |
| MDY | -1.019% |
| IJR | -1.475% |
| IWM | -2.764% |
Examining market breadth, we observe that two out of the six symbols, QQQ and OEF, posted positive daily gains, while four symbols, SPY, MDY, IJR, and IWM, experienced declines. This indicates a declining-to-advancing ratio of 2:1 for this specific set of ETFs. Such a breadth profile suggests that market participation on the upside was relatively narrow, with only roughly a one-third portion of these representative indices advancing. Conversely, a majority faced downward pressure. This limited breadth provides an indication that the overall underlying strength supporting a broad market advance is likely constrained, suggesting potential headwinds for sustained upward momentum.
The divergence in performance is noteworthy. QQQ, representing large-cap growth, registered the strongest gain at 0.284%, closely followed by OEF, tracking the S&P 100, with a modest 0.060% advance. Conversely, the smaller capitalization indices bore the brunt of the selling pressure. IWM, tracking the Russell 2000 (small-cap), declined by a substantial -2.764%, making it the weakest performer. IJR, representing S&P SmallCap 600, also fell significantly by -1.475%, while MDY, the S&P MidCap 400, dropped -1.019%. Even the broad market SPY, tracking the S&P 500, ended slightly negative at -0.117%.
The disparity strongly suggests a preference for larger capitalization segments, particularly those represented by QQQ, while smaller and mid-cap segments face pronounced selling. This pattern of diverging performance, where fewer names or specific market segments show strength while the broader market breadth is weak, often precedes or accompanies periods of market consolidation or distribution. It is likely that the observed market action reflects a rotation of capital, or perhaps a cautious retreat from riskier, smaller-cap assets. The probability of sustained broad-market rallies in the near term is roughly even under these conditions, given the conflicting signals of select large-cap resilience versus significant small-cap weakness. A continuation of this trend would likely indicate further pressure on broader market indices if the leadership fails to expand beyond a select few.
Market Commentary: Technical Analysis of Recent ETF Activity
Our analysis of the provided two-day candle data for selected ETFs reveals a bifurcated market sentiment, with notable divergence between large-cap and small/mid-cap segments. The broad market benchmark, SPY, exhibited two consecutive bearish closes, indicating sustained selling pressure. Specifically, SPY opened lower on the second day (October 17th) than the first day’s close (October 15th), experienced an intraday rally that failed to reclaim the prior day’s opening price, and ultimately closed marginally lower again. The accompanying increase in volume on the second day for SPY suggests that selling conviction may be strengthening, making a continuation of this bearish price action over the immediate term likely. We judge that the bears retain control in SPY, at least for the very near future.
The small and mid-cap segments, represented by IWM (Russell 2000), IJR (S&P SmallCap 600), and MDY (S&P MidCap 400), presented a distinctly bearish picture. All three experienced significant gap-downs on October 17th, opening well below their respective closing prices of October 15th. Furthermore, all three closed significantly lower on October 17th, often near their daily lows, reinforcing the downside momentum. The increase in trading volume for IWM, IJR, and MDY on the day of the sharp decline strongly suggests that selling pressure intensified and was met with conviction. This pattern of gap-downs followed by lower closes on increased volume is a robust technical signal, making a continuation of the downtrend in these market capitalization tiers highly probable in the immediate future.
Conversely, the technology-heavy Nasdaq 100 ETF (QQQ) and the S&P 100 ETF (OEF) displayed a more resilient, even potentially bullish, short-term outlook. QQQ, after an initial bearish close on October 15th, opened lower on October 17th but mounted a significant intraday rally to close above the prior day’s closing price, accompanied by increased volume. This price action, specifically a low opening followed by a strong close higher than the previous day’s close, constitutes a bullish reversal pattern, suggesting that a short-term bounce or upward correction is likely for QQQ. Similarly, OEF, following a bearish candle on October 15th, opened with a gap down on October 17th but managed to close marginally above its prior day’s close. Although OEF’s reversal occurred on slightly decreased volume, which somewhat tempers the conviction, it still indicates a potential for an immediate-term upward move, though with less certainty than QQQ.
Considering the entirety of the provided data, the market appears to be in a state of divergence. While large-cap technology and the S&P 100 show signs of a potential short-term recovery, the broad market (SPY) and particularly the small and mid-cap segments are exhibiting significant weakness and bearish continuation patterns. The pronounced selling pressure and gap downs observed in IWM, IJR, and MDY suggest that market breadth is likely deteriorating. Given this divergence, we assess that while QQQ and OEF have a roughly even chance of continuing their short-term upward momentum, the broader market, as indicated by SPY and corroborated by the small/mid-cap weakness, is more likely to experience continued downside pressure. Traders should observe whether the resilience in tech can offset the significant weakness in the broader market in subsequent trading sessions.
Performance Heatmap (SPY, QQQ, IWM, IJR, MDY, OEF)
Generated for 2days timeframe analysis
Technical Analysis of SPY (June 10, 2025 - October 17, 2025)
The SPY ETF has experienced a generally ascending trend over the past 90 days, punctuated by two notable high-volume pullbacks. From mid-June through late July, SPY demonstrated a robust uptrend, climbing from the low 590s to peak around -. This advance saw the 14-day Relative Strength Index (RSI) frequently venture into overbought territory (above 70), confirming strong buying momentum. This bullish phase culminated in a sharp, high-volume decline on July 31st and August 1st, where the price dropped from approximately to , with trading volumes surging to over 100 million shares and peaking at 140 million on August 1st. This significant volume on the decline strongly suggested a shift in short-term sentiment and the introduction of substantial selling pressure.
Following the early August correction, SPY embarked on another recovery phase, systematically regaining lost ground and establishing new all-time highs. This rally extended from early August to early October, pushing prices above and eventually reaching an apex around by October 8th. The RSI mirrored this ascent, again moving into overbought conditions (above 70) during mid-September, indicative of sustained upward momentum. Volume during much of this recovery period was moderate, with occasional spikes correlating with upward price movements, but generally lower than the peak selling volume observed on August 1st. The consistent establishment of higher highs and higher lows throughout this period points to a well-defined bullish trend that was in place until the most recent data points.
The most recent price action, however, presents a significant short-term shift. After reaching its high around on October 8th, SPY experienced a sharp, high-volume sell-off on October 10th, dropping approximately 3% from .16 to .02. This decline was accompanied by the highest volume recorded in the entire 90-day period (over 156 million shares), which strongly suggests a capitulation event or a sudden influx of aggressive selling. The 14-day RSI plunged from ~65 to ~41, moving from neutral to the brink of oversold conditions, confirming the intensity of the selling pressure. This specific candlestick pattern and volume profile are highly likely indicative of a significant resistance level being established around , and a shift in short-term market dynamics from bullish to potentially bearish or consolidative.
In the immediate term, SPY has shown a modest bounce from the October 10th lows, trading in the - range through October 17th. This recovery has occurred on slightly reduced volume compared to the major sell-off, and the RSI has recovered to approximately 53.25, indicating a return to neutral momentum. While this bounce suggests some buying interest at lower levels, it is unlikely to signal a strong resumption of the prior uptrend without a more decisive push higher on increasing volume. It is highly likely that the - price zone, which acted as a support area before the October 10th plunge, will now function as a significant resistance level. A retest of the support level is likely if SPY fails to decisively clear this overhead resistance in the coming sessions. The absence of MACD data in the provided information precludes an assessment of trend strength and potential crossovers from that indicator, thereby limiting the scope of this momentum analysis. Therefore, our conclusions are based exclusively on price action, volume, and RSI indicators.
SPY Price & Indicators (RSI_14_DAY, MACD_13_21_DAY)
Technical Analysis of QQQ (90-Day View)
Over the analyzed 90-day period, QQQ has largely been characterized by a robust upward trend, consistently establishing higher highs and higher lows through late September. Price action exhibited strong bullish momentum, particularly evident from late June through July and again in September. The 14-day Relative Strength Index (RSI) frequently ventured into overbought territory (above 70), notably in late June, most of July, and again in mid-to-late September. These instances, while signaling strong buying pressure, did not generally lead to significant, sustained pullbacks, but rather brief consolidations or minor retracements before the uptrend resumed, suggesting an underlying resilience and persistent demand for the asset.
The bullish momentum peaked in early October, with QQQ reaching new highs above the level. The RSI also reflected these extreme conditions, hovering above 70 on several days leading up to October 9th. This prolonged period of overbought readings, especially as price continued to climb, could have indicated an increasing likelihood of trend exhaustion. Typically, such persistent overbought conditions without significant price correction can precede a more substantial reversal or a prolonged period of consolidation.
A pivotal shift in market dynamics appears to have occurred on October 10th. On this day, QQQ experienced a significant single-day decline from an open near .40 to a close of .50. This sharp downward move, encompassing a loss of approximately 3.6%, was accompanied by extraordinarily high trading volume, exceeding 94 million shares, which is notably higher than the average volume observed throughout the preceding 90 days. This high-volume capitulation suggests a strong surge in selling pressure, which is often interpreted as a more credible signal for a potential trend reversal than low-volume pullbacks. Concurrently, the 14-day RSI plunged from nearly 70 to approximately 45, confirming a decisive loss of bullish momentum.
In the aftermath of the October 10th event, QQQ has attempted to recover some ground, but its rallies appear to be struggling. While there have been some minor bounces, the price has failed to decisively reclaim the previous highs set on October 9th or even the - range. The 14-day RSI has subsequently remained in the mid-50s, indicating a more neutral to slightly bearish short-term momentum environment. Based on the price action and RSI, a direct continuation of the strong prior uptrend without further consolidation or correction is now unlikely. It is plausible that QQQ may enter a period of sideways consolidation as the market digests the recent sharp decline. Alternatively, a further test of support levels, potentially in the - range (which acted as resistance/support in August and early September), is also a reasonable possibility if the current attempts at recovery prove unsustainable. No MACD data was provided, therefore this indicator could not be factored into the analysis.
QQQ Price & Indicators (RSI_14_DAY, MACD_13_21_DAY)
IWM Technical Analysis: October 17, 2025
Over the past 90 days, IWM has displayed a clear upward trend, with higher highs and higher lows. However, recent trading sessions show increased volatility and potential short-term weakness. After peaking near 252 on October 15th, IWM declined significantly on October 17th. Both the 14-day Relative Strength Index (RSI) and the MACD (13,21) line reinforce this downturn, collectively indicating weakened bullish momentum and suggesting a more cautious near-term outlook for the index.
IWM’s price began its ascent from 208-210 in mid-June, reaching a high of approximately 252.77 on October 15th. Support zones are identified near 214-215 from early August and around 237-238, where a strong bounce occurred on October 13th. Immediate resistance is observed near the 250-253 area. The significant price drop on October 10th (from approximately 245 to 237) had exceptionally high volume (nearly 70 million shares), indicating strong selling pressure. A subsequent robust rebound on substantial volume was curtailed by another notable decline on October 17th, also with elevated volume (over 55 million shares). This pattern of high-volume reversals at critical price points is likely to foster continued volatility.
The 14-day RSI consistently reflected price movements. Overbought conditions (above 70) on July 3rd (71.57) and September 18th (71.23) preceded pullbacks, suggesting temporary exhaustion. RSI dipped to 41.36 on August 1st before a strong rally. More recently, RSI fell sharply from 68.07 on October 6th to 44.97 on October 10th, recovered to 62.99 by October 15th, but then retreated to 51.87 on October 17th. This latest reading, while not oversold, signifies clear dissipation of short-term bullish momentum. The MACD (13,21) line further supports this. A bearish zero-line crossover occurred on October 10th, aligning with the sharp price drop. Although a brief bullish zero-line crossover followed on October 14th, the latest data for October 17th shows another bearish zero-line crossover. These rapid successive MACD zero-line crossovers, especially the most recent to the downside, make a continuation of downward pressure likely.
Considering the recent technical signals, a continuation of short-term price weakness for IWM is highly likely. The bearish zero-line crossover in MACD, coupled with declining RSI and significant volume accompanying recent price drops, strongly points to sustained selling pressure. The immediate support level to monitor is around 237-238; a breach of this level would likely accelerate the downtrend, with subsequent support residing near 214-215. An alternative scenario involves IWM finding strong support at current levels and initiating a robust rebound, ideally surpassing the 247-248 region. However, given the current bearish shifts in momentum indicators and high-volume selling, this upside scenario appears unlikely without a significant change in market dynamics. While the overarching 90-day trend has been positive, the near-term technical picture suggests increased downside risk.
IWM Price & Indicators (RSI_14_DAY, MACD_13_21_DAY)
VIX Fear Index
The VIX experienced a significant shift in its technical posture over the past seven trading days, transitioning from a period of relative stability to elevated volatility. The period began with the VIX trading in a tight range, notably below 17 on October 8th and 9th. However, a material change occurred on October 10th, characterized by a substantial bullish candle opening at 16.36 and closing at 21.66. This strong upward price action, breaking above prior consolidation levels, indicated an abrupt increase in market uncertainty, establishing a new, higher volatility regime.
Following this initial surge, the VIX consolidated within a higher range between October 13th and 15th. During this period, the index saw highs near 20.77 and 22.94, with closes generally above 19, specifically at 19.03, 20.81, and 20.64. While there were intraday pullbacks from opening prices on October 13th and 14th, the VIX managed to maintain its elevated levels, suggesting persistent underlying market apprehension. This consolidation phase, after a sharp upward move, indicates a potential digestion of the recent volatility spike.
The most recent trading session on October 17th presents a critical technical signal. The VIX opened dramatically higher at 28.41, subsequently reaching an intraday high of 28.99. However, it experienced a significant rejection from these extreme levels, closing at 20.78. This price action formed a candlestick with a very long upper shadow, which is often interpreted as a bearish reversal pattern, particularly when it occurs after a sharp increase or at a new high. Despite the daily percentage change being a positive 0.67% (from the prior day’s close of 20.64 to 20.78), the substantial gap up followed by a sharp sell-off from the high of the day suggests that buying pressure at these elevated levels was ultimately overwhelmed by selling interest.
Considering the pronounced rejection from the intraday highs on October 17th, it is likely that the VIX will experience some retracement or further consolidation in the near term. The long upper shadow candle strongly implies exhaustion of upward momentum at the 28-29 level. There is a roughly even chance that the VIX could retest the 19-20 support zone established during the October 13-15 consolidation. A sustained move above the 28.99 high, representing continued extreme market fear, appears unlikely in the immediate sessions given the significant intraday reversal witnessed. Traders should monitor the VIX’s ability to hold above the 19.00 level; a break below this could signal a more pronounced reduction in market anxiety.
VIX Technical Analysis: Elevated Volatility with Price Rejection
The VIX has exhibited a generally volatile yet predominantly range-bound behavior over the observed 90-day period, largely fluctuating between approximately 14.00 and 22.00. Initially, the index experienced a notable surge in mid-June, climbing from the 17-handle to intra-day highs near 22.51 before retreating into the mid-to-lower teens. This pattern of brief, sharp spikes followed by retracements was observed again in late July and early September, pushing the VIX briefly above the 20.00-level on August 1st and to 17.17 on September 2nd. Throughout much of July and August, the VIX established a robust support base around the 14.00-14.50 level. The most recent period, culminating on October 17th, shows a dramatic increase in volatility. Following a consolidation phase in mid-September to early October within the 15-17 range, the VIX experienced a significant gap up on October 10th, closing at 21.66. While a partial retracement occurred, the VIX then exhibited a substantial intra-day spike on October 17th, opening at 28.41 and touching 28.99, before closing considerably lower at 20.78. This suggests an immediate, strong rejection of the extreme intra-day high but a sustained upward shift in baseline volatility.
The 14-day Relative Strength Index (RSI) provides additional insights into these price movements. For most of the 90-day period, the RSI remained within neutral territory, generally oscillating between 37 and 65, aligning with the observed range-bound VIX price action. Notably, the VIX was in an oversold condition, with RSI around 37.11, during the July 25th price low of 14.93. Conversely, the significant price spike on August 1st coincided with an RSI reading of 65.38, approaching overbought conditions but not breaching the traditional 70 threshold. The most recent price action, however, saw the RSI definitively breach into overbought territory on October 10th, reaching 73.09, which directly correlated with the VIX closing at 21.66. Subsequent to this, the RSI retreated to the high 50s and low 60s, currently standing at 63.72 on October 17th. This suggests that while the immediate overbought condition has alleviated somewhat, bullish momentum remains relatively strong.
A comprehensive technical analysis of momentum and trend often relies on indicators such as the Moving Average Convergence Divergence (MACD). Regrettably, the MACD (13, 21-day) data, despite being specified in the analysis request, was not provided within the market data. The absence of this crucial momentum oscillator limits our ability to confirm trend strength, identify potential divergences between price and momentum, or assess the likelihood of impending trend changes with the desired level of confidence. MACD crossover signals, which can offer valuable entry and exit points or confirm trend direction, are therefore unavailable for this assessment. Consequently, the overall analysis is constrained to the interpretation of price action and the RSI, which may lead to a less robust conclusion regarding the intermediate-term trend and momentum characteristics of the VIX.
Considering the confluence of VIX price action and the 14-day RSI, the VIX appears to be in an elevated but volatile state. The sustained price action above the prior resistance area around 17.00-18.00 since the October 10th surge, coupled with RSI consistently above 50 (currently at 63.72), indicates a likely continuation of heightened volatility in the near term. The previous intra-day high in the 22.00-23.00 range has now been approached and technically surpassed, with the VIX closing near 20.78 after an extreme intra-day high of 28.99 on October 17th. This significant intra-day rejection from 28.99 suggests that prices substantially above 22.00-23.00 may encounter strong selling pressure or profit-taking, making a sustained move much higher than the current close of 20.78 less likely in the immediate future without fresh catalysts. An alternative scenario, however, involves the VIX consolidating around current levels, with a roughly even chance of either a slight retracement towards the 18.00-20.00 range or a retest of the recent intra-day highs if underlying sentiment shifts. A sustained breach below 18.00 would signal a significant easing of volatility, but there is no technical evidence to suggest this is likely in the short term.
VIX Price & Indicators (RSI_14_DAY, MACD_13_21_DAY)
Tech Sector Analysis
The relative performance of the technology-heavy NASDAQ-100 (QQQ) against the broader S&P 500 (SPY) has demonstrated a notably sideways trend over the past 14 trading days. The ratio, QQQ/SPY, has fluctuated within a narrow band, ranging from a low of 0.9012 to a high of 0.9099. The reported trend strength is categorized as “weak,” which strongly suggests a period of consolidation rather than a decisive directional move in relative outperformance or underperformance. The very low volatility figure (0.0000081) reinforces this observation, indicating that the magnitude of daily ratio changes has been minimal. This collective evidence points to a market environment where neither asset class has established significant relative leadership during this specific timeframe.
Examining the ratio’s price action, the period commenced around 0.9021, briefly dipping to its lowest point on 2025-09-30 before a subsequent rally to 0.9051 by 2025-10-02. The ratio then experienced a minor pullback, followed by a more sustained advance, culminating in the period’s high of 0.9099 on 2025-10-09. A noticeable drop occurred on 2025-10-10, pushing the ratio down to 0.9027, which was a significant retracement within the observed range. However, the ratio subsequently recovered, closing the period at 0.90899 on 2025-10-17. This pattern of oscillation within a defined range suggests underlying equilibrium between QQQ and SPY for much of the observed period.
The current ratio of 0.90899 positions it near the upper boundary of the 14-day range, with a relative position of 0.8945 from the low to the high. This proximity to the high end (0.9099) might initially suggest a slight positive bias for QQQ’s relative performance as the period concludes. However, given the overarching “sideways” trend and “weak” strength, it is unlikely this represents a strong breakout signal. More likely, this indicates QQQ has marginally recovered its relative position after the 2025-10-10 dip, returning to the higher end of its recent trading channel against SPY.
Considering alternative scenarios, it is highly likely the QQQ/SPY ratio will continue to consolidate within the established range, perhaps experiencing minor pullbacks towards the average ratio of 0.9047, given its current elevated position. A sustained breakout above the 0.9099 high or below the 0.9012 low would signify a material shift in relative strength, but the provided data offers no strong indications for such a move. Therefore, based solely on this 14-day data, the probability of a decisive directional trend emerging in the immediate short term is low. Investors are advised to monitor for any significant divergence from this tight range to identify potential changes in leadership.
Technical Analysis: QQQ/SPY Relative Performance (90-Day View)
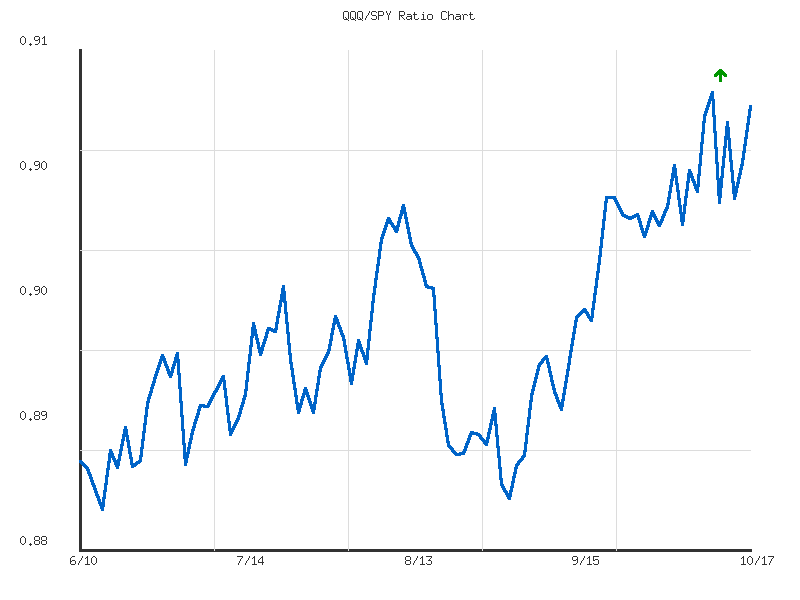
The QQQ/SPY ratio has probably been in a gradual uptrend over the past 90 days, as evidenced by the provided data showing an “up” direction with a 2.61% change. Despite this positive change, the trend strength is categorized as “weak,” which is consistent with the very low volatility observed in the ratio (0.000047). This suggests that while QQQ has, on balance, outperformed SPY during this period, the outperformance has been modest and characterized by small, incremental gains rather than sharp, decisive moves. The overall technical posture indicates a sustained but not aggressive preference for the growth-oriented Nasdaq 100 constituents over the broader S&P 500.
The ratio is currently positioned at 0.908999, which is extremely close to its 90-day high of 0.909917, recorded on October 9th. It is likely that this recent peak area will act as a near-term resistance level. Observing prior price action, a similar push above the 0.90 level in mid-August around 0.9025 was followed by a significant pullback to the 0.88 range. This historical precedent introduces a roughly even chance that the current resistance zone will prompt a temporary consolidation or retracement, as the ratio has yet to definitively break and sustain itself above this ceiling.
Examining potential support levels, several areas emerge from the historical data. The 0.895-0.900 zone, encompassing prior peaks from late September (around 0.903) and early August (around 0.902), could potentially transform into initial support if the current resistance holds and the ratio begins to decline. Should a more substantial pullback occur, the 0.885-0.890 range appears to offer stronger support, as the ratio found buyers and consolidated in this area during late August and early September. The absolute 90-day low of 0.88268 serves as a more distant, critical support floor.
Considering the current technical setup, a near-term consolidation or a slight pullback from the current elevated levels is likely. The ratio’s proximity to its 90-day high, coupled with the “weak” trend strength and the historical tendency for retracements after local peaks, suggests that a significant upward acceleration is unlikely without a sustained breach of the 0.9099 resistance. However, an alternative scenario exists: if the ratio manages to achieve a decisive breakout above 0.9099 and registers sustained closes above this level, it is likely to signal a strengthening of QQQ’s relative performance and could lead to a new phase of outperformance. Conversely, a failure to hold the 0.895-0.900 support area would increase the likelihood of a deeper retest of the 0.885-0.890 support zone, indicating a period of relative weakness for QQQ.
The extremely low volatility (0.000047) further suggests that any future movements, whether upward or downward, will probably unfold gradually. Sharp, sudden reversals or parabolic moves are unlikely given the historical price behavior over this 90-day period. Traders should anticipate continued incremental changes in the QQQ/SPY ratio rather than abrupt shifts.
Ratio Analysis: QQQ/SPY
Generated for 90days timeframe analysis
IWM vs. SPY
Over the observed 14-day period, the IWM/SPY ratio, which gauges the relative performance of small-cap stocks (Russell 2000) against large-cap equities (S&P 500), has demonstrated a predominantly sideways trend with weak directional strength. The ratio commenced at approximately 0.3640 on September 29th and concluded at 0.3663 on October 17th. Within this timeframe, the ratio established a low of 0.3627 and a high of 0.3763, indicating a relatively narrow trading band. The extremely low calculated volatility (0.0000147) reinforces the observation of constrained movement, suggesting a period where neither small-cap nor large-cap equities established clear, sustained leadership against the other in a significant manner. The current ratio stands slightly below the average ratio of 0.3668 for this period.
Despite the overarching sideways trend, a significant pattern emerged within the latter part of the data series. Following a dip to 0.3641 on October 10th, the ratio experienced a notable upward surge, peaking at 0.3763 on October 15th. This particular movement suggested a period of likely small-cap outperformance relative to the S&P 500. However, this bullish momentum was abruptly reversed, with the ratio sharply declining to 0.3663 by October 17th. This sharp pullback from the period’s high is a key technical event, indicating that the relative strength favoring small caps was short-lived and met with significant resistance or profit-taking pressure. The extent of this reversal suggests that prior upward momentum may be challenging to re-establish immediately.
Considering the recent price action, there is a roughly even chance that the IWM/SPY ratio will continue to consolidate within its established 14-day range, specifically around the current level or potentially retest the lower end of the band (around 0.3627). The sharp reversal from the high makes a continuation of significant small-cap outperformance highly unlikely in the immediate term without further technical confirmation. An alternative scenario, though less likely given the weak trend strength and recent reversal, involves the ratio stabilizing and attempting another upward leg, but such a move would require a sustained series of higher closes to validate renewed small-cap strength. The current relative position at 26.5% from the low end of the range, after the decline, suggests it has room to test lower boundaries of the consolidation zone.
Analysis of IWM/SPY Ratio (90-Day Period ending October 17, 2025)
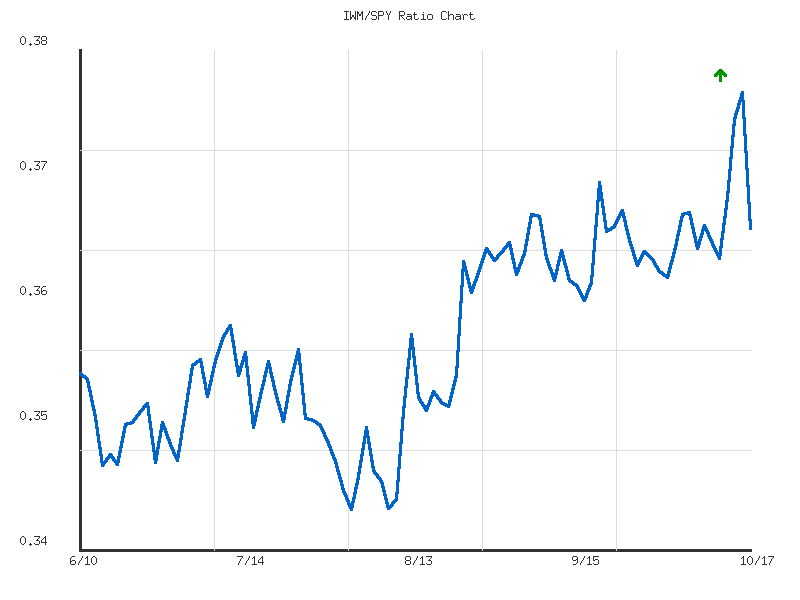
Over the observed 90-day period, ending on October 17, 2025, the IWM/SPY ratio has demonstrated a moderate upward trend, indicating a consistent period of outperformance by the Russell 2000 (IWM) relative to the S&P 500 (SPY). Starting from approximately 0.355 in mid-June, the ratio concluded the period at 0.366, representing an overall increase of 3.00%. This sustained upward movement suggests that market participants have been allocating capital towards smaller capitalization stocks at a faster rate than large-cap indices. The average ratio for this period settled at 0.358, confirming that the current reading remains above the long-term mean of the observed window, reinforcing the established bullish bias for relative strength. The trend’s character appears more measured than aggressive, implying a somewhat orderly progression rather than erratic, sharp movements.
Upon closer examination of the data, the ratio’s journey began with an initial dip from its starting point in mid-June to its 90-day low of 0.34568 on August 1st. This early-period weakness was followed by a more determined recovery, with the ratio progressively establishing a series of higher lows and higher highs. Key resistance levels were overcome, notably the 0.352-0.353 zone observed in June, which subsequently appeared to serve as dynamic support during later pullbacks. A significant acceleration in the uptrend became apparent from early August, with the ratio consolidating around the 0.360-0.365 range through September before initiating a fresh leg up in early October. This pattern of consolidation followed by breakout is often interpreted as a continuation signal within an established trend.
Most recently, the IWM/SPY ratio experienced a notable surge, reaching a new 90-day high of 0.37633 on October 15th. This peak represents the highest relative strength recorded within the current analysis window, underscoring the recent robust outperformance by small-caps. Following this peak, the ratio observed a minor pullback over the subsequent two trading sessions, settling at 0.36636 on October 17th. This constitutes a roughly 2.6% retracement from its immediate high, which is a contained correction within the context of the overall moderate uptrend. The current ratio sits at approximately 67% of its 90-day range, indicating that it remains in a relatively strong position compared to its performance over the last three months.
Looking ahead, a continuation of the moderate upward trend in the IWM/SPY ratio appears likely. The established pattern of higher highs and higher lows, coupled with the recent breakout to new highs, suggests that small-caps will probably continue to outperform large-caps in the near to intermediate term. It is plausible that the ratio will find support around the recently broken 0.360-0.365 zone, which could act as a launchpad for another attempt at the 0.376 high. However, a period of consolidation or a further retracement towards this support level is also a roughly even chance, given the recent rapid ascent. A significant bearish shift in relative strength, which would require the ratio to break convincingly below the broader support zone established around 0.345-0.348, appears unlikely at this juncture without additional technical deterioration, thus preserving the prevailing upward bias.
Ratio Analysis: IWM/SPY
Generated for 90days timeframe analysis
Commodities
An analysis of the provided daily percentage change data for eight commodity-related instruments reveals a mixed, yet predominantly negative, technical picture for the session. The relative performance of these assets is summarized in the following matrix, sorted by daily percentage change in descending order:
| Symbol | Daily Percent Change |
|---|---|
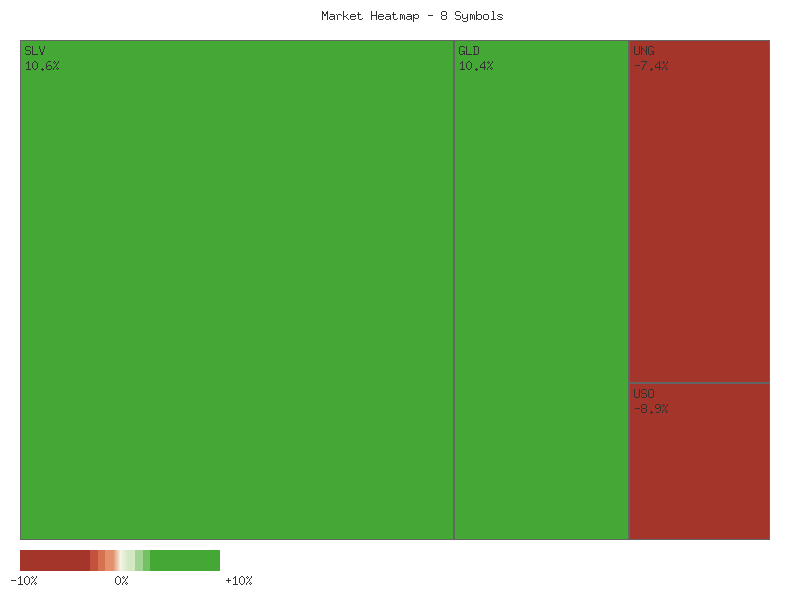
| CORN | 0.689% |
| GLD | 0.413% |
| CPER | 0.260% |
| UNG | -0.084% |
| DBC | -0.271% |
| UGA | -0.292% |
| USO | -1.464% |
| SLV | -2.773% |
From a market breadth perspective, we observe three advancing symbols (CORN, GLD, CPER) and five declining symbols (UNG, DBC, UGA, USO, SLV). This 3:5 ratio of advancers to decliners suggests that bearish sentiment was broadly more influential across this specific basket of instruments for the observed period. While a single day’s breadth is limited in its forecasting power, the majority of components experienced downward pressure.
Delving into individual performances, CORN exhibited the strongest positive movement with a gain of approximately 0.69%, suggesting a notable buying interest in agricultural commodities for the day. GLD, representing gold, also posted a positive, albeit modest, gain of 0.41%, indicating some underlying strength or safe-haven demand. CPER, tracking copper, closed higher by 0.26%. These three instruments collectively indicate isolated areas of strength within the broader commodity complex.
Conversely, the declines were more pronounced and widespread. UNG, UGA, and DBC registered relatively modest declines of -0.08%, -0.29%, and -0.27%, respectively. However, USO, representing oil, experienced a significant drop of -1.46%, indicating considerable selling pressure in the energy sector. The most substantial decline was observed in SLV, which tracks silver, plummeting by -2.77%. This considerable underperformance of SLV, alongside USO’s notable fall, suggests strong bearish momentum in these particular segments.
Given the available data, it is likely that the overall technical sentiment for this group of commodities was somewhat negative, driven primarily by the pronounced declines in SLV and USO. The limited number of advancing symbols and their relatively moderate gains, contrasted with the steeper losses in key components, points to a market where bearish forces were more dominant for the session. While it is too early to project long-term trends from a single day’s data, a continuation of such breadth could signal increasing downside pressure for the commodity complex as a whole. Conversely, a sharp reversal in SLV or USO performance in subsequent sessions could dramatically alter this short-term technical outlook; however, based solely on this data, such a reversal is a roughly even chance, given the isolated nature of this single observation.
Market Commentary: Two-Day Technical Snapshot
Analysis of the provided two-day market data reveals a notable divergence in price action across various commodity-related instruments, with a strong bearish undertone emerging in the precious metals and energy sectors. GLD initiated the second trading day with a substantial bullish gap, yet this advance was met with considerable selling pressure, resulting in a large upper shadow and a close significantly below its high, albeit still above the prior day’s close. The nearly threefold increase in volume on this day, accompanying the rejection of higher prices, makes it likely that a short-term top has been established or that immediate upside momentum is exhausted. A similar dynamic, albeit more overtly bearish, unfolded in SLV. Following a bullish first day, SLV’s second day saw a slight gap up before printing a strong bearish engulfing candle on more than double the prior day’s volume. This pattern, characterized by the current day’s real body completely enveloping the previous day’s real body, is a potent reversal signal. Given the high conviction indicated by the surging volume, continued downside in SLV is highly likely in the immediate term, with GLD also facing substantial headwinds.
The energy complex, represented by USO and DBC, also exhibits clear bearish momentum. USO printed two consecutive bearish candles, with the second day opening with a significant gap down and closing lower than the first day’s close. The increase in volume on the second bearish day lends strong confirmation to this downtrend, suggesting that further price erosion is likely. Similarly, DBC, a broader commodity index, also recorded two consecutive bearish closes, with the second day’s candle opening lower and closing even further down. Crucially, DBC’s second day saw an almost tenfold increase in volume, strongly reinforcing the bearish sentiment. This robust volume accompanying the breakdown implies that the downward movement has strong conviction and is likely to persist.
UGA and UNG present a more nuanced picture within the energy sector. UGA gapped down significantly on its second day but managed to recover and close higher than its open, albeit still below the prior day’s close, on increased volume. This could indicate some buying interest at lower levels, yet the initial gap down remains a significant bearish signal, suggesting a roughly even chance of consolidation or further downside from overhead resistance. UNG experienced a similar gap down followed by a strong intraday recovery, closing near the prior day’s close, but on slightly decreased volume. This pattern indicates potential demand but lacks strong conviction for a sustained reversal from the bearish gap, leading to a roughly even chance of either consolidation or a test of the recovery’s limits.
In contrast to the prevailing bearishness, CORN stands out with clear bullish momentum. It recorded two consecutive bullish candles, with the second day opening with a gap up and maintaining a higher close. While the volume on the second day was slightly lower, the consecutive higher closes and the gap up suggest that the upward trend is likely to continue in the very short term. CPER, representing copper, displayed indecisive price action. After a bearish first day, the second day saw a bullish close, but this occurred on significantly reduced volume and did not recover the prior day’s losses. This suggests that any upward movement in CPER is likely to be corrective or part of a consolidation phase rather than the initiation of a new uptrend. There is a roughly even chance that CPER will continue to trade range-bound or experience renewed selling pressure given the lack of conviction in the recent upward move.
Performance Heatmap (SLV, GLD, CORN, CPER, USO, DBC, UGA, UNG)
Generated for 2days timeframe analysis
Here is a rigorous technical analysis of SLV based solely on the provided 90-day market data:
SLV exhibited a discernible uptrend over the past 90 days, beginning with a consolidation phase in June (roughly .50-.75). A significant surge in volume and price commenced around July 10-11, propelling SLV into a higher trading range. This bullish momentum gained substantial strength from late August through mid-October, characterized by a series of higher highs and higher lows, often accompanied by notable increases in trading volume during upward moves. The price advanced from approximately .50 in early August to a high of .59 on October 17. The Relative Strength Index (RSI), a momentum oscillator, consistently reflected this bullish sentiment, remaining largely above 60 and frequently entering overbought territory (above 70) during this period of ascent, confirming robust buying pressure.
However, the most recent trading activity on October 17 presents a strong technical warning. After reaching a peak of .59, SLV experienced a sharp reversal, closing at .99. This significant decline from the high, observed within a single trading session, formed a large bearish candle on exceptionally high volume (86,042,805 shares), which is nearly double the average volume seen in recent weeks. This pattern, particularly following a series of new highs and extreme overbought RSI readings, is a compelling indicator of potential bullish exhaustion. The 14-day RSI, which reached an extreme high of 84.32 on October 13 and was still elevated at 83.09 on October 15, swiftly retreated to 72.42 on October 17. This rapid deceleration from extreme overbought conditions, coinciding with a bearish candlestick reversal and heavy volume, likely suggests a significant shift in short-term momentum.
Given the confluence of the bearish reversal candlestick on substantial volume and the sharp drop in RSI from severely overbought levels, it is likely that SLV is entering a corrective phase. The price action on October 9, which saw a long upper wick and a close significantly off the high on record volume (110,426,700 shares), can now be interpreted as an early sign of selling pressure at elevated levels, preceding the more decisive reversal on October 17. Initial technical support might be found around the .00 to .50 area, where SLV previously found support after a high-volume pullback on October 7 and 8. A more significant support zone appears near the .00-.50 level, corresponding to the late September/early October consolidation.
While a near-term correction appears likely based on the provided data, an alternative scenario would involve buyers stepping in immediately to defend the recent gains, pushing the price back above the October 17 open of .46. Such a recovery would be unlikely without a significant increase in buying volume and a subsequent rise in the RSI to challenge previous highs. A sustained move above .59 would invalidate the current bearish signals and suggest continued upside momentum. It is important to note that the requested MACD (13, 21-day) indicator data was not available for this analysis, limiting our ability to assess convergence/divergence and signal line crossovers, which could provide additional insights into trend strength and potential reversals.
SLV Price & Indicators (RSI_14_DAY, MACD_13_21_DAY)
As a Chartered Market Technician with over 15 years of experience, I offer the following analysis of GLD, based exclusively on the provided 90-day technical data.
Overall Trend, Price Action, and Volume Confirmation GLD has exhibited a robust and sustained upward trend over the observed 90-day period, advancing significantly from approximately in mid-June to nearly by mid-October. This substantial appreciation is characterized by a consistent pattern of higher highs and higher lows, indicative of a strong bullish market structure. The initial phase, from mid-June to late July, saw GLD consolidate within a range of approximately -. A decisive breakout in late August then initiated a powerful and accelerated rally, surging from roughly on August 28th to .99 by October 17th. This upward momentum has been consistently reinforced by above-average trading volumes, particularly evident during strong bullish candles. While a high-volume bearish candle on October 9th might suggest short-term profit-taking, the subsequent renewed ascent suggests strong underlying demand. This confluence of strong price appreciation and corroborating volume highly suggests dominant buyer conviction. Note that MACD (13-21-day) data was not provided, precluding its inclusion; analysis is confined to price, volume, and 14-day RSI.
RSI Momentum and Overbought Conditions The 14-day Relative Strength Index (RSI) provides further insight into the asset’s momentum. After oscillating in the neutral zone (around 40-60) during June and July, the RSI began a sharp ascent in late August, mirroring the price rally. Since early September, the RSI has consistently indicated overbought conditions, frequently rising above 70 and often exceeding 80, including the most recent reading of 83.53. While extended periods in overbought territory can signal a robust, healthy uptrend, they also inherently suggest increasing risk of a short-term price correction or at least a deceleration in momentum. This prolonged overbought state indicates the asset is technically stretched. It is highly likely that this sustained overbought condition will lead to either a period of horizontal consolidation or a minor pullback in price in the near future. The probability of an immediate sharp reversal into a downtrend is considered less likely without additional bearish technical confirmations.
Immediate Outlook and Alternative Scenarios Considering the robust bullish trend in price and volume, juxtaposed with the significantly overbought RSI, two principal scenarios emerge for GLD’s immediate trajectory. It is highly likely that the overarching bullish trend will persist, supported by the strength of recent price action and volume. However, it is roughly even chance that the pronounced overbought RSI will instigate a temporary phase of consolidation or a modest price retracement from current levels. A notable reversal, leading to a significant downtrend, is considered unlikely without further technical deterioration. Should a pullback occur, previous breakout levels around - might serve as initial support, potentially offering opportunities for renewed buying interest. Conversely, if GLD continues its upward trajectory with sustained high volume, it would likely indicate further gains, but the growing technical overextension implies that a degree of caution is warranted, and monitoring for signs of momentum shift is advisable.
GLD Price & Indicators (RSI_14_DAY, MACD_13_21_DAY)
Gold/Silver Ratio
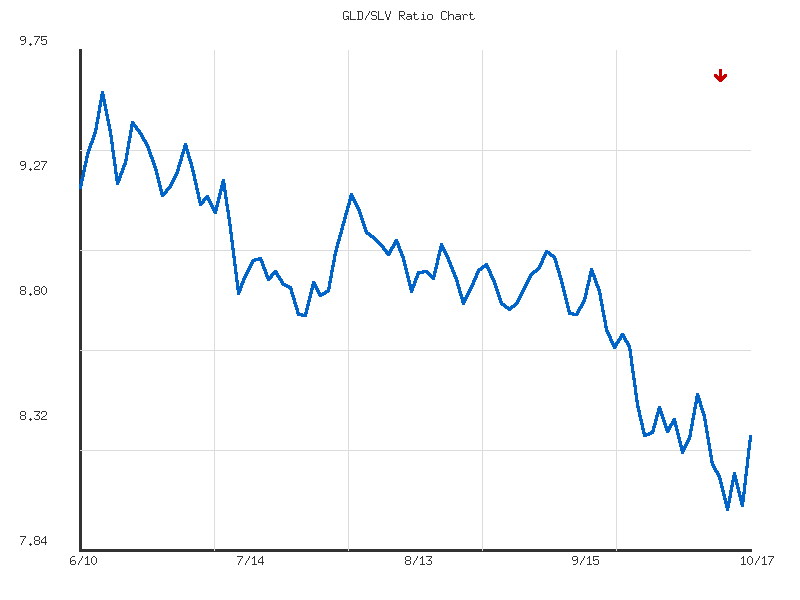
The GLD/SLV ratio, over the observed 14-day period, has exhibited a defined sideways trend, characterized by weak strength. The net change across this timeframe is negligible, registering a minor decrease of approximately 0.18%. This lack of substantial directional movement is further underscored by the notably low volatility (0.0165), suggesting a market environment lacking strong conviction from either buyers or sellers. The ratio has traded within a confined range, establishing a high of 8.441 on October 7th and a low of 8.000 on October 13th. Given these technical characteristics, a continuation of this range-bound, sideways price action is likely in the immediate future.
Examining the more recent price action within this sideways channel, the ratio experienced a notable decline to its 14-day low of 8.000 on October 13th. Subsequently, it has demonstrated a modest rebound, closing at 8.278 on October 17th. This recovery places the current ratio above its 14-day average of 8.238 and at the 63rd percentile of its observed range, indicating it is now positioned in the upper portion of its recent trading band. While the bounce from the 8.000 level suggests a potential area of short-term support, the overarching weak sideways trend implies that any upward momentum is likely to encounter resistance as it approaches the upper end of the established range, specifically around the 8.441 level.
Considering the pattern of low volatility and the current rebound within the established range, there is a roughly even chance the ratio will test the upper boundary of its recent range (near 8.441) before potentially retreating again. Alternatively, a continuation of consolidation around the current levels, hovering near the 14-day average, is also a roughly even chance. A decisive breakout above 8.441 or below 8.000 is unlikely without a significant shift in the underlying market dynamics, which is not indicated by the provided data. Traders should anticipate the ratio to continue oscillating within this well-defined band, with the 8.000 level acting as provisional support and the 8.441 level functioning as provisional resistance in the very near term.
As a CMT with extensive experience, I offer the following technical analysis of the GLD/SLV ratio over the provided 90-day period. This commentary is based exclusively on the provided data, without external context.
The GLD/SLV ratio has exhibited a strong and persistent downward trend over the observed 90-day period, declining by approximately 10.31% from its peak. This robust performance of SLV relative to GLD indicates a clear technical preference for silver over gold within this timeframe. The ratio commenced near its high of 9.59 on June 13th and has since descended steadily, culminating in a recent low of 8.00 on October 13th, before slightly recovering. This consistent depreciation suggests that the technical outlook for this ratio favors continued outperformance of silver against gold.
Currently, the ratio stands at 8.27, which is notably closer to its 90-day low of 8.00 than its high of 9.59. The relative position data further underscores this, indicating the current ratio is only 17.45% of the way from its 90-day low to its 90-day high. The average ratio over this period is 8.87. The current ratio trading well below this average reinforces the strong bearish sentiment prevalent in this pair. The recent slight rebound from the 8.00 low to the current 8.27 level could represent a minor short-term consolidation or profit-taking, but it does not yet signify a clear reversal of the established downtrend.
The identified “strong” downward trend, coupled with the substantial 10.31% decline, highlights significant bearish momentum for GLD relative to SLV. While the reported volatility of 0.128 is not exceptionally high, it suggests a persistent and relatively orderly decline rather than erratic, high-amplitude swings. This implies that the selling pressure has been sustained and not merely a brief reactive move. Given the consistent downward pressure and the ratio’s current positioning near its lower bound, a continuation of the downtrend is likely.
Considering the robust downward momentum and the ratio’s current proximity to its 90-day low, a further decline in the GLD/SLV ratio is likely over the short to medium term. The path of least resistance appears to be lower, challenging the 8.00 support level observed on October 13th. A sustained breach below 8.00 would highly likely lead to new 90-day lows. However, it is a roughly even chance that the ratio could consolidate around current levels (8.00-8.30) or experience a temporary relief rally towards the average ratio of 8.87, before potentially resuming its dominant downtrend. A significant and lasting reversal of the strong downtrend is currently unlikely without the formation of clear bullish technical patterns, which are not evident in the provided data. Traders should observe the 8.00 level for potential support or a breakdown signal.
Ratio Analysis: GLD/SLV
Generated for 90days timeframe analysis
Bonds
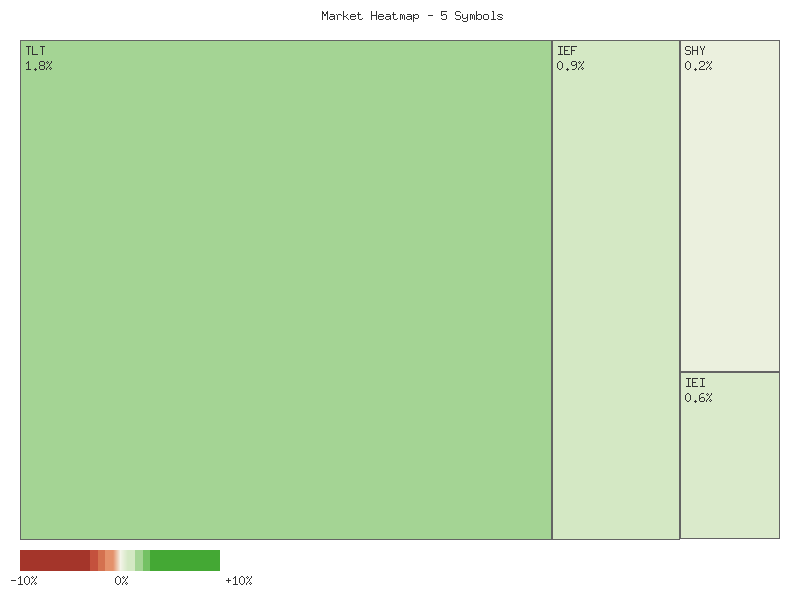
The market data for October 17, 2025, indicates a broadly positive day for the observed fixed-income ETFs, with all instruments registering gains. The daily percentage changes for these Treasury-backed funds, sorted in descending order, are as follows:
| Symbol | Daily Percent Change |
|---|---|
| TLT | 0.596% |
| UTHY | 0.580% |
| IEF | 0.299% |
| IEI | 0.183% |
| SHY | 0.115% |
Analysis of these returns suggests a clear pattern linked to duration. The longer-duration instruments, TLT (iShares 20+ Year Treasury Bond ETF) and UTHY (iShares Treasury 20+ Year Bond ETF), demonstrated the strongest performance, with TLT slightly outperforming UTHY. Intermediate-duration bonds, represented by IEF (iShares 7-10 Year Treasury Bond ETF) and IEI (iShares 3-7 Year Treasury Bond ETF), posted more modest, albeit positive, returns. The shortest-duration instrument, SHY (iShares 1-3 Year Treasury Bond ETF), registered the smallest gain. This uniform positive movement across the spectrum of maturities suggests a general decline in interest rates across the Treasury yield curve for the trading session.
The distinct outperformance of longer-duration bonds (TLT and UTHY) compared to their shorter-term counterparts (IEF, IEI, SHY) is a significant technical observation. This pattern is highly likely to indicate that long-term interest rates declined more substantially than short-term rates during the session. Such relative movement in yields is consistent with a “bull flattening” scenario for the yield curve, where the entire curve shifts downwards, but the longer end experiences a more pronounced drop in yields. This technical behavior suggests that market participants may have been extending duration exposure or seeking greater capital appreciation from falling long-term rates.
While the data strongly suggests a bull flattening of the yield curve, it is crucial to acknowledge the limitations of a single day’s data. A sustained trend would require confirmation over multiple trading sessions. It is a roughly even chance that this one-day pattern is an anomaly driven by specific, short-term market dynamics rather than the initiation of a new, prolonged trend. Alternative scenarios could include temporary rebalancing flows or specific institutional demand concentrated at the long end of the curve, which may not persist. Therefore, while the immediate technical implications point to a more significant decline in long-term yields, subsequent price action would be required to establish a durable market bias.
Here is a technical analysis of the provided market data:
The supplied two-day candle data for TLT, UTHY, IEF, IEI, and SHY reveals a consistent shift in short-term sentiment across these Treasury-related instruments. On October 15th, the price action for most instruments was characterized by a bearish or slightly bearish close, suggesting either profit-taking or initial selling pressure. However, the subsequent trading day, October 17th, presented a unified bullish response across the board, with all instruments closing higher than their open, often accompanied by upward price gaps. This pattern suggests that, over the observation period, buying interest has likely re-emerged, potentially signaling a short-term upward bias for the segment.
Specifically examining the longer-duration ETFs, TLT (iShares 20+ Year Treasury Bond ETF) exhibited a strong bullish candle on October 17th, closing significantly higher than its open and above its prior day’s close. This move was supported by a notable increase in trading volume, which often reinforces the conviction of a price movement. Similarly, IEF (iShares 7-10 Year Treasury Bond ETF) demonstrated a highly convincing bullish reversal. On October 17th, IEF opened with a substantial price gap above the prior day’s high and closed near its daily peak, accompanied by a significant increase in volume. The strength of the price action combined with higher volume makes a continuation of upward momentum for both TLT and IEF likely in the immediate short-term.
Moving to the mid- and shorter-duration instruments, IEI (iShares 3-7 Year Treasury Bond ETF) also presented a clear bullish candle on October 17th, opening with a gap above its prior day’s high and closing higher, supported by a modest increase in volume. This indicates a likely continuation of its upward trajectory. However, UTHY (US Treasury 30 Year Bond Futures ETF) and SHY (iShares 1-3 Year Treasury Bond ETF) show more nuanced signals. While both instruments closed higher on October 17th following an upward gap, the accompanying trading volume for UTHY saw a significant decrease, and for SHY, a moderate decrease. The divergence of positive price action from declining volume for UTHY makes the sustainability of its upward move less certain in the very short term, suggesting that a period of consolidation or a weaker follow-through is a roughly even chance despite the bullish candle. For SHY, the declining volume could imply waning buying conviction, making a strong continuation less likely compared to IEF or TLT.
In summary, the technical data for this basket of Treasury-related ETFs generally points to a likely short-term bullish bias. The widespread bullish candles on October 17th, particularly those in TLT and IEF with supporting volume, suggest that buying pressure has gained the upper hand. While the volume discrepancies in UTHY and SHY introduce some uncertainty for these specific instruments, the overall market technicals suggest that immediate further upside is likely across the segment. An alternative scenario, such as a sharp reversal to retest previous lows, is unlikely given the clear bullish candles and widespread nature of the rebound, though periods of consolidation are a roughly even chance, especially for instruments with less volume conviction.
Performance Heatmap (TLT, UTHY, IEF, IEI, SHY)
Generated for 2days timeframe analysis
Magnificent 7 & Friends
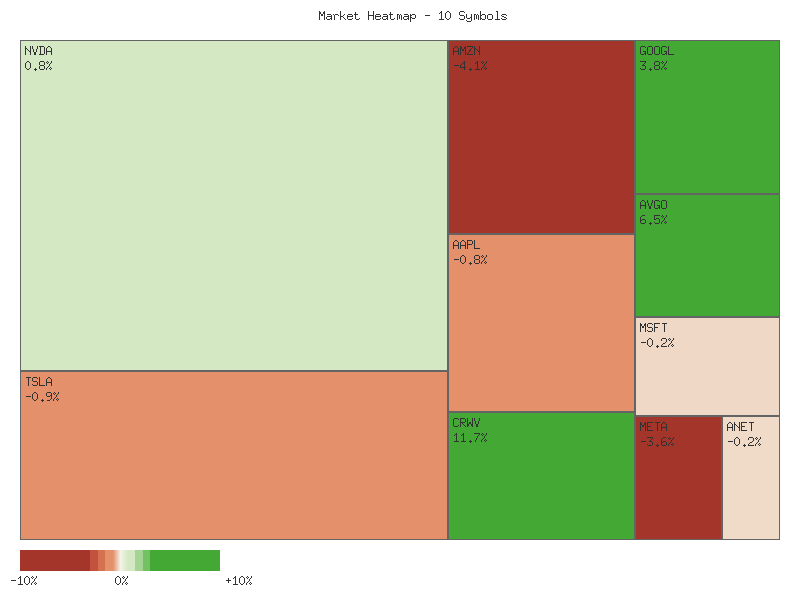
The daily performance of the provided symbols indicates a mixed sentiment across the observed market segment. A review of the daily percent changes reveals a notable divergence in immediate price action among the selected equities. NVDA exhibited the strongest performance for the day, closing up 1.8851%, suggesting a period of significant buying pressure. This strong upward movement is then followed by AAPL at 1.1831%, TSLA at 0.9560%, and GOOGL at 0.9043%. MSFT posted a marginal gain of 0.0292%, indicating a roughly even balance between buyers and sellers, resulting in near-flat performance. The clustering of positive changes in the upper half of the distribution suggests that a subset of these market components experienced favorable conditions for the session.
| Symbol | Daily Percent Change |
|---|---|
| NVDA | 1.8851% |
| AAPL | 1.1831% |
| TSLA | 0.9560% |
| GOOGL | 0.9043% |
| MSFT | 0.0292% |
| META | -0.0885% |
| ANET | -0.1953% |
| AVGO | -0.5693% |
| AMZN | -1.1736% |
| CRWV | -1.7021% |
Conversely, the latter half of the distribution reveals declines, ranging from negligible to more pronounced. META experienced a slight dip of -0.0885%, which is broadly consistent with a near-unchanged trading day, implying a roughly even chance for directional momentum in the very short term. ANET and AVGO also posted modest losses of -0.1953% and -0.5693% respectively. These minor retractions suggest that while selling pressure was present, it was not overwhelming for these specific tickers. Based purely on this single day’s data, it is unlikely that these minor declines alone signal a robust bearish trend, though they do indicate an immediate absence of strong buying interest.
The most significant downward movements were observed in AMZN and CRWV, which declined by -1.1736% and -1.7021% respectively. These more considerable losses suggest that these two symbols faced stronger selling pressure or a notable lack of demand during the trading session compared to their peers. For CRWV, this represents the most pronounced technical weakness among the group for this specific day, making it likely that bears maintained control. While these are single-day observations, the magnitude of these declines, relative to the overall market performance of the provided symbols, makes it likely that these stocks experienced a more distinct shift in immediate sentiment.
Given that this analysis is based solely on a single day’s percentage change, it is highly likely that any conclusions regarding sustained trends are speculative without additional price and volume data. The data, however, provides a snapshot of relative strength and weakness for this particular session. The pronounced positive movements in NVDA and AAPL suggest immediate bullish sentiment for those specific securities, while the deeper declines in AMZN and CRWV indicate short-term bearish control. A roughly even chance exists that these single-day movements are either the initiation of new short-term directional biases or merely temporary fluctuations within broader, unobserved trends. Further analysis incorporating multi-day price action, volume, and chart patterns would be necessary to derive more robust technical conclusions.
As a Chartered Market Technician with over 15 years of experience, my analysis of the provided two-day market data, spanning October 15th to October 17th, 2025, focuses purely on the observed price and volume dynamics. The period reveals a bifurcated market sentiment among these key symbols, with distinct bullish and bearish developments unfolding simultaneously, often with significant volume shifts.
On the bullish front, several symbols displayed strong upward momentum or clear reversal patterns. AAPL exhibited a robust bullish engulfing pattern on October 17th, opening below its prior close but rallying significantly to close at a new high for the two-day period, supported by a substantial increase in volume. This pattern strongly suggests a continuation of buying interest in the immediate term. TSLA also showed notable strength, closing higher on October 17th despite a gap down at open, surpassing its previous day’s close with increased volume, indicating that a near-term recovery or continuation of positive momentum is likely. GOOGL demonstrated consistent bullish strength, recording two consecutive bullish candles with higher highs and higher lows, accompanied by slightly increased volume, which makes further advances probable. Furthermore, NVDA, after a distinctly bearish day on October 15th, presented a significant bullish reversal candle on October 17th. This piercing line-like formation, closing near its high and recovering a substantial portion of the prior day’s losses, likely signals a shift in sentiment and could mark a short-term bottom, with a roughly even chance of continued upward recovery or consolidation.
Conversely, a considerable portion of the observed symbols showcased persistent bearish trends. AVGO and AMZN both recorded two consecutive bearish candles, with October 17th establishing lower highs and lower lows. For these two, continued downward price action is likely given the consistent selling pressure. CRWV displayed a particularly bearish setup; following a bearish close on October 15th, October 17th saw a significant gap down at open and closed even lower, crucially accompanied by a substantial increase in volume. This pattern strongly suggests a continuation of the downtrend and increased seller conviction. Similarly, META, despite an intraday attempt to rally, closed lower on October 17th after opening with a notable gap down relative to the previous day’s close. This price action, combined with higher volume on the down day, makes further bearish movement likely as sellers appeared to maintain control despite attempts by buyers.
For symbols like MSFT and ANET, the technical picture offers more nuanced interpretations. MSFT initially gapped down on October 17th but managed to recover and close marginally above its previous day’s close, supported by increased volume. While not a definitive bullish engulfing, the strong recovery from the day’s low suggests underlying buying interest, indicating a roughly even chance of near-term consolidation or upward correction following the gap down. However, the initial gap down presents a resistance area, and continued downward pressure remains a possible alternative scenario. ANET exhibited an indecision pattern on October 17th, with its entire price range (high and low) contained within the body of the preceding bullish candle, on decreased volume. This “harami” pattern likely signals a pause in the prior upward momentum. For ANET, a breakout from this narrow range would be required to ascertain the next directional move, implying a roughly even chance of either continuation or reversal.
In summary, the two-day period illustrates a highly selective market. While several high-profile names demonstrated strong bullish reversals or continuations, equally compelling bearish trends persisted in others. Traders should observe subsequent sessions for confirmation of these emerging patterns, particularly for those symbols exhibiting reversal attempts or indecision, as the balance between buying and selling pressures appears to be at a critical juncture for many of these components.
Performance Heatmap (TSLA, MSFT, AAPL, META, NVDA, AVGO, GOOGL, AMZN, CRWV, ANET)
Generated for 2days timeframe analysis
S&P 500 Sector Breadth
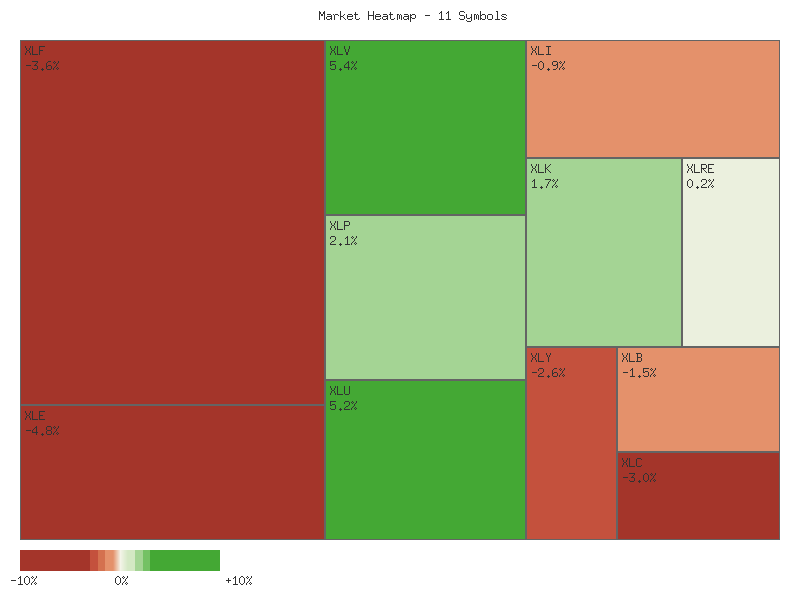
An analysis of the provided daily percentage change data for eleven S&P 500 sector ETFs indicates a predominantly negative market breadth. Out of the eleven observed symbols, four advanced for the day, while seven experienced declines. This 4:7 advance-decline ratio suggests a period of broad market weakness, with selling pressure outweighing buying interest across a majority of the represented sectors. The overall market momentum, as reflected by this breadth indicator, appears to be to the downside.
Delving into sector performance, the advancing symbols include three defensive sectors—XLP (Consumer Staples) with a 0.631% gain, XLV (Health Care) up 0.498%, and XLRE (Real Estate) showing a 0.334% increase. Notably, XLK (Technology), an offensive sector, also posted a modest gain of 0.250%. This pattern suggests a selective focus on defensive plays, with the exception of Technology demonstrating some resilience. Conversely, the declining sectors are predominantly offensive. XLF (Financials) led the declines with a -1.991% change, followed by XLU (Utilities), a defensive sector, dropping -1.432%. Other significant decliners include XLB (Materials) at -0.936%, XLI (Industrials) at -0.570%, XLE (Energy) at -0.394%, XLC (Communication Services) at -0.399%, and XLY (Consumer Discretionary) at -0.115%.
The sector performance data strongly suggests a market rotation away from offensive sectors and into defensive ones. Three of the four advancing sectors are defensive, while five of the six identified offensive sectors experienced declines. This indicates that market participants are likely seeking safety and stability in sectors historically less sensitive to economic cycles. The decline in XLU (Utilities), which is typically defensive, introduces a degree of uncertainty regarding a uniform defensive preference, though the overall trend points to a flight towards defensives. Given the predominance of declining offensive sectors and the relative strength in defensive areas like Consumer Staples, Health Care, and Real Estate, the overall market sentiment appears to be cautious and risk-averse. There is a roughly even chance that this pattern could persist in the immediate term, contingent on further price action.
| Symbol | Daily Percent Change |
|---|---|
| XLP | 0.631% |
| XLV | 0.498% |
| XLRE | 0.334% |
| XLK | 0.250% |
| XLY | -0.115% |
| XLE | -0.394% |
| XLC | -0.399% |
| XLI | -0.570% |
| XLB | -0.936% |
| XLU | -1.432% |
| XLF | -1.991% |
Market Sector Technical Analysis: Two-Day Review
Our analysis of the provided two-day market data for key SPDR sector ETFs indicates a predominantly bearish sentiment across a majority of sectors. Out of the eleven sectors examined, six exhibit patterns indicative of likely continued downward pressure, while four show signals suggesting likely upward momentum. One sector presents a more ambiguous outlook, with roughly even probabilities for short-term price direction. The aggregate technical picture points towards a market structure currently favoring declining price action for a significant portion of the broad market, with a notable shift in momentum for several key sectors.
Among the sectors displaying bullish characteristics, XLRE (Real Estate) and XLV (Healthcare) each charted two consecutive bullish candlesticks, closing at or near their respective two-day highs, accompanied by increased trading volume. This price action, particularly the higher closes and heightened volume on the second day, strongly suggests that both XLRE and XLV are highly likely to experience continued upward price momentum. Similarly, XLP (Consumer Staples) also recorded two bullish candles, culminating in a higher close on the second day with significantly increased volume, indicating a highly likely continuation of its upward trend. XLK (Technology), after a bearish close on the first day with a long lower wick, saw a significant bullish reversal on the second day. It gapped down but recovered to close higher than the previous day’s close on increased volume. This pattern makes a short-term upward continuation for XLK likely, or at least a retest of prior resistance levels.
Conversely, a significant portion of the market appears to be under considerable selling pressure. XLI (Industrials), XLF (Financials), XLU (Utilities), and XLB (Materials) all exhibited strong bearish patterns over the two-day period. XLI and XLB each posted two consecutive bearish candles, with the second day showing lower highs, lower lows, and lower closes on increased volume. These patterns make a continuation of downward momentum highly likely for both sectors. XLF demonstrated particularly pronounced weakness, with a substantial gap down on the second day, closing near its low on significantly elevated volume, indicating that further significant declines are highly likely. XLU presented a notable bearish reversal, with a strong bullish candle on the first day followed by a decisive bearish engulfing pattern on the second, closing at its lows on increased volume. This constitutes a highly likely setup for continued downward pressure.
The remaining sectors present more nuanced technical pictures. XLY (Consumer Discretionary), despite a bullish close on the second day relative to its open, recorded a net decline over the two days, with lower highs and lower lows. While some buying interest emerged from the low, the prevailing pattern makes further testing of recent lows likely, though a short-term consolidation or minor bounce holds a roughly even chance. XLC (Communication Services) opened with a gap down on the second day and closed lower than the first day’s close, despite an internal bullish candle. This implies underlying weakness, making continued downward pressure likely, and a retest of its second-day low probable. Lastly, XLE (Energy) experienced a net two-day decline, forming a bullish reversal candle on the second day after gapping down to a new low. Given the preceding weakness, a clear directional bias is not strongly established for XLE; a roughly even chance exists for either a slight further decline to retest recent lows or a minor rebound as consolidation unfolds.
In conclusion, the market breadth for this two-day period suggests a prevailing bearish bias. While certain growth and defensive sectors are demonstrating robust upward trends, the significant number of sectors exhibiting strong bearish continuation or reversal patterns, especially with increased volume, indicates that a majority of the market is likely to face continued downside risks in the immediate term. Vigilance is advised for those sectors with ambiguous signals, as their resolution will influence broader market sentiment.
Performance Heatmap (XLP, XLRE, XLI, XLU, XLV, XLY, XLF, XLB, XLE, XLC, XLK)
Generated for 2days timeframe analysis
XLY vs XLP
The XLY/XLP ratio, a key gauge of Consumer Discretionary performance relative to Consumer Staples, has demonstrated a moderate downward trend over the past seven days, declining by 3.25%. From its observed peak of 3.0389 on October 8th, the ratio experienced an initial sharp decline to a low of 2.9289 by October 10th. This movement indicates a period of XLP outperformance, suggesting a shift towards more defensive sectors. Following this initial drop, the ratio saw a rebound to 3.0043 on October 13th, only to subsequently resume its decline. The ratio settled at 2.9401 on October 17th, positioned near the lower end of its 7-day range, specifically at the 10th percentile, reinforcing the recent defensive bias.
Based on the observable price action, a continuation of the downward trend in the XLY/XLP ratio is likely. The sequence of lower highs and lower lows from the October 13th peak (3.0043) to the current level (2.9401) suggests persistent pressure on Consumer Discretionary relative to Consumer Staples. The previous 7-day low of 2.9289 represents the immediate technical support level. It is highly likely that this level will be tested in the near term should the prevailing downward momentum persist. The moderate strength of the trend, coupled with relatively low volatility (0.0014), implies a measured, rather than erratic, decline.
While a continued decline appears likely, alternative scenarios warrant consideration. A short-term rebound from current levels is plausible given the ratio’s proximity to its 7-day low, where some buyers of XLY or sellers of XLP might emerge. However, without a significant breakout above the average ratio of 2.9788, a sustained reversal back towards the initial high of 3.0389 is unlikely. The current technical posture suggests that XLY is facing headwinds against XLP, favoring a defensive stance for the immediate future based solely on this ratio’s short-term price action.
Technical Analysis: XLY/XLP Ratio (90-Day View)
Our analysis of the XLY/XLP ratio over the past 90 trading days reveals a distinct upward trend, indicating a period of sustained outperformance for Consumer Discretionary (XLY) relative to Consumer Staples (XLP). The ratio initiated this period around 2.647 on June 10th and has since advanced by approximately 11.07%, reaching 2.940 as of the latest data point on October 17th. This upward movement is further characterized by the “strong” trend strength identified within the provided data. Throughout this interval, the ratio has traversed a significant range, establishing a low of 2.607 on June 12th and a high of 3.097 on October 6th. The current ratio stands at 2.940, positioning it in the upper third of its 90-day range, with a relative position of 0.6795. This overall ascending channel suggests that market participants have been, on balance, favoring growth-oriented discretionary sectors over defensive staples.
Examining the more recent price action, the ratio experienced a notable peak at 3.097 on October 6th, which has subsequently acted as a resistance level. Following this high, the ratio has undergone a pullback, declining to its current level of 2.940. This retracement from the period’s apex suggests either profit-taking or a temporary shift in sentiment regarding the relative strength of XLY. Based on this recent decline from the high, it is likely that the ratio may test further support levels in the immediate term. Potential areas of interest include the psychological level around 2.90 and, more significantly, the average ratio for the period, which sits at 2.828. A move towards the average ratio would represent a more substantial correction within the established uptrend.
Considering alternative scenarios, the current positioning of the ratio, above its 90-day average but below its recent high, presents a roughly even chance for either a consolidation phase or a deeper pullback. Should the ratio find support at or near the 2.90 level and resume its upward trajectory, it is likely to retest the October 6th high of 3.097. A decisive break above this level would signal a continuation of the strong upward trend and establish new higher targets. Conversely, a failure to hold above the average ratio of 2.828 could indicate a more pronounced correction, with the potential to revisit prior support zones established during earlier periods of consolidation, though such a decline below the average is currently deemed less likely given the sustained upward trend strength observed over the 90 days. The volatility of 0.0218 suggests that while movements can be dynamic, the overarching trend has been relatively consistent.
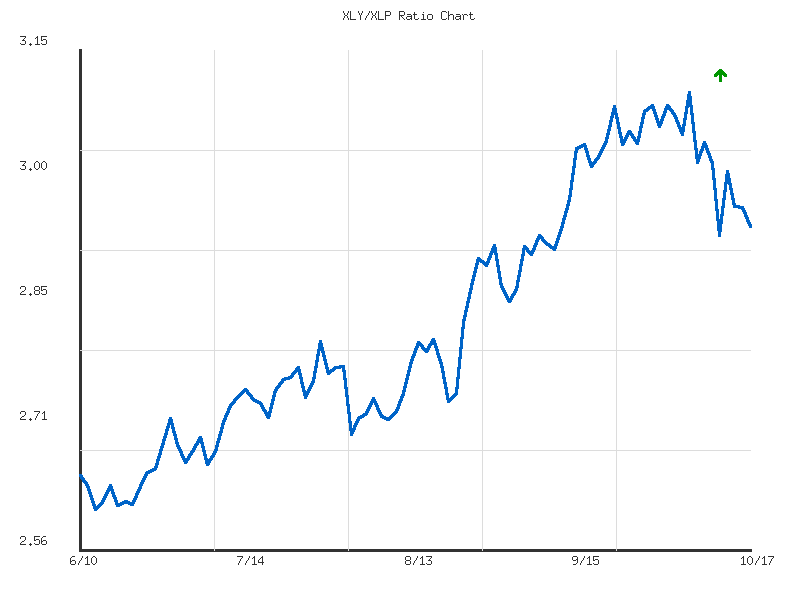
Ratio Analysis: XLY/XLP
Generated for 90days timeframe analysis
Equity Breadth
Analysis of the provided S&P 500 breadth data reveals a notable deterioration followed by an attempted recovery over the past seven days. Initially, on October 8th, a robust 55.29% of S&P 500 members traded above their 50-day moving average (SPXA50R), while 60.88% were above their 200-day moving average (SPXA200R). However, by October 10th, both indicators experienced a significant decline, with SPXA50R falling to 33.73% and SPXA200R to 50.30%. This sharp contraction in participation, particularly the 50-day average dropping well below the 50% threshold, is likely indicative of a broad-based technical weakening in the short-to-medium term within the S&P 500. The approach of the SPXA200R to the critical 50% level, which often acts as a demarcation line between bullish and bearish long-term market participation, is a key observation from this period.
Following this sharp decline, both breadth indicators showed signs of a rebound. From October 10th to October 14th, SPXA50R recovered notably from 33.73% to 48.10%, while SPXA200R also climbed from 50.30% to 57.68%. This recovery, maintaining the SPXA200R above the 50% threshold, suggests that the market experienced renewed buying interest or a stabilization phase after the initial sell-off. The subsequent flat reading on October 15th for both indicators implies a temporary consolidation or pause in this upward momentum following the recovery bounce. It is likely that this rebound prevented a more significant breakdown in overall market breadth, particularly keeping the long-term participation above the critical 50% mark.
The most recent data point, dated October 17th, shows a slight pullback in both metrics after their recent recovery. SPXA50R edged down to 44.71% from 48.10%, and SPXA200R declined to 55.29% from 57.68%. This modest decline following the rebound suggests a potential loss of upward momentum or renewed selling pressure. While the long-term breadth (SPXA200R) remains above 50%, indicating that a majority of S&P 500 components are still in longer-term uptrends, the short-to-medium term breadth (SPXA50R) remains below 50%. The current state suggests that less than half of the S&P 500 members are above their 50-day moving averages, which is a condition typically associated with weaker short-term market dynamics.
The aggregate trend over the seven days for both indicators is downward, with SPXA50R declining from 55.29% to 44.71% and SPXA200R from 60.88% to 55.29%. This overall depreciation in the number of S&P 500 stocks trading above their key moving averages is likely indicative of a market undergoing a period of consolidation or mild correction. The similar patterns observed in both the 50-day and 200-day breadth metrics—initial sharp decline, subsequent recovery, and a recent minor dip—suggest a broad-based market dynamic rather than isolated sector weakness. An alternative scenario is that the recovery from October 10th to 14th was merely a relief rally within a broader weakening trend. Given the recent modest pullback, it is roughly an even chance that the market breadth could either consolidate around current levels or experience further deterioration in the immediate term. Continued monitoring of these breadth indicators is essential to confirm whether the recent recovery was a temporary bounce or the start of a more sustained improvement.
SPY Daily
The price action over the last seven trading days indicates a notable shift in short-term market dynamics within an otherwise established longer-term uptrend. On 2025-10-10, SPY experienced a significant decline, closing at 653.02 with exceptionally high volume (156.6 million), which is likely indicative of substantial selling pressure. This sharp move caused the price to drop below the 50-day Exponential Moving Average (EMA_50), which was around 651.52 on that day, a short-term bearish signal. The 14-day Relative Strength Index (RSI) also plummeted from 65.75 to 41.81, moving from a neutral to a near-oversold condition, confirming a rapid loss of upward momentum. In the days following this decline, SPY has shown a recovery, closing higher on 2025-10-13, 2025-10-15, and slightly lower on 2025-10-14, but critically, it has reclaimed territory above the EMA_50. The most recent trading day, 2025-10-17, closed at 664.39, creating a bullish candle body but featuring a substantial upper wick, suggesting that while buyers were active, selling pressure emerged near the high of the day (665.755). This recent rebound, albeit on robust volume in the 70-95 million range, has not yet fully negated the prior week’s steep correction.
From a broader perspective, the EMA_50 (currently 653.33) remains above the EMA_200 (currently 612.77), and both moving averages are maintaining an upward trajectory. This configuration strongly suggests that the underlying long-term trend for SPY remains bullish. The price is currently trading above both EMAs, reinforcing the prevailing uptrend. Immediate support is likely to be found at the 652.84 level, which was the low of the significant sell-off on 2025-10-10 and also aligns closely with the current EMA_50. A more robust support zone exists near the 647-649 area, which previously acted as resistance in late August and early September and would represent a retest of a breakout level if revisited. On the upside, the primary resistance zone is approximately between 671-674, corresponding to the highs observed from 2025-10-03 to 2025-10-09, which the market was unable to sustain before the recent correction.
Considering future price action, a bullish case would involve SPY successfully consolidating above the 660 level and subsequently breaking through the 671-674 resistance zone with increasing volume. This outcome is plausible, particularly if the rebound from the 2025-10-10 low is interpreted as a healthy shakeout, and the RSI can convincingly move back above 60. A bearish scenario, however, is equally probable if SPY fails to surmount the 671-674 resistance and subsequently breaks below the critical 652.84 support, especially if accompanied by elevated volume. Such a move would likely lead to a test of the 647-649 support area, and potentially the rising EMA_200. A neutral outlook suggests price oscillating between the 652.84 support and 671-674 resistance, with RSI generally remaining in the 45-60 range, indicating a period of consolidation as the market digests recent events.
Technical sentiment analysis reveals a mixed picture. The sharp, high-volume decline on 2025-10-10 strongly implies a temporary shift in short-term market psychology towards caution or fear, possibly driven by profit-taking after an extended run that saw the RSI in overbought territory. However, the subsequent rebound, also on relatively strong volume, suggests that buyers were keen to “buy the dip,” preventing a deeper correction and affirming confidence in the broader bullish trend. The long upper wick on the 2025-10-17 candle, despite the positive close, might be an early indicator of renewed seller interest at higher prices, hinting that further advances may be contested. Thus, collective investor psychology appears to be in a transitional phase, balancing immediate concerns following the recent volatility with underlying confidence in the longer-term upward trajectory, contributing to roughly even chances for either bullish continuation or a period of sideways consolidation.
Technical Analysis of SPY (June 10, 2025 - October 17, 2025)
The SPY ETF has experienced a generally ascending trend over the past 90 days, punctuated by two notable high-volume pullbacks. From mid-June through late July, SPY demonstrated a robust uptrend, climbing from the low 590s to peak around -. This advance saw the 14-day Relative Strength Index (RSI) frequently venture into overbought territory (above 70), confirming strong buying momentum. This bullish phase culminated in a sharp, high-volume decline on July 31st and August 1st, where the price dropped from approximately to , with trading volumes surging to over 100 million shares and peaking at 140 million on August 1st. This significant volume on the decline strongly suggested a shift in short-term sentiment and the introduction of substantial selling pressure.
Following the early August correction, SPY embarked on another recovery phase, systematically regaining lost ground and establishing new all-time highs. This rally extended from early August to early October, pushing prices above and eventually reaching an apex around by October 8th. The RSI mirrored this ascent, again moving into overbought conditions (above 70) during mid-September, indicative of sustained upward momentum. Volume during much of this recovery period was moderate, with occasional spikes correlating with upward price movements, but generally lower than the peak selling volume observed on August 1st. The consistent establishment of higher highs and higher lows throughout this period points to a well-defined bullish trend that was in place until the most recent data points.
The most recent price action, however, presents a significant short-term shift. After reaching its high around on October 8th, SPY experienced a sharp, high-volume sell-off on October 10th, dropping approximately 3% from .16 to .02. This decline was accompanied by the highest volume recorded in the entire 90-day period (over 156 million shares), which strongly suggests a capitulation event or a sudden influx of aggressive selling. The 14-day RSI plunged from ~65 to ~41, moving from neutral to the brink of oversold conditions, confirming the intensity of the selling pressure. This specific candlestick pattern and volume profile are highly likely indicative of a significant resistance level being established around , and a shift in short-term market dynamics from bullish to potentially bearish or consolidative.
In the immediate term, SPY has shown a modest bounce from the October 10th lows, trading in the - range through October 17th. This recovery has occurred on slightly reduced volume compared to the major sell-off, and the RSI has recovered to approximately 53.25, indicating a return to neutral momentum. While this bounce suggests some buying interest at lower levels, it is unlikely to signal a strong resumption of the prior uptrend without a more decisive push higher on increasing volume. It is highly likely that the - price zone, which acted as a support area before the October 10th plunge, will now function as a significant resistance level. A retest of the support level is likely if SPY fails to decisively clear this overhead resistance in the coming sessions. The absence of MACD data in the provided information precludes an assessment of trend strength and potential crossovers from that indicator, thereby limiting the scope of this momentum analysis. Therefore, our conclusions are based exclusively on price action, volume, and RSI indicators.