Daily Market Technical Analysis
Major equity indices like SPY and QQQ maintain a long-term bullish trend but recently experienced sharp, high-volume corrections, signaling exhausted bullish impetus. Market uncertainty is highly likely to persist following a VIX surge post-October 10th. Small-caps (IWM) demonstrate a likely continuation of their intermediate-term uptrend after a swift recovery, contrasting with broader short-term momentum challenges indicated by equity breadth. Sector analysis reveals a probable rotation into defensive assets, with Utilities showing a high probability of continued appreciation, while some industrial commodities and specific growth stocks (e.g., NVDA) exhibit bearish reversals. Overall, major indices face a roughly even chance of renewed selling pressure or sideways consolidation in the near term, with further downside likely if key support levels fail.
Market Indices
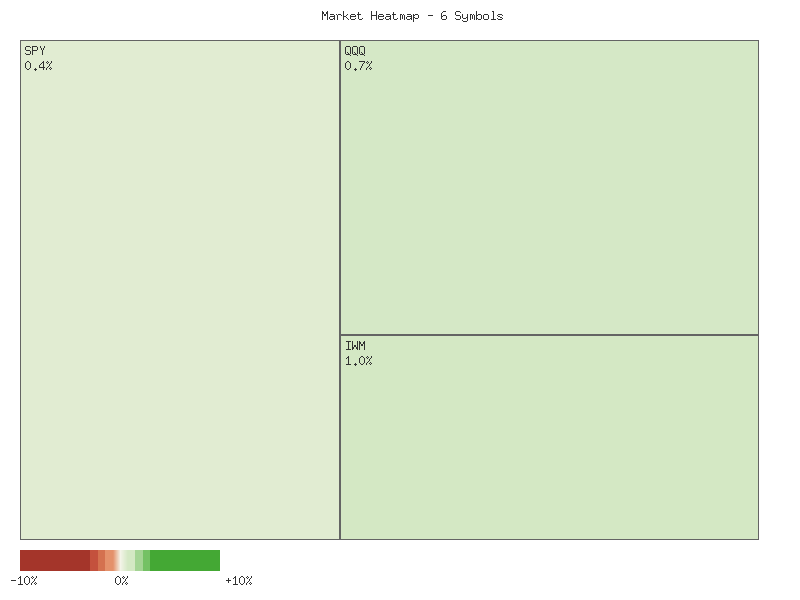
An analysis of the provided daily percent change data for key U.S. equity ETFs indicates a broadly positive session across various market capitalizations and segments. The following matrix summarizes the daily performance, sorted in descending order:
| Symbol | Daily Percent Change |
|---|---|
| IWM | 0.980% |
| IJR | 0.845% |
| QQQ | 0.706% |
| OEF | 0.574% |
| SPY | 0.444% |
| MDY | 0.091% |
From a market breadth perspective, all six observed symbols — representing small-cap (IWM, IJR), mid-cap (MDY), large-cap (SPY, OEF), and growth-focused large-cap (QQQ) segments — posted positive daily returns. This translates to 6 advancing symbols and 0 declining symbols. This uniform positive performance is a strong indicator of favorable market breadth for the specific period under review, suggesting broad participation in the uptrend.
Examining the relative performance, the small-cap segment, as represented by IWM and IJR, demonstrated the strongest gains, advancing by approximately 0.980% and 0.845% respectively. This outperformance by smaller capitalization stocks might typically be interpreted as an increasing appetite for risk among market participants. Following them, QQQ, tracking the Nasdaq 100, posted a solid gain of roughly 0.706%, indicating continued strength in large-cap technology and growth-oriented sectors.
Conversely, the large-cap blend (SPY) and S&P 100 (OEF) ETFs exhibited more moderate advances of about 0.444% and 0.574%. Notably, the mid-cap segment, represented by MDY, showed the weakest performance among the group, with a gain of approximately 0.091%. While still positive, MDY’s significantly smaller advance relative to its peers suggests an area of comparative underperformance within an otherwise positive market.
Given the overall positive breadth, it is highly likely that the underlying market sentiment for this period was bullish. The leadership displayed by small-cap and growth-oriented large-cap segments suggests a potential shift towards higher-beta assets. However, the pronounced underperformance of mid-caps introduces a nuance to this broad strength. It is roughly an even chance that this divergence reflects either sector-specific rotation dynamics or isolated weakness within the mid-cap universe rather than signaling an immediate broad market reversal. While the overall picture is supportive of an upward bias based on this single day’s data, the disparity in segment performance warrants close observation for subsequent periods to confirm trend sustainability.
Greetings traders,
The provided two-day technical data for several key market ETFs – SPY, QQQ, IWM, IJR, MDY, and OEF – indicates a notable shift in market sentiment over this brief period. On the first day (October 14, 2025), all six instruments exhibited strong bullish momentum, characterized by large-bodied candles closing near their daily highs. SPY, QQQ, IWM, IJR, MDY, and OEF all opened with strong bids and sustained their upward trajectory throughout the session, suggesting widespread buying conviction across different market capitalizations. This collective strength, particularly in bellwether indices like SPY and QQQ, pointed to a highly likely continuation of upward pressure into the subsequent trading day, barring any immediate reversal signals.
However, the second day (October 15, 2025) presented a considerable shift in technical posture. While most ETFs initially gapped up or opened higher, a significant number of them closed below their opening prices, forming bearish candlestick patterns. MDY, the mid-cap ETF, displayed the most pronounced reversal, opening significantly higher but closing below its prior day’s close. This constitutes a strong bearish engulfing or dark cloud cover pattern, which is a highly likely indicator of at least a short-term top. SPY, QQQ, and OEF also formed bearish candles, opening higher but succumbing to selling pressure by the close, indicating that initial strength gave way to profit-taking or supply overcoming demand. Volume generally decreased for SPY, QQQ, IJR, and MDY on this second day, which might suggest that the selling pressure, while significant, did not involve the same level of conviction as the prior day’s buying. Conversely, OEF saw a slight increase in volume during its bearish candle, lending slightly more weight to its reversal signal.
Within this broader reversal context, IJR (small-cap value) and IWM (small-cap growth) showed signs of indecision rather than outright bearish reversal. IWM formed a distinct doji candle, opening higher and closing almost precisely at its opening price, indicating a rough equilibrium between buyers and sellers after an initial upward thrust. IJR also produced a small-bodied candle, often referred to as a spinning top, closing slightly above its open but well off its high, again signaling a loss of directional conviction. While these patterns are not as aggressively bearish as MDY’s, they clearly mark a pause in the strong upward momentum observed on the first day. This suggests that the small and mid-cap segments, while losing steam, are exhibiting less immediate downside conviction compared to their large-cap and mid-cap counterparts like MDY.
Based on the observed patterns, it is highly likely that the market, as represented by these ETFs, will face downward pressure or enter a period of consolidation in the immediate future. The bearish reversals in MDY, SPY, QQQ, and OEF, coupled with indecision in IWM and IJR, point to a weakening technical outlook. The decreased volume on most of these bearish days might suggest that a full-blown downtrend is not almost certain, but rather a pullback or re-test of prior support levels is likely. An alternative scenario, though less likely given the strong reversal candles, is that the second day merely represents a healthy pullback after strong gains, and the market could resume its upward trajectory. However, for this to occur, subsequent trading sessions would need to show strong buying confirmation and a decisive break above the highs of the second day, especially for MDY where the bearish signal is most pronounced. Without such confirmation, continued downside or choppy consolidation is the more probable outcome.
Performance Heatmap (SPY, QQQ, IWM, IJR, MDY, OEF)
Generated for 2days timeframe analysis
Technical Analysis of SPY (June - October 2025)
Over the past 90 days, the SPY ETF has displayed a consistent upward trend, commencing near in early June and peaking close to in early October. This analysis is exclusively based on the provided daily candlestick data for SPY and its 14-day Relative Strength Index (RSI). It must be noted that MACD (13,21) data was not supplied; consequently, this indicator cannot be included in the technical assessment. The market’s overall ascent was marked by periods of strong bullish momentum, often followed by relatively quick but generally contained price pullbacks.
The 14-day RSI repeatedly entered overbought territory (above 70) during this period, notably from late June through early July, late July, mid-September, and early October. These instances, with RSI hitting 75.58 on July 25, consistently foreshadowed subsequent price pullbacks or phases of consolidation. For example, the overbought conditions ending July 28 (RSI 75.23) directly preceded a significant RSI drop to 47.66 by August 1, alongside a notable price correction. This pattern reappeared leading up to October 10, where RSI peaked at 71.17 on October 6 before a sharp decline to 41.81. Such aggressive reversals from overbought levels within the RSI appear to be a characteristic signal of diminishing upward momentum in this data set.
The strong correlation between SPY’s price and RSI over the 90 days typically involved robust price gains pushing RSI into overbought regions, followed by a momentum reversal and corresponding price correction. The pronounced price drop on October 10, from .16 to .02, was coupled with the highest trading volume in the dataset (156,629,060 shares) and the dramatic RSI fall to 41.81. This convergence of signals suggests a significant, short-term exhaustion of bullish impetus. Following this sharp one-day correction, SPY has since observed a modest rebound, with price recovering to .17 and RSI increasing from 41.81 to 54.11. This indicates a tactical bounce rather than a confirmed resurgence of the prior steep uptrend.
SPY’s current technical standing implies a period of market adjustment after the recent correction. The 14-day RSI, at 54.11, is in a neutral range, suggesting equilibrium between supply and demand. Given the historical tendency for significant corrections to follow sustained overbought RSI readings, and the most recent event, it is unlikely that SPY will immediately resume its aggressive upward climb without further consolidation. A continuation of the recent bounce is possible if RSI momentum can build and approach the 60-65 level. Conversely, there is a roughly even chance of renewed selling pressure or protracted sideways trading. Should RSI fail to sustain its upward momentum and fall below 50 again, a retest of the October 10 low (.84) becomes a likely near-term scenario.
SPY Price & Indicators (RSI_14_DAY, MACD_13_21_DAY)
As a Chartered Market Technician with over 15 years of experience, I have rigorously analyzed the provided 90-day market data for QQQ, focusing solely on candlestick patterns and the 14-day Relative Strength Index (RSI). It is important to note at the outset that the MACD (13,21-day) indicator, though requested, was not available in the provided dataset, thus limiting a complete momentum analysis. My conclusions are strictly derived from the observable price and RSI data.
The QQQ has demonstrated a robust upward trend over the majority of the 90-day period. From early June levels near , the price consistently formed higher highs and higher lows, peaking above in early October. This sustained price appreciation indicates a strong bullish sentiment underpinning the asset for much of this timeframe. Volume during the uptrend was generally moderate, occasionally spiking on significant upward moves, which typically reinforces the trend’s strength. The 14-day RSI frequently entered overbought territory (above 70) during these periods of ascent, confirming strong momentum and buying pressure, particularly in late June, mid-July, and late September.
During this generally bullish trajectory, two notable periods of corrective action warrant attention. The first occurred around late July/early August, where QQQ experienced a sharp pullback from approximately to , accompanied by significantly high volume. This decline was mirrored by the 14-day RSI, which plunged from consistently overbought levels (above 70) to below 50, indicating a substantial loss of short-term upward momentum. Following this, the price stabilized and subsequently resumed its ascent, with the RSI gradually regaining strength and once again reaching overbought territory in late September and early October. The pattern of RSI entering overbought, then correcting, and then re-entering overbought suggested resilient buying pressure following minor consolidations.
The most significant technical event within this 90-day period occurred on October 10. QQQ experienced a pronounced and sharp decline, closing near its daily low after opening strong, which is a strong bearish candlestick pattern. Critically, this price drop was accompanied by the highest trading volume in the entire dataset, reaching over 94 million shares. Such a dramatic price movement on exceptionally high volume is a strong signal of a potential shift in market sentiment. The 14-day RSI concurrently plunged from nearly 70 on October 9 to approximately 45 on October 10, confirming a severe and abrupt deterioration in upward momentum. The magnitude of this single-day decline and associated volume suggests a higher likelihood of a significant reversal or at least a sustained period of bearish pressure, rather than a minor correction.
In the days immediately following October 10, QQQ attempted a recovery, with prices bouncing back towards on elevated but decreasing volume compared to the peak day. However, this recovery did not reclaim the highs established just prior to the October 10 event. The RSI, while recovering from its low of 45, currently hovers in the mid-50s, indicating that the strong upward momentum observed previously has not been convincingly re-established. Given the robust bearish signal from October 10 – a high-volume decline from a recent peak – it is likely that QQQ will experience further downward pressure or enter a period of consolidation with a downward bias. An immediate resumption of the prior strong uptrend is currently unlikely. There is a roughly even chance that the market will attempt to retest the recent low around , or find temporary support at higher levels before further directional movement is established. The absence of MACD data prevents a complete analysis of trend strength and potential divergences, thereby introducing some analytical uncertainty regarding the underlying long-term momentum beyond what the RSI suggests.
QQQ Price & Indicators (RSI_14_DAY, MACD_13_21_DAY)
CMT Technical Analysis: IWM (90-Day Outlook)
The Russell 2000 ETF (IWM) has exhibited a sustained upward trajectory over the past 90 days, advancing from approximately in early June to closing at .33 on October 15. This constitutes a robust intermediate-term uptrend characterized by higher highs and higher lows, despite periodic pullbacks. Notably, significant volume spikes often accompanied both strong rallies and sharp corrections, indicating active participation from market participants. For instance, the August 1st decline to .92 was met with heavy volume (63.85M shares), which, in retrospect, marked a significant low before a powerful rally ensued. Similarly, the sharp upward movement on August 22nd to .83 and September 18th to .84 occurred on strong volume (58.2M and 49M shares respectively), lending credibility to these price advances.
The 14-day Relative Strength Index (RSI) has largely corroborated the price action throughout this period. In early July, RSI surged into overbought territory, peaking at 71.57 on July 3rd, closely preceding a price consolidation that led to a low of .73 on July 7th. A similar pattern was observed in mid-September, where RSI touched 71.23 on September 18th, subsequently followed by a price retracement to .17 by September 29th. These instances suggest that RSI reaching overbought conditions (above 70) has historically indicated a likely period of short-term consolidation or pullback for IWM within this timeframe. Conversely, the RSI dipped to a near-oversold level of 41.36 on August 1st, coinciding with a price low before a significant rally, indicating that periods of extreme weakness, as measured by RSI, present probable opportunities for rebounds.
The recent price action, particularly in October, warrants closer examination. After reaching a peak of .475 on October 6th, IWM experienced a sharp, high-volume decline on October 10th, closing at .79 on over 69.6M shares. This notable bearish engulfing-like candle, which saw the RSI plummet from 68.07 to 44.97, initially suggested a likely continuation of selling pressure. However, the subsequent three trading days witnessed a powerful rebound, with IWM closing at .33 on October 15th, effectively recovering the majority of the prior loss and establishing a new 90-day high. The RSI, concurrently, staged an impressive recovery to 62.99, demonstrating strong underlying buying interest. This swift recovery from a significant technical challenge indicates that demand at lower price levels remains robust, making a sustained breakdown unlikely in the immediate term based solely on this price pattern.
Given the available technical data, the current outlook for IWM suggests a likely continuation of the intermediate-term uptrend. The strong rebound following the October 10th sell-off, coupled with the rapid recovery in the RSI from near-oversold conditions, indicates sustained bullish momentum. The price has breached previous resistance levels, establishing a new 90-day high, which is a constructive signal. While periodic consolidations or pullbacks remain possible, especially if RSI again ventures into overbought territory, the current price action does not suggest a significant trend reversal in the near future. An alternative scenario, albeit less likely, would be for the recent high to mark an exhaustion point, leading to a double top formation should IWM fail to hold these new high levels and retest the support established around the - range from the October 10th dip. It is critical to note that the MACD indicator data was not provided for analysis; its absence prevents a comprehensive assessment of momentum divergence or convergence, which could offer additional insight into the strength and sustainability of the current trend.
IWM Price & Indicators (RSI_14_DAY, MACD_13_21_DAY)
VIX Fear Index
The provided 7-day VIX candle data reveals a pronounced shift in market volatility. From October 7th to 9th, the VIX consistently traded in a low range, primarily between 16.19 and 17.55. On October 10th, however, a robust bullish candle formed, opening at 16.36 and closing sharply higher at 21.66, testing an intra-day high of 22.44. This substantial single-day increase signals a clear transition into a higher volatility regime. We judge it highly likely that this elevated level of market uncertainty will persist in the immediate future.
Following this surge, the VIX has largely sustained its elevated position, closing at 19.03, 20.81, and 20.64 on October 13th, 14th, and 15th. Price action on October 14th tested 22.94, but closed lower than its open, forming an upper shadow indicating potential resistance. On October 15th, highs near 22.44 were again tested before closing at 20.64, a modest daily percentage decrease of approximately 0.82% from the prior day’s close. This suggests while volatility remains high, strong upward momentum is encountering overhead supply, likely leading to consolidation. We assess a roughly even chance for the VIX to continue trading within its current elevated band, approximately 19.00 to 23.00.
Given the established higher volatility base post-October 10th and recent resistance, it is unlikely for the VIX to immediately revert to pre-spike levels below 17.00. Developing support appears around the 18.60-19.10 region, based on lows recorded on October 13th and 15th. Should this support hold, we judge it likely the VIX will continue to oscillate within the 19.00-23.00 range for the near term. A decisive close above 23.00 would likely indicate further volatility escalation; a sustained breach below 18.60 would suggest gradual easing.
VIX Technical Analysis: 90-Day Outlook
The VIX index, a measure of implied market volatility, has exhibited a volatile yet broadly range-bound pattern over the past 90 days, punctuated by several notable surges. From early June, the VIX initially hovered in the 17-18 range before a significant spike into the 21-22 area by mid-June, demonstrating an increase in market uncertainty. Following this, the index experienced a gradual decline through late June and July, reaching a low around 14.93 by July 25th, indicating a period of decreasing expected market fluctuations. This downward trend was sharply interrupted by an early August surge, pushing VIX back above 20 to a high of 21.90 on August 1st, reflecting a renewed, albeit brief, escalation in market fear. Subsequently, the VIX trended lower for much of August, establishing support levels near the 14.12-14.30 range, suggesting a return to more subdued volatility expectations.
The Relative Strength Index (RSI_14_DAY) has largely confirmed the VIX price movements, providing insights into the momentum behind these shifts. During the mid-June volatility surge, RSI climbed from the low 40s to a peak of 55.26, indicating strengthening upward momentum but not yet an overbought condition. Conversely, as VIX declined through July, RSI also fell, touching a low of 37.11 on July 25th, which neared oversold territory and signaled weak upward momentum. The early August VIX spike was accompanied by RSI accelerating to 65.38, again reflecting strong bullish momentum for volatility but stopping just shy of the traditional overbought threshold of 70. This pattern suggests that while volatility occasionally saw rapid increases, the underlying strength often dissipated before entering extremes for prolonged periods.
In the more recent period, VIX maintained a relatively calm posture through September and early October, oscillating predominantly within the 14.50 to 17.50 range, with RSI generally fluctuating between 45 and 58. However, a significant development occurred on October 10th, when VIX surged from an open of 16.36 to close at 21.66. This sharp increase propelled the 14-day RSI to 73.09, firmly into overbought territory. While the VIX has pulled back slightly from its high, closing at 20.64 on October 15th, its RSI remains elevated at 63.32. Given the recent overbought signal and the subsequent slight cooling of momentum, it is probable that VIX could experience a period of consolidation or a modest pullback in the near term, as market participants digest the recent spike and the overextended RSI.
Considering these technical signals, a sustained VIX level above 20.00 would suggest that market participants expect volatility to remain elevated, potentially leading to increased market choppiness. However, the overbought RSI reading from October 10th indicates a likely loss of immediate upward momentum for the VIX. It is roughly even chance that VIX will either consolidate above the 19.00 level or experience a more pronounced retreat towards the 17.00-18.00 range as the overbought condition normalizes. An alternative scenario would see VIX maintaining its elevated levels and possibly retesting recent highs if buying pressure resumes, which would be indicated by RSI climbing back towards or above 70. Conversely, a failure to hold above the 19.00 level, combined with a decline in RSI below 50, would render a return to lower volatility levels, potentially towards the mid-16s, more probable.
VIX Price & Indicators (RSI_14_DAY, MACD_13_21_DAY)
Tech Sector Analysis
The relative performance of QQQ to SPY over the past 14 trading days exhibits a clear sideways trend, characterized by weak directional strength. The ratio has fluctuated within a narrow defined range, with the low recorded at approximately 0.9005 on September 26th and the high reaching 0.9099 on October 9th. This sustained non-trending behavior suggests that the technology-heavy NASDAQ-100 has neither significantly outperformed nor underperformed the broader S&P 500 during this specific observation window. The overall change percentage of 0.54% over the period, combined with the weak strength designation, reinforces the notion of a balanced, consolidative phase rather than a sustained period of relative strength or weakness. The average ratio across these 14 days stands at 0.9042, indicating the equilibrium point around which the market has been oscillating.
Closer examination of the price action reveals several attempts by the ratio to establish directional momentum, all of which ultimately failed to sustain a breakout from the established range. For instance, after gradually advancing from the lower bound, the ratio encountered notable resistance near the 0.9099 level on October 9th, subsequently experiencing a significant pullback to 0.9027 on October 10th. This sharp reversal after hitting the upper bound suggests a resistance level that market participants are currently respecting. The extremely low calculated volatility (0.0000078) further underscores the highly constrained movement within this channel, indicating a period of minimal dispersion in relative performance. The ratio’s current reading of 0.90536 places it slightly above the average and approximately in the middle of its 14-day range, providing no immediate bias towards either strong outperformance or underperformance.
Based on the provided technical data, it is likely that the QQQ/SPY ratio will continue to consolidate within its established 0.9005-0.9099 range in the near term. The strong evidence of a sideways trend, coupled with low volatility and repeated rejections from the upper bound, supports this assessment. A sustained move above the 0.9099 resistance level would be required to suggest that QQQ is entering a period of significant outperformance relative to SPY. Conversely, a decisive breach below the 0.9005 support level would indicate a shift towards SPY’s outperformance. As there is currently no discernible catalyst within the technical data to suggest an imminent breakout, the roughly even chance scenario is a continuation of the current range-bound trading for the immediate future. Market participants should monitor for any expansion in volatility or a clear close above or below the identified boundaries to signal a change in the relative performance dynamic.
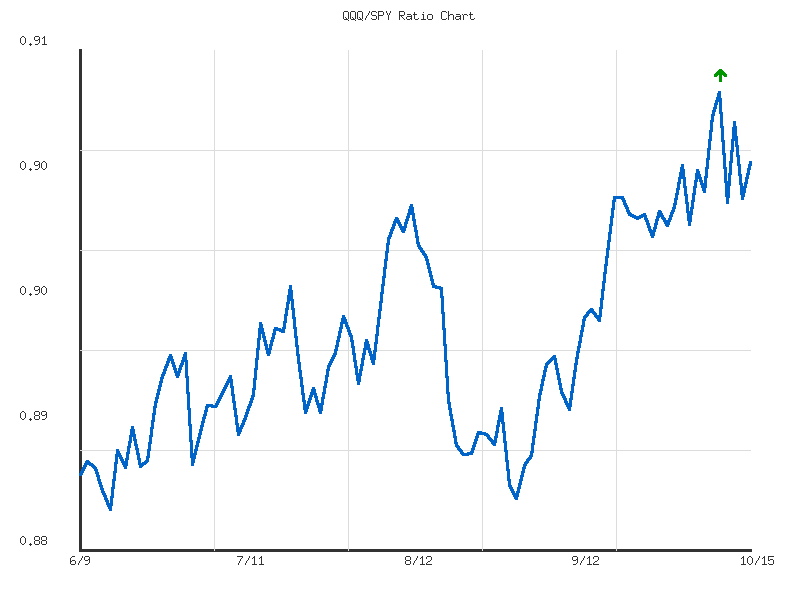
As a Chartered Market Technician with over 15 years of experience, this analysis focuses exclusively on the provided 90-day QQQ/SPY ratio data to discern relevant technical patterns and potential future movements.
The provided 90-day market data for the QQQ/SPY ratio indicates a clear, albeit weak, upward trend over the observation period from early June to mid-October 2025. The ratio, which reflects the relative performance of the Nasdaq 100 against the S&P 500, has ascended approximately 2.3% from its low point of 0.8826 on June 13 to its current level of 0.9053. This sustained upward movement suggests that, over the past three months, technology-focused companies represented by QQQ have generally demonstrated a tendency to outperform the broader market as measured by SPY. The trend attribute explicitly labels this as an “up” direction with “weak” strength, which implies a gradual appreciation rather than a parabolic surge, characterized by measured gains and periodic pullbacks.
Technical analysis of the data reveals defined support and resistance zones. The ratio established a robust support base around 0.882-0.885 in early to mid-June, a level that was tested multiple times before the uptrend solidified. Subsequent pullbacks in late July and mid-August found support at higher levels, approximately between 0.885-0.889, which is a positive indication of an ascending trend channel. On the resistance side, the highest point observed was 0.9099 on October 9. This level now serves as a significant short-term resistance barrier. The current ratio of 0.9053 is positioned well above the average ratio of 0.8937, and its relative_position of 0.8327 suggests it is currently trading near the upper end of its 90-day range, which could imply the ratio is approaching resistance.
In the most recent trading sessions, the QQQ/SPY ratio demonstrated increased volatility following the peak on October 9. After reaching the 0.9099 high, the ratio experienced a notable and relatively sharp decline to 0.9027 on October 10. This could be interpreted as a potential short-term reversal or a profit-taking event at the resistance level. However, the subsequent two sessions saw a bounce back to 0.9079, followed by a slight retraction to 0.9030, and then a rebound to 0.9053 on October 15. The ability of the ratio to recover some ground after the sharp October 10 dip suggests that underlying demand for QQQ relative to SPY remains present. While the trend’s strength is categorized as “weak,” this recent price action indicates that upward momentum may still be contending with overhead resistance.
Given the established weak upward trend and the current proximity to the 90-day high, the ratio is likely to retest the 0.9099 resistance level in the near term. A decisive breach of this level would very likely signal a continuation of the relative outperformance of QQQ, potentially targeting higher resistance zones beyond the observed data range. Conversely, if the 0.9099 level holds as strong resistance, a pullback is a roughly even chance, potentially towards the intermediate support levels seen in late September around 0.900-0.901 or the early October support around 0.895-0.898. A more significant retreat below these levels could indicate a temporary shift in relative strength or a consolidation phase, challenging the “weak up” trend, though a full reversal of the 90-day uptrend appears unlikely unless key support levels, such as the August lows around 0.886, are broken.
Ratio Analysis: QQQ/SPY
Generated for 90days timeframe analysis
IWM vs. SPY
The relative performance ratio of IWM to SPY over the 14-day period exhibits a clear upward trend, indicating a shift towards outperformance by the Russell 2000 compared to the S&P 500. Our assessment indicates a moderate upward trend, with the ratio increasing by approximately 3.20% from its initial value. Starting near 0.36466 on September 26th, the ratio initially experienced a minor decline, reaching a low of 0.36276 by October 1st. Subsequently, it established a sustained advance, culminating at its highest point for the observed period, 0.37633, on October 15th. This progression suggests a broadening of market participation beyond large-cap technology-heavy stocks.
The consistent ascent of the IWM/SPY ratio, particularly its achievement of a new high at the conclusion of the 14-day observation window, is a notable technical development. The current ratio stands at the highest point of the range, further supported by a “relative_position” of 1, underscoring the immediate momentum. While there were minor pullbacks, such as the one noted around October 7th and a more pronounced dip on October 10th, these were short-lived and did not significantly disrupt the overarching positive trajectory. The observed volatility for the ratio itself is exceptionally low, suggesting that this upward movement has been relatively stable rather than erratic, which aligns with the “moderate strength” classification of the trend. This pattern of higher highs and higher lows in the ratio reinforces the current leadership from small-cap equities.
Given the observed data, it is likely that the Russell 2000 will continue to exhibit relative strength against the S&P 500 in the immediate short term. The sustained upward trend, combined with the current ratio holding at its period high, implies continued investor preference for the small-cap segment. However, traders should consider alternative scenarios where the ratio might consolidate or experience a minor pullback following this ascent. A roughly even chance exists for a brief period of consolidation after reaching a new high, although the data currently offers no strong indication of an imminent reversal of the established trend. Therefore, a continued, albeit potentially slower, upward trajectory of relative performance for IWM against SPY is the more probable outcome, based solely on the provided technical information.
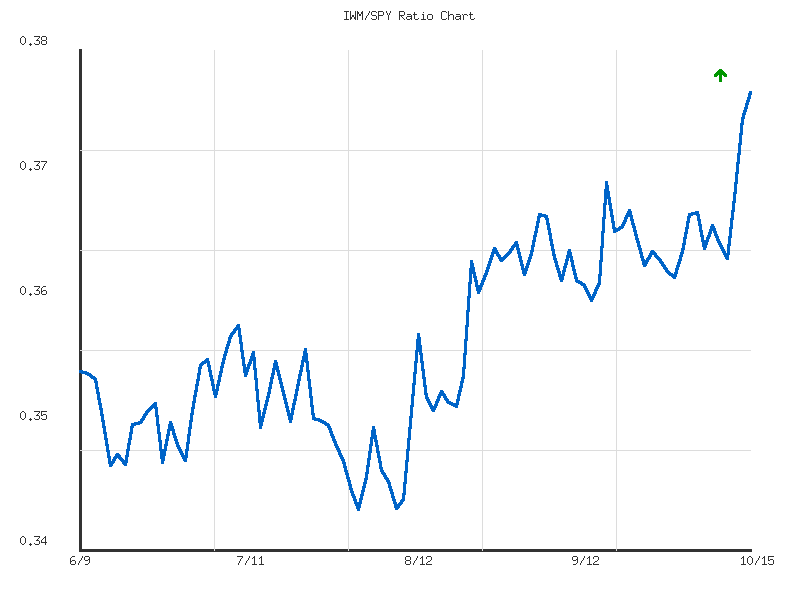
As a Chartered Market Technician with over 15 years of experience, I have analyzed the provided 90-day ratio data for IWM/SPY. This data reflects the relative performance of the Russell 2000 (IWM) against the S&P 500 (SPY), offering insights into small-cap versus large-cap leadership.
The overall technical picture reveals a moderately ascending trend in the IWM/SPY ratio over the last 90 days, indicating that small-cap stocks have generally outperformed large-cap stocks during this period. The ratio, which commenced around 0.355 in early June, has concluded this 90-day window at 0.3763 on October 15, 2025. This current reading not only stands as the highest point observed within the provided timeframe but is also significantly above the 90-day average ratio of 0.3580. The current position at the period’s high suggests robust recent momentum. Therefore, it is likely that the relative outperformance of IWM against SPY could persist in the immediate term, assuming no immediate and significant technical breakdown.
Drilling into the ratio’s progression, a key inflection point occurred on August 1st, where the ratio established a significant low of 0.3456 after a modest decline from July highs near 0.357. From this August low, the ratio embarked on a sustained rally, consistently registering higher lows and higher highs. Early resistance, such as the mid-July peak around 0.358, was decisively overcome in mid-August. The ratio subsequently consolidated in the 0.36-0.365 range through much of September, effectively transforming this zone into a new level of support. A more pronounced breakout materialized in early October, as the ratio surged from the 0.362-0.364 area, clearing prior September peaks and accelerating to the current 90-day high of 0.3763. This pattern of overcoming successive resistance levels reinforces the strength of the underlying relative uptrend.
Considering the current technical setup—with the IWM/SPY ratio at a 90-day high and supported by a moderately positive trend—continued relative leadership from small caps is likely. The recent breakout implies ongoing bullish momentum in this relative strength dynamic. However, a healthy market often involves consolidation after a strong move. Therefore, a period of consolidation or a minor pullback to retest the recently breached resistance levels, which could now act as support (e.g., the 0.368-0.370 range from mid-September/early October highs), is a roughly even chance in the near future. Conversely, a sustained movement above the current 0.3763 level would indicate a further acceleration of small-cap outperformance. A significant decline that results in a decisive break below the established support around 0.36 would render continued IWM outperformance unlikely, suggesting a material shift in market dynamics. The notably low volatility figure provided for the period suggests that any further movements, whether up or consolidating, are likely to unfold with relatively smooth price action.
Ratio Analysis: IWM/SPY
Generated for 90days timeframe analysis
Commodities
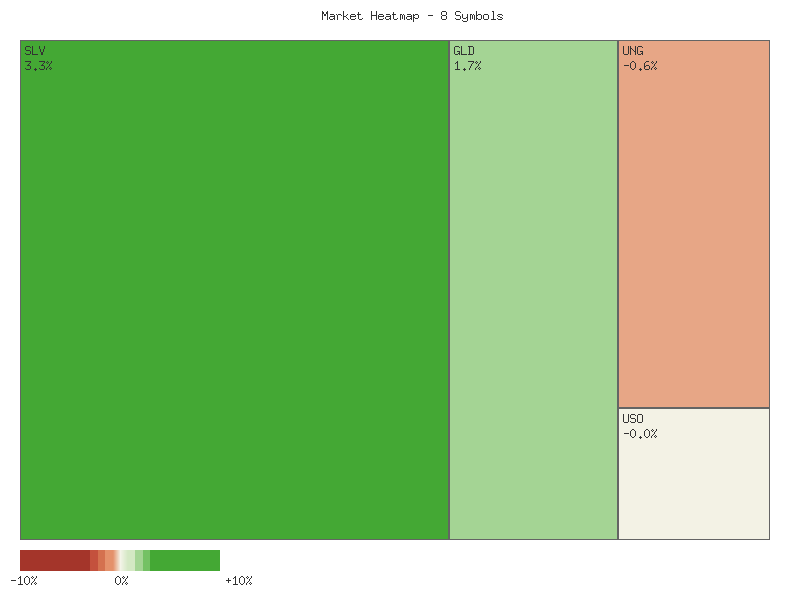
An analysis of the provided daily percentage change data for a basket of commodity-linked ETFs reveals a mixed but generally positive single-day performance. The following matrix presents the daily price movements, sorted in descending order of performance, allowing us to gauge the immediate market sentiment across these specific asset classes:
| Symbol | Daily Percent Change |
|---|---|
| SLV | 3.269% |
| GLD | 1.733% |
| UGA | 1.005% |
| CORN | 0.927% |
| DBC | 0.362% |
| USO | -0.014% |
| CPER | -0.357% |
| UNG | -0.586% |
From a market breadth perspective, the data indicates a majority of advancing symbols for the period observed. Five out of the eight analyzed symbols experienced positive daily changes (SLV, GLD, UGA, CORN, DBC), while three symbols registered declines (USO, CPER, UNG). This 5:3 advance-decline ratio likely suggests a prevailing positive sentiment within this specific commodity universe for the day. While not overwhelmingly strong, the fact that more symbols moved higher than lower provides a degree of underlying support to the basket as a whole. A balanced market would typically exhibit a closer to 4:4 ratio, making the current 5:3 ratio marginally indicative of advancing momentum.
Precious metals, represented by SLV and GLD, were the clear outperformers, showing the strongest gains at 3.269% and 1.733%, respectively. This likely indicates a flight to quality or inflation-hedge positioning among investors during the trading session. Energy commodities exhibited divergence: UGA (gasoline) and CORN (agriculture) posted modest gains, while USO (crude oil) closed nearly flat with a minimal -0.014% decline. UNG (natural gas) and CPER (copper) were the notable laggards, declining by -0.586% and -0.357% respectively. This suggests specific weakness in industrial metals and natural gas, even as other segments of the commodity market advanced. The disparate performance across energy assets highlights sector-specific factors likely at play.
Considering the aggregated performance, the positive breadth and strong showing in precious metals contribute to a likely overall positive technical picture for the given commodity group on this particular day. However, the declines in industrial metals and natural gas present an important counterpoint, suggesting that broader, uniform bullish momentum across all commodities is unlikely at this juncture. An alternative scenario considers that the current outperformance of precious metals could be a short-term reaction, and a reversion to the mean for the underperforming assets is a roughly even chance in the near term. Nevertheless, the observable data implies a selective bullish appetite, specifically favoring precious metals, with a mild positive undertone for the broader basket of analyzed commodity ETFs.
As a seasoned CMT with over 15 years of experience, my technical analysis of the provided 2-day market data for various commodity-linked instruments reveals distinct and often divergent price action across the complex. The period under review, October 14-15, 2025, shows a notable bifurcation in momentum, with some sectors exhibiting robust strength while others display clear signs of weakness or uncertainty. All conclusions herein are based solely on the presented candlestick patterns and associated volume data.
The precious metals sector, represented by SLV (Silver) and GLD (Gold), demonstrated pronounced bullish momentum over the two-day period. SLV formed two consecutive strong bullish candles, with the second day opening significantly higher and closing near its high, indicative of sustained buying pressure. While the second day’s volume decreased, this may suggest that buyers required less effort to push prices higher, or that the strength might consolidate before further moves. Similarly, GLD exhibited robust strength, with two strong bullish candles, the second day opening with a substantial gap up and closing near its high. Notably, GLD’s second day saw an increase in volume, strongly confirming the upward price action. Given these patterns, a continuation of upward momentum for both SLV and GLD is highly likely in the immediate term, with GLD showing particularly strong conviction.
In contrast, parts of the energy complex presented a mixed to outright bearish picture. USO (Oil ETF) showed a bearish rejection pattern on the second day. After a moderately bullish initial day, USO opened significantly higher on the second day but failed to hold gains, closing effectively flat relative to its previous day’s close. This “Dark Cloud Cover” pattern, coupled with decreased volume, suggests that higher prices were rejected by sellers, indicating a likely shift in momentum from bullish to neutral or bearish. UNG (Natural Gas ETF) displayed clear bearishness, forming two consecutive bearish candles. The second day opened lower and closed even further down, with an increase in volume, reinforcing the downward momentum. This pattern suggests a very likely continuation of the decline for UNG in the short term.
UGA (Gasoline ETF) presented a peculiar technical situation. While the second day formed a very strong bullish candle, closing significantly higher than the previous day, its accompanying volume was exceptionally low—less than a fifth of the first day’s volume. This price action, largely lacking volume confirmation, raises questions about the sustainability and conviction behind the move. Therefore, a continuation of this strong upward trend in UGA is unlikely to be sustained without a material increase in trading volume; there is a roughly even chance that the asset may consolidate or reverse as this price action lacks broad market participation.
Finally, the industrial and agricultural commodities showed varied performance. CPER (Copper ETF) indicated a significant bearish reversal on the second day. It opened higher than the previous day’s close but failed to maintain momentum, closing well below its open and below the prior day’s close. This “Bearish Engulfing” pattern, accompanied by decreased volume, strongly suggests that selling pressure overcame initial bullish sentiment, making a short-term downtrend for CPER likely. CORN (Corn ETF) showed modest bullish momentum with two consecutive higher closes, yet volume decreased on the second day, suggesting less conviction in the upward move. DBC (Broad Commodities ETF) mirrored this, posting moderate bullish candles with higher closes but also saw decreasing volume. For both CORN and DBC, while the trend is upward, the declining volume suggests that the current momentum may be unsustainable, and a period of consolidation or a modest pullback has a roughly even chance of occurring.
In summary, the market data for this 2-day period illustrates a clear divergence across commodity sub-sectors. Precious metals appear to be in strong bullish trends, while natural gas exhibits pronounced bearishness. Other commodities like oil and copper show signs of bullish exhaustion and reversal. The market is not uniformly moving, implying a selective capital flow, with strength concentrated in gold and silver, and weakness evident in specific energy and industrial commodities.
Performance Heatmap (SLV, GLD, CORN, CPER, USO, DBC, UGA, UNG)
Generated for 2days timeframe analysis
Technical Analysis of SLV (90-day daily chart)
SLV has exhibited a discernible bullish trend over the past 90 days, commencing from a base around the .50-.00 range in early June and ascending significantly to recent highs near .40 in mid-October. This upward movement has been characterized by several impulsive price swings, particularly noticeable from mid-July onwards, which suggests robust buying pressure. Volume analysis indicates that several of the substantial upward price movements were accompanied by elevated trading volumes, lending a degree of validity to the strength of the trend. For instance, the rallies in early July, late August, and throughout late September to early October all saw notable increases in daily volume. However, some days with high volume (e.g., October 9th, 2025) displayed prices closing significantly below the daily high, potentially indicating profit-taking or an increase in selling pressure at elevated levels, which is a pattern worth monitoring.
The 14-day Relative Strength Index (RSI) has largely corroborated this strong uptrend. Since late August and particularly through September and October, the RSI has remained consistently in overbought territory, frequently registering above 70 and often exceeding 80. As of the last data point, the RSI stands at 83.09, which is a highly elevated level. While sustained overbought conditions are common in strong uptrends and do not automatically signal an imminent reversal, such extreme readings do suggest that the asset is becoming extended. A correction or at least a period of consolidation is likely at these levels, as momentum tends to mean-revert over time. A failure of the RSI to maintain these high levels or a divergence with price (where price makes new highs but RSI does not) would strongly imply a waning of bullish momentum, but no such clear divergence is evident in the provided data. It is important to note that MACD data was specified in the chart request but not provided in the market data, therefore, no analysis of that indicator can be conducted.
Considering the recent price action, SLV’s current close at .33 is near its 90-day high of .405, established on October 15th. This immediate price ceiling may serve as short-term resistance. Should this level be decisively breached with strong volume, a continuation of the rally is probable. Conversely, a failure to overcome this resistance could lead to a minor pullback or consolidation. Immediate support levels might be found near the prior high of approximately .44 (October 13th) and potentially further down around .00-.00, which have acted as areas of consolidation or minor resistance previously.
In the near term, a continuation of the strong bullish momentum appears to have a roughly even chance against a period of price consolidation or a minor pullback. The extremely overbought RSI suggests that upward progress could become more challenging without a healthy consolidation to relieve technical pressure. However, the sustained bullish price action, particularly on elevated volume during rallies, implies underlying strength. Traders might consider that a significant downturn, such as a drop below the approximate .00-.00 zone, which marked previous support levels, would likely signal a more substantial shift in the short-term trend from aggressively bullish to potentially neutral or corrective. Conversely, sustained trading above the .40 mark on consecutive days would indicate that the current momentum remains firmly intact, potentially targeting higher price levels.
SLV Price & Indicators (RSI_14_DAY, MACD_13_21_DAY)
Technical Analysis of GLD (Past 90 Days)
GLD has experienced a significant and accelerating bullish trend over the past 90 days, with price action indicating strong upward momentum, particularly since late August. From mid-June through early August, GLD traded largely range-bound between approximately and , characterized by moderate volume. A discernible breakout commenced in late August, initiating a robust rally that has seen the asset climb steadily from around to its current level near . This powerful upward movement has been supported by notable increases in trading volume, particularly during significant price advances, suggesting strong buying conviction behind the move. The recent price action culminated in a new 90-day high on October 15 at .755, underscoring the sustained strength.
Analysis of the 14-day Relative Strength Index (RSI) reveals that GLD has been in an overbought condition for a substantial portion of the recent rally. The RSI first entered overbought territory (above 70) on September 2 and has largely remained there, frequently reaching levels above 75 and peaking at 86.11 on October 8. Such persistent overbought readings, while often interpreted as a sign of impending reversal, can also indicate exceptionally strong bullish momentum. However, they simultaneously increase the likelihood of a near-term price correction or consolidation as buying pressure may become exhausted.
A review of the most recent data points suggests the emergence of a potential bearish divergence between price and RSI. While GLD’s price achieved a new higher high of .755 on October 15, the corresponding RSI reading was 83.00. This stands in contrast to the prior high on October 8, when GLD reached a high of .57, accompanied by an RSI reading of 86.11. This pattern of a higher price peak coupled with a lower RSI peak is generally considered a bearish divergence. Such divergences often foreshadow a forthcoming period of price weakness, suggesting that the underlying bullish momentum may be waning. Therefore, a short-term pullback or sideways consolidation appears likely in the immediate future.
Considering the confluence of factors, the sustained bullish trend in GLD is undeniable, yet the deeply overbought RSI and the emerging bearish divergence point to elevated risks for long positions at current levels. It is likely that GLD will experience some degree of price consolidation or a minor correction in the near term. Should the price continue to advance despite these technical signals, the possibility of a “blow-off top” or an even more extreme overbought condition becomes a remote chance. Traders should exercise caution, as the probability of a reversal from this overextended state is increasing. It is important to note that the MACD (13, 21-day) indicator, though requested, was not available in the provided data and therefore could not be incorporated into this analysis.
GLD Price & Indicators (RSI_14_DAY, MACD_13_21_DAY)
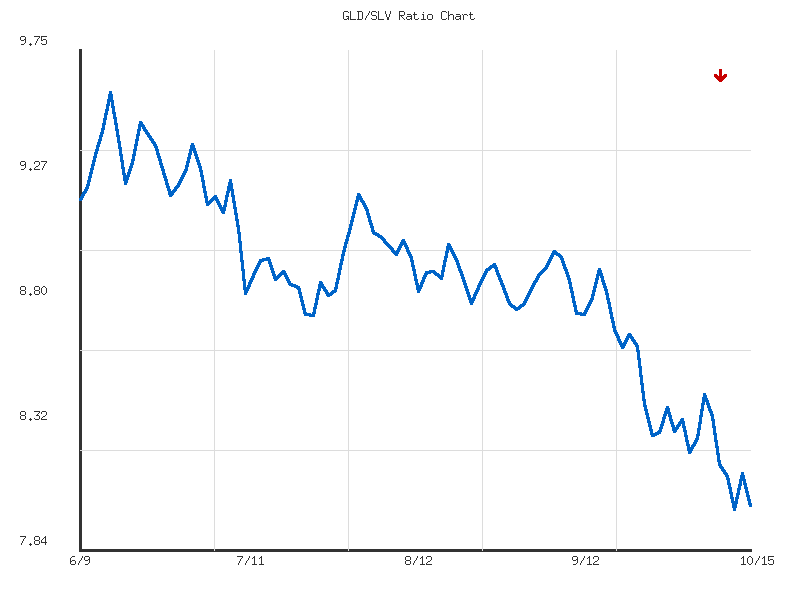
Gold/Silver Ratio
Over the observed 14-day period, the GLD/SLV ratio has exhibited a moderate downtrend, declining by approximately 3.23%. The ratio began at 8.28 on September 26th, experienced an intermediate peak at 8.44 on October 7th, and has since generally moved lower. This descending price action, with GLD values increasing from 346.74 to 387.39 and SLV values increasing from 41.86 to 48.33, primarily reflects a period where silver (SLV) has relatively outperformed gold (GLD). The consistency of this decline, supported by the moderate strength classification, suggests that bearish sentiment regarding the gold-to-silver ratio has been sustained rather than an abrupt shift.
The ratio is currently positioned very close to its 14-day low. The lowest recorded ratio was 8.000 on October 13th, with the most recent data point registering 8.015. This proximity to the low indicates that the downward pressure remains significant at the end of the observed period. The low volatility, noted at 0.0165, further reinforces the character of this trend as a relatively steady decline, rather than one marked by sharp, unpredictable swings. This pattern is consistent with a market that has slowly but persistently favored silver over gold during this specific timeframe.
Based on the current technical configuration, it is likely the moderate downtrend will persist in the immediate future, with the ratio potentially retesting the 8.00 level. A breach below this level would likely indicate a further extension of silver’s relative outperformance. However, there is a roughly even chance the ratio could consolidate around the 8.00-8.01 support zone in the very short term, given its recent decline and current positioning near the bottom of its observed range. A significant upward reversal from current levels, leading to a break above the short-term declining peaks, appears unlikely without fresh technical impetus not yet visible in the provided data. Such an outcome would require GLD to begin significantly outperforming SLV.
GLD/SLV Ratio: 90-Day Technical Analysis Commentary
The GLD/SLV ratio has undergone a significant and strong downtrend over the observed 90-day period, declining by approximately 12.71% from its peak. This persistent bearish trajectory, starting from a high of 9.59 on June 13th and extending to the current level of 8.01, clearly indicates a sustained period of outperformance by silver (SLV) relative to gold (GLD). The prevailing technical posture for this ratio is decidedly bearish, characterized by a series of lower highs and lower lows, which is the hallmark of a strong downtrend. The “relative_position” metric confirms this, showing the ratio is currently just 0.0096, signifying it is trading extremely close to its 90-day low.
Presently, the ratio is trading at 8.015, immediately above its recorded 90-day low of 8.000 observed on October 13th. This level represents a critical technical support. The proximity of the current ratio to this low suggests two primary near-term scenarios. There is a roughly even chance for a minor technical bounce from this support level, as traders may attempt to “buy the dip” or cover short positions. Should such a bounce materialize, initial resistance would likely be encountered around the 8.20-8.40 area, which has served as a minor consolidation zone and previous breakdown point in late September. Further significant resistance would be at the average ratio of 8.88.
Conversely, given the “strong” overall downtrend identified, a decisive breach of the 8.00 support level is also a distinct possibility. A sustained break below this psychological and technical floor would be a highly likely indicator of further weakness and a continuation of the ratio’s downward trajectory, potentially accelerating silver’s outperformance against gold. Such a breakdown would invalidate any near-term bullish arguments and would likely set the stage for new multi-month lows, with no clear support levels evident from the provided 90-day data below 8.00.
The sustained decline over the 90-day window, coupled with the ratio trading at the extreme lower bound of its historical range, underscores the powerful bearish momentum. While the market exhibits a moderate volatility of 0.125, suggesting that movements can be relatively quick, the path of least resistance for the GLD/SLV ratio remains to the downside. Traders should therefore be prepared for either a temporary consolidation/bounce off immediate support or, more likely, a continuation of the strong downtrend if the 8.00 level fails to hold in the coming sessions. The overall technical evidence points to continued silver strength relative to gold for the foreseeable future, unless a significant reversal pattern emerges, which is not currently indicated by the provided data.
Ratio Analysis: GLD/SLV
Generated for 90days timeframe analysis
Bonds
| Symbol | Daily Percent Change |
|---|---|
| SHY | -0.048% |
| IEI | -0.083% |
| IEF | -0.113% |
| UTHY | -0.200% |
| TLT | -0.220% |
The market data indicates a widespread, albeit modest, negative performance across the observed fixed-income instruments for the analyzed trading day. All five symbols—SHY, IEI, IEF, UTHY, and TLT—registered negative daily percentage changes. The range of these declines spans from -0.048% for SHY, representing shorter-duration U.S. Treasuries, to -0.220% for TLT, which tracks longer-duration U.S. Treasuries. This uniform directional movement strongly suggests a marginal bearish sentiment dominated the fixed income sector on this particular day.
A critical technical observation emerges when analyzing the magnitude of these declines in relation to instrument duration. Instruments with longer effective durations, specifically TLT (20+ year Treasuries) and UTHY (Ultra 20+ Year Treasury), experienced the most significant percentage drops, at -0.220% and -0.200% respectively. Conversely, shorter-duration instruments like SHY (1-3 year Treasuries) and IEI (3-7 year Treasuries) demonstrated relatively smaller declines, at -0.048% and -0.083% respectively. This pattern is highly likely indicative of an environment where longer-term interest rates faced greater upward pressure than shorter-term rates, leading to a steeper yield curve or at least a higher risk premium demanded for holding longer-dated bonds during the session.
While the data firmly establishes a duration-sensitive negative performance, it is not possible to conclusively determine if this represents the inception of a new trend or merely an isolated daily fluctuation. The relatively small percentage changes across all instruments imply that overall market volatility was low for the day, and the selling pressure, though broad, was not extreme. Without additional technical indicators such as volume analysis, candlestick patterns, or moving average trends, establishing the conviction behind these moves or projecting future price action with higher probability is not feasible. The observed pattern does, however, signal a probable technical shift in relative performance, favoring shorter-duration assets on this specific trading day.
As a CMT with extensive experience, I will provide a technical analysis of the provided two days of market data for TLT, UTHY, IEF, IEI, and SHY, strictly adhering to estimative language and focusing solely on the presented technical patterns.
A review of the two-day candle data across the observed fixed-income ETFs suggests a broad, albeit varied, shift in market sentiment from bullish momentum on the first day to a more cautious or bearish tone on the second. For TLT, the Long-Term Treasury Bond ETF, Day 1 showed a clear bullish close near its high on significant volume. However, Day 2 presented a notable bearish reversal, opening higher but closing significantly lower, almost forming a bearish engulfing pattern. This downward move occurred on increased volume, which typically lends credibility to the price action. Based on these two candles, it is likely that TLT will experience further downside price action or at least a period of consolidation in the immediate future, as the selling pressure appears to have intensified. Similarly, IEF, the Intermediate-Term Treasury Bond ETF, also exhibited a higher high on Day 2 but closed lower than its open, forming a bearish candle. While the volume increase was slight, the reversal in price action indicates a loss of immediate upward momentum. Consequently, IEF is likely to face a period of consolidation or modest price retreat.
UTHY, which registered its strongest bullish movement on Day 1 with a close at its high, displayed a bearish reversal on Day 2. Although its absolute trading volume remains low, the second day’s volume represented a significant relative increase accompanying a “shooting star” or “inverted hammer”-like candle. This pattern, characterized by an open near the previous close, a new high, and a close near the day’s low, strongly suggests exhaustion of the prior bullish impulse. Given the relative surge in volume on the reversal day, it is highly likely that a continuation of Day 1’s bullish advance is improbable, and UTHY could experience further downside or enter a phase of sideways consolidation.
For SHY, the Short-Term Treasury Bond ETF, Day 1 closed bullishly near its high. Day 2 saw a minor retreat, with a lower close but within a tight range. Critically, this modest bearish movement occurred on a noticeable decrease in volume. This lack of conviction during the slight pullback suggests that the selling pressure is not particularly strong. Therefore, a significant downward move for SHY appears possibly less likely, with a roughly even chance of either minor continued consolidation or a quick rebound toward previous highs. Similarly, IEI, the 3-7 Year Treasury Bond ETF, also posted a bearish candle on Day 2 after a bullish Day 1, with its high matching Day 1’s high but closing lower. However, this bearish day was also accompanied by a decrease in volume. As with SHY, declining volume on a down day often implies a lack of strong bearish conviction. Hence, a prolonged bearish trend for IEI is possibly less likely than a period of stabilization or a potential modest recovery.
In summary, the aggregated technical picture from these two trading days indicates a broad loss of bullish momentum across various bond duration instruments. Longer and intermediate-term bonds (TLT, IEF) exhibit more convincing bearish reversal patterns, making further downside or at least consolidation likely for them. UTHY also shows a clear, albeit low volume, bearish reversal. Conversely, the shorter-duration instruments (SHY, IEI) displayed bearish price action on Day 2, but the accompanying decrease in volume suggests that these pullbacks might be less significant and that a substantial bearish follow-through is possibly less likely, with a roughly even chance of near-term consolidation or minor rebound. Overall, immediate bullish continuation across the bond spectrum appears unlikely based on this two-day window, with probabilities favoring consolidation or minor corrections.
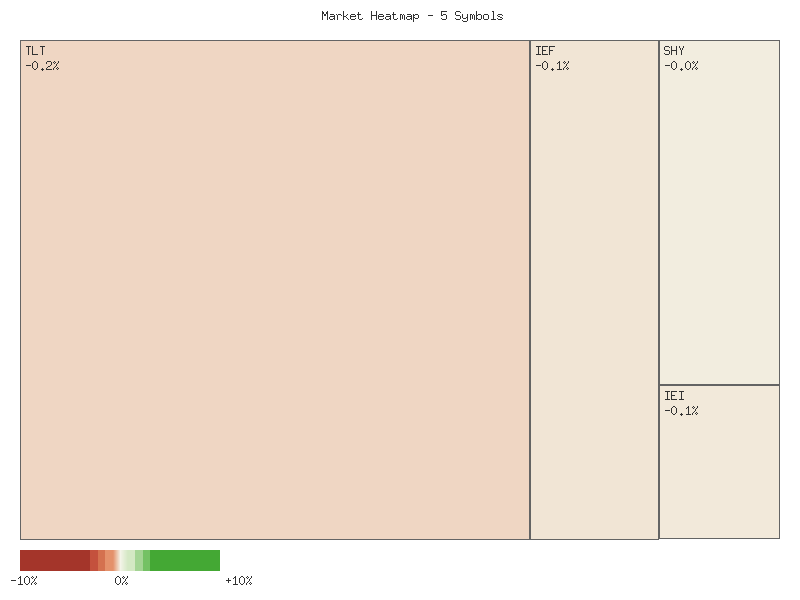
Performance Heatmap (TLT, UTHY, IEF, IEI, SHY)
Generated for 2days timeframe analysis
Magnificent 7 & Friends
The provided daily percentage change data for the selected symbols reveals a bifurcated market on this specific trading day, with a notable disparity between the top-performing assets and those exhibiting either marginal or negative price action. Below is the sorted daily performance for each symbol:
| Symbol | Daily Percent Change |
|---|---|
| CRWV | 3.864% |
| ANET | 3.307% |
| GOOGL | 2.273% |
| AVGO | 2.092% |
| TSLA | 1.377% |
| META | 1.256% |
| AAPL | 0.634% |
| MSFT | -0.027% |
| NVDA | -0.111% |
| AMZN | -0.379% |
Analysis of the data indicates that CRWV and ANET were the strongest performers, posting significant single-day gains of 3.864% and 3.307%, respectively. This robust upward movement suggests considerable buying pressure for these assets during the period. GOOGL and AVGO also demonstrated strong positive momentum, with gains exceeding 2%. Such performance typically indicates a high probability of short-term technical strength relative to the broader set of instruments observed. It is likely that these assets experienced sustained demand throughout the trading day, possibly closing near their intraday highs.
A second tier of positive performers includes TSLA, META, and AAPL, with daily percentage changes of 1.377%, 1.256%, and 0.634% respectively. While positive, their gains are less pronounced than the leading group. This suggests a roughly even chance of either consolidating prior gains or initiating a more modest upward move. The moderate positive close for AAPL, in particular, indicates less aggressive buying compared to its peers, potentially reflecting a period of price digestion within its immediate technical framework.
Conversely, MSFT, NVDA, and AMZN concluded the day with either marginal or negative returns. MSFT recorded a negligible decline of -0.027%, indicating an almost certainly neutral trading session, with sellers barely outweighing buyers. NVDA’s -0.111% and AMZN’s -0.379% declines suggest a low probability of strong bullish conviction for these specific assets on this day. The negative closures imply that selling pressure marginally exceeded buying interest, potentially leading to a slight technical weakening compared to the other listed assets. Given only a single day’s data, it is difficult to ascertain if this represents the beginning of a downward trend or simply a minor pullback within a larger pattern; however, it does indicate relative underperformance for the observed period.
Overall, the observed daily percentage changes present a mixed technical picture. A clear divergence exists where roughly 70% of the assets experienced positive gains, with a significant concentration of strength at the top. The remaining 30% either closed flat or negative. This suggests a selective market environment, where capital flow was concentrated in a few strong movers. Without additional historical price and volume data, it is not possible to draw conclusions regarding longer-term trends or established chart patterns. However, for this single trading session, the momentum was clearly positive for the majority of the selected assets, with specific individual outperformance and underperformance evident.
As a Chartered Market Technician with over 15 years of experience, my analysis of the provided two-day market data focuses exclusively on the price action, volume, and candlestick patterns for the selected ten symbols.
Over the observed two-day period, the aggregate market data for this group of technology and growth-oriented stocks presents a mixed technical picture with a slight bullish inclination for the overall cohort. Several assets demonstrated robust upward momentum, characterized by successive higher closes and intra-day highs. Conversely, a subset exhibited clear signs of deceleration or reversal after initial weakness, while one prominent component displayed persistent bearish pressure. The varied responses across this limited timeframe suggest underlying divergence in short-term technical strength, and a uniform directional bias for the broader group is unlikely to emerge immediately. Individual trajectories, however, are more clearly defined.
Three symbols—META, GOOGL, and TSLA—demonstrated a consistent bullish technical structure. META and GOOGL both registered higher opens, higher highs, higher lows, and higher closes consecutively. This progression was accompanied by an increase in trading volume for both, which lends credence to the upward moves. TSLA also followed a pattern of higher opens, highs, lows, and closes, though its volume slightly decreased on the second day. Based on these constructive patterns, a continuation of this short-term bullish momentum for META and GOOGL appears highly likely. For TSLA, continued upward movement is likely, though with slightly reduced conviction due to minor volume deceleration.
ANET, AVGO, and CRWV exhibited notable recovery after an initial bearish day. ANET displayed a strong bullish reversal on Day 2, opening higher than Day 1’s close and closing significantly higher, forming a large bullish body. ANET’s Day 2 close surpassed its Day 1 open, suggesting a powerful shift in sentiment. While AVGO and CRWV also closed higher on Day 2 than Day 1’s close, both registered bearish bodies on Day 2 (closing below their respective opens), indicating some intra-day selling pressure despite overall recovery. Given ANET’s strong rebound, a continuation of its recovery is likely. For AVGO and CRWV, further recovery is likely; however, bearish daily bodies on Day 2 suggest a roughly even chance of consolidation or a temporary pause before significant upside.
AMZN, MSFT, and AAPL, despite opening higher and often reaching higher intra-day highs on Day 2 compared to Day 1, displayed signs of indecision or mild weakness as the second day concluded. AMZN closed below its Day 2 open and Day 1’s close, indicating a loss of momentum. MSFT and AAPL also closed slightly below their Day 2 opens, though they remained above Day 1’s closing prices. The volume for AAPL decreased, while MSFT and AMZN saw slight increases. These patterns suggest that buying pressure struggled to maintain control through the entire second trading session, leading to modest bearish daily candles or lower closes. Therefore, a continuation of strong upward momentum for these symbols is unlikely without renewed buying interest; a period of consolidation or a minor pullback has a roughly even chance of occurring.
NVDA stands out as the sole symbol demonstrating consistent bearish technical signals. Both days featured prominent bearish candles, with Day 2 closing marginally lower than Day 1’s close. Despite higher opens, selling pressure was significant, leading to lower closes. The second day also saw a marginally lower low and increasing trading volume on the downside. Small upper wicks, combined with strong bearish bodies and higher volume, suggest persistent selling pressure from near opening levels. A continuation of this bearish price action for NVDA is likely, as the pattern indicates sellers are maintaining control in the short term.
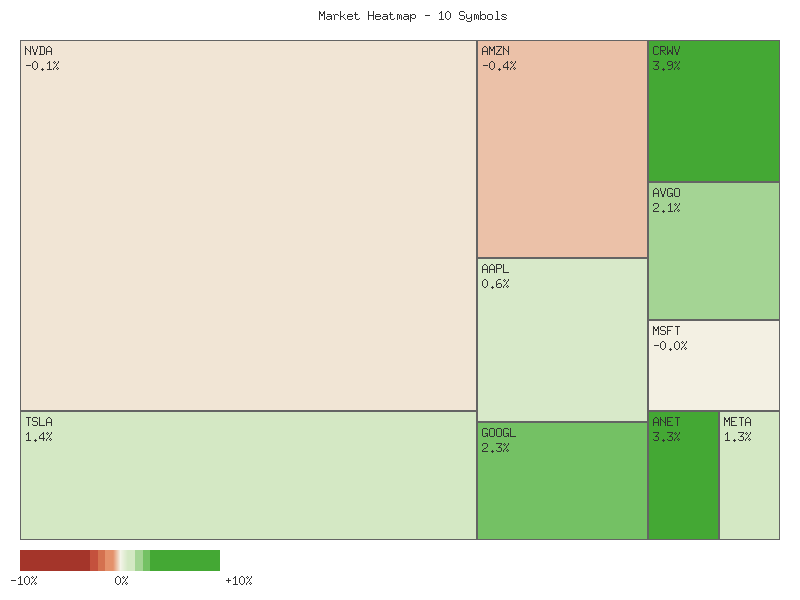
Performance Heatmap (TSLA, MSFT, AAPL, META, NVDA, AVGO, GOOGL, AMZN, CRWV, ANET)
Generated for 2days timeframe analysis
S&P 500 Sector Breadth
The provided data for eleven S&P 500 sectors reveals a mixed market breadth. Seven symbols closed with positive daily changes, three with negative, and one (XLF) ended flat. This 7:3 advancing-to-declining ratio suggests a slight positive bias in overall market participation for this specific period. However, significant divergence exists among sector types, indicating that broad-based strength is not present across all segments. While the majority of observed symbols advanced, the underlying distribution of gains and losses warrants further technical scrutiny.
A detailed examination highlights a clear distinction between defensive and offensive sectors. All four identified defensive sectors—Consumer Staples (XLP), Real Estate (XLRE), Utilities (XLU), and Healthcare (XLV)—advanced, with XLRE and XLU showing substantial gains of 1.453% and 1.309%. Conversely, offensive sector performance was fragmented. Technology (XLK), Communication Services (XLC), and Consumer Discretionary (XLY) posted gains, but Industrials (XLI), Materials (XLB), and Energy (XLE) declined, while Financials (XLF) was flat. This pattern strongly suggests a likely rotation of capital into more defensive holdings, reflecting a bid for stability.
The pronounced strength in defensive sectors, coupled with the uneven performance of offensive sectors, points to a probable shift in overall market sentiment towards risk aversion. The market appears to be favoring stability, a characteristic of periods where investors anticipate potential headwinds. While offensive leaders like Technology and Communication Services still show strength, the broad-based advance in defensive areas implies a considerable subset of participants are prioritizing safety. It is roughly even chance that this pattern could persist as short-term market anxiety unfolds, or that it could be a temporary rebalancing.
The following matrix illustrates the daily percentage change for each sector, sorted in descending order:
| Symbol | Daily Percent Change |
|---|---|
| XLRE | 1.453% |
| XLU | 1.309% |
| XLK | 0.991% |
| XLC | 0.707% |
| XLP | 0.177% |
| XLV | 0.155% |
| XLY | 0.145% |
| XLF | 0.000% |
| XLE | -0.058% |
| XLI | -0.418% |
| XLB | -0.449% |
This matrix clearly illustrates the relative performance, with defensive sectors XLRE and XLU leading the market, followed by offensive tech (XLK) and comms (XLC). The bottom of the list is populated by offensive sectors XLE, XLI, and XLB, underscoring the mixed signals within the offensive group. This divergence suggests that while some growth areas remain attractive, the broader market appears to be exhibiting underlying caution, with defensive strength providing a notable counterbalance. The likelihood of a sustained offensive rally without broader participation from all offensive sectors is unlikely given this observed divergence.
As a CMT with extensive experience, my analysis of the provided two-day market data for the SPDR Sector ETFs indicates a market experiencing notable divergences, with sustained bullish momentum in several sectors contrasting with signs of consolidation or potential reversal in others. Volume trends are mixed, providing further nuance to the price action.
A substantial contingent of sectors displayed clear bullish continuation. Consumer Staples (XLP), Real Estate (XLRE), Healthcare (XLV), Consumer Discretionary (XLY), Communication Services (XLC), and Technology (XLK) all recorded higher closes on the second day compared to the first. XLK notably gapped up at the open on day two before closing higher, indicating strong overnight sentiment. While most of these stronger sectors saw a decrease in volume on the second day, which could suggest a slight moderation in buying intensity, Utilities (XLU) stands out. XLU closed significantly higher on the second day and, crucially, did so on increased volume, indicating a high probability of continued upward pressure for this defensive sector. This combination of higher prices and increasing volume in XLU is a particularly bullish technical development, suggesting a high probability of further appreciation in the near term.
Conversely, a distinct group of sectors exhibited patterns indicative of potential resistance or a shift in momentum. Financials (XLF) formed a “Tweezer Top” pattern, with day two opening higher but closing at the exact same level as day one’s close (53.24). This pattern, coupled with a significant reduction in volume on the second day, suggests a high probability of resistance at this price level and implies a roughly even chance of a near-term pullback or consolidation. Materials (XLB) presented a bearish engulfing pattern on day two, where its close was significantly below day one’s open, signaling increased selling pressure. This, alongside a slight dip in volume, points to a likely increase in selling pressure and suggests a higher probability of further downside or at least a test of lower support. Similarly, Industrials (XLI) and Energy (XLE) experienced higher opens on day two but ultimately closed lower than their respective day one closes, with decreased volume supporting this assessment. These patterns suggest a higher probability of sideways action or a minor retracement in the immediate future for these sectors.
The divergent performance, with robust strength in Utilities, Real Estate, and Technology contrasting with signs of stalling or reversal in Financials and Materials, creates a complex short-term outlook. For sectors exhibiting bearish patterns like XLF and XLB, a continuation of selling pressure is likely in the immediate trading session, with key support levels becoming crucial to watch. An alternative scenario would be for the broader bullish sentiment observed in the majority of sectors to override these individual bearish signals, leading to consolidation rather than a sharp reversal. However, given the defined patterns and volume dynamics over these two days, the data suggests a high probability of continued sector rotation and varied individual performance rather than a monolithic market direction. Confirmation of any sustained move—either bullish or bearish—would require follow-through in subsequent trading periods.
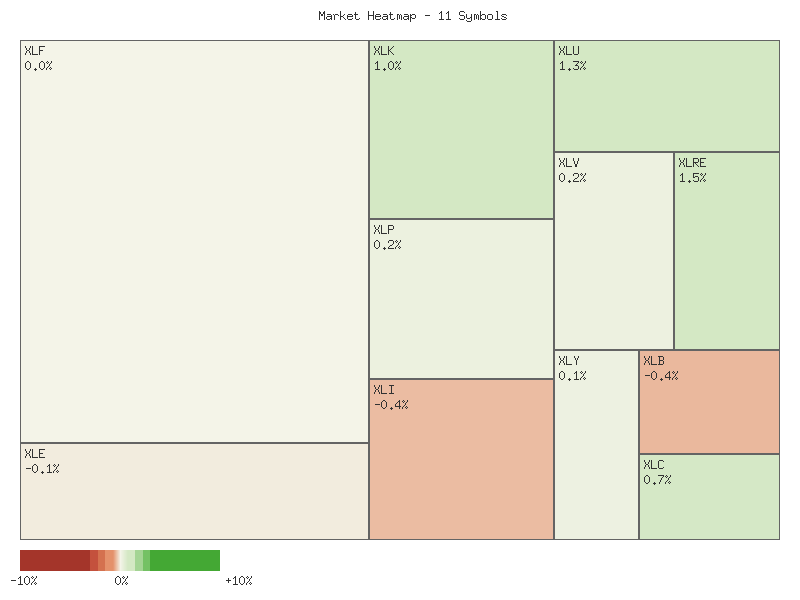
Performance Heatmap (XLP, XLRE, XLI, XLU, XLV, XLY, XLF, XLB, XLE, XLC, XLK)
Generated for 2days timeframe analysis
XLY vs XLP
The XLY/XLP ratio has exhibited a weak downward trend over the past seven trading days, declining approximately 1.75% from its high. Starting from 3.014 on October 7th and peaking at 3.038 on October 8th, the ratio has since receded to its current level of 2.962 on October 15th. This places the current ratio at the lower end of its observed 7-day range, with a relative position of 0.3017 compared to its recent high and low. The observed volatility for this period is notably low at 0.00128, suggesting a relatively controlled descent rather than sharp, erratic price swings.
The initial significant decline from the October 8th peak to October 10th was primarily driven by a notable underperformance in the Consumer Discretionary sector (XLY), which experienced a substantial decrease from 235.22 to 228.75, while the Consumer Staples sector (XLP) remained relatively stable. Following a partial recovery of the ratio from October 10th to October 13th, the more recent decline from October 13th to October 15th appears to be a function of Consumer Staples (XLP) exhibiting stronger performance relative to Discretionary (XLY). During this latter period, XLY posted a modest gain from 233.86 to 234.69, but XLP advanced more significantly from 77.84 to 79.23, thereby driving the ratio lower.
Given the established weak downward trend and the current ratio’s proximity to its 7-day low of 2.928 observed on October 10th, it is likely the ratio will test this level in the near term. A sustained break below 2.928 would probably reinforce the current weak downtrend, suggesting further relative underperformance of XLY. However, considering the notably low volatility and the “weak” trend strength, there is a roughly even chance the ratio could find short-term support around the 2.928 level, leading to a period of consolidation or a minor rebound within its recent range. A significant acceleration of the downtrend is unlikely without a material increase in volatility or a clear breakdown below the established low of 2.928.
CMT Technical Analysis: XLY/XLP Ratio (90-Day View)
The XLY/XLP ratio, representing the performance of Consumer Discretionary (XLY) relative to Consumer Staples (XLP), has exhibited a strong upward trend over the analyzed 90-day period. Commencing around 2.62 in early June, the ratio has ascended to a current level of approximately 2.96 by mid-October, marking a nearly 13% increase. This sustained outperformance of XLY suggests a market environment favoring cyclical growth sectors over defensive consumer staples, indicating a generally constructive view of economic activity during this timeframe. The ratio’s average over the 90 days was 2.82, with a low of 2.607 and a high of 3.097. The current ratio stands at approximately 72.4% of the range between its 90-day low and high, confirming its elevated position within the observed window.
Recent price action indicates a period of consolidation following a significant rally. The ratio achieved its 90-day peak of 3.097 on October 6th, after which it experienced a notable pullback, finding a near-term low at 2.928 on October 10th. This retreat from the high suggests that the 3.097 level now functions as immediate technical resistance. Subsequently, the ratio attempted to rebound, reaching 3.004 on October 13th, but has since drifted lower to its current reading of 2.962. The pattern of a sharp rise, followed by a pullback and then a struggle to regain prior highs, indicates that upside momentum has temporarily stalled. The immediate support area for the ratio appears to be around the 2.92-2.93 level, a zone where it recently found buyers.
Looking forward, the prevailing strong uptrend suggests that a continuation of XLY’s outperformance relative to XLP is likely. Should the ratio maintain support above the 2.92-2.93 level, a retest of the 3.00-3.01 resistance area is probable. A decisive break above this minor resistance, followed by a sustained move beyond the 90-day high of 3.097, would strongly imply renewed bullish momentum and an extension of the established upward trend. Such a breakout would typically target higher levels, indicating further rotation into more cyclically sensitive sectors.
Conversely, an alternative scenario suggests a deeper corrective phase could develop. A sustained breakdown below the immediate support around 2.92-2.93 would imply that the current consolidation is unfinished. In this event, the ratio would likely target the 90-day average of 2.82 as the next significant support level. A break below the 2.82 average would indicate a more significant shift in relative strength and could signal a temporary preference for defensive sectors. However, given the strong overarching trend and momentum metrics, a complete reversal to challenge the 90-day low of 2.607 is unlikely unless further significant technical deterioration occurs. The market’s response to the 2.92-2.93 support level will be key in determining the ratio’s near-term trajectory.
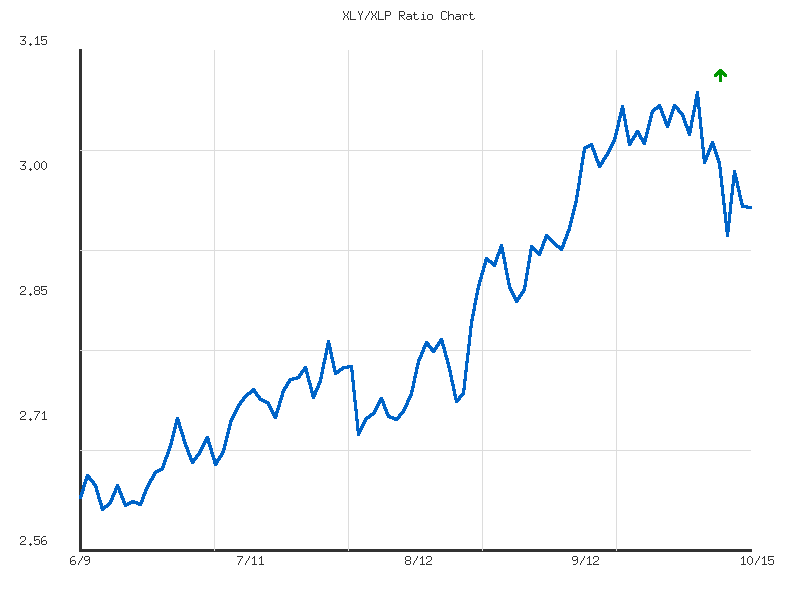
Ratio Analysis: XLY/XLP
Generated for 90days timeframe analysis
Equity Breadth
Over the past seven days, the percentage of S&P 500 members trading above their 50-day moving average (SPXA50R) displayed notable volatility. Beginning at 53.49% on October 7th, this metric experienced a precipitous drop to a low of 33.73% by October 10th. This significant decline suggests a rapid and broad-based deterioration in short-term market breadth, with a substantial portion of S&P 500 constituents breaking below their intermediate-term uptrends. A subsequent partial recovery brought the SPXA50R to 48.10% by October 14th, where it held through October 15th. We judge it likely that short-term market momentum remains challenged, given that the majority of components still trade below their 50-day averages.
Concurrently, the percentage of S&P 500 members trading above their 200-day moving average (SPXA200R) also showed a contraction in breadth, albeit with more resilience. Starting at 62.28% on October 7th, this indicator declined to a low of 50.30% by October 10th, indicating some weakening in the longer-term market structure. However, the SPXA200R subsequently recovered to 57.68% by October 14th and maintained this level. This suggests that, despite the short-term pressure, a clear majority of S&P 500 stocks are still holding above their long-term moving averages, providing a foundational level of support for the broader index.
The divergence between the SPXA50R remaining below 50% and the SPXA200R holding above 50% presents a mixed technical picture. We assess that the S&P 500 is experiencing short-term weakness and a loss of momentum within its components, yet underlying long-term support for the index appears to be largely intact. It is roughly even chance that the market either consolidates further or attempts to rally in the immediate term, with a decisive move above 50% for the SPXA50R being necessary to signal improving short-term strength. Conversely, a sustained decline in the SPXA200R below 50% would likely signal a more significant deterioration in the S&P 500’s overall technical posture.
SPY Daily
SPY experienced a period of upward momentum over the past 90 days, indicated by the sustained rise of both the 50-day and 200-day Exponential Moving Averages (EMAs), with the 50-day EMA consistently above the 200-day EMA. This configuration robustly confirms a bullish long-term trend. Examining the most recent 7 days of price action reveals a significant bearish impulse on 2025-10-10, where SPY closed at 653.02 with exceptionally high volume (156.6 million), breaking below the prior day’s close of 671.16. This sharp decline found probable support around the 652.84 level, precisely where the 50-day EMA was situated (651.53). In the immediate past day (2025-10-15), SPY closed at 665.17, marking a continued rebound from the low, despite opening higher at 666.82 and showing a slight intraday dip to close. This recovery has occurred on moderating volume, standing at 81.3 million, which is notably lower than the volume seen during the sharp decline on 2025-10-10.
The 14-day Relative Strength Index (RSI) corroborates this narrative. On 2025-10-09, the RSI was at 65.75, approaching overbought conditions. The ensuing sharp sell-off on 2025-10-10 drove the RSI down significantly to 41.81, moving from near overbought into the lower end of the neutral zone, indicating a sudden loss of momentum. Since then, the RSI has gradually recovered to 54.11 by 2025-10-15, reflecting the market’s attempt to regain composure and indicating neutral momentum at present. Key resistance levels are likely found around the recent highs of 673.94 (2025-10-09) and 672.99 (2025-10-07), which represent the upper boundary of the price action before the recent downturn. Support is clearly established by the confluence of the 50-day EMA and the 2025-10-10 low, roughly in the 651-653 range. A more robust long-term support exists at the 200-day EMA, currently around 612.26.
Considering future price action, a bullish case is plausible if SPY can decisively break above the 673-674 resistance zone. The bounce from the 50-day EMA, a key technical support, suggests underlying strength and likely renewed buying interest. If price consolidates above the 50-day EMA and approaches the prior highs with increasing volume, a continuation of the broader uptrend is probable. The current neutral RSI reading provides ample room for an upward expansion without encountering immediate overbought conditions.
Conversely, a bearish case emerges if the rally stalls at or below the 673-674 resistance, particularly if accompanied by decreasing volume. The large bearish candle on 2025-10-10, characterized by very high volume, indicates strong selling pressure that could reassert itself. Should SPY fail to reclaim recent highs and subsequently break below the 651-653 support (the 50-day EMA and the 2025-10-10 low), a further decline toward the 200-day EMA around 612 is likely, indicating a significant shift in market sentiment.
A neutral scenario holds a roughly even chance if SPY continues to trade within the defined range of 651-653 (support) and 673-674 (resistance). The past few days indicate a tug-of-war between buyers and sellers following the sharp correction. This consolidation would reflect market indecision as participants assess the balance of power following the recent volatility. Sentiment drivers, based purely on this technical data, suggest that the strong institutional selling or profit-taking that occurred on 2025-10-10 was met by resilient dip-buying near the 50-day EMA, indicating that while fear briefly spiked, long-term bullish conviction has not entirely dissipated. However, the lower recovery volume suggests that this bullish conviction might be tentative, and a definitive breakout or breakdown would be required to signal a clear market direction.
Technical Analysis of SPY (June - October 2025)
Over the past 90 days, the SPY ETF has displayed a consistent upward trend, commencing near in early June and peaking close to in early October. This analysis is exclusively based on the provided daily candlestick data for SPY and its 14-day Relative Strength Index (RSI). It must be noted that MACD (13,21) data was not supplied; consequently, this indicator cannot be included in the technical assessment. The market’s overall ascent was marked by periods of strong bullish momentum, often followed by relatively quick but generally contained price pullbacks.
The 14-day RSI repeatedly entered overbought territory (above 70) during this period, notably from late June through early July, late July, mid-September, and early October. These instances, with RSI hitting 75.58 on July 25, consistently foreshadowed subsequent price pullbacks or phases of consolidation. For example, the overbought conditions ending July 28 (RSI 75.23) directly preceded a significant RSI drop to 47.66 by August 1, alongside a notable price correction. This pattern reappeared leading up to October 10, where RSI peaked at 71.17 on October 6 before a sharp decline to 41.81. Such aggressive reversals from overbought levels within the RSI appear to be a characteristic signal of diminishing upward momentum in this data set.
The strong correlation between SPY’s price and RSI over the 90 days typically involved robust price gains pushing RSI into overbought regions, followed by a momentum reversal and corresponding price correction. The pronounced price drop on October 10, from .16 to .02, was coupled with the highest trading volume in the dataset (156,629,060 shares) and the dramatic RSI fall to 41.81. This convergence of signals suggests a significant, short-term exhaustion of bullish impetus. Following this sharp one-day correction, SPY has since observed a modest rebound, with price recovering to .17 and RSI increasing from 41.81 to 54.11. This indicates a tactical bounce rather than a confirmed resurgence of the prior steep uptrend.
SPY’s current technical standing implies a period of market adjustment after the recent correction. The 14-day RSI, at 54.11, is in a neutral range, suggesting equilibrium between supply and demand. Given the historical tendency for significant corrections to follow sustained overbought RSI readings, and the most recent event, it is unlikely that SPY will immediately resume its aggressive upward climb without further consolidation. A continuation of the recent bounce is possible if RSI momentum can build and approach the 60-65 level. Conversely, there is a roughly even chance of renewed selling pressure or protracted sideways trading. Should RSI fail to sustain its upward momentum and fall below 50 again, a retest of the October 10 low (.84) becomes a likely near-term scenario.