Daily Market Technical Analysis
Market Overview
The market exhibits divergent trends with elevated volatility. Small and mid-cap indices (IWM, IJR, MDY) are likely to continue outperforming large-caps, which show bearish reversal patterns and are more likely than not to consolidate or pull back. The S&P 500’s rapid resumption of its prior uptrend is unlikely following recent momentum divergences, with a roughly even chance of further downward movement or establishing a less steep uptrend. Technology (XLK) faces likely continued bearish pressure, contrasting with probable continued upward action across most other sectors. Concurrently, Gold (GLD) shows likely continued upward momentum, while Silver (SLV) is likely to consolidate due to overbought conditions; most other commodities face probable continued bearish pressure, and key bond ETFs (TLT, IEF, IEI) indicate strong upward momentum.
Market Indices
An analysis of the provided daily percent change data for key market indices on 2025-10-14 reveals a mixed directional bias, albeit with a net positive aggregate. The performance matrix for the last trading day is as follows:
| Symbol | Daily Percent Change |
|---|---|
| IJR | 1.518% |
| IWM | 1.428% |
| MDY | 0.927% |
| SPX | -0.156% |
| OEF | -0.400% |
| QQQ | -0.666% |
The summation of these daily percent changes yields a positive 2.651% for the period, indicating an overall higher movement across this specific set of symbols. However, the market breadth is observed to be evenly split, with three symbols (IJR, IWM, MDY) registering advances and three symbols (SPX, OEF, QQQ) experiencing declines. This equal distribution between advancing and declining indices suggests a market experiencing internal cross-currents, where specific segments exhibit strength while others demonstrate weakness. The divergence in performance, particularly the negative movement in the larger-cap indices (SPX, OEF, QQQ) compared to the positive performance in smaller-cap segments (IJR, IWM, MDY), suggests that the aggregate positive change is primarily driven by strength in the small and mid-cap sectors, which warrants careful observation for sustainability.
Reviewing the volatility index (VIX) across the 7-day candle data, a significant shift in market sentiment is evident. The VIX maintained relatively stable levels in the 16.xx range through October 9th, with closes of 16.37, 17.24, 16.30, and 16.43. A pronounced upward acceleration occurred on October 10th, where the VIX opened at 16.36 and surged to close at 21.66, with a high of 22.44, representing a substantial increase in implied volatility. This candlestick pattern, characterized by a large body and extensive upper shadow, signals a sharp increase in market uncertainty or fear. Subsequently, October 13th saw the VIX retract to close at 19.03 from an open of 19.45, with its daily percent change registering a notable decline of -12.142%. This suggested a temporary easing of market tension.
However, the most recent trading session on October 14th showed a significant rebound in the VIX, closing at 20.81, up 9.354% from the prior day. This move was characterized by a gap-up open at 21.46, above the previous day’s high, and a close near its mid-range after touching 22.94. The consecutive movements of the VIX, a sharp spike followed by a partial retracement and then another strong rally, indicate that market participants perceive continued elevated risk. The VIX remaining above 20 is typically associated with increased investor apprehension. Given the recent rebound, it is likely that volatility will remain elevated in the near term, with a roughly even chance of challenging recent highs or consolidating within the current range. A failure to hold above the 19.03 level from October 13th could suggest a declining trend in volatility, whereas a push above 22.94 would strongly suggest further expansion of implied volatility and increased market apprehension. The mixed market breadth coupled with elevated VIX readings suggests an environment where caution is warranted, and market participants are likely hedging against potential downward movements.
Market Technical Analysis (October 13-14, 2025)
Analysis of the recent two-day trading period reveals a clear divergence in market performance across different capitalization segments, necessitating a nuanced interpretation. The large-cap oriented ETFs, SPY (S&P 500), QQQ (Nasdaq 100), and OEF (S&P 100), exhibited a pattern of initial upside followed by a retreat. On October 13th, these indices closed higher, with SPY posting a close of 663.04, QQQ at 602.01, and OEF at 332.35. However, the subsequent day, October 14th, saw a shift. SPY opened lower, traded within a wider range, and closed down at 662.23, below its prior day’s close, on noticeably higher volume (88.36M vs. 79.23M). Similarly, QQQ gapped down and closed significantly lower at 598.00 on increased volume (68.87M vs. 65.29M). OEF also followed this pattern, closing lower at 331.02 on higher volume (361K vs. 236K). The increased volume accompanying the decline in these major indices on October 14th is a classic technical signal suggesting that selling pressure has likely entered the market, making a short-term consolidation or pullback a likely scenario for these segments. Despite the lower closes, the relatively long lower shadows on the October 14th candles for SPY, QQQ, and OEF indicate that buying interest emerged from the intraday lows, suggesting that outright capitulation is unlikely in the immediate term, but rather a struggle between buyers and sellers.
In stark contrast to the large-cap segments, the small and mid-cap ETFs demonstrated considerable strength over the same two-day period. IWM (Russell 2000), IJR (S&P SmallCap 600), and MDY (S&P MidCap 400) all printed strong bullish candles on October 14th. IWM, after a positive close on October 13th at 244.41, gapped down on October 14th but then rallied significantly to close at 247.90, well above its prior close and near its high for the day. This strong upward movement was supported by increased volume (45.19M vs. 36.21M). IJR exhibited a similar pattern, closing at 118.35 on October 14th, a new high, despite a slight decrease in volume (4.60M vs. 4.83M). MDY also showed robust performance, closing at 594.38, a new high for the period, on higher volume (1.01M vs. 834K). This decisive follow-through from an initial gap down, coupled with closes near the daily highs, strongly suggests that these segments are experiencing substantial buying interest. A continuation of bullish momentum in small and mid-cap sectors is likely based on this technical evidence.
Considering the divergent performances, the market appears to be in a phase of rotation rather than a uniform directional move. For the large-cap indices (SPY, QQQ, OEF), the candlestick patterns on October 14th resemble bearish engulfing or dark cloud cover patterns when viewed against the prior day’s close, particularly for QQQ and OEF. This suggests that previous short-term upside momentum is likely to have stalled. A retest of the October 14th lows or a period of sideways consolidation would be a roughly even chance in the immediate future. Conversely, the strong upward continuation in IWM, IJR, and MDY, despite initial intraday weakness on October 14th, implies a robust demand-side dynamic. The ability of these ETFs to recover from a gap down and close at or near new highs signals underlying strength. While a brief pause or consolidation for these segments is possible given the rapid ascent, continued outperformance relative to large caps is likely. Overall, traders should anticipate increased volatility and watch for confirmation of these rotational dynamics. A breakdown below the October 14th low for SPY (653.17) would strengthen the bearish case for large caps, while a sustained push above new highs would confirm the strength in small and mid-caps.
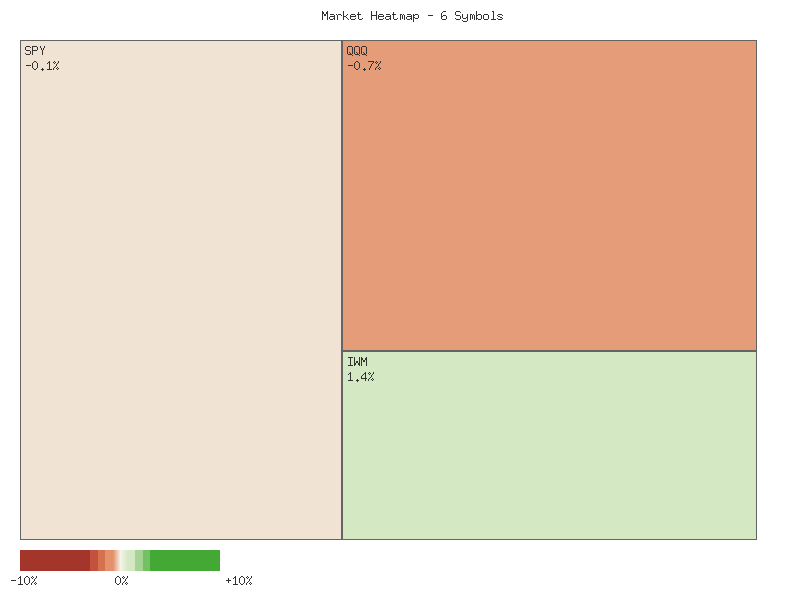
Performance Heatmap (SPY, QQQ, IWM, IJR, MDY, OEF)
Generated for 2days timeframe analysis
SPX Technical Analysis: Post-Correction Momentum Assessment
The SPX maintained a robust uptrend for much of the past 90 days, evidenced by a steady ascent from approximately 5987 in early June to peaks above 6750 in early October. This sustained bullish price action was generally supported by positive momentum readings from both the 14-day Relative Strength Index (RSI) and the 13-21-day Percentage Price Oscillator (PPO). However, the most recent data indicates a probable shift in market dynamics. The significant price decline on October 10 from open 6740.49 to close 6552.51 marks a notable disruption to the prevailing upward trajectory. This sharp single-day correction, reversing several days of prior gains, suggests that the market’s immediate bullish impetus has been substantially challenged.
Prior to the October 10 decline, both momentum indicators exhibited discernible negative divergences against price. The 14-day RSI reached a high of 74.75 on September 22, subsequently trending lower, registering 69.90 on October 8, even as the SPX recorded a higher high of 6753.72 on the same day. Similarly, the 13-21-day PPO peaked at 0.635 on September 22, then showed a declining trajectory, only managing a modest rebound to 0.568 by October 6, failing to confirm the new price highs. These negative divergences, where momentum failed to keep pace with or actively declined as prices advanced, often precede market corrections and made a substantial price downturn likely.
Following the sharp correction, the 14-day RSI plummeted from around 70 to 42.07 on October 10, subsequently stabilizing around 51.47 by October 14. This movement from overbought into a neutral territory, coupled with the sharp drop, implies a significant loss of bullish pressure. Concurrently, the PPO underwent a rapid decline, moving from 0.568 on October 6 to 0.282 by October 14. Although the PPO remains above zero, indicating that the longer-term bullish momentum has not completely reversed, its pronounced downward slope suggests deteriorating underlying strength. The current technical posture suggests that a rapid resumption of the prior strong uptrend is unlikely in the immediate term.
The price action following the October 10 sharp drop, with subsequent closes at 6654.72 (Oct 13) and 6644.31 (Oct 14), suggests an attempt at stabilization. This could represent a retest of the breakdown level or the formation of a short-term trading range. Given the significant loss of momentum indicated by both RSI and PPO, there is a roughly even chance that the current price stabilization could either precede further downward movement, potentially towards previous support levels from mid-August around the 6350-6450 area, or establish a new, less steep upward trend if buying interest re-emerges. However, the lack of positive divergence on the indicators during this stabilization phase suggests that the bearish momentum might yet dominate. A continuation of the PPO’s decline below zero would signal a more definitive shift to a bearish intermediate-term trend, which at this juncture, is a plausible but not yet likely scenario.
SPX Price & Indicators (RSI_14_DAY, PPO_13_21_DAY)
Technical Analysis of QQQ (90-Day Review)
Over the observed 90-day period, QQQ demonstrated a pronounced bullish trend, advancing from approximately in early June to a peak near on October 9th. This upward trajectory was characterized by several periods of sustained buying, interspersed with minor pullbacks. A significant shift in price action became evident on October 10th, when QQQ experienced a substantial single-day decline from its peak, accompanied by exceptionally high volume of 94.4 million shares. This strong volume during a sharp downward move likely indicates a decisive change in short-term sentiment, potentially marking a tactical top. Subsequent trading on October 13th and 14th saw prices recover somewhat from the October 10th lows but still closing significantly below the recent high, suggesting that the initial shock of the decline may be absorbing, but upward momentum has been severely disrupted. The price levels around -, which previously acted as support, now appear to be immediate resistance following the recent breakdown. The level served as temporary support on the October 10th dip.
The 14-day Relative Strength Index (RSI) largely corroborated the bullish price action throughout the 90-day window. During much of June, July, and September, the RSI consistently registered values above 60, frequently entering overbought territory (above 70) on multiple occasions, such as in late June, late July, and late September through early October. These sustained periods in overbought conditions, without immediate or significant corrections, likely underscore the strong underlying buying pressure present during the rally. However, the sharp price decline on October 10th triggered a dramatic fall in the RSI from above 70 to 45.42. This rapid descent from an overbought state signals a significant and abrupt loss of bullish momentum. As of October 14th, the RSI has slightly recovered to 51.99, indicating that the immediate oversold conditions from the sharp drop are not currently present, suggesting that there is still room for further downside or consolidation before a clear oversold rebound is likely.
The Percentage Price Oscillator (PPO_13_21_DAY) further supports the narrative of robust bullish momentum followed by a notable deterioration. Throughout the entire 90-day period, the PPO consistently maintained positive values, indicating that the shorter-term exponential moving average (EMA) was continuously above the longer-term EMA, a hallmark of an intermediate-term uptrend. The PPO reached several local peaks, confirming the strength of the bullish impulses. Similar to the RSI, the PPO experienced a significant decline from approximately 0.77 on October 9th to 0.46 on October 14th. While still in positive territory, this substantial reduction in the PPO’s value suggests a considerable weakening of the bullish trend’s velocity. A sustained decline in the PPO, particularly if it were to approach or cross below the zero line, would very likely signal a potential shift towards a negative intermediate-term trend, but such a crossover is not yet apparent.
Synthesizing these technical observations, QQQ’s immediate outlook appears cautious. The forceful breakdown from recent highs on high volume, coupled with the sharp unwinding of previously strong momentum indicated by both RSI and PPO, suggests that a period of consolidation or further downside is more likely than not in the very short term. While the overall intermediate-term trend, as indicated by the still-positive PPO, has not yet turned bearish, the aggressive selling pressure observed on October 10th is a significant development. A retest of the level as support is possible, and a failure to hold this level could likely lead to further declines towards previous support zones. Conversely, a rapid reclaim of the - resistance zone would unlikely occur without a significant positive catalyst and would necessitate a strong rebound in both price and momentum indicators. Traders should monitor the area for potential support and the - zone for resistance, with the expectation of increased volatility following the recent sharp reversal.
QQQ Price & Indicators (RSI_14_DAY, PPO_13_21_DAY)
Here is a technical analysis of IWM based on the provided 90 days of market data:
The IWM price action over the past 90 days exhibits an overall bullish trend, characterized by a series of higher highs and higher lows. The price began in early June around the .50 level and progressed to its recent high of .90 on October 14. Key resistance appeared to be encountered around the - range in July, which was subsequently overcome in August, leading to a new resistance zone in the - area in early September. This resistance was also breached, culminating in the recent peak. Notable pullbacks occurred in mid-June, late July/early August, and most recently, a significant one-day decline on October 10. The volume data indicates some heightened activity during these volatile periods, with the highest single-day volume recorded on October 10 at nearly 70 million shares, coinciding with a sharp price decrease from .13 to .79. This could suggest significant selling pressure or profit-taking at the recent highs.
Analysis of the 14-day Relative Strength Index (RSI) reveals periods of strong bullish momentum and subsequent consolidation. In early July, the RSI reached 71.57, indicating overbought conditions, which preceded a price pullback. Similarly, mid-August and mid-September saw the RSI re-enter overbought territory (around 67-71), coinciding with price peaks. The recent sharp decline on October 10 pushed the RSI from 60.08 to 44.97, moving it closer to oversold territory, signaling a significant loss of short-term buying momentum. However, the subsequent two trading days (October 13-14) witnessed a strong rebound in price, with the RSI recovering to 60.21. This rapid bounce from near-oversold conditions suggests a resurgence of buying interest and potential for short-term upside continuation.
The Price Percentage Oscillator (PPO) 13-21 day also largely supports the observed bullish trend, while providing additional insight into momentum shifts. The PPO remained positive through June and early July, indicating strong bullish momentum. A notable bearish crossover of the zero line occurred around August 1 (PPO at 0.26, having been positive previously), signaling a short-term trend reversal, which coincided with the IWM price finding support around .92. This was followed by a bullish crossover back above the zero line around August 12 (PPO at 0.22), confirming the resumption of the uptrend. Since mid-August, the PPO has consistently remained in positive territory, reinforcing the overarching bullish trend. However, the strength of this bullish momentum fluctuated, peaking above 1.0 multiple times before declining from 1.003 on September 23 to a recent low of 0.487 on October 13. The most recent data point (October 14) shows the PPO ticking up to 0.545, indicating a slight re-strengthening of positive momentum after the recent price dip.
Synthesizing these indicators, the overall technical picture for IWM is one of an established uptrend that has experienced a sharp, yet potentially temporary, setback. The significant one-day decline on October 10, accompanied by unusually high volume, initially signaled a potential shift in sentiment or aggressive profit-taking. However, the immediate and robust two-day price recovery, mirrored by the RSI bouncing significantly from near-oversold conditions and the PPO showing an uptick in positive momentum, suggests underlying resilience and buying pressure. The consistent positive PPO readings since mid-August further support the persistence of the longer-term bullish structure.
Considering these factors, it is likely that IWM will attempt to retest and potentially overcome the resistance levels established around the - range, which mark the recent highs. The strength of the rebound in both price and momentum indicators post-October 10 lends credence to this scenario. An alternative scenario, with a roughly even chance, involves IWM entering a period of consolidation around current price levels (e.g., -) if the buying momentum observed on October 13-14 struggles to sustain itself against overhead supply or profit-taking at higher prices. A highly unlikely scenario would be a rapid failure of the current rebound, leading to a break below the October 10 low of .79, which would necessitate a reassessment of the prevailing bullish trend. Such a move would likely be accompanied by renewed bearish signals from the RSI falling below 50 and the PPO crossing back below zero.
IWM Price & Indicators (RSI_14_DAY, PPO_13_21_DAY)
Tech Sector Analysis
Analysis of the RATIO:QQQ/SPY:14days and RATIO:QQQ/SPY:30days provides insights into the relative performance of the technology-heavy NASDAQ-100 versus the broader S&P 500.
Analysis of the 30-day QQQ/SPY ratio indicates a clear, albeit weak, upward trend in relative performance. The ratio has advanced from a low of 0.8855 to a current value of 0.9030, representing a 1.97% increase over the period. This suggests that the technology-heavy NASDAQ-100 has generally outperformed the broader S&P 500 throughout the last month. The current ratio is positioned comfortably above the 30-day average of 0.8989 and resides at approximately the 71.6% mark within its monthly range, closer to the high of 0.9099 than the low. This configuration, despite the “weak” strength classification, technically supports the narrative of sustained relative strength for QQQ over the medium term.
In contrast to the longer-term upward bias, the 14-day QQQ/SPY ratio displays a distinct period of consolidation, characterized by a “sideways” trend with “weak” strength. Over this shorter timeframe, the ratio has experienced a negligible 0.117% change, oscillating between a low of 0.9005 and a high of 0.9099. The current ratio of 0.9030 is marginally below the 14-day average of 0.9039, and its relative position at 26.6% within the 14-day range places it closer to the recent short-term lows. This suggests a recent deceleration in QQQ’s relative outperformance, possibly indicating a pause in its ascent against SPY. The very low volatility for the 14-day period (0.00000798) further reinforces this notion of recent price equilibrium.
The conflicting signals between the 14-day and 30-day trends present a nuanced technical picture. The overarching 30-day upward trend suggests underlying strength for QQQ relative to SPY, yet the recent 14-day sideways action indicates a potential loss of immediate momentum or a period of accumulation/distribution. The current ratio (0.9030) acting as both a relatively low point within the short-term range and a relatively high point within the medium-term range creates a pivotal technical level. Maintaining above the 30-day average of 0.8989 would be critical for preserving the longer-term constructive relative performance outlook. Conversely, a sustained break below this average would challenge the established uptrend.
Given the prevailing data, it is likely that the QQQ/SPY ratio will continue to exhibit a sideways trajectory in the immediate short term, extending the current consolidation observed over the past 14 days. This implies a roughly even chance of QQQ outperforming or underperforming SPY over the very short duration. However, should the ratio maintain its position above the 30-day average of 0.8989, a resumption of QQQ’s relative outperformance against SPY over the slightly longer term is a roughly even chance to likely outcome. Conversely, a decisive downside break below the 30-day average would make continued QQQ relative underperformance likely, potentially signaling a more significant reversal of the established 30-day uptrend. Extreme volatility or sharp, immediate shifts in relative performance are unlikely given the low volatility readings across both timeframes.
As a Chartered Market Technician with over 15 years of experience, I’ve analyzed the provided 90-day QQQ/SPY ratio data to offer insights into the relative performance of the Nasdaq 100-tracking ETF (QQQ) against the S&P 500-tracking ETF (SPY). This ratio serves as a vital technical indicator, with an ascending trend signaling QQQ’s outperformance and a descending trend indicating SPY’s relative strength.
Over the 90-day period observed, the QQQ/SPY ratio has exhibited a discernibly upward trend, which we assess as likely indicating a period where technology and growth-oriented stocks, as represented by QQQ, have generally outperformed the broader market. The overall change percentage of approximately 2.10% reinforces this upward bias. However, the data explicitly characterizes this upward trend as having “weak” strength. This assessment suggests that while QQQ’s outperformance is present, the momentum behind this relative strength is not particularly robust or accelerating aggressively, implying a more gradual or inconsistent advantage rather than a commanding one.
The ratio’s fluctuations have been contained within a defined range, from a 90-day low of approximately 0.8827 to a high of around 0.9099. The current ratio stands at roughly 0.9030, positioning it in the upper quartile of this 90-day range, specifically at about 74.6% of the distance from its low to its high. This relative position implies that the ratio is trading at elevated levels compared to its recent history. We judge the extremely low volatility figure provided (0.000045) to mean that daily swings in this relative strength are typically minor, making dramatic day-over-day changes in the ratio an unlikely occurrence.
Following a peak near its 90-day high of 0.9099 on October 9th, the ratio has experienced a modest pullback to its current level of 0.9030. This suggests that the ratio likely encountered a degree of technical resistance at or around that recent high. Given the described weak trend strength, a persistent re-testing of the 0.9099 level could present a continued challenge for further QQQ outperformance. We assess there is a roughly even chance that the ratio may consolidate within its current upper range in the immediate term, potentially seeking support at levels observed in late September to early October, which fall within the 0.9010-0.9020 vicinity.
Looking ahead, a decisive and sustained break above the 0.9099 high would signal renewed and potentially stronger conviction in QQQ’s outperformance, making further upward movement in the ratio likely. Conversely, a significant and sustained decline below the 90-day average ratio of approximately 0.8935 would alter the near-term outlook, suggesting a shift towards SPY demonstrating equivalent or superior performance. However, based solely on the provided technical data, the overall bias for QQQ’s relative strength remains cautiously positive, although its continued advance is likely to be characterized by the “weak up” trend strength observed.
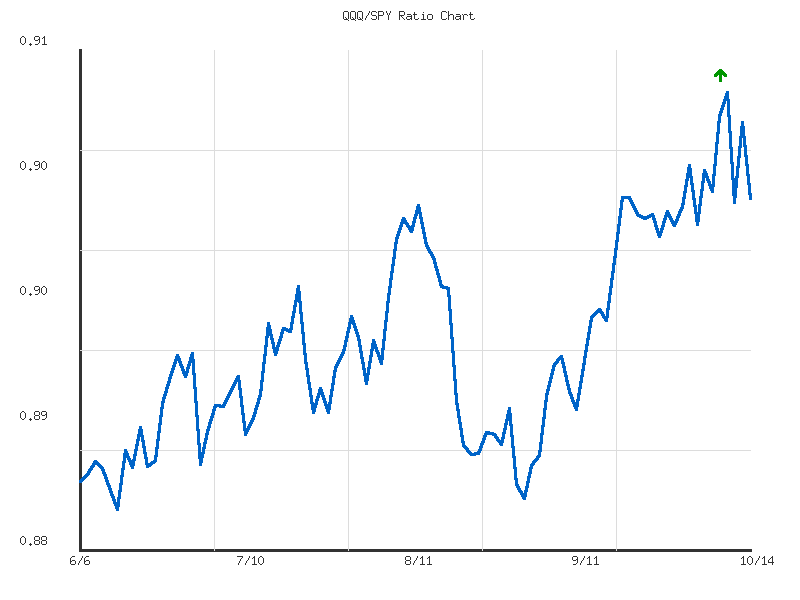
Ratio Analysis: QQQ/SPY
Generated for 90days timeframe analysis
IWM vs. SPY
The IWM/SPY ratio demonstrates a clear upward trend across both the 14-day and 30-day observation periods, signaling consistent outperformance of the Russell 2000 (IWM) relative to the S&P 500 (SPY). For the 14-day period, the ratio advanced approximately 2.94%, culminating at its absolute high point of 0.374341 on the final recorded date. Similarly, the 30-day data set confirms an “up” trend with a slightly larger change of 3.12%, with the identical current ratio of 0.374341 representing its maximum value within this extended timeframe. The current ratio residing at the high for both time series strongly implies that IWM recently experienced a period of robust relative strength against SPY, concluding the observation window at peak outperformance for these respective lookback periods.
A notable distinction exists in the assessed trend strength: the 14-day trend is characterized as “weak,” despite concluding at its high, whereas the 30-day trend is rated “moderate” in strength. This divergence suggests that while the overall trajectory over the past month has been more moderately assertive, the momentum within the more immediate two-week period, despite ending at a new high, might be less consistently powerful throughout its range compared to the broader 30-day average ascent. The relatively low volatility recorded across both timeframes (0.000008 for 14-day and 0.000007 for 30-day) indicates that these upward movements have been relatively smooth, generally lacking sharp, erratic swings or significant corrective phases within the observed periods. This smoothness generally reinforces the stability of the observed upward bias in relative performance.
Given the current IWM/SPY ratio is at the high for both the 14-day and 30-day periods, continued immediate outperformance by IWM relative to SPY is likely. The prevailing upward trend direction, coupled with the final data point marking the peak, suggests momentum remains aligned with IWM’s relative strength. A continuation of this upward trajectory appears more likely than a significant immediate reversal. However, a period of consolidation in relative performance or a minor retracement is roughly an even chance, considering the ratio has reached a peak for the observed windows, which can sometimes precede a pause before further advances. A sustained underperformance of IWM against SPY, leading to a decisive breakdown below recent averages (0.3658 for 14-day, 0.3652 for 30-day), appears unlikely in the immediate term, especially given the observed low volatility.
Should the IWM/SPY ratio fail to sustain its current peak, the average ratios for the 14-day (0.3658) and 30-day (0.3652) periods would function as initial technical support zones. A retest of these levels is a plausible scenario if profit-taking emerges; however, a decisive break below these averages is unlikely unless accompanied by a notable increase in volatility. The fact that the current ratio is at the relative position of ‘1’ for both periods reinforces the notion that the market closed at a point of strong relative strength. While a continued ascent is the path of least resistance from a momentum perspective, the possibility of a sideways consolidation period following such a peak is not insignificant and warrants consideration by market participants.
Technical Analysis: IWM/SPY Ratio (90-day Period)
The provided 90-day data for the IWM/SPY ratio, spanning from early June to mid-October 2025, reveals a clear, moderate upward trend in the relative performance of the Russell 2000 (IWM) compared to the S&P 500 (SPY). The ratio commenced this period around 0.353 and has since climbed to its current and 90-day high of 0.3743 on October 14th, representing a 5.84% increase. This consistent appreciation suggests a broadening of market leadership, with small-cap stocks showing relative strength against their large-cap counterparts over the observed timeframe. The overall trajectory indicates that IWM has been the preferred equity exposure over this specific period.
An examination of the ratio’s price action throughout the 90 days highlights several distinct phases. Initially, from early June to late July, the ratio generally oscillated within a range, largely bounded by approximately 0.348 and 0.358, establishing a base of consolidation. A notable dip occurred on August 1st, pushing the ratio to its 90-day low of 0.34568. This low was subsequently defended, and the ratio embarked on a more sustained upward movement from mid-August, establishing a pattern of higher lows and higher highs. The break above the prior consolidation resistance, particularly evident in late August and September, signaled a likely continuation of IWM’s relative outperformance.
The most recent data points indicate an acceleration in this upward momentum. The ratio has recently surpassed all previous levels within this 90-day window, reaching a new high on the final observed day. This breakout to uncharted territory within the provided data suggests that the relative strength of IWM is continuing to build. Based on the persistent upward trend and the recent break to new highs, it is highly likely that the IWM/SPY ratio will continue to exhibit relative strength in the immediate near-term, assuming the established technical pattern holds.
However, a prudent technical assessment must also consider alternative scenarios. While the upward trend is robust, the ratio currently sits at its 90-day peak, meaning there is no overhead resistance within this dataset to guide further upside targets. Should the momentum abate, a period of consolidation below the 0.3743 level or a minor pullback is a roughly even chance, given the recent strong ascent. A significant reversal that breaks the established pattern of higher lows and tests the previously effective support levels (such as the 0.360-0.362 area or even down to the 0.350-0.355 zone) is currently an unlikely outcome, though not impossible, as technical trends can change. The current technical posture nonetheless favors continued outperformance by IWM relative to SPY.
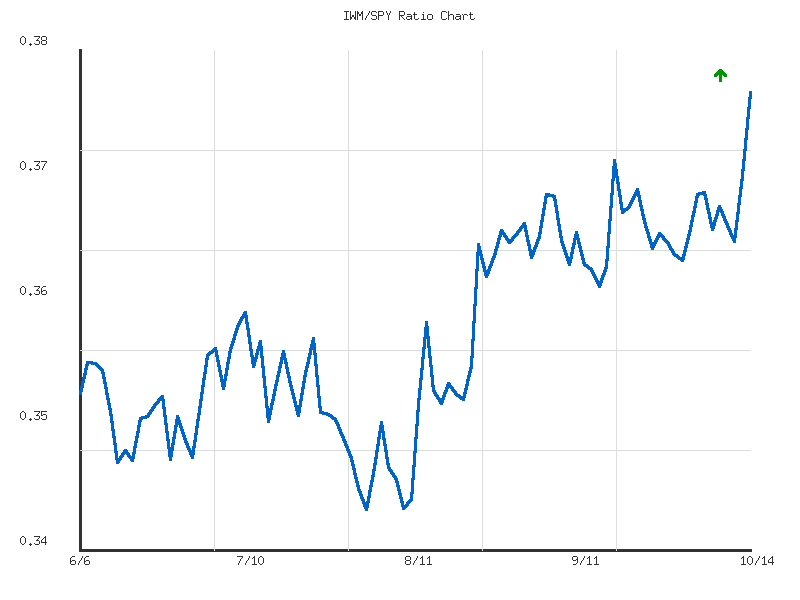
Ratio Analysis: IWM/SPY
Generated for 90days timeframe analysis
Commodities
The daily performance of the selected commodities symbols on 2025-10-14 exhibits a predominantly bearish sentiment, as evidenced by the following distribution:
| Symbol | Daily Percent Change (2025-10-14) |
|---|---|
| GLD | 0.714% |
| CORN | 0.232% |
| SLV | -0.973% |
| DBC | -1.119% |
| UGA | -1.443% |
| USO | -1.821% |
| UNG | -1.888% |
| CPER | -2.343% |
The aggregate change for these eight symbols sums to approximately -8.641%. This calculation suggests an overall lower trajectory for the basket of commodities reviewed on the given day. While two symbols, GLD and CORN, registered positive movements, their gains were insufficient to offset the more substantial declines observed across the remaining six instruments. This outcome indicates a likely prevailing downward pressure across broad commodity markets, at least within this specific grouping.
Market breadth for this set of symbols indicates a clear bearish bias. Out of eight symbols, only two advanced, while six declined. This ratio of 3:1 (declining to advancing) points to a notable lack of widespread buying interest. The most significant declines were observed in CPER (-2.343%), UNG (-1.888%), USO (-1.821%), and UGA (-1.443%), suggesting particular weakness in industrial metals and energy-related commodities. The relatively strong performance of GLD (Gold) appears to be an outlier against the general trend of declines in other components. Given the distribution, it is unlikely that buying momentum will broaden across these commodities in the immediate short-term, with declining breadth often preceding further price weakness.
Analyzing the GLD/SLV ratio over the 14-day period reveals a moderate downward trend, with the ratio decreasing by approximately 3.16%. The current ratio stands at 8.1365, positioned closer to its 14-day low of 8.0002 rather than its high of 8.4411, with a relative position of 0.309. This consistent decline in the ratio suggests that Silver (SLV) has been outperforming Gold (GLD) over this short-to-medium term. The moderate strength of this downward trend makes a continuation of SLV’s relative strength a probable outcome in the near term, provided no significant shifts occur in market dynamics affecting precious metals.
Extending the view to the 30-day GLD/SLV ratio reinforces this observation, showing a more pronounced moderate downward trend with a change of approximately -7.41%. The current ratio remains at the same level as the 14-day (8.1365), but its relative position within the 30-day range (0.138) indicates it is even closer to its multi-week low of 8.0002 compared to its high of 8.9849. The consistency of the downward trend over both timeframes, coupled with the ratio residing near its lower boundary, collectively suggests a reasonably high probability of continued relative outperformance by Silver. While a bounce from these lower levels is possible, the prevailing technical indication points to continued comparative strength in SLV against GLD.
Market Commentary: Two-Day Commodity Technical Outlook
Analysis of the provided two-day technical data reveals a strong divergence across commodity ETFs. GLD (Gold) exhibits notable strength, contrasting sharply with pronounced bearish sentiment in most other observed commodities, including CPER (Copper), USO (Crude Oil), DBC (Diversified Commodities), UGA (Gasoline), and UNG (Natural Gas). SLV (Silver) also experienced a substantial downturn. This broad weakness in industrial and energy assets, versus gold’s resilience, suggests defensive positioning. Candlestick formations and volume trends offer insights into the likely continuation or reversal of these short-term movements.
Energy and industrial commodity ETFs (CPER, USO, DBC, UGA, UNG) demonstrate strong bearish technical signals. CPER, USO, and UGA each saw significant bearish price action on day two, characterized by substantial gap downs and closes near daily lows, supported by increased trading volume. This strongly suggests downward momentum is likely to continue short-term. UNG also displayed a significant bearish candle with a gap down negating day one’s bullish gains, forming a ‘Dark Cloud Cover,’ despite slightly reduced volume. DBC followed a similar bearish continuation. For these assets, a probable continuation of bearish pressure is indicated.
Within precious metals, GLD and SLV present contrasting pictures. GLD exhibited consistent bullish momentum across both days, forming a strong bullish continuation pattern with consistent volume. Further short-term upward movement in GLD is therefore likely. Conversely, SLV showed substantial weakness. After a strong bullish candle on day one, day two began with a significant gap down below the prior day’s low and closed considerably lower. This aggressive gap down, on sustained high volume, strongly suggests day one’s bullish momentum has been decisively rejected. A continued downward bias for SLV in the immediate future is likely.
CORN futures presented an ambiguous, though potentially bullish, short-term reversal. Day one closed at its low, but day two recovered to close higher, forming a bullish reversal candle. This two-day reversal from a low could indicate a roughly even chance of short-term upward momentum. However, declining trading volume on day two introduces uncertainty, diminishing the probability of a significant sustained rally without further confirmation; a short-lived rebound is an alternative scenario. Overall, the technical landscape broadly favors continued weakness for most observed assets, with GLD being a notable exception and a roughly even chance of a minor bounce for CORN.
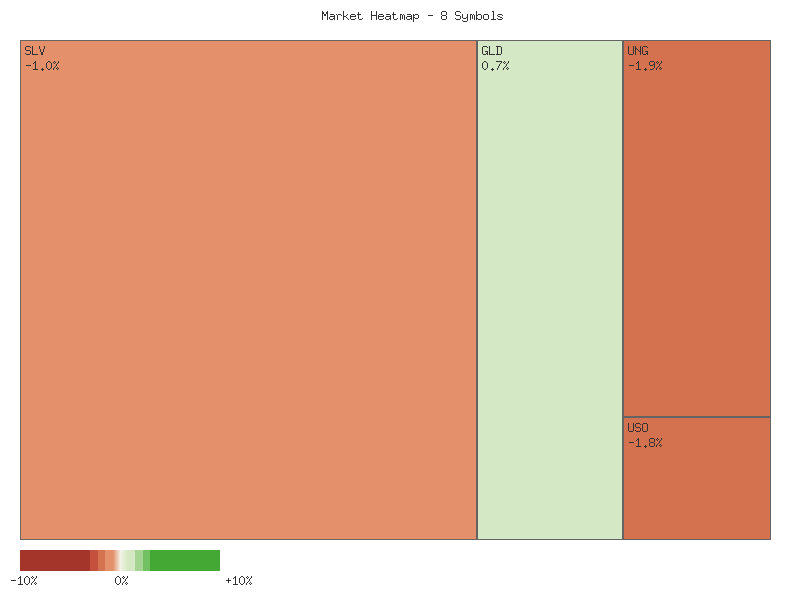
Performance Heatmap (SLV, GLD, CORN, CPER, USO, DBC, UGA, UNG)
Generated for 2days timeframe analysis
SLV Technical Analysis: Strong Uptrend, Overbought Conditions Warrant Vigilance
Over the past 90 days, the iShares Silver Trust (SLV) has displayed a clear and robust bullish trajectory, particularly in the latter half of the period. Following an initial consolidation phase through June and early July, SLV experienced a significant price breakout around July 10-11, characterized by two consecutive days of substantial upward movement accompanied by very high trading volumes of 44 million and 57 million shares, respectively. This action signaled a probable shift in market sentiment. Subsequent to this breakout, the price consolidated briefly in the -.50 range until late August. From late August through mid-October, SLV entered a pronounced uptrend, climbing from approximately to over . This upward acceleration was frequently supported by elevated volume, notably on October 8th, 9th, and 10th with volumes exceeding 59 million, 110 million, and 66 million shares, respectively, reinforcing the strength of the buying pressure. The final trading day provided, October 14th, recorded a slight dip from its open to close, forming a red candle, yet it maintained a high closing price of .80 with significant volume of 57 million shares.
The 14-day Relative Strength Index (RSI) corroborates the strong bullish momentum but also highlights a persistently overbought condition. In early June, the RSI briefly touched above 70, then spent several weeks oscillating in the 55-65 range, indicating a more neutral to moderately bullish environment. However, from late August onward, the RSI moved decisively into overbought territory, consistently remaining above the 70 threshold. It peaked at 84.32 on October 13th, suggesting extreme buying pressure. While such prolonged overbought readings can indicate sustained strength, they also increase the probability of a near-term pause or correction as buyers may become exhausted or profit-taking ensues. The slight decline in RSI to 79.96 on October 14th, while still very high, may indicate a minor deceleration of this extreme momentum.
Further supporting the bullish trend, the Percentage Price Oscillator (PPO) with 13 and 21-day parameters has demonstrated a strong positive and accelerating momentum throughout the uptrend. After dipping towards zero in mid-August (reaching 0.17 on August 19th), indicating a period of weakening momentum or consolidation, the PPO reversed course and began a steep ascent. It has consistently remained well above the zero line since late August, signifying robust bullish trend strength. The PPO’s continued rise, culminating at 3.238 on October 14th, reinforces the notion of an accelerating trend. The absence of a PPO signal line prevents a crossover analysis, but the absolute value and its trajectory strongly indicate the prevailing bullish strength.
Considering the combined technical picture, SLV is in a very strong, well-supported uptrend with clear bullish momentum as evidenced by both price action and the PPO. However, the persistently high RSI levels, which have resided deep within overbought territory for an extended period, suggest a likely increased risk of a short-term consolidation or minor pullback. The red candlestick on October 14th, despite a high close, along with elevated volume, could be interpreted as initial signs of profit-taking or buyers encountering increased resistance. While a full trend reversal is unlikely without more significant bearish price action or indicator divergence (not observed in the provided data), a period of price consolidation or a modest correction is considered likely in the immediate future to alleviate the overbought condition before any further significant advances. Traders should exercise caution and monitor for signs of weakening momentum or lower highs and lows that would signal a deeper pullback.
SLV Price & Indicators (RSI_14_DAY, PPO_13_21_DAY)
GLD Technical Analysis: Sustained Momentum in Overbought Territory
GLD has experienced a strong, sustained uptrend over the latter part of the 90-day period under review, particularly from late August through mid-October. Initial price action in June and July demonstrated a more sideways to slightly upward bias, with GLD trading predominantly between and . Volume during this early phase was moderate. However, a decisive shift occurred in late August, initiating a powerful rally that propelled GLD from approximately to its current level of .79. This acceleration has been consistently accompanied by significantly higher trading volumes, suggesting strong institutional and retail participation. The large volume on the 2025-10-09 pullback to .43, followed by an immediate recovery and continuation of the uptrend, suggests that strong buying interest quickly absorbed any profit-taking.
Momentum, as indicated by the 13-21-day Percentage Price Oscillator (PPO), strongly confirms the bullish trend. After oscillating near the zero line and even dipping slightly negative during June, July, and early August, the PPO decisively crossed into positive territory in late August. Since then, it has demonstrated a remarkable acceleration, climbing from approximately 0.20 to an exceptionally high value of 2.04 by the last data point. This sustained and steep ascent in PPO signals robust and accelerating upward momentum, indicating that buyers remain in strong control and the trend is very much intact. The consistent positive divergence of the PPO from earlier, more neutral readings supports the strength of the current rally.
The 14-day Relative Strength Index (RSI) further illustrates the intensity of this rally. Since early September, RSI has been consistently residing in overbought territory (above 70), frequently breaching into extremely overbought levels above 80, peaking at 86.11 on 2025-10-08. While such extended overbought conditions typically suggest a high probability of a near-term pullback or consolidation, the persistent strength of GLD has largely defied significant corrections so far. The substantial drop in RSI to 72.86 on 2025-10-09, accompanying a price pullback, quickly rebounded back above 80 on 2025-10-14. This rapid recovery in RSI indicates that the underlying buying pressure remains potent, overriding initial signs of exhaustion.
Considering the combined technical picture, a continuation of the uptrend is likely in the short to medium term. The strong positive momentum indicated by the PPO and the rapid recovery of the RSI from its brief dip underscore the bullish dominance. However, GLD’s current extremely overbought RSI reading, coupled with the recent high-volume day on 2025-10-09 which saw initial selling, presents roughly an even chance of a near-term pause or minor consolidation. Such a scenario would likely be a healthy development, allowing the indicators to cool somewhat without necessarily signaling a reversal of the primary uptrend. A significant break below key support levels, which are not currently defined by the provided data, or a sharp decline in PPO momentum would be required to suggest a trend reversal, which currently appears unlikely given the overwhelming bullish signals.
GLD Price & Indicators (RSI_14_DAY, PPO_13_21_DAY)
Bonds
The following technical analysis is based exclusively on the provided DAILY_PCT_CHANGE data for TLT, UTHY, IEF, IEI, and SHY over a two-day period concluding on 2025-10-14. The analysis identifies key performance trends, market breadth, and directional biases observed within this specific dataset.
The aggregate performance for each instrument over the two observed days is summarized in the following matrix, sorted by cumulative daily percent change:
| Symbol | Daily Percent Change (2-Day Sum) |
|---|---|
| IEF | 0.3094% |
| UTHY | 0.2945% |
| TLT | 0.2650% |
| IEI | 0.2336% |
| SHY | 0.1207% |
Analysis of the combined daily percent changes for all symbols indicates an overall positive directional bias for the two-day period. The sum of the cumulative gains across all five instruments totals approximately +1.2232%. This collective upward movement suggests an overall higher trend within this specific cohort of fixed-income instruments, with all symbols concluding the two-day period in positive territory. IEF exhibited the strongest cumulative gain, while SHY registered the smallest, yet still positive, total increase.
Market breadth metrics over the two days reveal evolving sentiment. On 2025-10-13, the market breadth was mixed, with three symbols (IEF, IEI, SHY) advancing and two symbols (TLT, UTHY) declining. This pattern suggests a selective positive bias, primarily favoring shorter- to intermediate-duration instruments on that specific day, while longer-duration assets experienced minor pullbacks. The subsequent day, 2025-10-14, showed a notable improvement in breadth, with four symbols (TLT, UTHY, IEF, IEI) advancing and only one symbol (SHY) declining. This shift indicates a strengthening of bullish sentiment as a broader array of instruments participated in the upward movement, including a reversal in the previously declining TLT and UTHY.
The observed data makes it highly likely that the dominant trend for these instruments over the two-day period was positive. The increasing number of advancing issues from the first day to the second, combined with the overall positive cumulative performance of all symbols, strongly suggests a bullish underlying momentum. However, the isolated decline in SHY on the second day, following its initial advance, introduces a minor element of mixed signals within an otherwise strong upward bias. It is judged that the positive breadth on the latter day, especially the broad-based participation, indicates a reinforcing upward price action across these bond ETFs. An alternative scenario of a flat or significantly mixed market appears unlikely given the consistent positive overall sums and improved breadth on the second day, though individual daily fluctuations highlight the potential for intraday or short-term counter-movements.
The technical landscape for the observed fixed income instruments over the past two trading days presents a predominantly bullish picture based solely on the provided data. A comprehensive review of the candle formations and volume metrics suggests a clear upward bias across most symbols, though with varying degrees of conviction.
Specifically, TLT, IEF, and IEI demonstrate particularly robust upward momentum. Each of these symbols recorded two consecutive bullish candles, consistently closing near or at their daily highs. Notably, the second day of trading for TLT, IEF, and IEI was accompanied by an increase in trading volume, which typically reinforces the conviction behind the price movement. This pattern of higher closes on increasing volume suggests it is highly likely that these instruments will continue their upward trajectory in the immediate short term. A reversal of this strong trend based solely on this limited two-day data appears highly unlikely, though minor retracements are always possible within a broader uptrend.
UTHY also registered two strong bullish candles, with both sessions closing at their daily highs. This price action indicates considerable buying pressure. However, the volume profile for UTHY experienced a notable decrease on the second day. While the price continues to advance with conviction, this reduction in volume suggests a roughly even chance that the current strong momentum might decelerate in the very near future, or that the strength of conviction behind the moves is less robust compared to the volume-supported rallies seen in TLT, IEF, and IEI. Nevertheless, the immediate technical bias remains upward.
SHY presents a somewhat nuanced bullish outlook. The initial day observed a strong bullish candle, closing at its high with significant volume. However, the second day’s candle, while still bullish and closing at its high, exhibited a considerably smaller trading range and a notable decrease in volume compared to the prior session. This pattern indicates waning momentum; it is likely that the intense buying pressure from the first day has diminished. While the instrument did not decline, the deceleration suggests that a continuation of a strong upward move is less likely, and a period of consolidation or a minor pullback becomes a roughly even chance in the immediate short term, despite the bullish close.
Considering the collective performance, the provided two-day data predominantly points to an environment of increasing bond prices. The prevalence of strong bullish candle formations across multiple symbols, often supported by increasing volume, suggests a high likelihood of continued upward price action for the fixed income sector represented by these instruments. Traders are advised to monitor for further volume confirmation, especially in instruments like UTHY and SHY where conviction indicators were mixed, to ascertain the durability of the observed short-term trends. A broad market downturn for these assets, based purely on this limited timeframe, is currently unlikely.
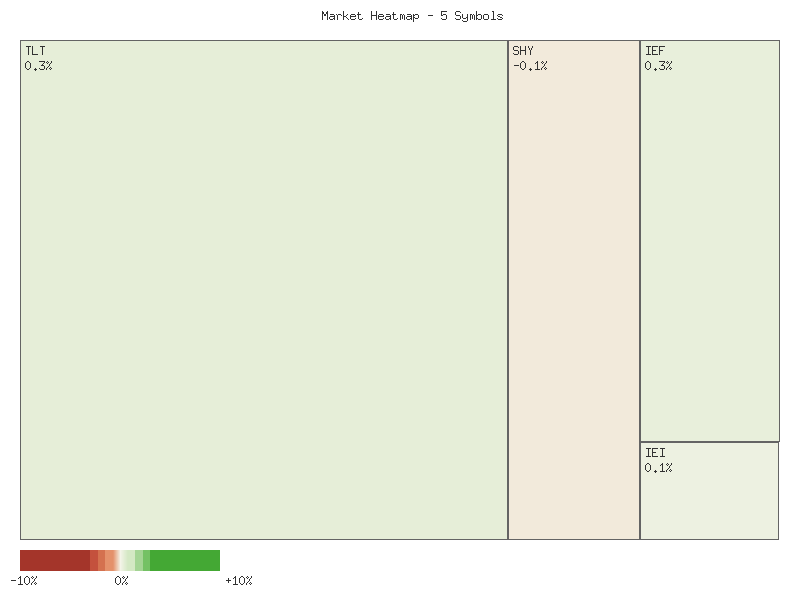
Performance Heatmap (TLT, UTHY, IEF, IEI, SHY)
Generated for 2days timeframe analysis
Crypto
The provided market data for IBIT and ETHA spans a two-day period, offering a concise view of their recent daily percentage changes. The aggregated performance for each symbol is calculated by summing its respective daily changes, which then informs the matrix presentation.
| Symbol | Total Percent Change |
|---|---|
| ETHA | 3.138% |
| IBIT | -3.476% |
Based on the aggregate two-day performance, ETHA concluded with a net positive gain of 3.138%, while IBIT registered a net loss of -3.476%. This indicates a divergent performance across the two observed assets, with ETHA exhibiting net positive momentum and IBIT demonstrating net negative momentum over the very short term. The overall market sentiment for these two symbols, based solely on this limited data, is therefore mixed rather than uniformly higher, lower, or flat.
Analyzing ETHA’s price action reveals a significant initial daily gain of 6.556% on the first day, followed by a material retracement of -3.418% on the second day. This sequence suggests considerable short-term volatility. While the net change remains positive, the substantial pullback on the second day indicates that the immediate continuation of the initial strong bullish momentum without further consolidation is unlikely. Instead, price consolidation or a range-bound movement in the immediate subsequent period appears to be a roughly even chance, as the market processes the recent volatility and partial retracement.
Conversely, IBIT experienced two consecutive negative daily closes, registering declines of -0.589% and -2.887% respectively, culminating in a net negative performance. This pattern of successive lower closes typically indicates short-term bearish momentum, suggesting increasing selling pressure. Absent any counteracting data, a continuation of this downward pressure in the immediate subsequent period is likely, as the technical posture exhibits a clear short-term downtrend. The magnitude of the second day’s decline also indicates an acceleration of this negative momentum.
The observed data presents a scenario of divergent short-term technical postures. For IBIT, the pattern of consecutive bearish closes strongly suggests a prevailing downward pressure, making further depreciation likely in the very short term, assuming no immediate catalyst for reversal. Conversely, ETHA’s trajectory, characterized by a substantial initial gain followed by a partial retracement, indicates a more complex sentiment. While the net positive change provides an underlying bullish bias, the immediate future direction post-retracement is subject to greater uncertainty; a continuation of the prior day’s retracement versus a renewed attempt at upward momentum appears to be a roughly even chance without additional data points to confirm directional conviction. Market participants are advised to seek further confirmation beyond these two data points to establish more robust directional biases.
Magnificent 7 & Friends
Analysis of the aggregated daily percent change across the provided symbols reveals a mixed yet slightly positive market sentiment over the two-day period. Of the ten symbols analyzed, seven demonstrated overall advancing performance, while three registered declines. The aggregate sum of the total daily percentage changes for this group of symbols is approximately +1.234%, which is indicative of a generally positive underlying market sentiment. However, the distribution and magnitude of these changes necessitate a more granular examination, as several constituents experienced notable reversals on the second day.
Leading the performance were AVGO, TSLA, and GOOGL, which posted significant total gains of 6.355%, 3.892%, and 3.737% respectively. AVGO’s substantial two-day appreciation is particularly noteworthy, likely reflecting strong buying interest or a positive fundamental catalyst not observable in the provided technical data alone. While TSLA experienced a notable pullback on the second day, its overall strength suggests sustained underlying demand over the two-day window. These robust performances among several large-cap technology-related names are likely to act as anchors for overall market strength, drawing attention and potentially capital within their respective segments.
Conversely, ANET, CRWV, and NVDA concluded the two-day period with significant losses, registering -10.189%, -3.034%, and -1.585% respectively. ANET’s steep decline suggests considerable bearish pressure, making a near-term reversal unlikely without substantial positive shifts in underlying market dynamics or company-specific news not evident in this dataset. NVDA’s pattern is also of interest, as it experienced a strong positive change on the first day only to reverse sharply lower on the second, resulting in a net negative performance. This divergence among high-profile technology stocks suggests underlying selective weakness or profit-taking in specific areas, even amid broader positive breadth.
A key observation across the majority of symbols is a pattern of positive daily performance on the first day, followed by a negative or significantly reduced positive performance on the second day. Examples include TSLA, AMZN, MSFT, NVDA, AVGO, META, and CRWV. This dynamic suggests an increase in selling pressure or profit-taking activity on the second day, which absorbed much of the initial upward momentum. This trend introduces uncertainty regarding the sustainability of the initial bullish impulse; it is a roughly even chance whether this represents healthy consolidation within an ongoing upward trend or the initiation of a more sustained corrective phase for these individual equities. Investors should observe subsequent price action closely to discern the prevailing short-term directional bias.
The overall price action for the analyzed symbols is summarized in the matrix below:
| Symbol | Total Daily Percent Change |
|---|---|
| AVGO | 6.355% |
| TSLA | 3.892% |
| GOOGL | 3.737% |
| AAPL | 1.019% |
| MSFT | 0.511% |
| META | 0.490% |
| AMZN | 0.038% |
| NVDA | -1.585% |
| CRWV | -3.034% |
| ANET | -10.189% |
Technical Market Commentary: Two-Day Price Action Analysis
Analyzing the provided two-day market data across ten prominent symbols, the overall short-term sentiment appears to lean bearish for a significant portion of the observed equities. Several assets exhibited clear signs of downward momentum or bearish reversals, while a smaller subset showed either consolidation or a continuation of bullish trends. This brief period suggests a market segment currently contending with selling pressure, particularly evident in those stocks displaying increased volume on their down days.
A review of the technical data indicates that NVDA, AMZN, CRWV, and ANET experienced notably strong bearish price action. NVDA demonstrated a significant bearish candle on the second day, gapping down and closing near its low on substantially increased volume, making further downward momentum likely. Similarly, AMZN presented a compelling bearish engulfing pattern with robust volume on the second day, suggesting continued downward pressure is likely. CRWV displayed a decisive breakdown on Day 2, closing near its low on increased volume after an indecisive prior session, indicating likely continued weakness. ANET stands out with two consecutive strong bearish candles, including a gap down, closing near its low on both days. This aggressive price action makes further downward momentum highly likely, and a rapid reversal in the immediate term is unlikely.
Other names, including TSLA, AVGO, and META, also showed bearish reversal patterns. TSLA formed a dark cloud cover or bearish engulfing pattern, with the second day’s bearish candle negating much of the first day’s bullish gain. While volume decreased, a short-term downward bias is likely, with a roughly even chance of finding support at the second day’s low. AVGO, after a strong bullish Day 1, produced a significant bearish candle on Day 2, also suggesting likely continued weakness. However, the notable decrease in volume on this bearish day presents a roughly even chance for either a continuation of the downtrend or a potential bounce if buying interest re-emerges quickly. META exhibited a dark cloud cover pattern, with the second day’s close well below the first day’s open, indicating likely near-term downward pressure. The reduced volume on the down day suggests a roughly even chance for consolidation rather than an immediate steep decline.
In contrast, GOOGL exhibited consistent bullish momentum, with two consecutive higher closes, higher highs, and higher lows. This pattern suggests continued upward momentum is likely, although the slight decrease in volume on the second day presents a roughly even chance for a minor pullback before continuation. AAPL and MSFT displayed more range-bound or consolidating behavior. AAPL saw minimal net change over the two days, with relatively tight trading ranges, indicating a roughly even chance of a breakout in either direction but making a strong directional move unlikely without further catalysts. MSFT also remained largely contained, with a hammer-like candle on Day 2 suggesting buyers emerged at lower levels, yet the overall price action indicates a roughly even chance of a near-term bounce or continued consolidation, with a strong directional move unlikely.
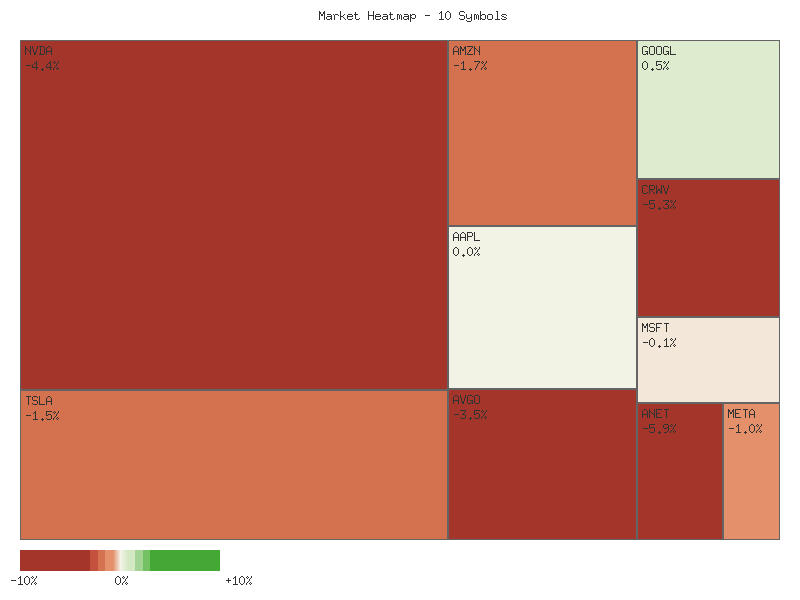
Performance Heatmap (TSLA, MSFT, AAPL, META, NVDA, AVGO, GOOGL, AMZN, CRWV, ANET)
Generated for 2days timeframe analysis
S&P 500 Sector Breadth
Technical analysis of the provided market data for 11 S&P 500 sector ETFs reveals several key observations regarding market breadth, sector performance, and potential rotational dynamics over the two-day period ending 2025-10-14. All eleven symbols recorded positive net percentage changes over the two-day period when summing their individual daily values, suggesting an overall higher trend across the observed sectors. Market breadth on the latest trading day (2025-10-14) indicates broad participation in the advance, with nine symbols closing higher and only two declining. This positive breadth pattern likely suggests underlying market strength.
Examination of sector performance on the latest day reveals a nuanced picture. All defensive sectors—Utilities (XLU), Consumer Staples (XLP), Health Care (XLV), and Real Estate (XLRE)—recorded positive daily changes. Concurrently, five out of seven offensive sectors—Consumer Discretionary (XLY), Financials (XLF), Industrials (XLI), Materials (XLB), and Communication Services (XLC)—also advanced. However, Technology (XLK) experienced a notable decline of -1.283%, and Energy (XLE) registered a marginal negative change of -0.012%. This divergence within offensive sectors, coupled with the unanimous advance of defensive sectors, indicates a likely shift in internal market leadership, potentially away from high-growth technology names.
The collective behavior of these sectors offers insights into market sentiment. While more offensive sectors (5) advanced compared to defensive sectors (4), the strongest daily gain was observed in a defensive sector (XLP, +1.606%), and the most significant decline was in a major offensive sector (XLK). This performance profile suggests a mixed market sentiment. It is a roughly even chance that market participants are rotating towards defensive plays and certain value-oriented offensive sectors like Industrials and Financials, despite a slight majority of offensive sectors showing positive returns. An alternative scenario is that the weakness in Technology represents profit-taking or sector-specific headwinds, rather than a broad-based shift away from offensive equities.
The following matrix details the daily percentage change for each symbol on the latest trading day, 2025-10-14, sorted in descending order:
| Symbol | Daily Percent Change |
|---|---|
| XLP | 1.606% |
| XLI | 1.175% |
| XLF | 1.101% |
| XLB | 0.997% |
| XLRE | 0.953% |
| XLU | 0.891% |
| XLC | 0.659% |
| XLV | 0.275% |
| XLY | 0.210% |
| XLE | -0.012% |
| XLK | -1.283% |
As a Chartered Market Technician with over 15 years of experience, a rigorous technical analysis of the provided two-day market data for eleven SPDR sector ETFs reveals a predominantly bullish, albeit divergent, short-term landscape. The majority of sectors displayed notable upward momentum, closing higher on the second day, often accompanied by increased trading volume, suggesting underlying buying pressure. However, a significant divergence is observed in the Technology sector (XLK), which exhibited pronounced weakness, while Energy (XLE) showed signs of indecision despite early-day strength.
Several sectors demonstrate clear bullish patterns within this two-day window. XLI (Industrials) and XLF (Financials) presented particularly strong bullish thrusts on the second day, closing significantly higher and near their session highs, with XLF’s advance notably confirmed by a substantial increase in volume. Similarly, XLC (Communication Services), XLY (Consumer Discretionary), XLP (Consumer Staples), XLRE (Real Estate), XLV (Health Care), and XLB (Materials) all recorded higher closes on the second day, generally near their highs, suggesting sustained buying interest. While XLU (Utilities) also posted a higher close, its slightly decreased volume on the second day indicates that while upward momentum is present, the conviction might be marginally less robust compared to sectors with increasing volume. Given these patterns, a continuation of upward price action for these nine sectors is likely in the immediate term.
Conversely, the Technology sector (XLK) stands out with a clear bearish signal. On the second day, XLK opened lower and closed significantly below its first-day close, near its session low, on higher volume. This price action, which resembles a bearish engulfing pattern, suggests that sellers gained control and were able to push prices lower with conviction. Based purely on this two-day data, a continuation of bearish pressure for XLK is likely. Meanwhile, XLE (Energy) displayed a more ambiguous signal. Despite a wider range and increased volume on the second day, XLE’s close was virtually identical to the first day’s close. This suggests a roughly even chance of either a slight upward bias or continued sideways consolidation, as buyers failed to establish a definitive higher close, indicating market indecision despite increased activity.
The collective technical picture, derived solely from these two daily candles, suggests a highly differentiated market. The broad strength across Consumer Discretionary, Staples, Real Estate, Industrials, Financials, Health Care, Materials, and Communication Services indicates that capital inflows are favoring a wide array of segments. However, the distinct weakness in Technology raises concerns about potential rotations or profit-taking within that crucial sector. Further monitoring of volume trends will be essential, as a significant decline in volume during subsequent bullish moves in the strong sectors would suggest diminishing buying conviction, potentially leading to a roughly even chance of a pullback or consolidation. Conversely, a strong bullish reversal in XLK on increased volume would challenge the current bearish assessment, but based on the provided data, such a scenario is unlikely in the immediate short-term.
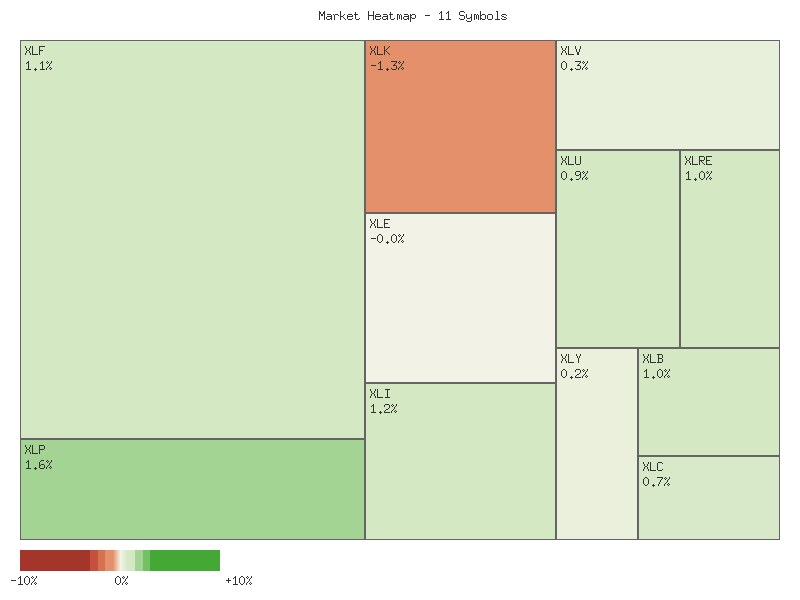
Performance Heatmap (XLP, XLRE, XLI, XLU, XLV, XLY, XLF, XLB, XLE, XLC, XLK)
Generated for 2days timeframe analysis
Equity Breadth
Analysis of the provided market data for the S&P 500 reveals shifts in market breadth indicators over the seven-day period, impacting the short-term trend as indicated by the 20-day Exponential Moving Average (EMA). The percentage of S&P 500 members trading above their 50-day moving average (SPXA50R) initially declined from 57.68% on 2025-10-06 to a low of 33.73% on 2025-10-10, before recovering to 48.10% by 2025-10-14. Concurrently, the percentage of members above their 200-day moving average (SPXA200R) showed a similar pattern, falling from 61.88% to 50.30% during the same initial period, then regaining strength to 57.68% by the end of the observation window.
The short-term breadth, represented by SPXA50R, experienced a notable weakening. The sharp decline to 33.73% on 2025-10-10 suggests a significant number of S&P 500 components deteriorated below their short-term trend lines. While a recovery followed, with the metric rising to 48.10%, the inability of SPXA50R to reclaim the 50% threshold by the end of the period indicates that less than half of the index members are currently participating in a short-term uptrend. This typically signals a lack of broad-based short-term strength and introduces uncertainty into the sustainability of any potential upward price movements for the index.
In contrast, the intermediate-term breadth, SPXA200R, demonstrated more resilience. Although it also experienced a decline, reaching a nadir of 50.30%, it narrowly avoided falling below the critical 50% level. The subsequent recovery to 57.68% on 2025-10-14 indicates that a substantial majority of S&P 500 members maintain positions above their longer-term moving averages. This resilience in SPXA200R suggests that while short-term momentum has faltered, the underlying intermediate-term market structure appears to have absorbed the selling pressure without significant damage to the broader uptrend, at least for a majority of constituent stocks.
The EMA_20_DAY for the SPX exhibited an upward trend from 6637.90 on 2025-10-06, peaking at 6663.12 on 2025-10-09, before reversing to a downward-to-sideways trajectory, concluding at 6651.98 on 2025-10-14. This peak in the EMA_20_DAY on 2025-10-09 coincided with the initial sharp declines in both SPXA50R and SPXA200R. The subsequent flattening and slight downturn in the EMA_20_DAY, despite the recovery in both breadth indicators, aligns with the mixed breadth picture. The persistent weakness in SPXA50R below 50% likely acted as a headwind, preventing a renewed upward acceleration of the EMA.
Considering the data, it is roughly even chance that the EMA_20_DAY will remain in a sideways-to-slightly-declining trend in the immediate future. The short-term participation, as reflected by SPXA50R remaining below 50%, is likely to exert downward pressure or at least limit upward momentum for the SPX’s 20-day EMA. However, the robust recovery of SPXA200R to 57.68% suggests underlying intermediate-term support, making a significant breakdown of the EMA_20_DAY less probable in the absence of further negative breadth developments. A scenario where SPXA50R decisively reclaims and sustains above 50% would likely precede a renewed upward trend in the EMA_20_DAY. Conversely, if SPXA200R were to turn down and fall below 50%, it would increase the probability of a more significant downward trend for the EMA_20_DAY.
SPX Daily
The SPX exhibited significant volatility over the past seven days. After closing at 6714.59 on 2025-10-07 and reaching a high of 6753.72 on 2025-10-08, the index experienced a sharp decline, closing at 6552.51 on 2025-10-10. This downturn caused the 14-day Relative Strength Index (RSI) to fall from 69.90 to 42.07, shifting momentum from near overbought conditions to a more neutral, almost oversold posture. The subsequent two trading days, 2025-10-13 and 2025-10-14, showed a partial recovery, closing at 6654.72 and 6644.31 respectively. The latest candle on 2025-10-14, with an open of 6602.49 and a close of 6644.31, suggests underlying resilience. The current RSI is 51.47, indicating neutral momentum.
Exponential Moving Averages consistently depict a robust long-term bullish trend. The 50-day EMA, at 6542.88 on 2025-10-14, has consistently remained above the 200-day EMA, which was at 6134.29, throughout the 90-day period. Both moving averages display an upward trajectory. This persistent “golden cross” configuration indicates enduring market strength. The price briefly breached the 50-day EMA on 2025-10-10 but promptly reclaimed and maintained this level on 2025-10-13 and 2025-10-14, confirming its role as dynamic support. The 200-day EMA continues its ascent, reinforcing the overall positive market structure despite recent short-term fluctuations.
For future price action, the recent high of 6753.72 (2025-10-08) and the 6700-6720 area are probable resistance levels following the recent reversal. Critical dynamic support is provided by the 50-day EMA, currently near 6542.88. A breach below this level could activate the 6550.78 low from 2025-10-10 as psychological support. A more significant support zone could emerge around the 6440-6460 region, consistent with prior price action in late August and early September.
A bullish scenario is plausible if the SPX can sustain its position above the 50-day EMA. The RSI’s bounce from near oversold conditions to a neutral level suggests diminishing selling pressure, and reclaiming the 50-day EMA reinforces this. A sustained move above 6700 is likely to attract further buying interest, making a retest of the 6753.72 high probable. The dominant long-term bullish trend, as indicated by the ascending and well-separated EMAs, supports the interpretation that the recent downturn was a corrective phase within an ongoing uptrend.
Conversely, a bearish case could develop if the recent recovery is identified as a temporary bounce. The sharp decline on 2025-10-10, breaking a rising pattern and occurring from near overbought RSI levels, indicates a potential shift in momentum. If the SPX fails to overcome the 6700-6720 resistance and subsequently breaches the 50-day EMA (6542.88), a retest of the 6550.78 low from 2025-10-10 is probable. A sustained move below this near-term support could expose the 6440-6460 zone, making a deeper correction likely. The current neutral RSI does not preclude renewed selling pressure.
A neutral outlook suggests the market might enter a phase of consolidation, reflecting roughly even chances for a breakout in either direction. The recent volatility could lead to the SPX trading within a defined range, bounded by the 6540 support (50-day EMA) and the 6700-6720 resistance. This scenario is supported by the RSI’s neutral position (51.47), reflecting market indecision. Technical sentiment, having recently shifted from strong bullishness to a more cautious stance after the 2025-10-10 decline, appears to be in an evaluative phase, with participants assessing whether the underlying bullish momentum will reassert itself or if the recent weakness represents the onset of a larger corrective phase.
SPX Technical Analysis: Post-Correction Momentum Assessment
The SPX maintained a robust uptrend for much of the past 90 days, evidenced by a steady ascent from approximately 5987 in early June to peaks above 6750 in early October. This sustained bullish price action was generally supported by positive momentum readings from both the 14-day Relative Strength Index (RSI) and the 13-21-day Percentage Price Oscillator (PPO). However, the most recent data indicates a probable shift in market dynamics. The significant price decline on October 10 from open 6740.49 to close 6552.51 marks a notable disruption to the prevailing upward trajectory. This sharp single-day correction, reversing several days of prior gains, suggests that the market’s immediate bullish impetus has been substantially challenged.
Prior to the October 10 decline, both momentum indicators exhibited discernible negative divergences against price. The 14-day RSI reached a high of 74.75 on September 22, subsequently trending lower, registering 69.90 on October 8, even as the SPX recorded a higher high of 6753.72 on the same day. Similarly, the 13-21-day PPO peaked at 0.635 on September 22, then showed a declining trajectory, only managing a modest rebound to 0.568 by October 6, failing to confirm the new price highs. These negative divergences, where momentum failed to keep pace with or actively declined as prices advanced, often precede market corrections and made a substantial price downturn likely.
Following the sharp correction, the 14-day RSI plummeted from around 70 to 42.07 on October 10, subsequently stabilizing around 51.47 by October 14. This movement from overbought into a neutral territory, coupled with the sharp drop, implies a significant loss of bullish pressure. Concurrently, the PPO underwent a rapid decline, moving from 0.568 on October 6 to 0.282 by October 14. Although the PPO remains above zero, indicating that the longer-term bullish momentum has not completely reversed, its pronounced downward slope suggests deteriorating underlying strength. The current technical posture suggests that a rapid resumption of the prior strong uptrend is unlikely in the immediate term.
The price action following the October 10 sharp drop, with subsequent closes at 6654.72 (Oct 13) and 6644.31 (Oct 14), suggests an attempt at stabilization. This could represent a retest of the breakdown level or the formation of a short-term trading range. Given the significant loss of momentum indicated by both RSI and PPO, there is a roughly even chance that the current price stabilization could either precede further downward movement, potentially towards previous support levels from mid-August around the 6350-6450 area, or establish a new, less steep upward trend if buying interest re-emerges. However, the lack of positive divergence on the indicators during this stabilization phase suggests that the bearish momentum might yet dominate. A continuation of the PPO’s decline below zero would signal a more definitive shift to a bearish intermediate-term trend, which at this juncture, is a plausible but not yet likely scenario.