Daily Market Technical Analysis
Market Overview
The market experienced a significant equity sell-off on October 10th, followed by a strong but potentially unconfirmed rebound on October 13th, with positive index breadth and a VIX decline. However, the recovery lacks broad conviction, as many bullish reversals for SPX, QQQ, and several Magnificent 7 stocks occurred on diminished volume. SPX’s Relative Strength Index and Percentage Price Oscillator indicate momentum dissipation, suggesting a short-term correction or consolidation is likely, and the recent bounce is a roughly even chance temporary retracement. While precious metals (SLV, GLD) show strong upward momentum and short-duration bonds (SHY) are highly likely to see continued upside, Natural Gas (UNG) and certain tech names (ANET) are likely to face further downside. This bifurcated market demands selective engagement.
Market Indices
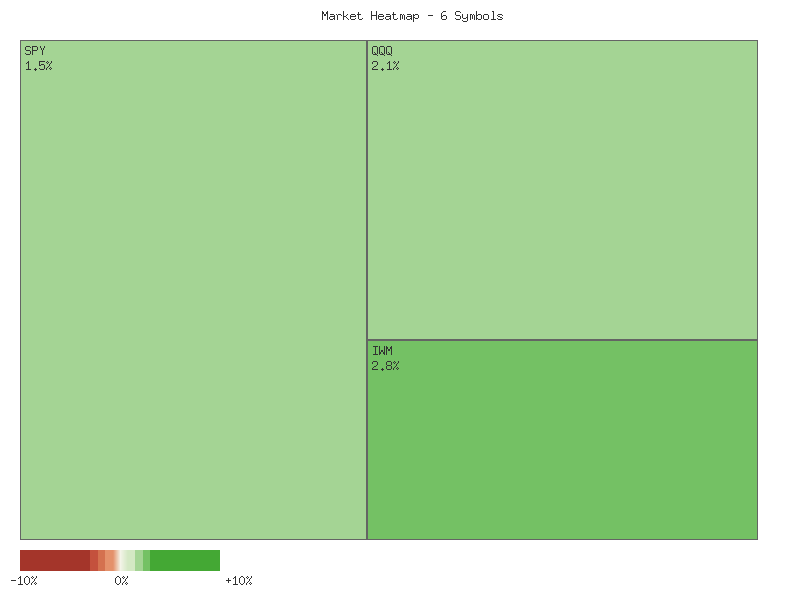
The market observed on 2025-10-13 suggests a notable reversal in equity indices following a significant decline on 2025-10-10. The daily percent change values for the most recent day, sorted in descending order, are as follows:
| Symbol | Daily Percent Change (2025-10-13) |
|---|---|
| IWM | 2.7840% |
| QQQ | 2.1221% |
| IJR | 2.0215% |
| MDY | 1.9298% |
| OEF | 1.7450% |
| SPX | 1.5599% |
The collective sum of these daily percent changes for 2025-10-13 totals approximately 12.16%, indicating a broadly higher market for these representative indices. Market breadth for this specific group on 2025-10-13 was overwhelmingly positive, with all six symbols advancing. This suggests a widespread upward movement rather than isolated strength, which would probably be considered a constructive technical development in the short term. Conversely, on 2025-10-10, all six symbols experienced declines ranging from -2.71% to -3.47%, presenting a clear pattern of broad market weakness immediately prior to the recent rebound.
The VIX data provides crucial context for these equity movements. On 2025-10-10, the VIX experienced an extraordinary daily percentage change of +31.83%, closing at 21.66. This sharp spike likely correlated with the broad equity sell-off observed on the same day across SPX, QQQ, and other indices. Subsequently, on 2025-10-13, the VIX posted a significant decline of -12.14%, closing at 19.03. This retracement in volatility coincides directly with the strong rebound in the equity indices. The inverse relationship between VIX and equity performance appears to hold true based on these two data points.
Examining the 7-day VIX candle chart further elaborates on the volatility landscape. From October 3rd to October 9th, the VIX largely traded in a range between 16.19 and 17.55, with closes fluctuating between 16.30 and 17.24. The dramatic shift occurred on October 10th, where the VIX gapped up from an open of 16.36, soared to a high of 22.44, and closed strongly at 21.66, reflecting a palpable surge in market fear or uncertainty. Although the VIX subsequently declined on October 13th, closing at 19.03, it remains appreciably higher than its pre-October 10th levels.
The current technical posture suggests that the market has experienced a significant increase in volatility, followed by a partial, but not complete, abatement. The strong positive performance in equities on October 13th is probably a direct response to the VIX’s retreat from its peak. A continuation of VIX declines below the 19.00 level would likely be supportive for further equity gains. Conversely, if the VIX finds support around its current level or experiences renewed upward pressure, a re-emergence of downside risk for equities is a roughly even chance, potentially signaling that the underlying uncertainty has not fully dissipated. Further observation of the VIX’s trend relative to its pre-October 10th range (below 17) will be crucial in assessing the durability of the recent equity rebound.
As a CMT with extensive experience, my analysis of the provided two-day market data for SPY, QQQ, IWM, IJR, MDY, and OEF reveals a consistent technical pattern across various market capitalization segments. On October 10th, all six instruments experienced significant bearish price action, closing near their respective lows with notable trading volumes. This synchronized downturn, characterized by large bearish candles, indicates a broad-based, conviction-driven selling event that affected large-cap, technology-heavy, mid-cap, and small-cap indices uniformly, suggesting a pervasive shift to bearish sentiment in the short term.
Following this sharp decline, October 13th presented a contrasting picture across the board. All instruments gapped up from their prior day’s close and subsequently formed bullish candles, with closes higher than their respective opens. This rebound indicates an emergence of buying interest or short-covering within the trading day. However, a critical observation is the significantly diminished trading volume on October 13th compared to the heavy selling volume of October 10th. For instance, SPY’s volume nearly halved, and OEF experienced an even more dramatic reduction. This suggests that while selling pressure may have abated, the conviction and participation behind the renewed buying activity were comparatively weaker.
Upon closer examination of the two-day price action, a distinct candlestick pattern, the Bullish Harami, is uniformly discernible across all six instruments. This pattern is formed by a large bearish candle (October 10th) followed by a smaller bullish candle (October 13th) whose entire real body is contained within the real body of the preceding bearish candle. In this specific instance, the pattern also features an upward gap from the prior close, a characteristic that often accompanies reversal attempts. The consistency of this pattern across such diverse market segments is technically significant, implying a coordinated technical signal.
The Bullish Harami is traditionally interpreted as a reversal pattern, typically signaling a potential short-term bottom after a downtrend. Given the strong bearish move on October 10th, the emergence of this pattern suggests that a short-term bottom followed by an upward price correction is likely. The gap-up opening further reinforces the idea of an immediate shift in sentiment. However, the significantly lower volume accompanying the bullish candle on October 13th introduces a degree of uncertainty regarding the sustainability and strength of this potential reversal. While a rebound is likely, its duration and ultimate upward potential are less certain due to the lack of strong conviction volume.
Considering alternative scenarios, while a short-term rebound appears to be the more likely immediate outcome based on the Bullish Harami pattern, the diminished volume on the bullish day implies that this could merely be a temporary short-covering rally rather than a fundamental shift in robust buying interest. Therefore, there remains a roughly even chance that the market could resume its downward trajectory if subsequent trading days fail to show increased buying volume and a decisive break above the high of the October 13th candle. Confirmation, such as a strong follow-through day with higher volume pushing prices above the midpoint or even the open of the October 10th bearish candle, would be necessary to increase the probability of a sustained reversal. Absent such confirmation, the potential for a resumption of selling pressure remains a viable scenario in the immediate term, though slightly less likely than a short-term rebound.
As a Chartered Market Technician with over 15 years of experience, I have rigorously analyzed the provided 90-day market data for the SPX, focusing exclusively on price action, the 14-day Relative Strength Index (RSI), and the 13-21 day Percentage Price Oscillator (PPO).
The SPX has demonstrated a clear upward trend over the provided 90-day period, characterized by successive higher highs and higher lows through much of June, July, September, and early October. This sustained advance saw the index move from the 5900s to highs above 6700. However, the most recent price action, specifically the sharp decline on 2025-10-10 from a close of 6735.11 to 6552.51, represents a notable shift in the short-term market dynamics. While the index subsequently experienced a partial recovery to 6654.72 on 2025-10-13, the preceding strong downside movement is significant. The absence of volume data limits our ability to confirm the conviction behind these price moves, but the directional change is evident.
The 14-day Relative Strength Index (RSI) provides compelling evidence of a momentum shift. Throughout the primary uptrend, the RSI frequently entered overbought territory above 70, signaling strong buying pressure. Notable instances include July 03 (75.57), July 25 (76.21), and September 22 (74.75). The RSI’s dramatic fall from 66.12 on 2025-10-09 to 42.07 on 2025-10-10 indicates a rapid and substantial loss of bullish momentum, marking the lowest RSI reading within the entire 90-day data set. While the subsequent rebound to 52.49 on 2025-10-13 suggests some re-entry of buyers, the prior severe dip below the 50-level, traditionally a momentum threshold, implies that bearish sentiment has gained considerable ground. It is roughly even chance that this bounce is a temporary retracement within a developing bearish phase, rather than an immediate resumption of the prior uptrend.
Complementing the RSI, the Percentage Price Oscillator (PPO) 13-21 day indicates a clear weakening of the underlying trend strength. The PPO remained in positive territory throughout the 90-day period, initially rising with the price in June and July, confirming strong bullish momentum (e.g., reaching a peak of 0.9398 on 2025-07-03). However, despite the SPX reaching new price highs in early October (e.g., 6740.28 on 2025-10-06), the PPO’s subsequent peak on 2025-09-22 at 0.6350 remained significantly below its July peak. This divergence between rising price and weakening momentum, particularly the PPO’s overall declining trend from its July highs, is a significant cautionary signal. The sharp drop in the PPO from 0.5445 on 2025-10-09 to 0.3340 on 2025-10-13, reaching its lowest point since 2025-09-02, strongly corroborates the substantial loss of upward momentum identified by the RSI. The downward trajectory of the PPO suggests that bullish conviction is dissipating, even though the indicator remains above zero.
Based on the combined technical evidence, it is likely that the SPX is undergoing a significant short-term correction or a period of consolidation following its protracted rally. The sharp drop in both the 14-day RSI to deeply bearish levels and the PPO to its recent lows signals a substantial erosion of buying pressure and momentum. Although a bounce occurred on 2025-10-13, it is unlikely to immediately reverse the emerging short-term bearish bias given the magnitude of the preceding momentum shift. An alternative scenario, though less likely in the immediate term, is that the 2025-10-10 decline was a brief anomaly, and the market will quickly resume its robust uptrend if the RSI can sustain a move back above 60 and the PPO begins to trend upward more aggressively. However, the current technical posture strongly suggests that downside pressure is likely to persist or at least lead to further ranging before a clear resumption of the previous uptrend.
Technical Analysis of QQQ (90-day Horizon)
The Price Percentile Oscillator (PPO_13_21_DAY) and the 14-day Relative Strength Index (RSI_14_DAY) for QQQ over the past 90 days indicate a robust underlying uptrend, albeit with recent signals suggesting a significant shift in immediate-term momentum. Price action observed through the candlestick data confirms a series of higher highs and higher lows, particularly from early June through early October, with QQQ advancing from the 520s to over 610. This general bullishness was frequently accompanied by RSI values in the overbought region (above 70), peaking at 75.35 on September 22 and 71.57 on October 2. While such readings often precede consolidations or pullbacks, the asset generally sustained its upward trajectory, demonstrating persistent buying pressure following brief dips. The PPO maintained positive values throughout most of this period, affirming the presence of bullish momentum, though the magnitude of the PPO’s peaks did not consistently reflect the new price highs achieved in late September and early October compared to peaks earlier in the observed period.
A critical inflection point in the data appears on October 10. Following a period where the RSI had again moved above 70 (peaking at 71.57 on Oct 2 and remaining elevated until Oct 9), a sharp sell-off occurred. The candlestick data reveals a substantial decline from a close of 610.70 on October 9 to 589.50 on October 10, accompanied by an unusually high volume of 94.4 million shares. This significant single-day price depreciation represents a noticeable change in market behavior. Concurrently, the 14-day RSI plunged from 69.27 on October 9 to 45.42 on October 10, moving from a near-overbought state to a neutral-to-oversold signal in one trading session. Similarly, the PPO experienced a sharp drop from 0.768 on October 9 to 0.583 on October 10, indicating a rapid erosion of short-term bullish momentum. This combination of a large bearish candle on high volume, coupled with rapid declines in both RSI and PPO from elevated levels, signals a likely short-term top in price and a shift in sentiment.
The price action on October 13 shows a partial recovery, with QQQ closing at 602.01, significantly higher than the previous day’s close. This bounce pushed the RSI back to 55.21 and the PPO to 0.538. While this suggests immediate buying interest following the sharp sell-off, it is crucial to note that the recovery occurred on lower volume (65.2 million) compared to the selling volume on October 10. Furthermore, the PPO on October 13 is still below its level prior to the significant drop, and importantly, it is still declining in overall trend from its higher points in June and July, failing to confirm the new price highs with corresponding momentum strength. This indicates a potential negative divergence, where price makes new highs but momentum indicators do not.
Based on these observations, it is likely that the asset has entered a period of consolidation or further downside pressure. The recent sharp decline, amplified by high volume and the corresponding dramatic shifts in RSI and PPO, strongly suggests that the immediate bullish momentum observed in late September and early October has dissipated. A sustained rally from current levels, which would be indicated by the RSI definitively moving back above 60 and the PPO turning upward with conviction, seems unlikely without further consolidation or a retest of support. There is a roughly even chance that QQQ may attempt to retest the October 10 low (around 589.50) in the near term, or at least consolidate within a range below its recent highs. Should the support around the October 10 low fail to hold, a further decline would probably ensue, as the underlying momentum, as measured by the PPO, appears to be weakening despite the higher price levels. Conversely, a strong surge in buying volume accompanying a rise in both RSI and PPO would be required to signal a resumption of the prior strong uptrend.
As a seasoned CMT with over 15 years of experience, my analysis of IWM’s 90-day technical data reveals a prevailing upward trend, punctuated by recent short-term volatility and conflicting momentum signals. Over the past three months, IWM has established a likely bullish trajectory, characterized by higher highs and higher lows, reflecting consistent buying interest. Notable rallies occurred from late June into early July, and then again from early August through mid-September, pushing prices to new peaks. These periods of ascent were typically followed by pullbacks, suggesting a tendency for profit-taking after strong moves, but overall, the price structure indicates a sustained positive bias.
The immediate price action warrants close attention. On October 10, IWM experienced a significant bearish candle, closing sharply lower on exceptionally high volume, which likely indicates strong selling pressure entering the market. However, the subsequent trading day, October 13, showcased a robust bullish response. IWM opened lower but successfully rallied to close near its daily high at 244.41, reclaiming a substantial portion of the previous session’s losses. This price action on October 13 suggests a roughly even chance of a short-term rejection of further downside, potentially forming a bullish engulfing pattern if confirmed by the next candle.
The 14-day Relative Strength Index (RSI) has largely corroborated price movements, frequently entering overbought territory (above 70) during strong rallies, such as on July 3 (71.57) and September 18 (71.23), often preceding minor corrections. The sharp decline on October 10 caused the RSI to drop significantly to 44.97, indicating a notable reduction in bullish momentum from its earlier high of 60.08 on October 9. Nevertheless, the strong bullish reversal on October 13 led to an equally sharp rebound in RSI to 55.77. This swift recovery from neutral territory likely signals that underlying buying interest remains resilient, preventing a deeper momentum breakdown.
In contrast, the Percentage Price Oscillator (PPO) presents a more cautious outlook. After a strong bullish phase from mid-August, marked by a zero-line crossover that initiated a clear intermediate-term uptrend, the PPO has recently shown signs of deteriorating momentum. It began a consistent decline in late September and continued this trend through the October 10 price drop. Critically, even with IWM’s price recovery on October 13, the PPO registered a slight further decline, moving from 0.50 to 0.48. This divergence, where price shows immediate strength but the PPO continues to weaken, suggests a roughly even chance that the underlying bullish momentum is struggling to fully re-establish itself, possibly indicating further consolidation ahead.
Considering these factors, it is likely that IWM will navigate a period of heightened uncertainty and potentially choppy trading in the immediate future. The compelling bullish reversal candle on October 13, supported by a strong bounce in RSI, suggests that the market likely found a short-term floor. However, the persistent weakening trend in the PPO indicates that sustained upward momentum beyond the initial bounce may face challenges. A decisive breakout above the October 9 closing price of 245.13 would likely signal the resumption of the broader bullish trend. Conversely, a failure to maintain prices above the October 10 low of 237.56 would introduce a remote chance of deeper corrective price action, although the resilience shown on October 13 makes this less probable in the very near term.
Tech Sector Analysis
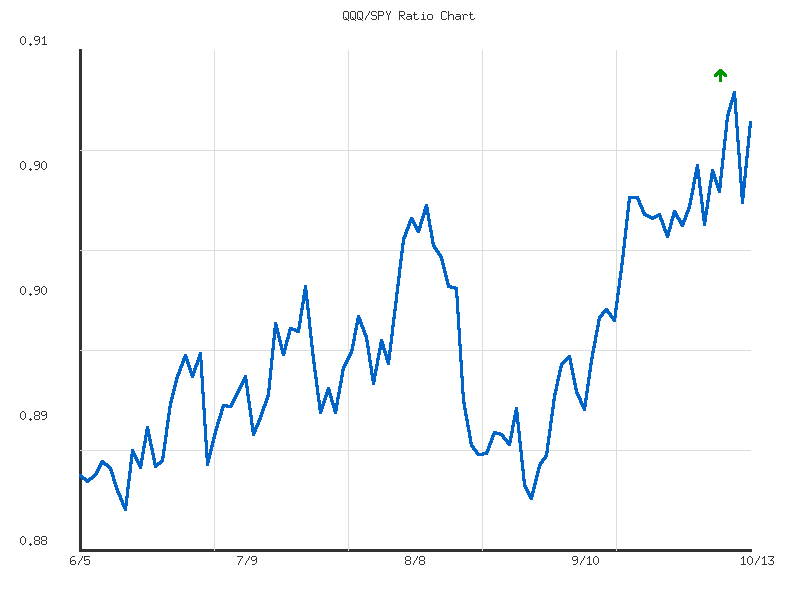
The QQQ/SPY ratio has demonstrated an upward trajectory over the past 30 days, indicating a period of outperformance by the technology-heavy NASDAQ-100 (QQQ) relative to the broader S&P 500 (SPY). The cumulative change in the ratio during this period is approximately 2.78%, reflecting a clear positive directional bias. However, the accompanying trend strength for this 30-day period is categorized as “weak,” which implies that the upward momentum has not been consistently robust or characterized by strong conviction. The current ratio, at 0.9079, sits well above the 30-day average of 0.8983 and is positioned near the upper end of its monthly range, specifically at a 0.926 relative position to its high of 0.9099.
Conversely, the more immediate 14-day analysis reveals a distinct shift in the relative performance trend. For this shorter timeframe, the QQQ/SPY ratio exhibits a “sideways” trend, also described as having “weak” strength. The change percent over the last 14 days is a minimal 0.70%, a stark reduction from the monthly performance, suggesting a significant deceleration in QQQ’s outperformance. During these two weeks, the ratio has fluctuated within a narrow band, from a low of 0.9005 to a high of 0.9099. The current ratio of 0.9079 remains situated towards the higher end of this consolidation range, with a relative position of 0.792. This recent behavior indicates that the prior upward momentum has given way to a phase of market indecision or consolidation between QQQ and SPY.
Considering the broader 30-day upward trend, even with its weak strength, in conjunction with the immediate 14-day sideways and weak trend, it is a roughly even chance that the QQQ will resume its outperformance against the SPY in the immediate future. The current ratio’s proximity to its 30-day high suggests that a fresh leg of significant upward movement might encounter resistance without a renewed catalyst or strengthening of trend. Conversely, a reversion towards the 14-day average ratio of 0.9038 is likely in the short-term, especially given the established “weak” strength of the current sideways trend, which typically precedes mean reversion within such a range.
An alternative scenario involves QQQ entering a period of underperformance relative to SPY. Should the ratio break below its 14-day average and, more critically, breach the 14-day low of 0.9005, then it becomes likely that QQQ could begin to underperform SPY. The low volatility recorded across both periods, specifically 0.000008 for the 14-day data and 0.000049 for the 30-day data, implies that any potential directional shift, whether toward renewed outperformance or a reversal into underperformance, would likely unfold gradually rather than through abrupt, sharp movements. A rapid and significant deviation from the established range is unlikely given the observed historical volatility profile within the provided data.
As a CMT with extensive experience, my analysis of the QQQ/SPY ratio over the past 90 days focuses strictly on the provided technical data, employing rigorous estimative language.
The QQQ/SPY ratio has exhibited a discernible upward trend over the past three months, advancing from approximately 0.8849 in early June to 0.9079 by mid-October. This movement represents a 2.605% appreciation in the relative performance of the Nasdaq 100 (QQQ) against the S&P 500 (SPY) during the observed period. The trend’s direction is unambiguously “up,” indicating a consistent outperformance of growth-oriented, technology-heavy sectors relative to the broader market. However, it is noteworthy that the trend’s strength is explicitly categorized as “weak.” This classification suggests a gradual and potentially less conviction-driven ascent rather than a robust, accelerating momentum, implying that QQQ has gained ground relative to SPY with measured progress.
Examining the more recent data, the ratio achieved its 90-day high at 0.9099 on October 9th. The current ratio of 0.9079 places it at approximately 92.79% of its total range spanning from the 90-day low of 0.8827 to this recent peak. This positioning indicates that QQQ’s relative outperformance against SPY is currently operating near the upper boundary of its observed historical range. From a technical perspective, the immediate area around the 0.9099 high might act as a short-term resistance level. A sustained breakout above this level would signal an acceleration of QQQ’s relative strength and imply potential for further outperformance. Conversely, should the ratio fail to push beyond this recent high, pullbacks would likely find initial support around the 90-day average ratio of 0.8933, which has served as a central tendency point for the majority of the period.
The interplay between the “weak” upward trend strength and the remarkably low volatility (reported as 0.00004499) suggests a high likelihood of continued gradual movements in the ratio rather than sharp, unpredictable shifts. This technical characteristic often implies that market participants are not engaging in aggressive rotations between QQQ and SPY, contributing to a more stable, albeit slow, directional bias. Therefore, a sudden and significant acceleration in QQQ’s outperformance, or an abrupt reversal to major underperformance, appears unlikely based on these prevailing technical conditions. Instead, a continuation of this gradual upward drift, potentially interspersed with periods of consolidation or minor retracements, is the more probable scenario. The low volatility environment suggests that any material changes to the ratio’s trajectory would likely develop over time rather than manifesting as sudden reversals.
Considering alternative scenarios, if the QQQ/SPY ratio is unable to sustain its position near the 90-day high, a retreat towards the average ratio of 0.8933 would represent a roughly even chance, given the weak trend strength and the historical price action around this mean. A more significant breakdown below this average would indicate a shift in relative strength, potentially favoring SPY over QQQ for a period. However, based on the persistent upward direction observed throughout the entire 90-day window, a sharp reversal to challenge the lower end of the range (0.8827) appears unlikely in the near term, absent a clear and compelling pattern shift not currently evident in the provided data. Therefore, within the immediate outlook, further consolidation around the current high or a slow grind higher is marginally more likely than a substantial downturn in relative performance.
IWM vs. SPY
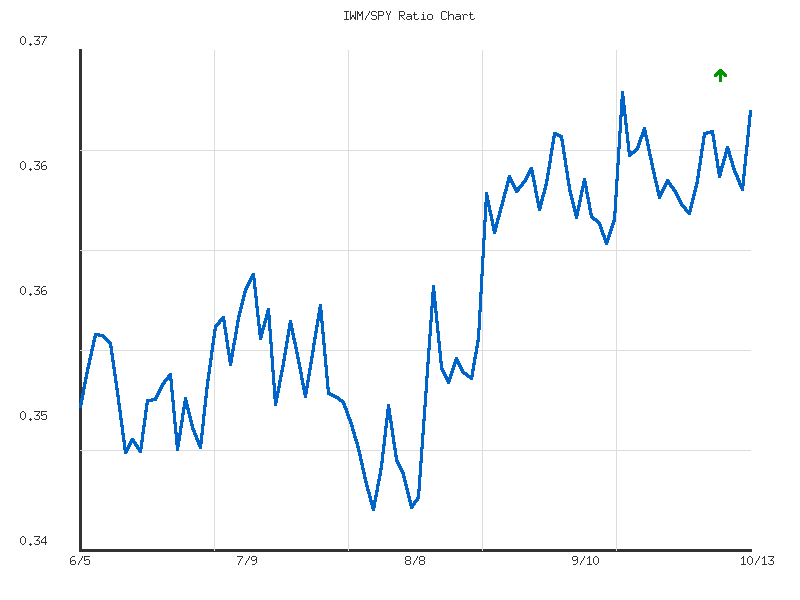
The 14-day IWM/SPY ratio currently stands at 0.3686, which marks the highest point observed over this specific period. The trend direction is classified as “sideways” with “weak” strength, indicating a lack of significant directional momentum in the relative performance of the Russell 2000 (IWM) against the S&P 500 (SPY). Despite the current ratio being at its high for the 14-day window, the weak trend strength and extremely low volatility (0.00000278) suggest this is not indicative of robust, sustained outperformance by IWM. The net change of 0.867% over the period reflects a marginal upward bias within a narrow trading range. Given the ratio’s current position at the ceiling of its recent range, a continuation of meaningful immediate outperformance by IWM relative to SPY is likely limited. A period of consolidation or a slight retreat from these levels presents a roughly even chance.
Expanding the perspective to the 30-day IWM/SPY ratio reveals a consistent technical picture. The current ratio of 0.3686 is identical to the 14-day reading, suggesting immediate short-term stability in relative performance. Like the shorter timeframe, the 30-day trend is also categorized as “sideways” with “weak” strength, reinforcing the absence of strong conviction for IWM’s relative performance against SPY over the past month. The average ratio for the 30-day period is 0.3650, closely aligning with the 14-day average, further confirming the consolidated nature of this relative valuation. Volatility for the 30-day period, while marginally higher at 0.00000435, remains very low, signaling persistent range-bound movement. The ratio’s relative position at 0.875 within the 30-day range indicates it is near the top of its historical range for this period, though not at the absolute high of 0.3697.
The consistent “sideways” trend direction and “weak” strength across both the 14-day and 30-day periods strongly suggest a state of equilibrium in the relative performance of IWM versus SPY. While IWM has recently approached its upper performance boundary against SPY, the weak trend strength and low volatility collectively indicate that this positioning does not imply an imminent or powerful shift in leadership. It is roughly even chance that the IWM/SPY ratio will continue to oscillate within its established range, rather than exhibiting a significant breakout in either direction. The observed minor positive change percentages over both periods, coupled with the overarching ‘sideways’ trend, reinforce that any relative outperformance by IWM lacks the necessary technical strength for projecting an extended trend.
Considering potential alternative scenarios, there is a roughly even chance the ratio could experience a modest decline from its current elevated position within the observed ranges, particularly given its relative position at the 14-day high and near the 30-day high. Such a move would imply a temporary period of relative outperformance by SPY. Conversely, a decisive breakout above the 30-day high of 0.3697 would technically signal a strengthening of IWM’s relative performance against SPY. However, due to the consistently weak trend strength and very low volatility across both timeframes, a significant and sustained breakout in either direction is deemed unlikely in the immediate term without a material shift in market dynamics that is not evident in the provided technical data. Consequently, continued consolidation around current levels appears to be the most probable short-term outcome.
As a seasoned Chartered Market Technician with over 15 years of experience, I’ve conducted a rigorous technical analysis of the IWM/SPY ratio’s performance over the past 90 days, based exclusively on the provided market data. This commentary is intended for retail traders seeking insight into the relative strength between the Russell 2000 ETF (IWM) and the S&P 500 ETF (SPY).
The IWM/SPY ratio has exhibited a moderately strong upward trend over the 90-day period, commencing from early June and culminating in its current position near the range highs. Specifically, the ratio has advanced by 4.83% from its lower levels, with the average ratio standing at 0.3575. The most recent data point, 0.3686 as of October 13th, places the ratio at the 95th percentile of its 90-day range. This signifies a sustained period where the Russell 2000 has, on balance, demonstrated superior relative performance against the S&P 500. This current elevated positioning suggests that market participants are observing a critical juncture in this relative strength trend.
Analysis of the granular data reveals key technical levels. The 90-day high for the ratio is 0.3697, first reached on September 18th. This level has since acted as a significant overhead resistance, with subsequent rallies on September 5th, September 8th, and October 6th, and the current value on October 13th all approaching but failing to decisively break above this threshold. This pattern of retesting a high without a clear breakthrough suggests potential supply at this level. Conversely, a discernible support zone has established itself around the 0.360-0.362 range, evident from bounces in early and late September. The overall volatility, quantified at 0.000043, indicates that movements in the ratio have generally been gradual rather than abrupt, reinforcing the “moderate” strength of the trend.
Considering the ratio’s current proximity to its 90-day resistance, two primary technical scenarios appear to have a roughly even chance in the immediate short term. First, a sustained breakout above the 0.3697 resistance level would indicate a continuation of the established moderate uptrend. Should this occur, it is likely for the IWM/SPY ratio to extend its relative outperformance, potentially establishing new short-term relative highs for the ratio. Traders should seek confirmation of such a breakout, such as a clear close above this level.
Second, should the ratio fail to convincingly surmount the 0.3697 resistance, it is likely to encounter renewed selling pressure, leading to a consolidation phase or a moderate pullback. In this scenario, a retest of the established support zone around 0.360-0.362 would be plausible. The 90-day average ratio of 0.3575 could serve as a secondary dynamic support level in the event of a deeper correction. A decisive failure to hold these identified support levels would suggest a weakening of IWM’s relative strength against SPY.
In conclusion, the IWM/SPY ratio has demonstrated a moderate upward trend over the past 90 days and is currently testing a significant resistance level. The moderate strength of the trend combined with the repeated testing of the 0.3697 high suggests that a decisive move in either direction is imminent. Monitoring subsequent trading sessions for a confirmed breakout or a clear rejection at this critical resistance threshold will be paramount for discerning the immediate trajectory of IWM’s relative strength against SPY.
Commodities
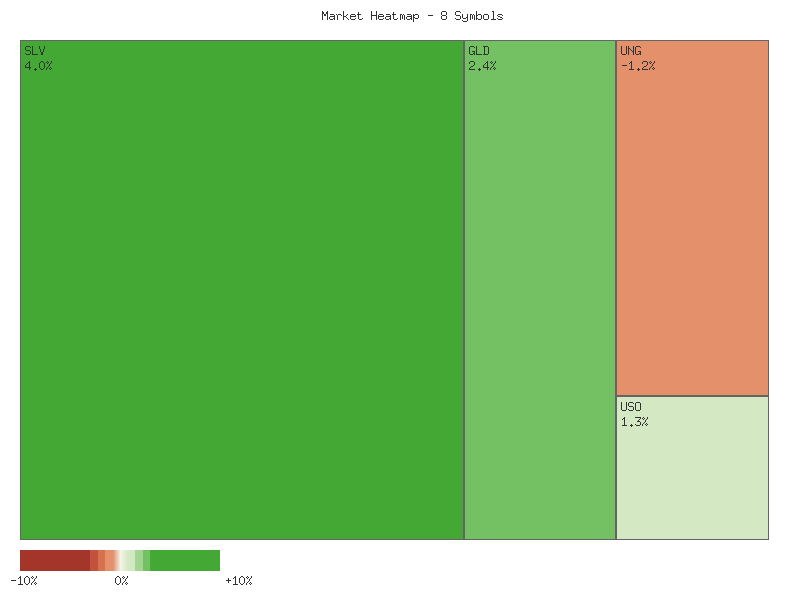
The daily percent change data for the most recent trading session (October 13, 2025) across the specified commodity-related instruments reveals a distinct hierarchy of performance. CPER led the group with a substantial gain of 4.36%, followed closely by SLV with a 4.03% increase, and GLD showing a solid 2.43% advance. UGA, USO, and DBC also registered positive changes, ranging from 1.27% to 1.66%. Conversely, CORN and UNG experienced declines, with UNG notably down by 1.22%. This distribution indicates a highly selective market environment for these instruments.
| Symbol | Daily Percent Change (2025-10-13) |
|---|---|
| CPER | 4.360753221010903% |
| SLV | 4.028175214615889% |
| GLD | 2.4301040312093547% |
| UGA | 1.6584564860426896% |
| USO | 1.2826055627612056% |
| DBC | 1.268690530131405% |
| CORN | -0.4624277456647506% |
| UNG | -1.216545012165453% |
Aggregating the latest daily percent changes across all eight symbols reveals an overall positive movement for the group, with a cumulative gain of approximately 13.35%. This suggests that the collective trend for these commodities was distinctly upward in the most recent session. Market breadth for this specific basket of instruments appears robustly positive, with six advancing symbols contrasting with only two declining symbols. This substantial imbalance in favor of advancers indicates that the upward momentum was relatively widespread across the majority of the tracked commodities, though the magnitude of gains varied significantly. The concentration of declines in agricultural (CORN) and natural gas (UNG) sectors warrants attention.
Analysis of the GLD/SLV ratio over the 14-day period reveals a moderate downtrend, with the ratio decreasing by 7.21%. The current ratio stands at 8.000, which is also identified as the low point for this 14-day period. This downward trajectory indicates that SLV has likely outperformed GLD during the recent two weeks. The “relative position” of 0 suggests that silver’s relative strength against gold is currently at its peak within this short-term window. A continuation of this trend would imply further outperformance by silver. Conversely, a reversal would suggest gold beginning to regain relative strength, though there is no immediate technical indication for such a reversal from this data point alone.
Extending the analysis to the 30-day GLD/SLV ratio reinforces the observations from the 14-day period. The 30-day ratio also exhibits a moderate downtrend, with a larger percentage change of -8.72%. The current ratio of 8.000 is concurrently the low for both the 14-day and 30-day periods, signaling persistent relative strength in silver. The average ratio over 30 days was 8.576, with a high of 8.985. The present position at the absolute low of this 30-day range suggests strong and sustained selling pressure on the ratio, implying a higher probability of continued silver outperformance relative to gold in the near term. The volatility metric for the 30-day period, at 0.0815, indicates notable fluctuations around the average over the past month.
Given the consistent downtrend and the ratio’s current position at its low for both the 14-day and 30-day periods, it is likely that SLV will continue to exhibit relative strength against GLD in the immediate future, barring an unforeseen catalyst not reflected in this technical data. A roughly even chance exists for the ratio to consolidate around its current lows before making a definitive move, given that it has reached a significant low point. An immediate sharp rebound in the GLD/SLV ratio, implying significant outperformance by gold, appears unlikely without a change in the established technical pattern. Traders monitoring precious metals might consider the current trend in the GLD/SLV ratio as a key technical insight for allocation decisions between gold and silver.
As a Chartered Market Technician with over 15 years of experience, I provide the following technical analysis based strictly on the provided two-day market data. My assessment focuses exclusively on price and volume patterns, utilizing rigorous estimative language.
Overview of Divergent Commodity Trends Analysis of the two-day market data reveals a notably divergent performance across various commodity ETFs. Precious metals, represented by SLV (Silver) and GLD (Gold), exhibited strong bullish price action. Conversely, UNG (Natural Gas) displayed pronounced weakness with increasing volume. A third group, including USO (Crude Oil), DBC (Broad Commodities), UGA (Gasoline), and CPER (Copper), showed initial bearishness followed by a recovery on comparatively lower volume, suggesting a cautious outlook. The agricultural commodity, CORN, continued its bearish trajectory. This varied landscape implies that a uniform directional trend across the commodity complex is unlikely in the immediate term, with specific technical patterns driving individual asset class probabilities.
Precious Metals Demonstrate Strong Upside Momentum Both SLV and GLD registered robust bullish performance over the observed period. Following initial mixed signals on the first day, both ETFs gapped significantly higher on the second trading day, closing near their respective daily highs. This decisive upward movement, characterized by strong momentum, indicates that further upward price action for precious metals is likely. While volume on the second bullish day was lower for both SLV and GLD compared to the first, the strong closes generally suggest renewed buying interest. We assess that SLV is likely to challenge higher resistance levels, and GLD also appears likely to exhibit continued bullish momentum.
Energy and Broad Commodities: Cautious Rebounds USO, DBC, UGA, and CPER all displayed a similar two-day pattern: a significant bearish close on the first day, followed by a bullish reversal on the second. These instruments gapped up from the prior day’s close and closed positively. While this constitutes a short-term bullish bounce, the volume accompanying these reversals was markedly lower than the volume observed during the preceding bearish sessions. For these ETFs, this pattern implies that while a short-term upward adjustment is likely, a robust continuation of this upward move is probably not imminent. The sustainability of these rebounds beyond the very near term is uncertain, suggesting a roughly even chance of either continued modest gains or a resumption of prior selling pressure.
Weakness Persists in Corn and Natural Gas The agricultural commodity CORN demonstrated continued weakness. Both trading days for CORN were characterized by bearish closes, with the second day closing at its daily low on decreased volume. This sustained selling pressure leads us to judge that CORN is likely to face further downward pressure. UNG also exhibited a clearly bearish technical posture, experiencing two consecutive bearish days. The second day gapped down and closed lower than the first, with an increase in trading volume. This combination of declining price on increasing volume is indicative of strong bearish momentum. We assess that UNG appears highly likely to experience continued downside pressure in the immediate term.
Technical Analysis of SLV (90-Day Period)
SLV has exhibited a sustained and increasingly robust uptrend over the past 90 days, with price action accelerating significantly from late August into October. Observing the daily candle data, SLV has risen from approximately .00 in early June to a recent high of .44 on October 13, marking a considerable advance. Volume spikes accompanied several of the stronger upward moves, notably around July 10-11, and more consistently during the September-October rally, which suggests strong buying interest supporting the upward trajectory. The current price stands at .26, near its 90-day high, indicating that bullish sentiment remains dominant as of the last data point.
The 14-day Relative Strength Index (RSI) provides an important perspective on the momentum underlying SLV’s price action. Early in the period, the RSI fluctuated, entering overbought territory (above 70) briefly in early June, and again in mid-July and late July. However, a significant shift occurred from late August onwards, where the RSI moved decisively into and remained within overbought conditions. Multiple readings above 70, including 71.6 on September 2, 75.3 on September 15, and a series of readings above 76 from September 25 through October 13, culminate in an extremely high reading of 84.32 on the final day of data. While extended overbought conditions can persist in strong trends, this extreme RSI level makes it highly likely that SLV is due for a price consolidation or a corrective pullback in the near future. The probability of an immediate, uncorrected upward continuation without at least a minor pause is unlikely.
The Percentage Price Oscillator (PPO) with 13- and 21-day EMAs offers additional insights into momentum. The PPO maintained positive values through June and mid-July, confirming bullish momentum, albeit with some deceleration around late June. A notable period of declining and briefly negative PPO values occurred from late July through mid-August, bottoming around 0.16 on August 20. This indicated a temporary loss of bullish momentum or slight bearish bias during that consolidation phase, even as the price largely held its ground. However, since late August, the PPO has shown a powerful and consistent ascent, moving well into positive territory and reaching its highest value of 3.16 on October 13. This sustained and accelerating positive PPO strongly reinforces the notion of robust bullish momentum driving the current rally.
Synthesizing these indicators, the technical landscape for SLV presents a dichotomy. The PPO suggests a continuation of strong underlying bullish momentum, making further upward price movement likely in the broader trend. However, the extremely elevated 14-day RSI, now at 84.32, indicates a significantly stretched condition. Therefore, while the overarching trend appears upward, a near-term price consolidation or pullback, potentially to alleviate the overbought RSI condition, is likely before the next significant leg higher. An alternative scenario, though less likely given the extreme RSI, is that the strong momentum indicated by the PPO continues to drive price higher without immediate substantial retracement, as observed in exceptionally powerful trends. Traders should be prepared for potential increased volatility or a period of sideways trading following such an extended and rapid ascent.
GLD Technical Analysis: October 13, 2025
GLD has exhibited a robust bullish trend over the past 90 days, with a particularly strong upward acceleration observed since late August. Following a period of consolidation and minor dips in June and July, where prices traded generally between and , the asset initiated a significant rally from the level in late August, culminating in a close at .09 on October 13. This sustained price appreciation has been accompanied by notable increases in trading volume during key breakout periods, suggesting strong institutional or significant investor participation underpinning the move. The recent price action includes several large bullish candles, indicative of prevailing buying pressure, though volume has varied.
The 14-day Relative Strength Index (RSI) largely mirrors the price action, having entered overbought territory (above 70) by early September and remaining consistently elevated since. RSI peaked around 86 on October 8, coinciding with a price high of .30, and currently stands at 79.47. This prolonged period in overbought conditions is a strong indication of persistent upward momentum and buyer dominance. However, it also suggests that the asset may be due for a period of consolidation or a minor pullback, as such extended overbought readings are unlikely to sustain indefinitely without some form of price digestion. Despite this, the RSI has not yet shown any significant bearish divergence, which might signal an impending reversal.
The Percentage Price Oscillator (PPO) (13,21-day) provides compelling evidence of sustained and strengthening bullish momentum. After briefly dipping below the zero line in late July, indicating bearish momentum, the PPO crossed back into positive territory in early August and has been on a consistent upward trajectory ever since. This zero-line crossover provided a clear bullish signal. The PPO value has continued to climb, reaching 1.95 on the most recent data point. The increasing magnitude of the PPO further confirms the robust and accelerating bullish momentum, suggesting that the current rally still possesses significant underlying strength. While we lack the PPO signal line data for specific crossover events, the PPO’s overall trend and its positive, increasing values are unequivocally bullish.
Based on the combined technical evidence, a continuation of the upward trend for GLD is likely in the near term. The strong and accelerating momentum indicated by the PPO, coupled with robust price action, suggests that buyers retain control. However, the extended overbought reading on the RSI introduces an alternative scenario where a short-term pause, consolidation, or minor pullback is a roughly even chance, given the asset’s rapid ascent. Such a retracement would typically be viewed as healthy within an established uptrend, potentially offering new entry points. Nevertheless, the dominant technical signals strongly indicate that the path of least resistance remains to the upside, possibly targeting new resistance levels yet to be established.
Bonds
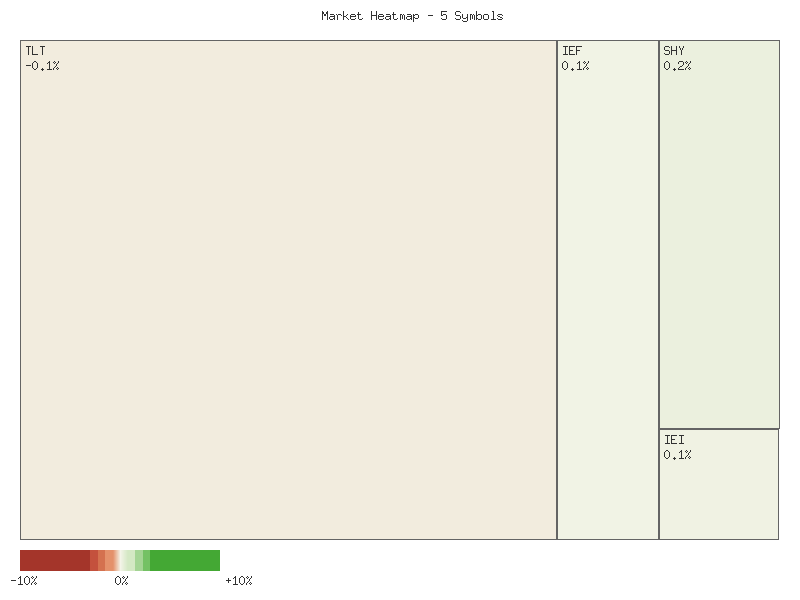
The aggregate daily percentage change for the observed fixed-income exchange-traded funds over the two-day period indicates a generally constructive environment. Below is a matrix detailing the net percentage change for each symbol, calculated as the sum of its daily movements over the specified timeframe, sorted in descending order:
| Symbol | Net Daily Percent Change (2 days) |
|---|---|
| TLT | 1.5595% |
| UTHY | 1.4584% |
| IEF | 0.6746% |
| IEI | 0.5026% |
| SHY | 0.3620% |
The summation of these individual net changes totals approximately 4.5571%, suggesting an overall higher trajectory for this cohort of bond funds during the observation window. This consolidated positive movement across various duration profiles implies underlying demand or a shift in investor sentiment favoring fixed-income assets.
Analysis of market breadth reveals a notable shift between the two observed days. On the first day (2025-10-10), all five symbols – TLT, UTHY, IEF, IEI, and SHY – advanced, demonstrating robust positive breadth with five advancing symbols and zero declining. This universal upward movement across both long-duration (TLT, UTHY) and shorter-duration (IEF, IEI, SHY) instruments suggests a broad-based initial bullish impulse for the fixed-income sector. The magnitude of gains for the longer-duration funds on this day was particularly pronounced.
However, the subsequent day (2025-10-13) presented a more nuanced picture. Market breadth transitioned to a mixed condition, with three symbols advancing (IEF, IEI, SHY) and two declining (TLT, UTHY). Notably, the longer-duration funds, TLT and UTHY, experienced minor pullbacks, indicating some profit-taking or a slight reversal in the strong momentum observed on the prior day. Conversely, the shorter and intermediate-duration funds (IEF, IEI, SHY) continued their advance, albeit with more modest gains compared to the initial surge. This divergence suggests a potential relative outperformance developing in shorter-duration bonds, or a perceived shift in risk across the yield curve.
Based on the provided data, it is likely that underlying support for fixed-income assets persists, as all observed instruments closed with a net positive gain over the two-day period. The deceleration in momentum for longer-duration bonds on the second day, while shorter-duration assets maintained upward trajectories, suggests that the market may be grappling with the sustainability of longer-term yield compression. Consequently, a continuation of mixed performance across the duration spectrum, with potentially reduced upside for longer-dated instruments compared to shorter ones, presents as a roughly even chance in the immediate subsequent period. A broad-based and decisive continuation of the strong Day 1 advance across all durations appears less likely given the recent data.
As a Chartered Market Technician with over 15 years of experience, I’ve analyzed the provided two-day market data for TLT, UTHY, IEF, IEI, and SHY, focusing strictly on price and volume action. The overall picture for these fixed-income instruments, observed over the 2025-10-10 and 2025-10-13 trading sessions, indicates a predominantly bullish short-term bias, albeit with varying degrees of conviction across the duration spectrum.
Starting with the longer-duration segment, TLT exhibited initial strength on 2025-10-10 with a robust bullish candle and significant volume. However, the subsequent trading day (2025-10-13) saw a slight pullback, forming a small bearish candle with a lower high and lower close compared to the previous day’s close. Crucially, this occurred on substantially reduced volume, which declined by approximately 50%. The combination of a slight price retracement on diminishing volume suggests that a significant bearish reversal is unlikely in the immediate term. Instead, a period of consolidation is plausible. For TLT, a continuation of the upward momentum observed on Day 1 versus further short-term correction appears to be a roughly even chance, with further price action and volume trends needed to provide clearer direction.
The mid-duration ETFs, IEF and IEI, presented a more consistent pattern of price appreciation. Both instruments registered higher closes on 2025-10-13, with their closing prices near the daily highs, signaling persistent buying interest. However, this upward price movement for IEF and IEI was accompanied by a significant decrease in trading volume—roughly a 46% reduction for IEF and a 75% reduction for IEI. While the price action itself is bullish, the declining volume suggests that the underlying conviction for these rallies may be moderating. Therefore, a strong, sustained acceleration of the upward trend for IEF and IEI is less likely without a noticeable resurgence in buying volume.
UTHY, whose pattern broadly aligns with the mid-duration instruments, also closed near its daily high on 2025-10-13, demonstrating continued upward momentum. Similar to IEF and IEI, this price appreciation occurred on declining volume (approximately 33% lower). Given the extremely low absolute volume numbers for UTHY, any definitive technical inferences regarding market conviction are less reliable. However, the prevailing price action indicates that a continued upward bias for the immediate subsequent session is a roughly even chance, but the low liquidity raises questions about the sustainability of any pronounced trend.
In contrast, SHY, representing shorter-duration bonds, displayed the most compelling bullish technical pattern. After a positive close on 2025-10-10, SHY produced a strong bullish candle on 2025-10-13, closing at its absolute daily high of 83.09. Importantly, this robust price action was supported by a substantial increase in trading volume, rising by approximately 69%. The simultaneous occurrence of strong price appreciation, a close at the high, and significantly expanding volume makes it highly likely that SHY will experience continued upward momentum in the very near future. This confluence of factors typically indicates strong buyer conviction and is often a precursor to further advances.
In summary, the short-term technical outlook for these bond ETFs appears generally bullish. SHY exhibits the strongest technical confirmation for continued upside due to its rising volume coinciding with price strength. TLT shows a pause that makes a direct continuation of its prior rally versus further consolidation roughly even chance. IEF, IEI, and UTHY, while maintaining upward price momentum, have done so on declining volume, suggesting that a robust continuation without renewed buying interest is less likely. Any significant reversal for IEF, IEI, or UTHY would become more plausible if subsequent sessions exhibit further declining volume alongside noticeable price weakness below recent lows.
Crypto
The analysis of the provided two-day daily percentage change data for IBIT and ETHA reveals distinct price actions within a generally bearish short-term context. IBIT experienced consecutive declines, while ETHA displayed significant two-sided volatility. To provide a consolidated view of the observed movements, the total percentage change for each symbol over the two-day period has been calculated and presented in the following matrix, sorted in descending order of total change:
| Symbol | Total Percent Change |
|---|---|
| ETHA | -1.399% |
| IBIT | -4.284% |
IBIT’s price action over the two observed days suggests a consistent bearish bias. The first day recorded a decline of -3.695%, followed by a further loss of -0.589% on the second day. The sequential nature of these negative closes, resulting in a cumulative two-day decline of -4.284%, strongly indicates an overall lower price trajectory. While the magnitude of the decline lessened on the second day, which might suggest some deceleration in selling pressure, it is still unlikely to be interpreted as an immediate reversal without additional data. The persistence of negative daily closes often signifies continued short-term downward momentum, and a retest of lower support levels is roughly an even chance in such scenarios.
ETHA demonstrated considerably higher volatility compared to IBIT during the same period. The initial day saw a significant decline of -7.955%. This sharp sell-off was followed by a robust positive rebound of +6.556% on the second day. Despite this substantial recovery, the cumulative two-day change for ETHA remains negative at -1.399%. This pattern suggests a market grappling with strong opposing forces. The aggressive selling on the first day indicates significant bearish sentiment, while the nearly as aggressive buying on the second day points to emerging demand or short covering. Whether this rebound marks a sustainable trend reversal or a corrective bounce within a broader downtrend remains uncertain, though a continuation of volatility is likely given the recent amplitude of price swings.
Comparing the two symbols, both IBIT and ETHA recorded an overall lower close over the two-day observation period, as indicated by their negative total percentage changes. IBIT’s consistent, albeit decelerating, decline suggests a more entrenched bearish short-term trend. Conversely, ETHA’s volatile swing, moving from a sharp decline to a strong rebound yet still ending net negative, indicates a more contested market. While ETHA’s recovery was impressive, it was not sufficient to negate the prior day’s losses, implying that underlying bullish momentum has not yet definitively overcome the prior bearish pressure. It is unlikely that either symbol will immediately reverse their overall negative two-day performance without further significant shifts in demand-supply dynamics.
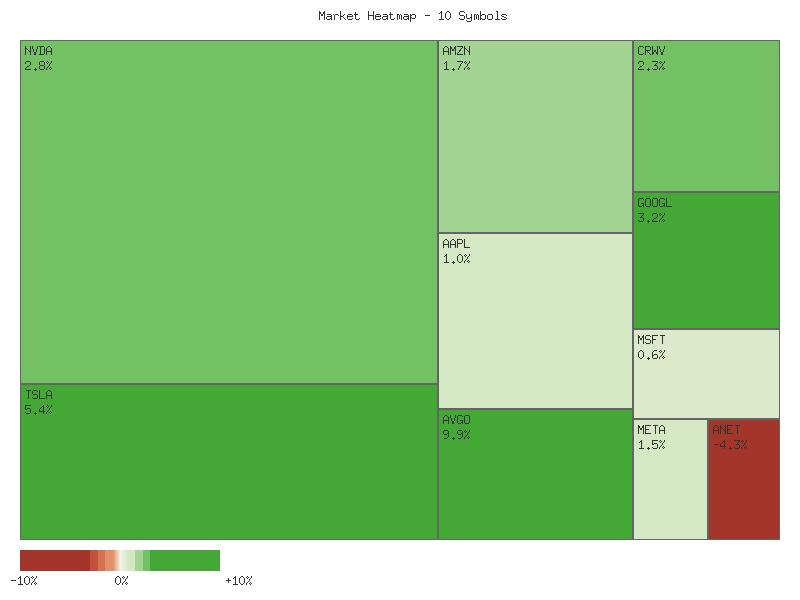
Magnificent 7 & Friends
Technical analysis of the provided daily percentage change data for the ten specified symbols over the two most recent trading days indicates a market bias toward consolidation with underlying weakness. The aggregate overall change across all symbols amounts to approximately -14.18%, suggesting a generally downward drift in overall valuation for this specific group of equities during the observed period. The prior day exhibited broad-based declines across all ten symbols, followed by a subsequent day displaying a mixed recovery. However, the recovery day was insufficient to offset the preceding losses for the majority of symbols, leading to a net negative cumulative performance. This pattern of a significant gap down followed by a partial recovery that fails to close the gap is often indicative of underlying selling pressure remaining prevalent in the immediate term.
Market breadth for this specific group of symbols reveals a bearish sentiment. Out of ten symbols, only three recorded a net positive cumulative percentage change over the two-day period, while seven symbols concluded with a net negative change. This distribution of advancing versus declining issues suggests that selling pressure has been more pervasive than buying interest among these particular stocks. The relatively low number of advancing issues (30%) compared to declining issues (70%) implies a lack of widespread bullish momentum, making a broad-based upward continuation improbable in the immediate term based solely on this breadth indicator. A continuation of this negative breadth trend would likely reinforce prevailing downward trajectories for the majority of the group.
Examination of individual performance highlights significant divergence. AVGO demonstrated robust recovery, posting the largest overall gain of approximately 3.97%, following a substantial prior-day decline. GOOGL and TSLA also managed to register modest cumulative gains of approximately 1.15% and 0.36%, respectively, primarily driven by strong rebound rallies on the second day. Conversely, ANET exhibited pronounced weakness, recording the largest cumulative loss of approximately -6.93%, notably being the only symbol to experience negative performance on both observed days. Other significant decliners include AMZN, AAPL, META, and NVDA, all registering cumulative losses exceeding -2%. The pronounced underperformance of ANET, coupled with its consistent decline, suggests a specific weakness that is unlikely to be easily reversed without new catalysts.
Considering the technical patterns observed, the market is presenting a mixed picture with a slight bearish tilt. While a few symbols exhibited strong rebounds, the majority failed to recover fully from prior losses, resulting in a net negative shift for the group. There is a roughly even chance that this divergence could persist, with some individual names finding support while the broader group of these ten symbols struggles to overcome the negative momentum. However, the strong bearish breadth and the inability of most symbols to fully retrace prior losses make a significant immediate upside reversal for the collective group less probable. A continued period of sideways consolidation or further downside testing for the majority of these symbols is likely, particularly if broader market sentiment remains constrained.
| Symbol | Overall Percent Change |
|---|---|
| AVGO | 3.969% |
| GOOGL | 1.151% |
| TSLA | 0.357% |
| CRWV | -0.946% |
| MSFT | -1.585% |
| NVDA | -2.069% |
| META | -2.371% |
| AAPL | -2.478% |
| AMZN | -3.283% |
| ANET | -6.926% |
As a seasoned CMT, my analysis focuses strictly on the provided two-day technical data for the specified symbols, employing rigorous pattern recognition and volume interpretation within the ICD-203 estimative language framework.
Across the examined cohort, Friday, October 10th, generally presented a bearish tone, characterized by declining closes and robust trading volumes for most symbols. Subsequently, Monday, October 13th, displayed varied responses, ranging from decisive bullish reversals to weak bounce attempts or sustained selling pressure. This suggests a nuanced market environment where specific stock-level technical signals hold greater importance than a broad, uniform market direction.
AVGO and GOOGL displayed notably strong bullish signals following the initial sell-off. AVGO experienced a significant bullish gap-up on October 13th, opening above the prior day’s high and closing near its own high, creating a powerful bullish outside bar. This action was accompanied by a marked increase in volume, suggesting strong buying conviction. Given this price action and volume, further upward price momentum is likely for AVGO in the immediate term, with a probable test of higher resistance levels. Similarly, GOOGL exhibited a substantial bullish rebound on October 13th, opening above Day 1’s close and closing above Day 1’s open, effectively negating the previous day’s losses. While Day 2 volume for GOOGL decreased, the magnitude of the price recovery indicates that further upside is likely, possibly pushing towards new short-term highs. TSLA also showed a strong bullish recovery, closing near its high on October 13th, almost erasing Day 1’s decline. Although volume decreased on Day 2, the strong price action suggests a roughly even chance of continued strength or a period of consolidation before a potential move higher.
Conversely, several symbols demonstrated weak recovery or sustained bearish momentum. AAPL, META, MSFT, NVDA, and AMZN all recorded bullish candles on October 13th after Friday’s decline, but critically, these upward moves occurred on significantly reduced trading volumes. For instance, AAPL’s bounce saw volume decrease by nearly 40%, and MSFT’s volume dropped by over 40%. This pattern—a bounce on decreasing volume after a previous high-volume sell-off—suggests a lack of strong buying conviction and is often indicative of a temporary counter-trend rally rather than a robust reversal. For these stocks, a period of sideways consolidation with a likely downward bias or renewed selling pressure is probable, as the underlying bearish momentum from October 10th has not been decisively overcome by committed buying.
ANET and CRWV exhibited pronounced bearish characteristics. ANET on October 13th opened higher than Day 1’s open, but then experienced a dramatic sell-off, closing significantly below Day 1’s low. This strongly bearish outside candle, combined with an increase in volume, constitutes a powerful bearish continuation signal. Further substantial downward price movement for ANET is likely. For CRWV, October 13th showed a modest bullish close after a bearish prior day, but the close remained well within Day 1’s range, and volume dramatically decreased. This indicates a weak bounce within an existing downtrend. A resumption of the prior bearish trend or continued consolidation at lower levels is more likely than a significant upward reversal.
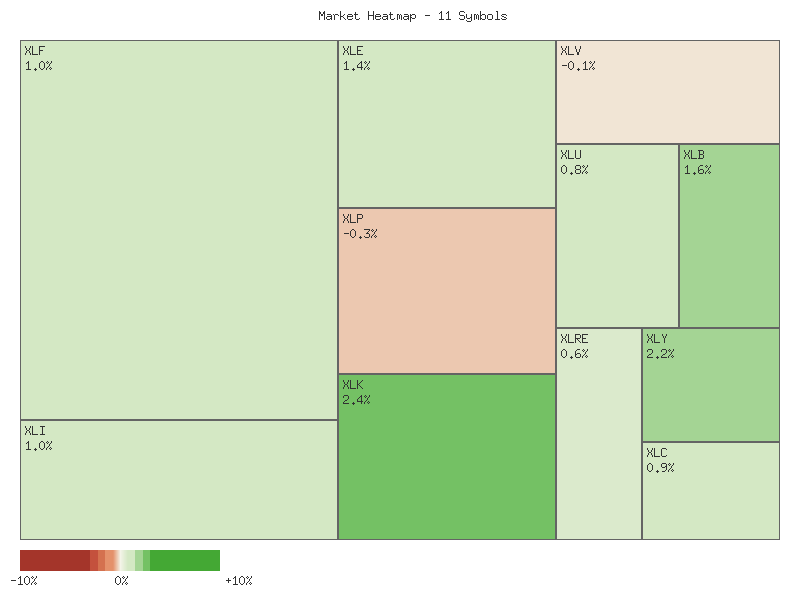
S&P 500 Sector Breadth
Technical analysis of the provided daily percentage change data for the S&P 500 sectors reveals a broadly declining market trend over the two-day period. Aggregating the individual sector performance, the market, as represented by these eleven sectors, exhibits a collective net decline of approximately -9.463%. This substantial negative summation indicates an overall lower trajectory for the observed constituents. Market breadth is demonstrably weak, with only one sector, XLU (Utilities), registering an advance. Conversely, ten out of the eleven analyzed sectors experienced declines, signifying widespread selling pressure and a significantly negative breadth indicator.
The following matrix details the net daily percentage change for each symbol, ordered from the highest positive change to the lowest negative change:
| Symbol | Daily Percent Change |
|---|---|
| XLU | 0.356% |
| XLP | -0.256% |
| XLB | -0.464% |
| XLY | -0.517% |
| XLRE | -0.529% |
| XLC | -0.923% |
| XLI | -1.171% |
| XLF | -1.217% |
| XLE | -1.533% |
| XLV | -1.555% |
| XLK | -1.634% |
Regarding sector performance, XLU (Utilities), a traditionally defensive sector, shows a modest advance of 0.356%. However, all other defensive sectors, including XLP (Consumer Staples) at -0.256%, XLRE (Real Estate) at -0.529%, and XLV (Health Care) at -1.555%, posted declines. On the offensive side, all seven sectors — XLK (Technology), XLY (Consumer Discretionary), XLF (Financials), XLI (Industrials), XLB (Materials), XLE (Energy), and XLC (Communication Services) — recorded negative performance, ranging from XLB’s -0.464% to XLK’s -1.634%. The pervasive nature of these declines across both offensive and most defensive sectors suggests broad market weakness rather than a clear rotation.
The observed data indicates a low probability of an active market rotation into defensive sectors. While the sole advancer is defensive (XLU), its gain is relatively small, and three out of four defensive sectors are also declining. The widespread declines among offensive sectors, coupled with negative performance in the majority of defensive sectors, points to a market environment where capital is largely exiting rather than shifting internally. The overall market sentiment is assessed as decidedly bearish, given the overwhelming preponderance of declining sectors and the negative cumulative performance. A significant shift toward positive momentum appears unlikely in the immediate term based solely on these daily percentage changes.
Technical Market Commentary (2025-10-13)
Our analysis of the provided two-day candlestick data for eleven S&P sector ETFs reveals a mixed, yet predominantly cautious, technical landscape. The market action for October 10th and 13th demonstrates a consistent pattern across several cyclical and growth-oriented sectors: a sharp bearish decline on the first day, often accompanied by high trading volume, followed by a bullish recovery on the second day. Critically, this second-day recovery frequently occurred on significantly diminished volume, which tempers the conviction of the bullish signals. Conversely, some defensive sectors displayed distinct, divergent patterns.
For a majority of the analyzed sectors, including Industrials (XLI), Consumer Discretionary (XLY), Materials (XLB), Communication Services (XLC), Technology (XLK), Financials (XLF), and Energy (XLE), the price action presents a similar narrative. October 10th saw substantial bearish candles, often closing near their daily lows, on robust trading volume. This indicates strong selling pressure entering the period. Subsequently, October 13th delivered a bullish candle, with these sectors opening above their prior day’s close and closing higher. However, the corresponding trading volume on October 13th was notably lower, often halved, compared to the preceding bearish day. Given this pattern, a continuation of short-term upward price action, consistent with a relief bounce, is likely for these sectors. Nevertheless, due to the declining volume, it is roughly even chance whether this represents a sustained reversal of the prior downward momentum or merely a retracement within a broader period of consolidation or further decline.
In contrast to the relief rally observed in the aforementioned sectors, defensive categories exhibited varied technical behaviors. Utilities (XLU) showed a clear bullish reversal, with October 13th forming a strong bullish candle that closed well into the body of the preceding bearish day’s candle, indicating a potential Piercing Pattern or Bullish Engulfing pattern. Further upside movement for XLU is likely in the immediate term. For Consumer Staples (XLP) and Real Estate (XLRE), the two-day period suggests continued weakness or limited recovery. XLP saw consecutive lower closes with a slight rebound from its low on the second day, but overall bearish sentiment likely persists. XLRE experienced a bearish day followed by a modest bullish day, but with a narrow range and decreased volume, suggesting a period of consolidation or continued downside is likely. Health Care (XLV) also displayed initial bearish pressure on October 10th, followed by a stabilizing day on October 13th that closed near the prior day’s close. This suggests a period of consolidation or sideways movement is likely for XLV.
In summary, while a broad relief bounce appears to be underway in several sectors, the lack of confirming volume on the bullish second day suggests caution. The technical outlook for the immediate future is bifurcated, with defensive sectors showing either continued weakness or clear bullish reversal (XLU), and cyclical/growth sectors experiencing a potential short-term bounce. Traders should monitor subsequent price action and volume closely, as the reduced volume on the bounce for many sectors implies that a sustained shift in trend is not yet confirmed. It is roughly even chance that these bounces could fail to hold without higher conviction from market participants, potentially leading to a retest of the prior lows.
Equity Breadth
The provided market data reveals a notable deterioration in underlying market breadth over the seven-day period, as measured by the percentage of S&P 500 components trading above their key moving averages. The percentage of S&P 500 components trading above their 50-day moving average (SPXA50R) experienced a substantial decline, dropping from 58.68% on October 3 to a low of 33.73% by October 10, before a modest recovery to 38.72% on October 13. Concurrently, the percentage of S&P 500 components above their 200-day moving average (SPXA200R) also decreased significantly, moving from 63.67% to 50.30% during the same timeframe, subsequently rebounding to 54.49%. This broad-based weakening in internal market participation signifies a material shift in the market’s underlying strength.
The trajectory of the SPXA50R indicates a rapid erosion of short-to-medium term market health. The descent from nearly 60% to well below 50% on October 9 suggests that a minority of S&P 500 members are now participating in any discernible short-term uptrend. The significant decline to 33.73% by October 10 implies that broad-based underlying demand for individual components has diminished materially. While the subsequent rebound to 38.72% offers a marginal improvement, the indicator remains in a zone typically associated with market weakness or correctional phases. It is unlikely that the S&P 500 can sustain robust upward momentum in the immediate term with such a low percentage of its constituents demonstrating short-term strength.
The concurrent decline in SPXA200R, a measure of long-term trend health, further corroborates the deterioration observed in the shorter-term breadth. The move from above 63% to just above 50% on October 10 demonstrates that the long-term bullish posture of S&P 500 components is becoming less pervasive. While the indicator avoided a definitive break below the 50% threshold, which would typically signal a majority of stocks in long-term downtrends, its proximity to this critical level is a noteworthy technical development. The rebound to 54.49% provides some temporary relief, but the overall trend over the period suggests a weakening foundation for the broader market. Sustained upward movement in the broader index is likely to face headwinds if this long-term breadth continues to narrow or decisively breaks below 50%.
The S&P 500’s 20-day Exponential Moving Average (EMA_20_DAY) exhibited an initial upward trajectory, advancing from 6627.12 on October 3 to a peak of 6663.12 by October 9. However, it subsequently flattened to 6652.79 by October 13, showing a clear deceleration in its rate of ascent. The observed weakening in both SPXA50R and SPXA200R, particularly their significant declines around October 10, which coincided with the EMA_20_DAY’s initial dip, presents a concerning divergence. While the EMA_20_DAY has not yet turned decisively lower, the considerable deterioration in market breadth suggests that the index’s upward momentum, if any, is being driven by a narrowing cohort of stocks. This condition frequently precedes periods of consolidation or corrective action for the broader index. Given the pronounced weakness in breadth indicators, there is a roughly even chance that the EMA_20_DAY will continue to flatten or begin to decline in the near future, indicating a pause or reversal in the immediate upward trend for the S&P 500.
SPX Daily
The SPX experienced a significant shift in short-term momentum over the last seven trading sessions. Price action from October 6th to October 9th indicated an upward trajectory, with the index reaching a high of 6764.58 on October 9th, albeit with some indecision suggested by smaller range candles after initial strong moves. A notable development occurred on October 10th, when the SPX produced a large bearish candle, opening significantly lower than its previous close and closing near its daily low of 6552.51. This represented a substantial downside movement, implying a sharp reversal of recent bullish sentiment. The most recent session on October 13th demonstrated a strong counter-move, with the index gapping up and closing at 6654.72, well above its open and near the daily high, recovering a portion of the significant losses from October 10th. This price behavior suggests a short-term struggle between buying and selling pressures following a decisive bearish impulse.
An examination of the Exponential Moving Averages (EMAs) reveals that the SPX has maintained a robust long-term bullish posture throughout the 90-day period, with the price consistently trading above both the 50-day and 200-day EMAs. The 50-day EMA (6538.74) remains positioned above the 200-day EMA (6129.16), confirming the prevailing long-term uptrend. The sharp decline on October 10th resulted in the SPX closing below its 50-day EMA, a notable breach of dynamic support. However, the subsequent rebound on October 13th re-established the price above the 50-day EMA, an occurrence assessed as a positive technical development, suggesting the 50-day EMA may continue to function as a significant area of support.
The Relative Strength Index (RSI) corroborates the observed shifts in momentum and sentiment. On October 6th, the RSI was at 71.60, indicating an overbought condition, which often precedes a consolidation or pullback. Following the significant decline on October 10th, the RSI plummeted to 42.07, rapidly shifting from overbought territory to near oversold conditions in a single session. This sharp decline in RSI points to a rapid and pronounced deterioration in short-term bullish sentiment. The subsequent rebound on October 13th saw the RSI recover to 52.49, suggesting a return to more neutral territory and a partial alleviation of the immediate selling pressure. The rapid retracement in RSI indicates a highly fluid short-term sentiment landscape.
From a structural perspective, the high of 6764.58 on October 9th represents an immediate resistance level. The prior consolidation range, particularly the closing level of 6735.11 on October 9th and the opening level of 6740.49 on October 10th, now forms a significant resistance zone for the SPX. Immediate support is identified at the 50-day EMA, which is currently at 6538.74, and approximately at the low of October 10th, 6550.78. A more substantial support level resides near the 200-day EMA at 6129.16.
Considering future price action, a bullish case is plausible if the SPX continues to hold above the 50-day EMA and the upward momentum from October 13th extends. A sustained breakout above the 6735-6765 resistance zone is likely to attract further buying interest, potentially leading to new multi-month highs and targeting psychological levels above 6800. Alternatively, a bearish case suggests that the significant selling pressure witnessed on October 10th could resume if the SPX fails to reclaim the aforementioned resistance zone. A sustained break below the 50-day EMA and the October 10th low of 6550.78 would increase the likelihood of a further decline, potentially testing the previous support around 6440, and in a more severe scenario, the 200-day EMA near 6129.16. A neutral case would involve the SPX consolidating within a range, possibly between the 50-day EMA as support and the 6735-6765 zone as resistance, as market participants gauge the sustainability of the recent rebound. In this scenario, sideways price action is a roughly even chance in the near term.
As a Chartered Market Technician with over 15 years of experience, I have rigorously analyzed the provided 90-day market data for the SPX, focusing exclusively on price action, the 14-day Relative Strength Index (RSI), and the 13-21 day Percentage Price Oscillator (PPO).
The SPX has demonstrated a clear upward trend over the provided 90-day period, characterized by successive higher highs and higher lows through much of June, July, September, and early October. This sustained advance saw the index move from the 5900s to highs above 6700. However, the most recent price action, specifically the sharp decline on 2025-10-10 from a close of 6735.11 to 6552.51, represents a notable shift in the short-term market dynamics. While the index subsequently experienced a partial recovery to 6654.72 on 2025-10-13, the preceding strong downside movement is significant. The absence of volume data limits our ability to confirm the conviction behind these price moves, but the directional change is evident.
The 14-day Relative Strength Index (RSI) provides compelling evidence of a momentum shift. Throughout the primary uptrend, the RSI frequently entered overbought territory above 70, signaling strong buying pressure. Notable instances include July 03 (75.57), July 25 (76.21), and September 22 (74.75). The RSI’s dramatic fall from 66.12 on 2025-10-09 to 42.07 on 2025-10-10 indicates a rapid and substantial loss of bullish momentum, marking the lowest RSI reading within the entire 90-day data set. While the subsequent rebound to 52.49 on 2025-10-13 suggests some re-entry of buyers, the prior severe dip below the 50-level, traditionally a momentum threshold, implies that bearish sentiment has gained considerable ground. It is roughly even chance that this bounce is a temporary retracement within a developing bearish phase, rather than an immediate resumption of the prior uptrend.
Complementing the RSI, the Percentage Price Oscillator (PPO) 13-21 day indicates a clear weakening of the underlying trend strength. The PPO remained in positive territory throughout the 90-day period, initially rising with the price in June and July, confirming strong bullish momentum (e.g., reaching a peak of 0.9398 on 2025-07-03). However, despite the SPX reaching new price highs in early October (e.g., 6740.28 on 2025-10-06), the PPO’s subsequent peak on 2025-09-22 at 0.6350 remained significantly below its July peak. This divergence between rising price and weakening momentum, particularly the PPO’s overall declining trend from its July highs, is a significant cautionary signal. The sharp drop in the PPO from 0.5445 on 2025-10-09 to 0.3340 on 2025-10-13, reaching its lowest point since 2025-09-02, strongly corroborates the substantial loss of upward momentum identified by the RSI. The downward trajectory of the PPO suggests that bullish conviction is dissipating, even though the indicator remains above zero.
Based on the combined technical evidence, it is likely that the SPX is undergoing a significant short-term correction or a period of consolidation following its protracted rally. The sharp drop in both the 14-day RSI to deeply bearish levels and the PPO to its recent lows signals a substantial erosion of buying pressure and momentum. Although a bounce occurred on 2025-10-13, it is unlikely to immediately reverse the emerging short-term bearish bias given the magnitude of the preceding momentum shift. An alternative scenario, though less likely in the immediate term, is that the 2025-10-10 decline was a brief anomaly, and the market will quickly resume its robust uptrend if the RSI can sustain a move back above 60 and the PPO begins to trend upward more aggressively. However, the current technical posture strongly suggests that downside pressure is likely to persist or at least lead to further ranging before a clear resumption of the previous uptrend.