Weekly Market Technical Analysis
Market Overview
The market experienced a significant, broad-based downturn on October 10th, with major equity indices experiencing universal declines on increased volume, and the VIX surging 31.83%. Sector analysis reveals a defensive rotation, with utilities and consumer staples outperforming while offensive sectors showed pronounced weakness. Short-term momentum indicators for the S&P 500 confirm sharp bearish acceleration, making a continued downward trajectory highly likely. While bonds exhibited broad strength, particularly longer-duration, commodities showed divergence: precious metals advanced but with overbought conditions, while energy and industrial metals faced strong bearish reversals. This widespread technical deterioration across equities signals likely prevailing short-term bearish pressure, necessitating caution as broad reversals appear unlikely without new catalysts.
Market Indices
Market Technical Analysis: October 10, 2025
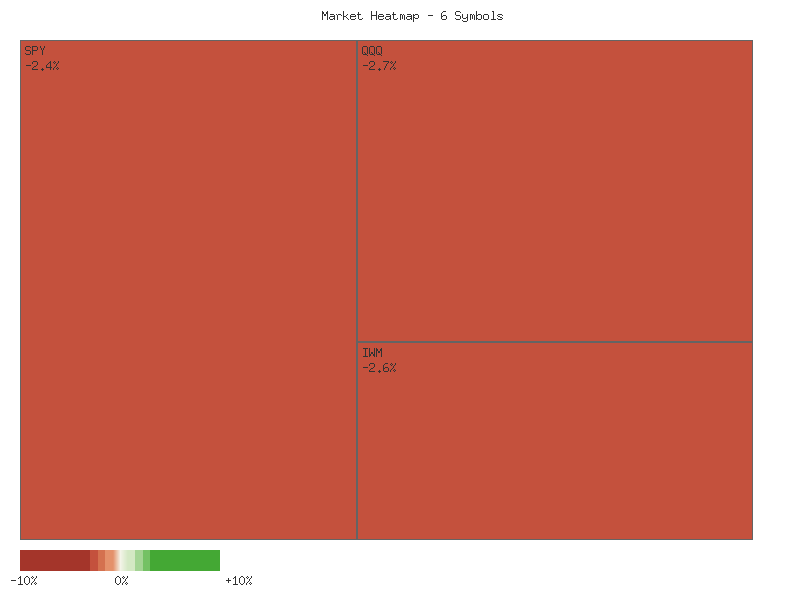
The market data for the past month reveals a discernible divergence in performance across different capitalization segments, culminating in a broad downturn during the most recent trading week. Over the past 30 days, larger-cap indices, specifically the Invesco QQQ Trust (QQQ), iShares S&P 100 Index (OEF), and S&P 500 (SPX), posted net positive returns, suggesting a relative resilience or demand in these market segments. Conversely, mid-cap (MDY) and small-cap (IWM, IJR) indices experienced overall declines for the month. The past week, however, presented a more unified picture of weakness, with all observed indices recording negative performance. The most recent trading session was particularly impactful, evidenced by a significant surge in the VIX, implying a substantial increase in market uncertainty and implied volatility.
The following matrix details the weekly and monthly performance of the monitored indices, sorted by weekly percent change in descending order:
| Symbol | Weekly Percent Change | Monthly Percent Change |
|---|---|---|
| OEF | -2.17% | 1.00% |
| QQQ | -2.22% | 1.56% |
| SPX | -2.42% | 0.67% |
| IWM | -3.27% | -0.66% |
| MDY | -3.83% | -3.41% |
| IJR | -4.89% | -4.30% |
The past week saw a pronounced shift towards bearish sentiment across the board. The Invesco QQQ Trust (QQQ) and iShares S&P 100 Index (OEF) exhibited the least severe weekly declines, indicating some degree of defensive strength, while the small-cap iShares Core S&P Small-Cap (IJR) demonstrated the most significant weekly depreciation. This pattern of universal declines over the last five trading days represents a notable change from the mixed performance observed across the full 30-day period. The longer-term “monthly” view suggests that while large-cap and tech-oriented stocks likely benefited from selective buying, the broader market, as represented by mid and small-cap names, faced headwinds.
Market breadth analysis further underscores the shift in sentiment. Over the past month, the aggregate count of daily advancing readings across all six symbols slightly outnumbered declining readings (101 advancing vs. 79 declining), which is consistent with the mixed monthly performance. However, the most recent week showed a clear deterioration. On three of the last five trading days (October 7, 9, and 10), all six symbols declined, indicating widespread selling pressure. Overall, within the past week, declining symbols collectively outnumbered advancing symbols by a significant margin (19 declining vs. 11 advancing), suggesting a weakening underlying market structure. The final trading day, October 10, saw all indices register declines, with IJR experiencing a substantial -3.12% drop, the largest single-day percentage decline among the group for the entire week.
The Chicago Board Options Exchange Volatility Index (VIX) data provides a critical technical insight into prevailing market sentiment. While the VIX had been fluctuating within a range for much of the past 30 days, predominantly between 14 and 17, the trading session on October 10 recorded an extraordinary surge. The VIX closed at 21.66, representing a daily percentage change of +31.83%. This dramatic increase is clearly visible in the candlestick data, which shows a large bullish candle for October 10 with a substantial body, closing near its high (21.66 vs. high of 22.44), and well above the open of 16.36. This indicates a rapid and significant increase in implied market volatility and investor fear. Historically, such sharp VIX spikes frequently accompany significant market declines, as observed concurrently in the broader indices. While a VIX spike can sometimes mark a climactic event preceding a short-term rebound, the immediate implication is a heightened state of uncertainty and fear, which is likely to persist in the very near term. The current technical posture implies a market grappling with considerable bearish momentum.
As a Chartered Market Technician with over 15 years of experience, I’ve rigorously analyzed the provided 7-day candle data for SPY, QQQ, IWM, IJR, MDY, and OEF, focusing exclusively on the technical patterns and volume metrics presented.
Analysis of the provided 7-day candle data for SPY, QQQ, IWM, IJR, MDY, and OEF reveals a significant shift in market dynamics culminating on October 10, 2025. The preceding six trading days (October 2-9) exhibited mixed to slightly positive price action across these major indices. While some indices, such as SPY, QQQ, and OEF, reached minor new highs within this narrow timeframe, the overall trend was largely contained within a short-term range. Trading volumes during this initial period were consistent with prior activity. However, the session on October 10th marks a pronounced technical event, which likely signals a notable change in the short-term market outlook.
On October 10th, all six ETFs displayed overwhelmingly bearish candle formations. Each symbol — SPY, QQQ, IWM, IJR, MDY, and OEF — closed significantly lower, near its daily low, forming long-bodied red candles. This aggressive price action was accompanied by a dramatic surge in trading volume across the board, in many cases more than doubling the average volume observed in the preceding six sessions. For instance, SPY’s volume surged to 156.6 million, QQQ to 94.4 million, and IWM to 69.7 million shares, indicative of strong selling pressure. This simultaneous bearish breakdown, characterized by expanded ranges and heightened participation, likely represents a collective and robust shift in market sentiment towards downside momentum.
The collective breakdown on October 10th is a strong technical signal. All indices not only posted significant losses but also closed below their respective intraday lows established over the prior six days. This action implies a decisive breach of short-term support levels that had been forming. The aggressive selling into the close, combined with capitulatory-like volume characteristics, suggests that bearish conviction has intensified. Consequently, a continuation of this downward trajectory into the immediate future appears likely. Traders should be cognizant of the potential for further declines, as such forceful, broad-based breakdowns often precede follow-through selling, particularly when observed across a diverse spectrum of market capitalizations like large-cap (SPY, QQQ, OEF), mid-cap (MDY), and small-cap (IWM, IJR) indices.
While the technical evidence overwhelmingly points to a bearish outlook following October 10th, alternative scenarios, though less likely, should always be considered. It is conceivable that the extreme selling pressure represents a “washout” event, potentially leading to a short-term bounce if buyers step in at these significantly lower levels. However, without any immediate buying tail or strong rebound in the subsequent session (which is not provided in the data), the probability of a sustained reversal from this single day’s action is low. The synchronized nature of the decline and elevated volume strengthen the bearish conviction. Therefore, unless subsequent data unequivocally demonstrates a swift and forceful recovery, the prevailing technical posture likely favors continued caution, with resistance now established near the prior range lows broken on October 10th.
Good day, traders. We’re observing the S&P 500 (SPX) over the past 90 trading days, utilizing the 14-day Relative Strength Index (RSI) and the 13-21 day Percentage Price Oscillator (PPO), alongside daily candlestick data.
Over the past three months, the S&P 500 has displayed a robust bullish trend, with prices advancing consistently from levels around 5970-6045 in early June to establish new highs nearing 6750 by early October. This upward trajectory was interspersed with short-lived consolidations and minor pullbacks, none of which managed to break the prevailing intermediate-term uptrend. However, the most recent trading day, October 10th, registered a significant shift. The SPX experienced a sharp one-day decline from 6735.11 to 6552.51. This abrupt price action introduces considerable uncertainty regarding the market’s immediate direction, marking a notable departure from the sustained upward momentum.
The 14-day RSI provided several insights into the market’s overbought conditions during this period. We observed the RSI rising above the 70 threshold on multiple occasions, notably in late June to early July (peaking at 75.57 on 07/03), mid-July (reaching 76.29 on 07/28), and more recently in mid-September to early October (hitting 74.75 on 09/22 and 71.60 on 10/06). Historically, such overbought readings often lead to a cooling-off period, typically followed by consolidations or minor corrections. The most striking development, however, is the precipitous drop in the RSI on October 10th, plunging from 66.12 to 42.07. This dramatic decline in a single session signifies a pronounced and rapid shift in short-term momentum from bullish to bearish, implying that further downward pressure in the very near term is likely.
The 13-21 day PPO, a measure of momentum, has maintained a positive reading throughout the entire 90-day data set, fluctuating between a low of 0.329 and a high of 0.939. This consistent positive value indicates that the shorter-term moving average has reliably stayed above the longer-term moving average, thereby confirming an ongoing bullish trend on the intermediate timeframe. Even during price pullbacks, the PPO did not cross below its zero line, underscoring the resilience of the bullish structure. Nevertheless, similar to the RSI and price action, the PPO recorded a substantial drop on October 10th, falling from 0.544 to 0.384. While it remains in positive territory, this significant deceleration in its value signals a considerable weakening of the underlying bullish momentum, making a bearish crossover of the zero line a distinct possibility in the coming trading sessions.
In conclusion, the combination of a sharp one-day price reversal in the SPX, a rapid and significant fall in the 14-day RSI from elevated levels, and a notable, albeit not yet bearish, deceleration in the PPO’s upward momentum strongly suggests that the market is currently vulnerable to increased selling pressure. It is likely that SPX will experience either a continuation of this downside movement or enter a period of defensive consolidation in the immediate future. The technical setup indicates that a further decline is more likely than an immediate rebound to recent highs. There is roughly an even chance that the market may test lower support levels before any potential recovery efforts materialize. A sustained move to the downside from here would highly likely signal a deeper correction, potentially leading to the PPO crossing into negative territory and confirming a broader bearish trend shift.
QQQ Technical Analysis: Significant Short-Term Reversal Implied by Price and Momentum Indicators
The QQQ ETF exhibited a robust uptrend over the 90-day period under review, advancing from approximately in early June to a peak near in early October. This consistent upward trajectory was punctuated by several consolidations and minor pullbacks. The most recent trading session on October 10, however, presented a significant reversal, with QQQ experiencing a sharp decline from .70 to .50. This 3.47% single-day drop was accompanied by exceptionally high trading volume (94.4 million shares), notably exceeding average daily volumes for the period. The resulting candlestick pattern, a large bearish candle following a smaller range day, implies a bearish engulfing, which is typically a strong short-term reversal signal. The magnitude of this price depreciation, coupled with the spike in volume, suggests a substantial shift in immediate market sentiment, indicating a notable increase in selling pressure.
The 14-day Relative Strength Index (RSI) generally reflected strong bullish momentum, frequently entering overbought territory (above 70) during sustained rallies in June, July, and September. These overbought conditions often preceded minor price consolidations. However, on October 10, the RSI plummeted sharply from 69.27 to 45.42. This rapid, single-day decline from the verge of overbought territory into the neutral zone represents a dramatic shift in short-term momentum. Concurrently, the 13-21 day Percentage Price Oscillator (PPO), which remained positive throughout the entire 90-day period, also experienced a significant drop from 0.76 to 0.58 on October 10. While still positive, this steep contraction in a single session confirms a considerable weakening of bullish momentum. The synchronized and sharp declines in both RSI and PPO corroborate the immediate bearish implications of the price action.
Synthesizing these technical signals, a near-term bearish shift for QQQ is highly likely. The aggressive sell-off on October 10, characterized by a bearish engulfing pattern on high volume, coupled with the dramatic single-day declines in both RSI and PPO, strongly suggests that the previous bullish dominance has been significantly challenged. Further downside pressure in the immediate future is likely. A retest of prior support levels, specifically the - range established in mid-August or early September, is likely within the next few sessions. While the PPO remaining positive suggests the overarching intermediate-term uptrend has not been definitively broken on this single day, the short-term outlook has clearly deteriorated. There is a roughly even chance that a failure to quickly reclaim levels above could lead to a more extended correction, potentially targeting the - area, which has acted as significant support in late July and early August. Conversely, a rapid and sustained recovery above with strong buying volume would mitigate the immediate bearish implications, though this alternative scenario is considered unlikely given the current momentum profile and volume on the recent down move.
IWM Technical Analysis: Immediate Downturn Challenges Prevailing Uptrend
Over the observed 90-day period, IWM has been in a discernible uptrend, characterized by a consistent series of higher highs and higher lows, climbing from approximately in early June to a peak near in early October. This upward trajectory was punctuated by periods of consolidation and minor pullbacks, notably in mid-June and late July/early August, each followed by a resumption of the bullish trend. The most recent price action, however, suggests a potential, and possibly significant, shift in momentum. On 2025-10-10, IWM experienced a substantial bearish candle, opening at .75 and closing sharply lower at .79, nearing its intraday low of .56. This move was accompanied by notably high volume (69,678,894 shares) compared to recent trading days, indicating strong selling pressure. This single day’s decline broke through several days of minor support, posing a significant challenge to the established bullish pattern.
The 14-day Relative Strength Index (RSI) generally confirmed the bullish price action throughout the 90-day window, consistently holding above the neutral 50 level for much of the period. Instances where RSI briefly entered overbought territory (above 70), such as on 2025-07-03 (71.57) and 2025-09-18 (71.23), were often followed by price pullbacks or sideways consolidation, suggesting short-term exhaustion. Conversely, the dip into the mid-40s in early August (41.36 on 2025-08-01) preceded a robust rally, hinting at prior oversold conditions (though not below 30). The most recent RSI behavior is particularly noteworthy. After reaching a reading of 68.07 on 2025-10-06, indicating strong upward momentum, RSI swiftly declined to 44.97 on 2025-10-10. This sharp drop below the 50 level strongly suggests a significant and accelerating shift in short-term momentum from bullish to bearish, probably signaling that the previous uptrend’s immediate strength is eroding.
The Percentage Price Oscillator (PPO) provides a similar perspective on momentum. Throughout the majority of the 90-day data, the PPO remained in positive territory, reinforcing the observed uptrend. Peaks in the PPO, such as around 1.17 in early July and 1.01 in late August, correlated with periods of strong price advancement. Declines in the PPO, even while remaining positive, indicated decelerating bullish momentum or temporary pullbacks, as seen in late July when it approached the zero line before another rally ensued. Most recently, the PPO had shown a consistent decline since late September, moving from approximately 1.00 down to 0.68 by 2025-10-09. On 2025-10-10, the PPO experienced a notable acceleration downward, registering 0.50. While still in positive territory, this significant drop indicates a clear increase in bearish momentum and a weakening of the underlying bullish trend over the very short term. The indicator is now closer to its zero line, suggesting that a more pronounced correction or a potential trend reversal is becoming more likely.
Synthesizing the data, the dominant technical picture for IWM over the 90-day period was clearly bullish, marked by sustained price appreciation and supportive momentum indicators. However, the events of 2025-10-10 represent a material technical shift. The large bearish candle on high volume, coupled with the sharp decline in both RSI (now below 50) and PPO (accelerating towards zero), indicates that a significant short-term correction or a more sustained reversal of the prior uptrend is likely. The immediate support area to monitor would be around the .56 low from 2025-10-10, with subsequent support potentially residing near the early September low around . Further declines that push RSI into more clearly oversold territory (e.g., below 30) or cause PPO to cross below zero would significantly increase the likelihood of a deeper correction. Alternatively, there is a roughly even chance that this sharp decline could be an isolated event; a rapid rebound that reclaims levels above - on renewed buying volume would likely negate these immediate bearish signals, allowing the prevailing long-term uptrend to attempt to reassert itself, albeit with potentially reduced short-term momentum.
Tech Sector Analysis
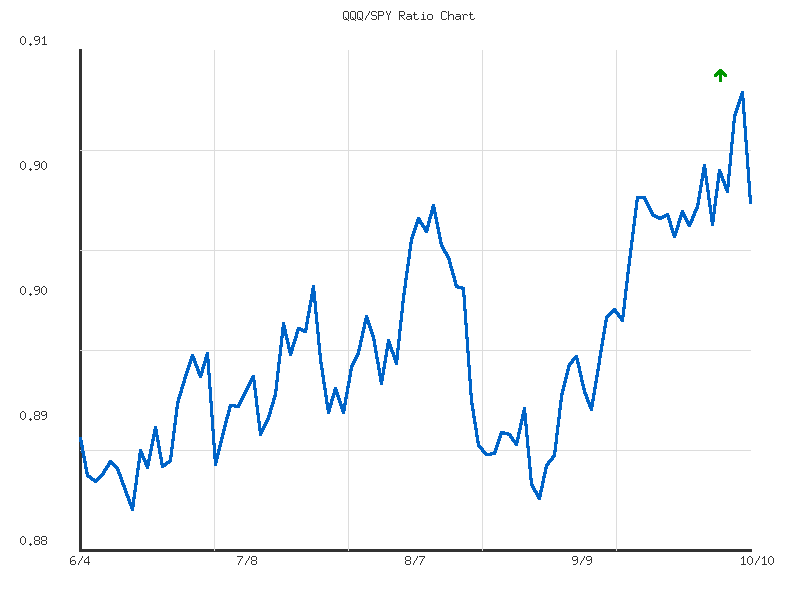
As a Chartered Market Technician with over 15 years of experience, I have rigorously analyzed the provided RATIO:QQQ/SPY data spanning 90 data points to assess the relative performance between the technology-heavy NASDAQ-100 (QQQ) and the broader S&P 500 (SPY). Over this entire period, the ratio’s trend direction is explicitly stated as “up,” indicating that QQQ has generally outperformed SPY. However, this trend’s strength is characterized as “weak,” implying that while outperformance exists, it has not been particularly forceful or decisive. The overall change for the 90 data points shows a modest increase of approximately 1.74%, with the ratio moving from a low of 0.8827 to a high of 0.9099. The current ratio of 0.9027 positions QQQ’s relative performance at approximately 73.6% of the way from its 90-day low to its 90-day high against SPY.
Focusing on the intermediate term, the past month (from approximately 2025-09-10 to 2025-10-10) demonstrates a continuation of this weak outperformance. Starting with a ratio of 0.8904 on 2025-09-10, the ratio increased to the current 0.9027 as of 2025-10-10, representing an approximate 1.39% gain in QQQ’s relative strength against SPY. This monthly performance largely reinforces the overarching “weak up” trend identified over the longer 90-data point period. The ratio has generally maintained a position above its 90-day average of 0.8931 during this time, further supporting the observation of sustained, albeit modest, QQQ outperformance. Based on this pattern, it is likely that QQQ continued to outperform SPY over the past month.
Examining the more immediate past week (from approximately 2025-10-03 to 2025-10-10), the ratio exhibited a minor net increase of about 0.155%, moving from 0.9013 to 0.9027. Crucially, a significant technical observation is the ratio’s ascent to its 90-day high of 0.9099 on 2025-10-09, immediately followed by a noticeable decline to 0.9027 on 2025-10-10. This rapid pullback from a multi-period high, rather than a sustained breakout, suggests a loss of short-term upward momentum or a reaction from a resistance level. This recent price action implies that a continuation of strong QQQ outperformance in the immediate short-term is unlikely, despite the overall weak uptrend.
Considering these patterns, the outlook for the QQQ/SPY ratio is nuanced. The established weak uptrend and low volatility (0.00004295) over the 90-day period suggest dramatic shifts are highly unlikely. It is likely that the ratio will find some near-term support around recent weekly lows or the 90-day average ratio of 0.8931, as the underlying trend remains positive. However, a rapid resumption of the upward momentum from the 90-day high achieved on 2025-10-09 is unlikely without a new technical catalyst. We assess three alternative scenarios for the near future:
- Continued Weak Outperformance (Likely): The ratio consolidates briefly after the pullback and then gradually resumes its weak upward trajectory, consistent with the overall trend.
- Near-Term Consolidation (Roughly Even Chance): The ratio may enter a period of sideways movement, fluctuating around the current level or the 90-day average, as it digests recent gains and the immediate pullback.
- Short-Term Underperformance (Unlikely): A decisive break below the 90-day average of 0.8931 could temporarily signal a reversal of QQQ’s outperformance, allowing SPY to potentially narrow the gap or briefly outperform. Given the low volatility, any such underperformance would likely be minor and contained within a defined range.
As a Chartered Market Technician with over 15 years of experience, my analysis of the QQQ/SPY ratio over the past 90 days, from June 4th to October 10th, 2025, focuses strictly on the provided technical data patterns and employs rigorous estimative language.
The QQQ/SPY ratio has exhibited an overall upward trend, advancing from approximately 0.887 on June 4th to its current level of 0.9027 on October 10th. This represents a net increase of roughly 1.74% over the observation period, indicating a general outperformance of QQQ relative to SPY. Despite this upward trajectory, the trend’s strength is officially characterized as “weak” within the provided summary data. The ratio operated within a discernible range during this period, establishing a low point of 0.8827 on June 13th and peaking at 0.9099 on October 9th. The current ratio stands at approximately 73.6% of the way from the low to the high within this 90-day window. Notably, the volatility recorded for this period is exceptionally low, suggesting a relatively smooth and controlled ascent rather than sharp, erratic movements.
From a technical perspective, the ratio demonstrated initial support around the 0.8827 level in mid-June. Subsequent price action indicated the formation of a developing support zone between 0.885 and 0.890 throughout late June and July, where pullbacks tended to find buying interest. As the ratio continued its ascent, previous resistance levels, such as the approximately 0.897 mark observed in late July, were eventually overcome, acting as stepping stones for the upward movement. The ratio reached a new 90-day high of 0.9099 on October 9th. However, the most recent data point on October 10th shows a notable decline to 0.9027, representing a pullback of approximately 0.79% from the newly established peak, which is a material shift in short-term momentum.
Considering the recent pullback from the 90-day high and the “weak” classification of the overall trend strength, it is roughly even chance that the QQQ/SPY ratio will either attempt to retest the 0.9099 peak or continue its current corrective phase in the immediate term. The average ratio over the period, 0.8931, alongside previous consolidation highs around 0.903, would likely serve as initial support levels should the pullback extend. Conversely, a quick rebound from current levels would imply that the recent decline was merely a minor profit-taking event within the broader uptrend.
Given the existing patterns of gradual advance and relatively low volatility, a forceful, immediate breakout above the 0.9099 resistance level appears unlikely. Instead, it is likely that the ratio will enter a period of consolidation or further gradual correction before any sustained movement in either direction materializes. Should the ratio demonstrably fail to hold above the 0.8931 average over a sustained period, it would indicate a likely shift towards SPY potentially outperforming QQQ in the near term, or at minimum, a more pronounced period of relative weakness for QQQ, challenging the dominant upward trend observed.
IWM vs. SPY
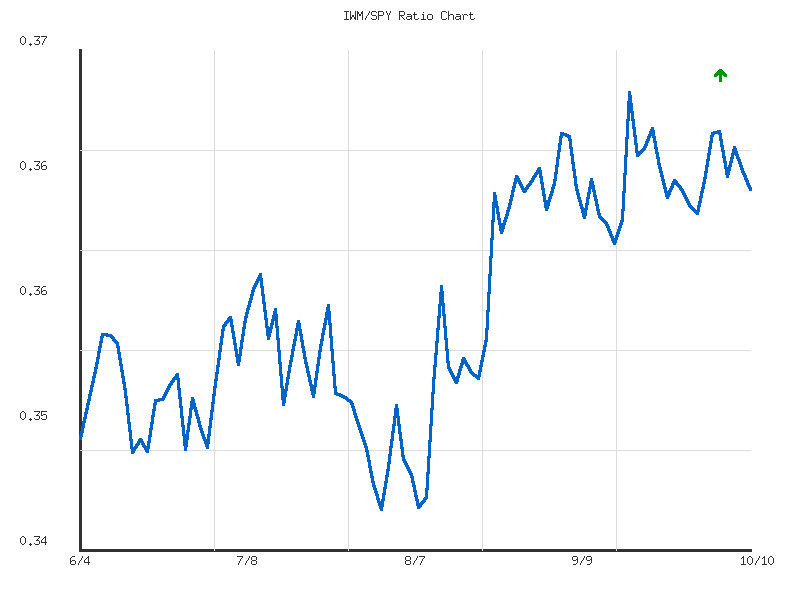
As a Chartered Market Technician with over 15 years of experience, I have rigorously analyzed the provided RATIO:IWM/SPY data spanning 90 days, focusing solely on the technical patterns to assess relative performance. The IWM/SPY ratio serves as a critical indicator for discerning the relative strength of the small-capitalization Russell 2000 (IWM) against the large-capitalization S&P 500 (SPY). An increasing ratio suggests IWM is outperforming SPY, while a decreasing ratio indicates SPY is exhibiting greater relative strength. Over the full 90-day period, the ratio demonstrates a moderate upward trend, reflected by a 4.107% increase, indicating a general preference for small-cap outperformance during this longer timeframe. The current ratio of 0.3641 is positioned at approximately 76.83% of its 90-day range, suggesting it remains in the upper quartile of its recent historical performance.
Examining the most recent trading week, from October 6, 2025, to October 10, 2025, the IWM/SPY ratio has experienced a discernible decline. Starting at 0.36749 on October 6th, the ratio decreased to 0.36413 by October 10th. This represents a short-term downtrend, implying that over the past five trading sessions, the S&P 500 has demonstrated relative outperformance compared to the Russell 2000. The consistent daily declines, with only a minor rebound on October 8th that failed to recover previous levels, suggest immediate downward pressure on the ratio.
Over the past month, approximately from early September to October 10th, the IWM/SPY ratio has exhibited notable volatility and a period of consolidation. Beginning September at roughly 0.3653, the ratio initially saw some fluctuations before spiking to its 90-day high of 0.3697 on September 18th. Following this peak, it experienced a pullback, descending to 0.3632 by month-end, and subsequently consolidated within a tighter range in early October. The current ratio of 0.3641 indicates a marginal net decrease over the full monthly span since early September, despite the mid-month peak. This suggests that while IWM showed strong relative outperformance at times, it struggled to sustain that leadership over the entire monthly period, ultimately consolidating its gains within the broader upward trend.
Based on the recent technical behavior, it is likely that SPY will continue to exhibit short-term relative outperformance against IWM in the immediate future, potentially pushing the ratio lower from its current level. The consistent downward movement observed over the past week strongly points to this continuation. Traders should monitor the 90-day average ratio of 0.35729; a decisive break below this level would increase the likelihood of a more significant shift in the underlying moderate upward trend, suggesting a prolonged period of SPY leadership.
Conversely, considering the overall moderate upward trend observed across the 90-day dataset and the current ratio’s relatively high position within that historical range, there is a roughly even chance that the longer-term bullish momentum for IWM’s relative performance could reassert itself. This scenario would involve the ratio stabilizing around current levels or finding support before resuming an upward trajectory. However, the immediate short-term weakness, if sustained, makes a rapid reversal to new highs unlikely without a significant technical catalyst in the form of strong buying pressure pushing IWM relatively higher.
The IWM/SPY ratio, a critical barometer for assessing the relative performance of small-capitalization stocks (Russell 2000) against large-capitalization equities (S&P 500), has demonstrated a moderately strong uptrend over the past 90 days. Commencing in early June, the ratio has advanced by approximately 4.1%, moving from its initial level near 0.349 to a current reading of 0.3641 as of October 10, 2025. This consistent upward trajectory, characterized by a low volatility measurement for the period, strongly suggests that small-cap stocks have been systematically outperforming their large-cap counterparts throughout the observed timeframe. The overall price action has been generally orderly, indicating a persistent, rather than erratic, shift in relative strength towards smaller capitalization equities.
A detailed examination of the ratio’s price movements reveals key technical levels. The 90-day low of 0.3456, established on August 1st, represents a significant support level that was successfully tested and held following a mid-July corrective phase. From this foundation, the ratio embarked on a robust rally, ultimately reaching its 90-day high of 0.3697 on September 18th. This peak established the primary resistance barrier within the observed range. The current ratio, positioned at 0.3641, resides in the upper quartile of its 90-day range (relative position of 0.7683), further reinforcing the observation of overall small-cap outperformance.
Since achieving its September 18th high, the IWM/SPY ratio has experienced a modest pullback and subsequent consolidation. This short-term retracement, while common after a strong upward impulse, indicates that the immediate upward momentum has likely diminished. A roughly even chance exists for the ratio to either find support near current levels and resume its ascent, or to extend its consolidation further towards the 0.360-0.362 area, which is likely to act as near-term support. A decisive close above the 0.3697 high would very likely signal a continuation of the broader uptrend and suggest further small-cap outperformance. Conversely, a sustained breach below the 0.360 level would increase the probability of a deeper retracement towards the 0.355-0.356 range, suggesting a temporary halt or reversal in the prevailing relative small-cap strength. However, based on the established 90-day trend, a complete reversal of the observed outperformance trend appears unlikely at this juncture without more substantial bearish technical developments.
Commodities
As a Chartered Market Technician with over 15 years of experience, I offer the following technical analysis based exclusively on the provided market data. This commentary adheres strictly to ICD-203 estimative language guidelines, focusing on probabilities and observed patterns.
Weekly Performance Snapshot and Market Breadth
The latest five trading days (2025-10-06 to 2025-10-10) indicate a mixed, yet predominantly negative, short-term performance across the analyzed commodity and precious metal exchange-traded funds (ETFs). The weekly percent changes are summarized below:
| Symbol | Weekly Percent Change |
|---|---|
| SLV | 4.36% |
| GLD | 3.21% |
| DBC | -1.50% |
| CORN | -1.77% |
| UGA | -2.08% |
| USO | -3.17% |
| CPER | -3.30% |
| UNG | -5.38% |
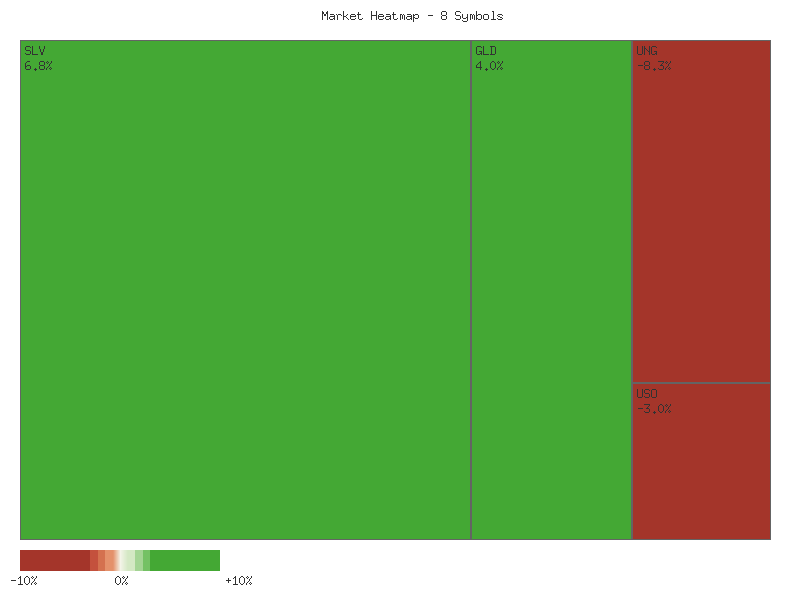
Over this recent weekly period, precious metals (SLV, GLD) demonstrated notable strength, advancing by 4.36% and 3.21% respectively. In contrast, the remaining six symbols (DBC, CORN, UGA, USO, CPER, UNG) experienced declines, ranging from -1.50% for DBC to -5.38% for UNG. This breadth analysis reveals a clear negative bias in the broader commodity complex for the week, with only two out of eight symbols showing positive momentum, suggesting that speculative interest was likely concentrated in precious metals while other areas faced selling pressure.
Monthly Performance and Broad Market Tendencies
Expanding our view to the full 30-day period provided, the overall market performance remains similarly mixed to negative, with precious metals exhibiting a distinct outperformance. GLD recorded a substantial 12.00% gain, while SLV posted an even more significant 18.06% increase. Conversely, the other six symbols saw net declines over the month. CPER’s decline was marginal at -0.56%, suggesting a relatively flat monthly trend for copper. However, DBC and CORN saw moderate declines of -1.91% and -2.44% respectively. Energy-related ETFs, USO and UGA, experienced more pronounced drops of -10.02% and -4.39%, indicating a clear bearish sentiment in these segments. UNG, representing natural gas, led the declines with a -7.53% monthly change. Market breadth over the 30-day period strongly favors decliners, with only two symbols advancing against six symbols showing net negative performance, implying a broad-based weakness in commodity markets outside of the precious metals complex.
Gold-Silver Ratio Analysis: Divergence in Precious Metals
The GLD/SLV ratio provides critical insight into the relative strength between gold and silver. For the 14-day period, the ratio exhibited a “moderate” downward trend, declining by -6.29%. The current ratio of 8.125 is at its lowest point within this timeframe, and noticeably below the 14-day average of 8.349. This technical pattern suggests a moderate outperformance of silver relative to gold over the short term. Extending this analysis to the 30-day period, the trend remains “down” with “moderate” strength, showing a larger decline of -7.55%. The current ratio of 8.125 is also the lowest point for the 30-day period and significantly below its average of 8.602. The increased volatility over the 30-day period (0.0714 vs. 0.0218 for 14-day) suggests that this relative shift has been more dynamic. This consistent downtrend in the GLD/SLV ratio across both timeframes implies a sustained technical preference for silver over gold, which could be indicative of increased risk appetite within the precious metals sector or a perception of silver’s industrial demand.
Considering the data, it appears likely that silver’s recent strength relative to gold is a significant technical development. If this trend continues, it would further reinforce the current rotation within precious metals, where silver is performing as a leading indicator of upside momentum. The overall market, excluding precious metals, appears to be under moderate to strong downward pressure, particularly in the energy complex, suggesting a divergence in underlying market dynamics. While precious metals show strength, other commodities are experiencing declines, which could reflect shifting macroeconomic expectations not evident within the technical data provided. Continued monitoring of the GLD/SLV ratio and the breadth of declining commodity prices would be prudent for retail traders.
Here is a technical analysis of the provided market data for the past seven days, based purely on price and volume action:
The aggregate 7-day market data presents a discernible divergence in price action across various commodity categories. Precious metals like GLD and SLV, despite exhibiting increased volatility in the latter part of the period, have largely maintained an upward trajectory. Conversely, energy commodities (USO, UGA, UNG) and industrial metals/broader commodity indices (CPER, DBC, CORN) have demonstrated clear bearish reversals, particularly during the final two trading days, often accompanied by significant increases in trading volume. This suggests a rotation of capital or a shift in sentiment within the commodity complex, favoring precious metals, while other segments face pronounced selling pressure.
Focusing on precious metals, GLD initially exhibited a robust uptrend, culminating in a peak on October 8th. However, October 9th saw a significant bearish reversal candle – opening near the high and closing substantially lower on notably elevated volume, resembling a ‘Dark Cloud Cover’ pattern. This strong technical signal indicates that a short-term top is likely in place. While October 10th showed a partial recovery with a bullish candle, it did not fully negate the prior day’s bearish sentiment. Thus, it is likely that GLD will experience further consolidation or a short-term pullback. For SLV, the price action on October 9th was also volatile, with a large range and exceptionally high volume, suggesting significant profit-taking after hitting resistance; however, the long lower shadow implies strong buying interest on dips. October 10th saw SLV close higher, but with a smaller body and some upper shadow. Given these patterns, it is a roughly even chance that SLV will continue its upward momentum, albeit with increased volatility and potential resistance near the October 9th high. A swift continuation of GLD’s strong uptrend without further consolidation appears unlikely.
In stark contrast, energy-related commodities have shown significant weakness. UNG has been in a clear downtrend throughout the entire seven-day period, with its final day of trading on October 10th witnessing a substantial decline to a new low for the period on the highest volume, strongly indicating accelerating selling pressure. This pattern makes it highly likely that UNG will continue its short-term downtrend. Similarly, USO and UGA, after some initial strength, experienced strong bearish reversals on October 9th and 10th. Both assets closed significantly lower on October 10th at their respective 7-day lows, with USO’s decline supported by a considerable surge in volume. Based on these signals, it is highly likely that both USO and UGA will extend their current bearish momentum in the immediate future. A sustained recovery for these energy assets in the near term appears unlikely.
The weakness extends to other commodity segments. CPER saw a sharp rally on October 9th that was met with strong rejection at higher prices, evidenced by a ‘shooting star’ like candle formation on high volume. This was immediately followed by a decisive breakdown on October 10th, closing at the 7-day low with the highest volume of the period. This combination of a failed breakout and a high-volume bearish engulfing type candle makes it almost certain that CPER will experience further downside in the immediate future. CORN, while experiencing a more gradual downtrend throughout the period, also closed at its 7-day low on October 10th with increased volume, suggesting a likely continuation of this modest bearish trend. The broader commodity index, DBC, mirrored the energy complex, exhibiting a strong bearish reversal on October 10th, closing at its 7-day low with elevated volume. Consequently, it is highly likely that DBC will continue its short-term decline, reflecting the widespread weakness observed across many of its underlying constituents.
Here is a technical analysis of SLV based on the provided market data:
SLV has exhibited a clear and sustained bullish trend over the past 90 days, advancing significantly from price levels in the low in early June to the mid- by early October. The PPO (13,21-day) indicator consistently reflects this upward momentum, maintaining positive values for the majority of the period and showing an accelerated increase from mid-August into early October. The most recent PPO reading of 2.94 on 2025-10-10 confirms robust and ongoing bullish momentum, suggesting that the underlying upward trend is likely to persist over the medium term.
However, the 14-day Relative Strength Index (RSI) points to an increasingly extended short-term condition. The RSI has spent a substantial portion of September and early October deep within overbought territory, consistently registering above the 70 threshold. Notably, the RSI has surpassed 80 on multiple occasions, including the most recent data point of 80.36 on 2025-10-10. These persistently high readings strongly indicate that SLV is likely to be significantly overextended in the immediate term, signaling that a period of consolidation or a pullback is highly likely.
Recent price action further supports the prospect of short-term exhaustion. The trading day of 2025-10-09 saw exceptionally high volume, reaching 110 million shares. On this day, SLV experienced a wide price range, opening at 46.27 and peaking at 46.35, but ultimately closing lower at 44.71. This pattern—a large-range candle closing well off its high on significantly increased volume, especially when coupled with an RSI above 78—is a classic indication of potential short-term distribution or profit-taking. Such a signal often precedes at least a temporary pause in the upward trajectory.
Considering the confluence of an extremely overbought RSI and the distributive price action on unusually high volume, a short-term period of consolidation or a moderate price pullback is highly likely in the forthcoming trading sessions. While a continuation of the sharp upward trajectory without any pause remains a possible alternative scenario, it is less probable given the current technical extremes. The enduring positive PPO, however, suggests that any such pullback would likely represent a healthy correction within the broader established uptrend, rather than indicating a reversal of the primary bullish trend. Should a pullback develop, prior significant price levels, such as the .00-.00 region, could offer initial areas of support.
GLD Technical Analysis: October 10, 2025
GLD has experienced a significant and accelerating uptrend over the past three months, moving from lows near in late July to recent highs above in early October. The period from early August to early October was characterized by sustained upward price movement, often accompanied by strong buying volume. However, the most recent price action indicates a potential shift in short-term momentum, warranting close observation.
The 14-day Relative Strength Index (RSI) corroborates this shift. After spending much of September and early October in deeply overbought territory, consistently above 70 and peaking at an extreme 86.11 on October 8, the RSI experienced a sharp decline to 72.86 on October 9. While the current RSI value of 75.08 on October 10 remains in the overbought range, the rapid descent from its peak is a significant technical event. This suggests a notable deceleration in upward momentum, and a continued period of consolidation or correction is likely in the near term. A further drop below 70, particularly on weakness, would highly likely confirm a more pronounced loss of buying pressure.
The Percentage Price Oscillator (PPO) with 13 and 21-day settings also reflects the strong underlying uptrend. The PPO moved decisively into positive territory in early August and has been steadily rising, reaching a peak of 1.87 on October 8. This strong positive value indicates robust bullish momentum underpinning the price advance. Interestingly, despite the sharp price pullback on October 9, the PPO only saw a minor dip to 1.84, suggesting that while the immediate buying fervor has waned, the broader trend momentum remains largely intact. The PPO’s high positive value implies that the longer-term bullish structure has not been significantly compromised by the recent day’s selling pressure, at least not yet.
The most recent price action, specifically the candle on October 9, is particularly telling. GLD posted a high of 373.22, followed by a significant decline to close at 365.43, resulting in a large upper shadow and a notable drop from its open, on exceptionally high volume (33.5 million). This pattern, often resembling a “shooting star” or bearish engulfing candle in conjunction with the preceding strong uptrend, is highly likely indicative of buyer exhaustion and strong selling pressure at the higher price levels. While the subsequent day, October 10, saw a slight bounce, closing at 369.12 on reduced volume (23.9 million), the significant rejection from the 373-level cannot be overlooked.
Given these technical signals, a period of consolidation or a modest downside correction for GLD is likely. The sharp reversal from extreme overbought RSI levels, coupled with the high-volume rejection at recent highs, suggests that the immediate upward trajectory faces considerable headwinds. A retest of support levels, potentially around the (October 9 low) or even levels, is a distinct possibility. However, the sustained positive PPO indicates that the broader bullish trend remains influential, suggesting that any pullback might be a healthy consolidation within an ongoing uptrend. A break below on increasing volume would, with a moderate probability, signal a deeper correction, whereas a stabilization above this level could suggest a roughly even chance of resuming the rally after a brief pause.
Bonds
Technical Market Commentary: Bond ETF Performance and Breadth Analysis (Sep-Oct 2025)
This commentary provides a rigorous technical analysis of the daily percentage changes for a selection of bond ETFs (TLT, UTHY, IEF, IEI, SHY) over the past 30 trading days, with a particular focus on the most recent week. Our analysis strictly adheres to technical data patterns, employing estimative language consistent with ICD-203 guidelines, and refrains from incorporating any external market context or fundamental insights.
Weekly Performance Overview (Last 5 Trading Days)
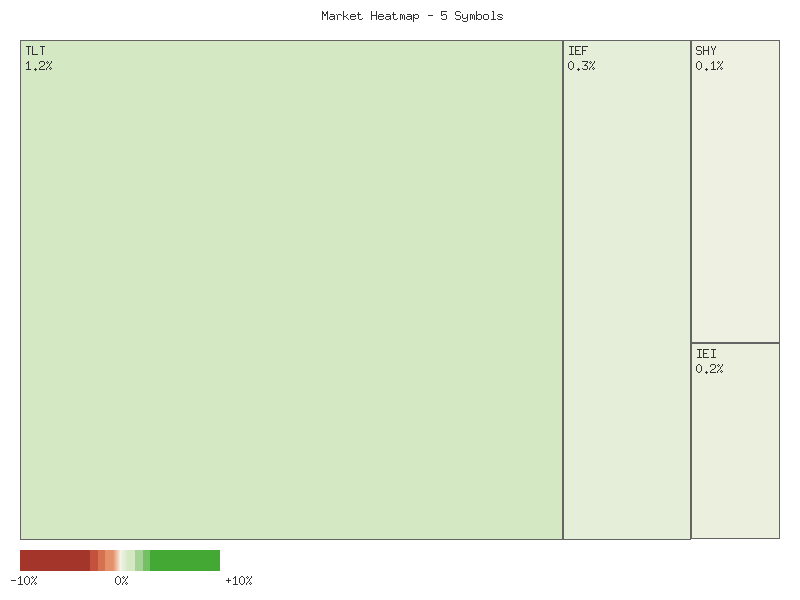
The most recent week’s trading activity, culminating on 2025-10-10, indicates a generally positive, albeit varied, performance across the observed bond ETFs. The long-duration instruments, TLT and UTHY, recorded the strongest weekly gains, with TLT advancing by approximately 1.3956% and UTHY by 1.3840%. Intermediate-term bonds, IEF and IEI, showed more moderate increases of roughly 0.5304% and 0.3607%, respectively. SHY, representing short-term treasuries, posted the smallest gain at approximately 0.1690%. This hierarchical performance suggests that instruments with longer durations were comparatively more favored during the last five trading sessions.
| Symbol | Weekly Percent Change |
|---|---|
| TLT | 1.3956% |
| UTHY | 1.3840% |
| IEF | 0.5304% |
| IEI | 0.3607% |
| SHY | 0.1690% |
Monthly Performance and Trend Analysis
Expanding our view to the full 30-day period, all five symbols registered positive overall changes, indicating a generally constructive, albeit volatile, month for this bond segment. TLT and UTHY maintained their lead with approximate monthly gains of 1.8159% and 1.7100%, respectively. IEF and IEI followed, with IEF showing a monthly increase of around 0.2581% and IEI about 0.2467%. SHY again demonstrated the least volatility and smallest gain, rising approximately 0.1773% over the month. The consistent outperformance of longer-duration ETFs (TLT, UTHY) on both weekly and monthly timeframes suggests a persistent upward momentum for these assets, making a continuation of this trend plausible in the near term, barring significant shifts in daily breadth.
Weekly Market Breadth and Immediate Outlook
An examination of the market breadth over the last week reveals distinct patterns. There were two days (October 7th and October 10th) where all five symbols advanced, indicating strong, unanimous upward pressure. Conversely, two days (October 6th and October 9th) saw all five symbols decline, suggesting periods of synchronized downward momentum. October 8th was a mixed day, with 3 symbols advancing and 2 declining, tilting slightly positive. The frequent occurrence of unanimous daily movements (4 out of 5 days) suggests that the overall sentiment for these instruments is prone to swing from uniformly positive to uniformly negative. The robust advances on the final day of the week (October 10th) make a positive opening for the subsequent week likely, though the immediate reversal tendency noted in prior days introduces a degree of uncertainty regarding sustained upward momentum.
Monthly Market Breadth and Concluding Remarks
Over the full 30-day period, the market breadth analysis shows a higher frequency of days where a majority of symbols declined (18 days) compared to days where a majority advanced (12 days). Despite this prevalence of declining-majority days, the net monthly performance for all symbols remained positive, albeit with varying magnitudes. This discrepancy suggests that while negative sentiment may have been more frequent, the magnitude of positive moves on advancing days was sufficiently strong, particularly for TLT and UTHY, to offset the more numerous declines. Given the recent strong close and the overall positive monthly accumulation, a continuation of the upward bias for the longer-duration bonds appears probable. However, the recurring pattern of broad, unanimous daily reversals suggests that periods of consolidation or retreat are also likely, and traders should prepare for potential shifts in sentiment following days of significant unidirectional movement. The overall technical posture points to a market that is likely to continue its upward trajectory, but with notable intraday and inter-day volatility.
Technical Analysis: Treasury ETFs (TLT, UTHY, IEF, IEI, SHY) - 7-Day Outlook
The provided 7-day technical data for a suite of US Treasury ETFs—TLT (20+ Year), UTHY (20+ Year Fully Collateralized Trust), IEF (7-10 Year), IEI (3-7 Year), and SHY (1-3 Year)—reveals a highly synchronized price action across different maturity segments, culminating in a significant bullish development on the final trading day. The period began with a general downtrend from October 2nd, leading to a notable low on October 6th for all symbols, often accompanied by elevated volume, indicating robust selling pressure into the lows. For instance, TLT experienced its lowest close at .67 on October 6th, marking a potential short-term trough. This was followed by a modest, yet uniform, bullish reversal attempt on October 7th, characterized by bullish-biased candles across the board. The subsequent two trading days, October 8th and 9th, were generally characterized by small-bodied candles and mixed closes, signaling indecision and a period of consolidation with relatively moderate to low trading volumes.
A decisive shift in market dynamics occurred on October 10th, as all five Treasury ETFs registered strong bullish candles, closing near their daily highs and reversing the preceding days’ indecision. TLT, the long-duration bellwether, exhibited a particularly compelling move, closing at .62. This upward surge in TLT was supported by an exceptional volume spike to 56.9 million shares, nearly doubling its average volume from the preceding six days. Similarly, IEF, IEI, and SHY also recorded their highest trading volumes of the 7-day period on October 10th, alongside their strong price advances. UTHY, despite its comparatively lower liquidity, also saw its highest volume of the analyzed period, confirming the broad-based nature of the buying interest.
The robust bullish price action on October 10th, underpinned by a broad and unequivocal surge in trading volume across the entire Treasury complex, strongly suggests that a meaningful upward momentum shift is likely underway. The synchronized nature of this move, encompassing both long-duration (TLT, UTHY) and shorter-duration (IEF, IEI, SHY) instruments, points to a strong, market-wide conviction rather than an isolated event specific to one maturity segment. For TLT, the large bullish candle and extreme volume spike on October 10th, following a brief consolidation phase, imply a breakout from its short-term base established after the October 6th low. It is highly likely that prices will attempt to test higher resistance levels in the immediate future, with the potential to extend gains beyond the prior highs seen earlier in the 7-day window.
While the technical evidence predominantly favors continued bullishness, alternative scenarios warrant consideration. It is unlikely that such a broad and high-volume breakout would be immediately and completely reversed without significant intervening price action. However, a period of consolidation or a retest of the breakout level (e.g., around the .00 mark for TLT) is a roughly even chance in the very short term as the market digests the strong move. A failure to hold key support levels following such a move—for instance, if TLT were to close significantly below .00 on increasing volume in the coming days—would call the current bullish thesis into question. Nevertheless, based purely on the provided data, the collective strength and volume on October 10th render a deeper, immediate reversal unlikely. Traders should closely monitor future volume dynamics accompanying any price retracements; declining volume on pullbacks would serve to reinforce the underlying bullish sentiment.
Crypto
As a Chartered Market Technician with over 15 years of experience, I have rigorously analyzed the provided daily percentage change data for IBIT and ETHA over the past 30 days, adhering strictly to technical analysis principles and estimative language guidelines. The analysis focuses solely on the observable price action within the dataset, without incorporating any external context or information.
Weekly Performance Overview (Last 5 Trading Days ending 2025-10-10):
To begin, we establish the recent short-term performance for each asset. The cumulative percentage change for the most recent five trading days (2025-10-06 to 2025-10-10) indicates a notable bearish shift for both IBIT and ETHA.
| Symbol | Weekly Percent Change |
|---|---|
| IBIT | -5.14% |
| ETHA | -11.95% |
This matrix clearly indicates that both assets experienced a net decline over the past trading week, with ETHA exhibiting a significantly sharper downturn compared to IBIT. The prevalence of negative closing days towards the end of the week, culminating in substantial losses on 2025-10-10 for both symbols, suggests increasing bearish momentum in the immediate short term.
Detailed Weekly and Monthly Technical Analysis:
IBIT’s performance over the last week displays a pattern of volatile swings, with two positive days offset by three negative sessions, including a significant -3.69% drop on 2025-10-10. This recent price action indicates that short-term selling pressure has intensified, making a continuation of bearish sentiment likely in the very near term. However, when examining the broader 30-day period, IBIT registered an overall gain of approximately +4.61%. This suggests that despite the recent weekly correction, the underlying monthly trend for IBIT has been upward, characterized by periods of robust gains that have largely absorbed interim declines. The current weekly weakness could represent a technical retracement within this larger uptrend, or it could be a precursor to a more sustained reversal if selling pressure persists.
Conversely, ETHA’s last week was marked by even more pronounced volatility and a stronger downside bias, closing with a substantial -7.95% decline on 2025-10-10, following another significant loss of -5.28% earlier in the week. This aggressive selling pressure implies a high probability of continued short-term bearishness. Over the 30-day window, ETHA has experienced an overall decline of approximately -6.84%. This monthly performance, combined with the severe losses observed in the past week, strongly suggests a prevailing downward trend. The magnitude of recent daily percentage changes for ETHA, particularly the significant negative movements, indicates heightened volatility and a robust bearish momentum that is likely to challenge any potential upside attempts.
Comparative Analysis and Outlook:
Comparing the two assets, a divergence in their longer-term technical postures is evident despite their shared short-term weakness. IBIT’s positive monthly return, even amidst a challenging recent week, suggests that its technical structure maintains an overall “higher” trajectory, potentially positioning it for a recovery if the current selling pressure eases. Given the data, a resumption of the monthly uptrend for IBIT is roughly an even chance, contingent on its ability to find support and reverse the recent daily declines. An alternative scenario would see the recent weekly bearishness extend, potentially shifting the monthly trend to “mixed” if further significant losses occur.
ETHA, on the other hand, exhibits an overall “lower” trend both weekly and monthly. The amplified negative price action in the recent week reinforces the bearish outlook for this asset. It is highly likely that ETHA will face continued downward pressure in the immediate future, with the possibility of testing new lows within the observation period. While a technical bounce from potentially oversold conditions is always a possibility after sharp declines, the strength of the observed bearish momentum implies that such a bounce would be unlikely to instigate a sustained trend reversal without a significant shift in price action patterns not currently present in the provided data. Traders should note the elevated volatility in both instruments, which suggests increased risk in the prevailing market environment.
Magnificent 7 & Friends
Technical Market Commentary: October 10, 2025
As a Chartered Market Technician, my analysis of the provided daily percentage change data for the past 30 trading days reveals distinct patterns in both overall performance and market breadth across the ten observed symbols. Over the full monthly period, we observe that eight out of ten symbols registered net gains. We judge it is highly likely that the broader market sentiment reflected in this cohort exhibited a positive bias, with an overall gain of approximately +2.1% across all symbols. Conversely, during the most recent five trading days (representing the weekly period from October 6th to October 10th), eight out of the ten symbols closed lower. We assess it is highly likely that this recent period was dominated by negative price action, contributing to a collective decline of approximately -3.8% across the entire sample during this shorter timeframe. This divergence suggests a recent shift in momentum following a generally constructive monthly trend.
Examining market breadth provides further insight into underlying sentiment. Over the monthly period, we observed 158 instances of advancing symbols versus 142 instances of declining symbols across all trading days. While advances marginally outpaced declines, the distribution indicates a roughly even chance of a symbol advancing or declining on any given day, suggesting a mixed market sentiment with no clear directional bias dominating throughout the month. However, a significant change in breadth occurred in the most recent weekly period. During these five trading days, we observed only 14 instances of advancing symbols compared to 36 instances of declining symbols. We judge it is likely that negative market sentiment predominated during this week, suggesting widespread selling pressure and a potential weakening of the previously observed positive momentum.
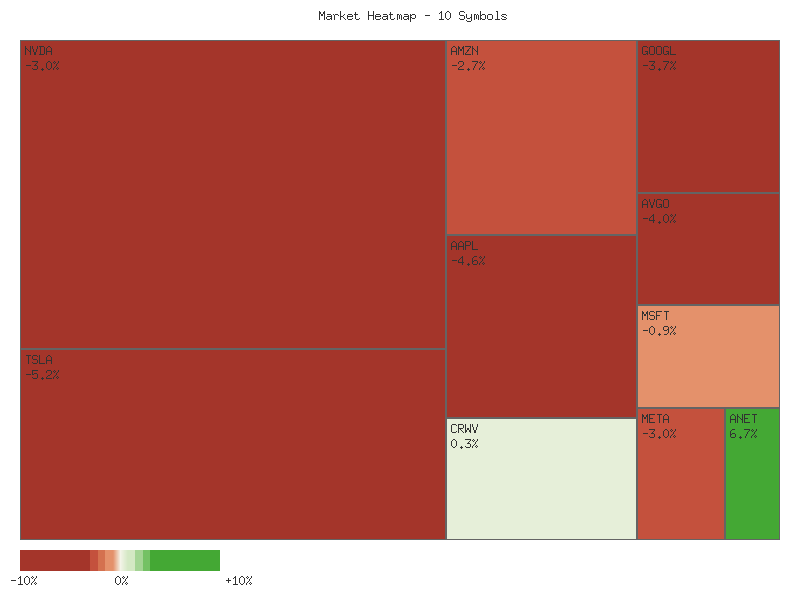
A closer look at individual symbol performance on the last trading day, October 10th, reinforces the recent bearish turn. All ten symbols experienced declines, ranging from a relatively contained -2.05% (GOOGL) to a sharper -5.91% (AVGO). This uniform negative performance on the final day, particularly pronounced in names like AVGO, TSLA, AMZN, and NVDA, is consistent with the broader shift in weekly market breadth towards declines. While individual symbols like CRWV and ANET still registered positive overall gains for the week despite their Friday declines, the widespread nature of the selling on the last day suggests that the negative sentiment was broad-based, rather than isolated to a few specific names.
Given the substantial shift in market breadth and the uniformly negative performance on the last trading day, we judge it is likely that the short-term technical outlook for this cohort of symbols is deteriorating. While the monthly aggregate performance remains positive for the majority of symbols, the recent weekly data, culminating in Friday’s declines, presents a compelling picture of increasing bearish pressure. An alternative scenario, though unlikely without further data suggesting a swift reversal, is that this recent downturn represents a temporary consolidation within a larger upward trend. However, current technical indicators suggest caution, and market participants would be prudent to monitor for signs of stabilization or renewed buying interest before anticipating a resumption of the monthly bullish bias.
Technical Market Commentary: October 2nd - October 10th, 2025
The market data spanning October 2nd to October 10th, 2025, reveals a prevailing bearish sentiment culminating in significant downside pressure across a majority of the analyzed instruments on the final trading day. A consistent theme emerging from the 7-day candlestick data is a widespread decline on October 10th, often accompanied by notably elevated trading volumes. This synchronized bearish activity across multiple bellwether stocks and other assets likely indicates a short-term shift in market dynamics towards selling pressure, suggesting a broad weakening of buying conviction or substantial profit-taking activity. The high volume accompanying these declines adds weight to the validity of these price movements, making a continuation of this short-term bearish bias a likely scenario.
Several instruments exhibited clear bearish patterns throughout the 7-day period, or displayed a decisive reversal on the last day. AAPL, after fluctuating mid-week, experienced a sharp decline on October 10th, closing significantly lower with the highest volume of the observed period, which likely signals a continuation of downward momentum. GOOGL and AMZN both demonstrated consistent bearish trajectories, closing at or near their 7-day lows on October 10th with increased trading activity, a pattern that likely implies further downward pressure. TSLA displayed an overall bearish bias, culminating in a substantial decline on October 10th with high volume, closing near its period low, making further downside likely. MSFT, after a brief mid-week rally, registered lower highs and lows, concluding with a notable bearish candle on October 10th on increased volume, which likely projects downward continuation in the very short term.
Other instruments initially showed signs of bullish momentum but faced strong reversals. NVDA, for instance, saw robust gains on October 8th and 9th, only to be met by a decisive bearish reversal on October 10th. This was characterized by a large red candle on significantly higher volume, almost fully retracing the previous two days’ advances. This pattern likely signals a shift in control to sellers, diminishing the probability of immediate upward continuation. AVGO presented a similar scenario; a strong bullish move on October 8th was decisively reversed on October 10th with a large bearish candle on high volume, effectively engulfing the prior day’s gain, which likely invalidates its immediate bullish momentum. META, after a mid-week recovery, experienced a substantial decline on October 10th with elevated volume, suggesting an exhaustion of buying interest and presenting a roughly even chance of either further decline or short-term consolidation.
CRWV and ANET also experienced significant price action. CRWV, while exhibiting notable volatility, saw a strong upward move on October 8th and 9th, followed by a large bearish candle on October 10th with its highest volume. This move likely represents substantial profit-taking or a bearish reversal. ANET, which enjoyed a strong bullish trend from October 6th to 9th, encountered a bearish reversal on October 10th, closing below its open on high volume. While a short-term pullback is likely, the prior robust bullish structure suggests a roughly even chance of either a sustained reversal or a period of consolidation before a potential retest of higher levels, should buying interest return. Overall, the collective technical signals suggest that a continuation of short-term bearish pressure is likely for most of these stocks.
S&P 500 Sector Breadth
CMT Sector Analysis: October 10, 2025
The market data covering the past 30 trading days, specifically analyzing daily percentage changes across eleven S&P 500 sectors (XLP, XLRE, XLI, XLU, XLV, XLY, XLF, XLB, XLE, XLC, XLK), indicates a recent shift towards a defensive posture, particularly in the most immediate trading week. For our analysis, “weekly” refers to the sum of the last five trading days, and “monthly” encompasses the sum of the last twenty trading days. On a weekly basis, the market exhibited a predominantly lower trend, with only two sectors, XLU (Utilities) and XLP (Consumer Staples), showing positive performance. This results in a highly negative market breadth for the week, with 9 of the 11 observed sectors declining. Over the monthly horizon, the picture is marginally less severe but still bearish, with three sectors advancing (XLU, XLV, XLK) against eight declining, suggesting that broader market momentum remains negative.
Examining sector performance more closely for the recent week, two defensive sectors, XLU (+1.45%) and XLP (+0.10%), posted gains. Conversely, all six explicitly categorized offensive sectors (XLK, XLI, XLF, XLB, XLY, XLE) experienced declines. XLC, which is generally considered offensive, also saw a notable decline. Among the defensive group, XLRE (Real Estate) and XLV (Health Care) recorded losses. This pattern strongly suggests a defensive rotation; capital is likely flowing into traditional safe-haven sectors such as Utilities and Consumer Staples. The significant declines in offensive sectors, notably XLE (-4.18%), XLY (-3.85%), and XLB (-3.37%), indicate an increased aversion to risk and could be indicative of investor concerns about economic growth prospects or broader market stability. The immediate sentiment is therefore likely cautious to bearish.
Looking at the monthly performance, a slightly more nuanced picture emerges, yet a defensive preference persists. While XLU (+8.89%) and XLV (+4.00%), both defensive sectors, recorded substantial gains, XLK (+3.32%) stands out as the sole advancing offensive sector. This could imply some resilience in the technology space over the longer period, or perhaps a tactical allocation by some market participants. However, the majority of offensive sectors, including XLY (-6.22%), XLE (-5.08%), XLB (-4.20%), XLF (-1.41%), and XLI (-1.01%), have closed the monthly period in negative territory. The overall monthly breadth remains bearish, with 8 of 11 sectors declining. The sustained strength in defensive sectors such as Utilities and Healthcare, even with a tech sector rally, indicates that a significant portion of the market remains risk-averse.
Based on the cumulative daily percentage changes, the overall market sentiment appears predominantly defensive. The overwhelming majority of declining sectors in the recent week, coupled with the outperformance of defensive sectors, points to investors seeking safety. While the monthly data shows some mixed signals with Technology (XLK) advancing, the broad weakness across other offensive sectors overshadows this individual strength. It is highly probable that market participants are adopting a cautious stance, favoring sectors perceived as less sensitive to economic fluctuations. Persistent underperformance in key cyclical sectors like Energy and Consumer Discretionary on both weekly and monthly bases suggests that the current market environment is unlikely to support broad-based risk-on rallies in the near term.
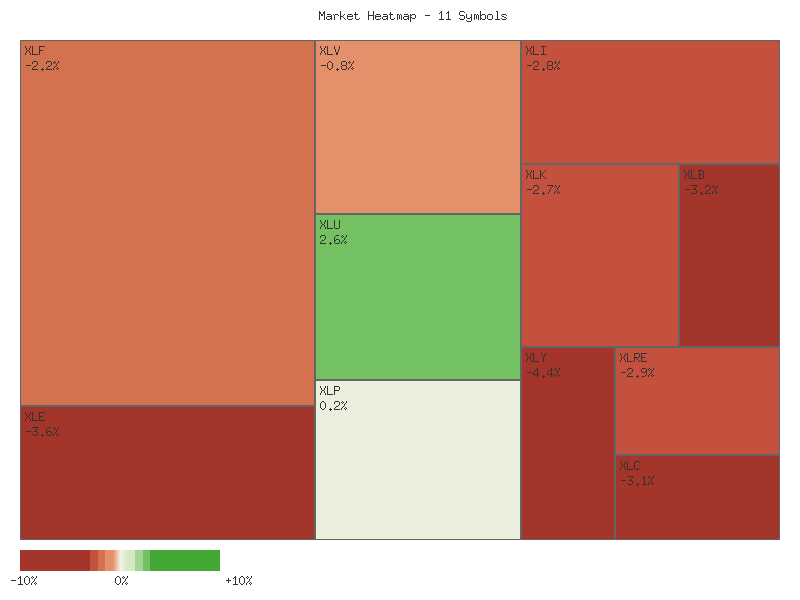
Below is a matrix summarizing the weekly percentage change for each symbol, sorted in descending order:
| Symbol | Weekly Percent Change |
|---|---|
| XLU | 1.45% |
| XLP | 0.10% |
| XLV | -1.88% |
| XLK | -2.19% |
| XLI | -2.92% |
| XLF | -2.92% |
| XLC | -3.11% |
| XLRE | -3.37% |
| XLB | -3.37% |
| XLY | -3.85% |
| XLE | -4.18% |
Market Commentary: Sector ETF Technical Analysis (October 2-10, 2025)
A comprehensive review of the provided 7-day candlestick data for key SPDR sector ETFs reveals a broad-based shift towards bearish momentum, particularly evident on the final trading day, October 10th. The price action across most sectors indicates significant selling pressure, often confirmed by notably increased volume, suggesting a potential continuation of these trends in the immediate future.
Several sectors present very strong bearish technical patterns. XLF (Financials), XLE (Energy), XLC (Communication Services), XLK (Technology), XLI (Industrials), XLY (Consumer Discretionary), and XLB (Materials) all exhibited large bearish candles on October 10th. These candles frequently closed at or near their daily lows and were accompanied by exceptionally high volume compared to their prior 6-day averages. This confluence of decisive price action and elevated volume highly likely signals a significant shift in market sentiment towards bearishness for these sectors, indicating they are prone to further declines. XLRE (Real Estate) also displays a consistent downtrend throughout the entire 7-day period, culminating in an increased volume drop on the most recent day, making further downside highly likely.
Emerging bearish signals are also discernible in XLU (Utilities) and XLV (Health Care). XLU, after an initial multi-day uptrend, experienced a sharp reversal in the last two trading days, with increasing volume accompanying the final day’s decline. This pattern suggests that a short-term top has been established, making it likely to experience further downside pressure. Similarly, XLV, following an initial rally and subsequent period of consolidation, broke down on October 10th with a prominent bearish candle on increased volume. This breakdown from its recent trading range renders continued bearish movement likely.
In contrast, XLP (Consumer Staples) exhibited a relatively tight trading range for most of the observed period. On the final day, it opened higher and made an attempt to establish a new 7-day high on significantly increased volume. However, it failed to sustain these gains, ultimately closing near the middle of its daily range. While the elevated volume indicates heightened activity, the inability to close strongly suggests supply met demand at higher levels, preventing a decisive breakout. Given this mixed signal, there is a roughly even chance of continued sideways movement or a slight pullback as the market processes the attempted rally. A sustained break above the 78.77 high would be necessary for bullish confirmation, while a move below the 77.69 low would indicate bearish resumption.
PPO Market Model
As a Chartered Market Technician with over 15 years of experience, I’ve analyzed the provided PPO (Percentage Price Oscillator) data for the SPX across three distinct timeframes over the past 30 days. This rigorous technical examination reveals a significant and synchronized shift in market momentum that warrants close attention. While earlier periods exhibited varying degrees of bullish inclination, the most recent data points, particularly the final trading day, indicate a broad-based loss of upward conviction across all horizons.
The Short Term PPO indicator (PPO_1_5_DAY) demonstrated considerable volatility throughout the observed period. After initiating with negative values, it swiftly transitioned into positive territory, reaching an apex around 0.81 in mid-September before retreating towards the zero line. A subsequent rally saw it regain strength, briefly peaking again around 0.51, only to experience a pronounced and precipitous decline on the final day, plummeting deeply negative to -1.76. This abrupt bearish acceleration indicates an extreme loss of short-term buying pressure. Based on this highly significant recent movement, it is likely that short-term price action will remain under considerable downward pressure in the immediate future, with a very high probability of continuation, barring a swift and substantial reversal. An alternative scenario, where this plunge represents an exhaustion low leading to an immediate bounce, is unlikely without further corroborating price action from the subsequent trading period.
Concurrently, the Medium Term PPO (PPO_13_21_DAY) maintained a consistently positive trajectory throughout much of the 30-day analysis. Oscillating between approximately 0.35 and 0.63, this sustained positive value indicated a healthy, albeit gradually maturing, medium-term bullish momentum. The indicator achieved its peak momentum around mid-September, subsequently consolidating in the 0.50-0.60 range. However, the last recorded data point shows a notable drop from 0.54 to 0.38. While remaining above the zero line, this substantial reduction in positive momentum suggests a material shift in underlying dynamics. It is likely that this decline reflects a weakening of the medium-term trend, increasing the probability of further deceleration or a potential cross below the zero line if momentum erosion persists. There is a roughly even chance that this merely represents a temporary pause before resuming its prior upward drift, or that it signals the initial phase of a more pronounced downtrend.
Finally, the Long Term PPO (PPO_21_34_DAY) consistently registered strong positive values, primarily ranging between 0.70 and 0.88, throughout the 30-day window. This robust and persistent positivity underscored a dominant long-term uptrend for the SPX, suggesting underlying structural strength despite any shorter-term fluctuations. The indicator reached its highest point around late September, followed by a period of consolidation at elevated levels. Similar to its shorter-duration counterparts, the final data point showed a significant pull-back from 0.86 to 0.76. While this constitutes a notable decline, the indicator remains firmly positive, significantly above the zero line. It is unlikely that this single data point immediately negates the established long-term bullish trend. However, the synchronized downward movement across all three PPO timeframes is a critical observation. This convergence of declining momentum across all horizons—Short Term, Medium Term, and Long Term—points to a synchronized loss of buying conviction. This confluence of bearish signals makes a near-term continuation of downward pressure likely, potentially challenging the established positive momentum across all timeframes. Traders should observe whether these indicators attempt to stabilize or rebound, or if the downward acceleration persists, confirming a more systemic shift in sentiment.
Here is a summary of the recent trend for each indicator:
| Indicator | Recent Trend |
|---|---|
| Short Term | Down |
| Medium Term | Down |
| Long Term | Down |
Equity Breadth
As a Chartered Market Technician with over 15 years of experience, I’ve analyzed the provided market data for the S&P 500 (SPX) focusing on breadth indicators and the 20-day Exponential Moving Average (EMA). The S&P 500’s 20-day Exponential Moving Average (EMA_20_DAY:SPX:90days) has exhibited a remarkably consistent and strong uptrend over the observed 90-day period, commencing from approximately 5848 in early June 2025 and reaching highs near 6663 by early October 2025. This sustained ascent strongly indicates a bullish primary trend for the S&P 500 index itself during this timeframe. However, a deeper examination of market breadth, particularly the percentages of constituents trading above their key moving averages, reveals a potential softening in the underlying health of this trend, which has become particularly pronounced in the most recent trading days.
Analysis of the SPXA50R:SPX:30days data, representing the percentage of S&P 500 members above their 50-day moving average, shows a concerning deterioration. From a high of approximately 66.87% in late August, the indicator experienced a general decline, albeit with some oscillatory rebounds. On a weekly basis, the trend has largely been downwards since early September, punctuated by a significant drop from 57.68% on October 6th to a stark 33.73% on October 10th. This sharp contraction suggests that a substantial number of S&P 500 components have recently fallen below their short-to-medium term uptrends. Such a rapid and considerable reduction in participation is likely to exert downward pressure on the broader index, implying a diminishing internal momentum supporting the overarching uptrend.
Similarly, the SPXA200R:SPX:30days indicator, tracking the percentage of members above their 200-day moving average, also reflects weakening breadth, though less dramatically than the 50-day metric. Beginning around 67.66% in late August, this indicator showed a gradual decrease through September, occasionally dipping below 60% before recovering. On a weekly view, while there were periods of stability or slight recovery, the overall trajectory has been gently downward. Critically, the indicator experienced a notable decline from 61.88% on October 6th to 50.30% on October 10th. While still indicating that roughly half of the S&P 500 components maintain long-term uptrends, this represents a material loss of conviction and long-term participation compared to the levels seen just a few weeks prior.
The pronounced, recent deterioration in both the 50-day and 200-day breadth indicators presents a clear technical divergence from the previously robust, upward-trending EMA_20_DAY of the S&P 500. While the EMA_20_DAY itself remained in a strong uptrend for the duration of the 90-day window, the final data point on October 10th shows a modest decline to 6652.58, marking the first observed daily pullback within the recent 30-day segment. This specific timing, coinciding with the steepest drops in both SPXA50R and SPXA200R, is highly suggestive. Given the significant and rapid contraction in breadth, it is highly likely that the upward momentum of the EMA_20_DAY will decelerate in the immediate future, with a roughly even chance of a near-term reversal or at least a period of consolidation. While the longer-term bullish structure of the EMA_20_DAY remains intact based on the 90-day view, the recent breadth signals suggest the market is becoming increasingly top-heavy, with fewer stocks participating in the advance. An alternative scenario, though less likely given the magnitude of the breadth collapse, is that the index could find support and resume its ascent if leadership quickly re-emerges across a wider array of stocks, thus improving breadth. However, based purely on the provided data, a continued upward trajectory for the EMA without further breadth improvement seems unlikely.
SPX Monthly
SPX Technical Analysis: Q3 2025 Review and Near-Term Outlook
The SPX has exhibited a robust upward trajectory over the past three months, characterized by sustained price appreciation and strong trend confirmation from key moving averages. From early July through the beginning of October, the index consistently recorded higher highs and higher lows, climbing from approximately 6173 at the end of June to its recent peak near 6764 on October 9. This persistent advance placed the price action well above both the 50-day and 200-day Exponential Moving Averages (EMAs) for much of this period. The 50-day EMA has remained decisively above the 200-day EMA, with both lines demonstrating a clear upward slope, which is a classic technical signature of a strong long-term uptrend, often referred to as a “golden cross” configuration. The Relative Strength Index (RSI), a momentum oscillator, spent considerable time in overbought territory (>70) during July (peaking at 76.21 on July 25) and again in late September (74.75 on September 22), underscoring the powerful bullish momentum prevalent for much of the quarter.
Focusing on the most recent month, from early September to October 9, the SPX continued its ascent, pushing from around 6415 to a fresh high of 6764.58. This period saw the index maintain a position above its rising 50-day EMA, reinforcing the short-term bullish bias. However, the closing candle on October 10 presents a significant technical shift. The SPX experienced a sharp decline, closing at 6552.51 after opening at 6740.49, marking a notable bearish engulfing pattern following a period of strong gains. This single day’s action not only erased several days of gains but also saw the price close below the 50-day EMA (current value 6534.01) for the first time in an extended period. The RSI also plummeted from 66.12 on October 9 to 42.07 on October 10, indicating a substantial and abrupt loss of short-term buying momentum.
Key support and resistance zones have emerged from the provided data. The recent high of 6764.58 on October 9 now functions as a formidable immediate resistance level. Directly below the current price, the 50-day EMA, sitting at 6534.01, represents a critical support level following the October 10 close. A sustained breach below this level would likely signal further short-term weakness. Deeper support could be found around the lows of the early August consolidation period, specifically near the 6212-6238 range. The 200-day EMA, currently positioned at 6123.88 and still rising, offers a robust longer-term support floor. Conversely, should the SPX rebound, the 6700-6750 zone, which contains multiple recent closing highs, will likely act as interim resistance before challenging the ultimate peak.
Looking forward, several scenarios are plausible. A bullish case would entail the SPX quickly reclaiming the 50-day EMA and reversing the recent downward momentum, perhaps finding support near the 6500 psychological level or the 50-day EMA itself, followed by a renewed upward trajectory towards the 6764.58 resistance. This scenario would be supported by a rapid bounce in the RSI from its current neutral position back towards the 60-70 range. A bearish case holds a roughly even chance given the recent sharp reversal. A failure to hold the 50-day EMA as support, leading to a decisive break lower, would increase the probability of a test of the 6200-6300 area, potentially even the rising 200-day EMA. The RSI’s sharp decline suggests increasing selling pressure, making a further move towards oversold conditions below 30 a distinct possibility under this scenario. Finally, a neutral case suggests consolidation. If the SPX manages to stabilize around the current price levels, perhaps fluctuating between the 50-day EMA and the recent lows of the past few weeks (e.g., around 6450-6500), with the RSI remaining in the 40-60 range, it would indicate a period of indecision or re-accumulation before the next directional move.
From a technical perspective, the primary sentiment driver in the near future will be the market’s reaction to the breach of the 50-day EMA and the abrupt momentum shift indicated by the RSI. The severity of the recent price drop, following an extended period of strength, suggests a high probability of increased short-term investor uncertainty or a wave of profit-taking. Should the index fail to recover quickly above the 50-day EMA, it is likely to exacerbate bearish sentiment among short-term traders. Conversely, a swift recovery and stabilization above this key moving average could quickly re-ignite bullish conviction. The overall long-term trend, as indicated by the consistently rising 50-day and 200-day EMAs, still points to underlying bullish sentiment, but the immediate technical damage could temporarily shift this perception.
SPX Technical Analysis: Momentum Shift Imminent
The S&P 500 (SPX) has exhibited a generally upward trend over the past 90 days, characterized by a series of rallies interspersed with brief consolidations and minor pullbacks. Price action, as observed in the candlestick data, indicates a robust bullish phase, particularly from early June through early October, where the index consistently achieved new highs, most recently peaking around the 6750-6760 level on October 8th and 9th. However, a significant shift in market dynamics occurred on October 10th, marked by a substantial bearish candlestick. This single day saw the SPX open near recent highs but close dramatically lower at 6552.51, representing a sharp rejection of higher prices and indicating a pronounced increase in selling pressure. This development warrants close attention as it represents a potential inflection point for the index.
Analysis of short-term momentum indicators strongly supports a bearish shift. The 14-day Relative Strength Index (RSI) demonstrated a sharp decline on October 10th, plunging from 66.12 to 42.07. This move from a neutral-to-bullish zone into bearish territory (below 50) is a clear signal of increased selling momentum. Concurrently, the 1-day/5-day Percentage Price Oscillator (PPO) experienced a dramatic fall, registering its lowest reading in the entire 90-day data set at -1.768. This steep decline in the PPO, combined with its cross well below the zero line, underscores a powerful and immediate surge in bearish momentum. The confluence of these short-term signals makes a near-term bearish continuation highly likely.
While short-term indicators suggest an imminent bearish phase, medium and longer-term momentum, as reflected by the PPO_13_21_DAY and PPO_21_34_DAY, show a significant weakening but still remain in positive territory. On October 10th, the PPO_13_21_DAY dropped from 0.544 to 0.384, and the PPO_21_34_DAY declined from 0.863 to 0.760. These declines represent a substantial erosion of underlying bullish momentum across these broader timeframes. Although these indicators have not yet crossed below zero, which would signal a full reversal of their respective trends, the abruptness of the declines implies that the recent strong uptrend is under considerable duress.
Considering the sharp bearish price action and the significant deterioration in short-term and even intermediate-term momentum indicators on October 10th, a continued downward move for the SPX in the very short to short term is highly likely. The immediate support area would be around the previous lows seen in late September (~6600-6604), which were decisively broken, and then potentially back towards the August 21st low (~6370) or even the early August low (~6238) if selling pressure persists. An alternative scenario, where the market quickly finds support and stages a rebound, is unlikely in the immediate very short term, given the magnitude and breadth of the bearish signals on October 10th. However, should the longer-term PPO indicators (13/21 and 21/34 day) resist further significant declines and remain positive, it could suggest that the current bearish impulse is a deeper pullback within a broader upward trend rather than a complete trend reversal. Conversely, a sustained decline in these longer-term PPOs, particularly if they cross below zero, would materially increase the likelihood of a more prolonged and significant downtrend.