Daily Market Technical Analysis
Market Overview
The market experienced a pronounced bearish reversal on October 10th, with all major equity indices and most S&P 500 sectors declining on significantly increased volume. The VIX surged 31.83%, indicating heightened fear and expected volatility. Market breadth deteriorated rapidly, with the SPXA50R plummeting to 33.73% and SPXA200R nearing 50%. It is highly likely that the S&P 500 will face further downward pressure or protracted consolidation, as prior bullish momentum has been severely compromised. Energy and agricultural commodities also show a highly likely continuation of downtrends, while precious metals are likely to experience a short-term pause. Conversely, long-duration Treasury bonds saw broad-based strength, making a continuation of upward pressure likely. Overall, the technical evidence points to a probable downward bias for equities, with increased volatility persisting.
Market Indices
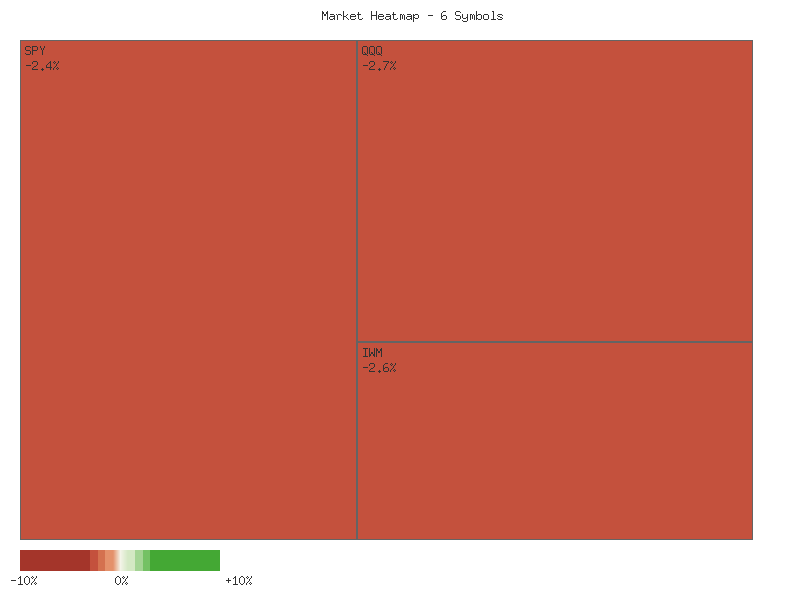
The market experienced a pronounced downward movement across major indices on 2025-10-10, as indicated by the daily percent change matrix below. All observed indices registered declines, contributing to a significant aggregate market depreciation. The sum of the daily percent changes for these six key symbols totals -17.948%, strongly suggesting a notably negative market session.
| Symbol | Daily Percent Change |
|---|---|
| SPX | -2.711% |
| MDY | -2.803% |
| OEF | -2.849% |
| IWM | -2.994% |
| IJR | -3.120% |
| QQQ | -3.471% |
Market breadth for the monitored symbols was unequivocally negative, with zero advancing symbols against six declining symbols. This indicates a broad-based and pervasive selling pressure across various market capitalization segments, from large-cap (SPX, OEF) to mid-cap (MDY) and small-cap (IWM, IJR), as well as growth-oriented tech (QQQ). The QQQ and IJR registered the most substantial declines, suggesting that growth and smaller-cap segments might be experiencing disproportionate selling intensity. This collective downward movement across all sampled symbols makes it highly likely that overall market sentiment was predominantly bearish on this particular day.
Concurrent with the broad market decline, the VIX experienced a significant surge. On 2025-10-09, the VIX posted a modest daily percent change of 0.7975%. However, on 2025-10-10, the VIX daily percent change escalated dramatically to 31.8320%. This substantial one-day increase is highly indicative of a sharp rise in expected market volatility and investor fear. Such a pronounced spike in the VIX often accompanies significant equity market sell-offs, as observed in the negative performance of the indices provided.
Reviewing the VIX candle data for the past seven days, the VIX closed at 21.66 on 2025-10-10. This closing value represents the highest level within the provided seven-day period, breaking out above previous resistance levels. The candle for 2025-10-10 shows an open of 16.36 and a close of 21.66, with a high of 22.44, forming a very large bullish candle. This strong upward momentum in VIX, particularly on such high volume (not provided but implied by the candle structure, though volume itself is zero in data), combined with the universal decline in equity indices, strongly suggests a period of elevated market uncertainty and risk aversion is likely to persist in the immediate term. While a sharp VIX spike could occasionally precede a short-term market bounce, the broadness of the equity declines in conjunction with this VIX activity makes that scenario less probable in the very near future. The current technical posture suggests the market is entering a phase characterized by heightened volatility and a heightened likelihood of continued downward pressure.
Fellow Traders,
The market data spanning October 9th and 10th, 2025, presents a uniformly bearish technical picture across all observed ETFs: SPY, QQQ, IWM, IJR, MDY, and OEF. On October 9th, most indices exhibited relatively contained price movements, with varied yet generally modest bearish closes. However, the trading session on October 10th marked a significant and decisive shift, characterized by substantial downside pressure across every analyzed instrument. This synchronized movement across large-cap (SPY, QQQ, OEF), mid-cap (MDY), and small-cap (IWM, IJR) segments suggests a broad-based deterioration in market sentiment. The probability of this being an isolated event affecting only specific market segments is low, given the pervasive selling pressure.
Focusing on October 10th, a robust bearish pattern emerged across the board. Each ETF formed a large red candlestick, with closing prices near their respective daily lows. This indicates that sellers maintained control throughout the entire session, driving prices downwards with clear conviction. Furthermore, the daily trading volume for all ETFs on October 10th was substantially higher—often more than doubling—compared to October 9th. This significant surge in volume accompanying the notable price decline is a crucial technical confirmation, reinforcing the strength of the selling pressure. For SPY, QQQ, IWM, MDY, and OEF, the October 10th candle’s real body largely engulfed the previous day’s body, forming clear bearish engulfing patterns, which are typically interpreted as strong reversal signals to the downside. IJR also showed a strong bearish continuation with increased volume.
The technical confluence of large bearish candles, closing prices at or near daily lows, and significantly increased volume points to a high probability of continued downside momentum in the immediate term. The uniformity of this pattern across diverse market capitalization segments further strengthens the bearish signal; it is highly likely that this broad weakness reflects a systemic shift rather than idiosyncratic asset-specific issues. While a short-term relief bounce is always a possibility in any downtrend, the current technical setup makes an immediate, sustained reversal appear unlikely. A roughly even chance exists for some initial attempts at consolidation; however, any such rallies are likely to be met with renewed selling pressure given the strong close and confirmed volume.
Given the current technical posture, traders should anticipate that the selling pressure observed on October 10th is likely to persist into the subsequent trading sessions. The market has demonstrated a clear preference for lower prices, with buyers largely absent or overwhelmed by sellers. The absence of strong lower wicks on any of the October 10th candles suggests minimal buying interest emerged to defend prices at lower levels before the close. Therefore, the probability of further price erosion is elevated. Without any counterbalancing technical indicators or patterns visible in this two-day data, the path of least resistance for these ETFs appears to be to the downside.
SPX Technical Analysis: Momentum Reversal After Extended Rally
The SPX has demonstrated a robust upward trend over the past 90 trading days, marked by consistent higher highs and higher lows, painting a clear picture of a primary bullish market. From early June, the index climbed steadily from approximately 5970 to above 6280 by early July, indicating strong buying conviction. A notable, albeit brief, correction occurred in late July, seeing the index retreat from around 6400 to below 6240 by early August. However, the SPX swiftly recovered, resuming its ascent to establish new all-time highs above 6750 by early October. This prevailing bullish structure underwent a significant challenge on October 10th, 2025, with a sharp one-day decline from an open of 6740.49 to close at 6552.51. This substantial drop decisively breached several recent short-term support levels, marking it as the most significant single-day percentage pullback in the latter half of the observed period.
The 14-day Relative Strength Index (RSI) largely reflected the price action, frequently registering overbought (above 70) during strong advances, peaking at 75.57 in early July. This indicated intense, if potentially unsustainable, buying enthusiasm. The early August correction saw RSI drop significantly to 47.80, effectively normalizing momentum. Subsequent rallies saw RSI again approach or briefly exceed 70 in late September (74.75) and early October (71.60). Critically, on October 10th, the RSI plummeted from 66.12 to 42.07. This dramatic single-day descent from the upper half of the oscillator range strongly indicates an abrupt and significant loss of buying power, signaling that the prior bullish momentum has been severely compromised.
Similarly, the Percentage Price Oscillator (PPO) (13, 21-day) confirmed bullish momentum through June and early July, with positive and rising values peaking near 0.94. The late July to early August price drop briefly turned the PPO negative (reaching 0.422 by August 5th), indicating a temporary bearish shift in intermediate-term momentum. The PPO then recovered, sustaining positive readings and reaching highs around 0.635 in late September and 0.568 in early October. Notably, these recent PPO peaks were, however, lower than earlier highs, which could suggest a subtle deceleration in the overall bullish impulse despite new price highs. On October 10th, the PPO underwent a substantial single-day decline from 0.544 to 0.384. While remaining positive, this abrupt drop points to a rapid erosion of short-term bullish momentum, making an imminent bearish crossover with its signal line (not provided) highly likely.
Synthesizing these technical indicators, the immediate outlook for the SPX warrants heightened caution. The dramatic price reversal on October 10th, combined with the sharp, decisive drops in both the RSI and PPO, strongly suggests a significant shift in market sentiment and underlying momentum. It is highly likely that the SPX will experience further downward pressure or enter a period of protracted consolidation in the immediate future. Key previous price lows around 6400 (from early September) and 6200 (from early August) represent potential support zones that could be tested. However, the magnitude of the recent momentum indicator collapse indicates that these levels may not hold as reliably. An alternative scenario, currently assessed as less likely given the severity of the technical breakdown, posits that this decline is merely a temporary shake-out preceding a quick resumption of the prior uptrend. Should the market swiftly recover and establish closes above the 6650-6700 range, this alternative would gain credibility. Nevertheless, based solely on the provided data, market participants should anticipate increased volatility and a probable downward bias.
CMT Market Commentary: QQQ Technical Analysis (90-Day)
The technical landscape for QQQ has undergone a significant shift, challenging a predominantly bullish trend observed over the past three months. From early June through early October, QQQ exhibited a clear uptrend, marked by a series of higher highs and higher lows, moving from approximately to reach an all-time high of .75 on October 8th. This ascent was generally supported by healthy volume, although some of the later price advances were accompanied by decelerating momentum signals, as we will explore. The most critical development is the sharp reversal seen on October 10th, which registered a substantial single-day price decline from .70 to .50, a drop of over 3.4%. This movement occurred on exceptionally high volume of 94.41 million shares, significantly exceeding the average daily volume and signaling strong conviction behind the selling pressure. This confluence of factors makes a continuation of the prior uninterrupted rally unlikely in the immediate term.
Examining the Relative Strength Index (RSI) over the 14-day period reveals several key insights. Throughout June and July, QQQ’s RSI frequently entered overbought territory (above 70), indicating strong buying interest but also setting the stage for minor pullbacks. For instance, the RSI peaked at 72.40 on June 30th and again at 73.11 on July 28th, correlating with robust price appreciation. In the period leading up to the recent peak, QQQ’s RSI reached 75.35 on September 22nd, suggesting strong bullish momentum. However, as QQQ made new price highs in early October, the RSI readings on October 8th (70.47) and October 9th (69.27) were elevated but notably did not exceed the September 22nd peak, forming a potential bearish divergence where price advanced but momentum did not confirm with a corresponding new high. The sharp decline on October 10th saw the RSI plummet to 45.42, rapidly exiting overbought conditions and firmly entering neutral territory, underscoring the severity of the bearish impulse.
The Percentage Price Oscillator (PPO) provides further corroboration of the changing momentum. For most of the 90-day period, the PPO remained positive, affirming the underlying bullish trend. The PPO reached a notable peak around 0.80 on September 22nd. While QQQ’s price continued to climb to new highs into October, the PPO, after a brief dip, recovered to 0.76 on October 9th but did not surpass its September 22nd high. This pattern of higher price highs not being confirmed by higher PPO highs can be interpreted as another form of bearish divergence, suggesting that the rate of price appreciation was slowing relative to its moving averages. The precipitous drop on October 10th caused the PPO to sharply decline to 0.58, indicating a significant loss of positive momentum, even though it remains above the zero line. This suggests that while the long-term trend isn’t immediately negative, the short-term bullish acceleration has been severely curtailed.
Given the substantial price decline on October 10th, accompanied by exceptional volume, and the corresponding sharp deterioration in both the RSI and PPO from potentially divergent highs, a period of increased volatility and likely further downside price exploration is anticipated. The high volume confirms that this was not merely a passive pullback but an active selling event. It is highly likely that previous support levels, which are not explicitly identified in this data set but would correspond to prior consolidation zones, will be tested. While a bounce-back from a single-day event is always a possibility, the technical evidence strongly suggests that the previous strong bullish momentum has been decisively broken. Therefore, the probability of QQQ continuing its upward trajectory without further consolidation or a deeper correction appears low, with a roughly even chance of price stabilization or further decline in the near term as market participants assess the new momentum profile.
As a Chartered Market Technician with over 15 years of experience, I offer the following technical analysis of IWM based exclusively on the provided 90-day price, 14-day Relative Strength Index (RSI), and 13-21 day Percentage Price Oscillator (PPO) data.
The provided 90-day technical data for IWM reveals a predominant uptrend, characterized by a series of higher highs and higher lows from early June through mid-September. Price advanced consistently, rising from approximately 208.44 in early June to establish new highs, most recently touching 246.81 on October 6. This upward momentum was supported by generally rising volume during significant advances. Both the 14-day Relative Strength Index (RSI) and the 13-21 day Percentage Price Oscillator (PPO) largely confirmed this bullish trajectory, consistently residing in positive territory and demonstrating strength, with occasional brief dips below their respective neutral thresholds being quickly overcome. This robust trend, however, appears to have shifted notably in the most recent trading sessions.
On October 10, IWM experienced a significant bearish reversal, closing at 237.79 after opening at 245.75, representing a substantial single-day decline from recent price levels. The volume accompanying this sharp drop was exceptionally high, at 69.67 million shares, marking one of the highest volume days in the entire 90-day period. Such a sharp price depreciation on elevated volume is a strong technical signal, indicating significant selling pressure has aggressively entered the market. This candlestick pattern, a large red body with a close near the low of the day, is likely to be perceived as a powerful bearish signal following several days of consolidation or minor gains. This intense selling pressure suggests that a near-term continuation of downward price movement is probable.
The 14-day RSI, which had been fluctuating robustly between approximately 60 and 68 from late September to early October, plunged to 44.97 on October 10. While this value is not yet in oversold territory (typically below 30), the speed and magnitude of this decline from a distinctly bullish range into neutral territory indicate a rapid erosion of buying momentum. Concurrently, the 13-21 day PPO, which measures the percentage difference between two exponential moving averages, also registered a sharp drop from 0.689 on October 9 to 0.500 on October 10. Although the PPO value remains above its zero line (suggesting the longer-term trend, represented by the 21-day EMA, is still generally above the 13-day EMA), the accelerating descent of the PPO line strongly implies that bearish momentum is rapidly increasing. It is probable that the PPO will soon cross below its signal line (a common bearish trigger), and a subsequent cross below the zero line would serve as a further negative confirmation of a significant shift in momentum.
Given the confluence of the strong bearish price action on exceptionally high volume, the rapid deterioration of RSI into neutral territory, and the accelerating downward momentum indicated by the PPO, it is likely that IWM will experience continued downward pressure in the very near term. The previous established resistance around 237-238, which had intermittently acted as support during recent consolidation phases, has been decisively broken, suggesting a probable test of lower support levels. A primary alternative scenario would involve a swift rebound, potentially fueled by buyers perceiving the current levels as a strong discount, which would be indicated by a quick recovery of the 237-238 level on above-average volume. However, based on the current weight of technical evidence, this outcome appears less likely. Without additional historical data beyond the current 90-day window, specific precise price targets for further decline cannot be rigorously identified, but traders should watch for potential retests of prior significant support zones identified earlier in the provided dataset, possibly in the 220-225 range where the PPO previously dipped significantly before reversing course.
Tech Sector Analysis
The 30-day relative performance ratio of QQQ to SPY indicates an upward trend, suggesting consistent outperformance of the technology-heavy NASDAQ-100 over the broader S&P 500 during this period. The trend, however, is characterized as “weak,” despite a notable 2.09% increase in the ratio from its low of 0.8834 to the current 0.9027. The current ratio resides within the upper quartile of its 30-day range, specifically at the 0.729 relative position. This suggests that while the overall trajectory has favored QQQ, the underlying momentum may not be robust. The volatility, while higher than the 14-day period, remains low at 0.000052, implying a relatively smooth ascent without significant daily fluctuations, although the most recent data point represents a notable decline from the 30-day high. This extended period of relative strength for QQQ makes continued outperformance likely, assuming the broader trend remains intact.
A more granular examination of the 14-day ratio reveals a “sideways” trend with “weak” strength. This shorter-term observation indicates that the QQQ’s relative outperformance observed over the 30-day window has stabilized, or potentially reversed course, in the immediate past. The current ratio of 0.9027 is positioned in the lower quartile of its 14-day range, at 0.237 relative position, and is below the 14-day average ratio of 0.9034. Notably, the ratio experienced a peak of 0.9099 on 2025-10-09, followed by a substantial decline to the current level of 0.9027 on 2025-10-10. This sharp reversal from the high indicates that recent trading sessions have seen QQQ’s relative strength diminish significantly against SPY. The weak sideways trend, coupled with the sharp drop from the high, makes a continuation of outperformance by QQQ over the very short term (next few days) unlikely.
Synthesizing both timeframes, the overall market context, as shown by the 30-day data, still favors technology outperformance, albeit with weak underlying momentum. However, the recent 14-day data, particularly the sharp 0.79% drop from the peak on October 9th to October 10th, presents a strong short-term bearish divergence. This recent price action implies a cessation of the relative strength QQQ had been exhibiting. Consequently, a continuation of QQQ outperformance against SPY over the next several trading sessions (1-5 days) is unlikely, given the negative short-term momentum and the current ratio’s position relative to its recent high. There is a roughly even chance that the ratio will continue its sideways movement around the current levels, consolidating the gains from the broader 30-day uptrend, or that it might experience further minor erosion.
Conversely, the persistent, albeit weak, upward trend over the 30-day period suggests that any short-term underperformance or consolidation could be temporary. Should the ratio find support near its 14-day low of 0.9005 or the lower bound of its recent sideways channel, a resumption of the broader outperformance trend would become likely. A decisive break above the 14-day average of 0.9034 would indicate renewed relative strength and make continued outperformance by QQQ more likely. However, a significant break below the 30-day average of 0.8975 would constitute strong evidence of a shift towards SPY outperformance, making QQQ underperformance very likely. For the immediate term, the balance of evidence from the recent data favors a period of QQQ relative underperformance or consolidation.
Technical Analysis: QQQ/SPY Ratio (90-Day)
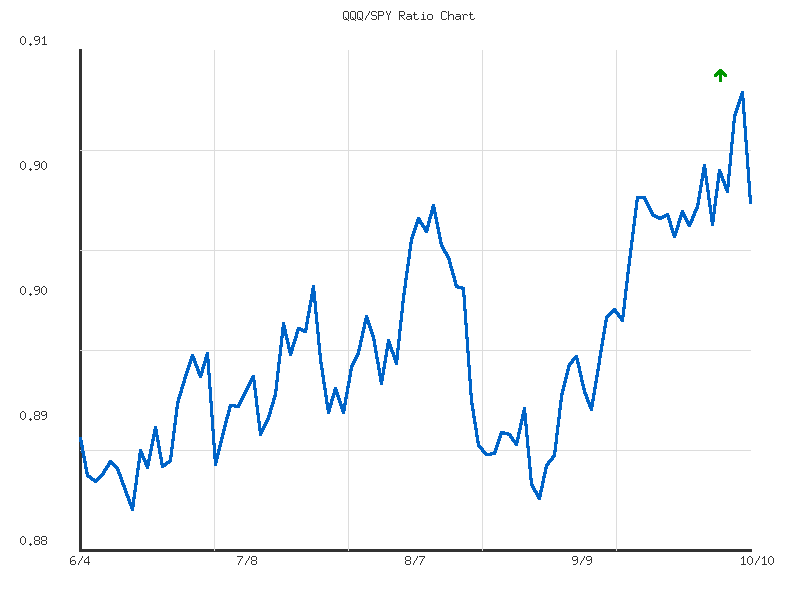
Analysis of the provided 90-day QQQ/SPY ratio data indicates a prevailing upward trend, albeit with characterized by weak underlying strength. Over the period from early June to mid-October 2025, the ratio has advanced approximately 1.74%, moving from an initial value around 0.8873 to its recent close at 0.9027. This upward trajectory suggests a period where the Nasdaq 100-tracking QQQ has generally outperformed the broader S&P 500-tracking SPY. The ratio’s current position at approximately 73.6% of its 90-day range further supports the observation that QQQ’s relative performance is closer to its recent highs than its lows within this timeframe. Despite the identified upward direction, the “weak” strength assessment within the trend data might imply that this relative outperformance has been gradual or marked by frequent pullbacks, rather than a steep, sustained ascent.
Observing the progression of the ratio, the initial period in June showed the ratio trading within a relatively tight range, broadly between 0.8826 (June 13) and 0.8880 (June 18), establishing what might be considered an initial base or support zone. A more noticeable upward acceleration commenced from late June, with the ratio climbing towards the 0.8900-0.8950 region by mid-July, then experiencing another leg up into the 0.9000-0.9020 area by early August. The ratio then encountered what appears to be an intermediate resistance level around 0.9025 to 0.9050 on multiple occasions throughout August and September, suggesting a period of consolidation where further relative outperformance for QQQ was challenged. This pattern of intermittent rallies followed by periods of consolidation or shallow pullbacks is consistent with the “weak” trend strength assessment.
The recent data points, specifically from late September into October, indicate a renewed push to higher levels. The ratio surpassed previous resistance attempts, achieving a period high of 0.9099 on October 9. This breakout above the prior consolidation resistance zones would typically be interpreted as a bullish development for QQQ’s relative strength. However, the subsequent trading day, October 10, saw a notable pullback, with the ratio declining to 0.9027. This single-day reversal from the period high is likely to invite caution. While the immediate trend remains upward as of the last data point, the sharp decline from the peak suggests that the 0.9099 level could present significant resistance if the ratio attempts to advance further in the very near term. It is plausible that the ratio might now test prior resistance levels, such as the 0.9000-0.9020 area, which could potentially act as new support.
Considering alternative scenarios, there is a roughly even chance that the ratio could attempt to retest the recent high of 0.9099 if buying interest in QQQ relative to SPY resumes quickly. A sustained break above this level would likely signal continued, albeit weak, relative outperformance for QQQ. Conversely, if the current pullback extends, the ratio might decline towards the 0.9000-0.9005 zone. A decisive breach below this region, particularly if accompanied by a strong move down, could indicate a more significant shift in relative strength, making it unlikely for QQQ to outperform SPY in the immediate future and potentially targeting the lower support levels observed in August around 0.8970 or even 0.8900. The volatility appears to be low on average, suggesting that any shifts, while significant for relative performance, might unfold without extreme daily swings.
IWM vs. SPY
Technical analysis of the IWM/SPY ratio across both the 14-day and 30-day periods reveals a consistent sideways trend with weak strength, indicating a period of equilibrium in relative performance between the Russell 2000 and the S&P 500. For the 14-day timeframe, the ratio experienced a minor net decline of approximately 0.96%, closing at 0.3641. This final ratio rests near the lower end of its recent range (relative position 0.28), falling below the average ratio of 0.3651 for the period. The weak sideways trend, coupled with the current ratio being below average and closer to its 14-day low, suggests a slight drift towards IWM underperformance during this short-term horizon. The observed volatility for this period is notably low, pointing to a lack of decisive momentum in either direction.
Extending the view to the 30-day period, the IWM/SPY ratio similarly exhibits a sideways trend with weak strength, albeit with an even smaller net change of approximately -0.12%. The current ratio of 0.3641 is also below the 30-day average of 0.3648 and resides closer to the lower boundary of its broader range (relative position 0.35). This consistent positioning, marginally below respective period averages and nearer the lows, suggests that while the overall trend is sideways, the bias leans towards marginal underperformance of IWM relative to SPY. The slightly higher, but still very low, volatility for the 30-day period compared to the 14-day period is typical for longer data sets and does not contradict the prevailing sideways character.
Given the explicit technical classification of a “sideways” trend with “weak” strength across both timeframes, it is roughly an even chance that the current pattern of IWM performing largely in line with SPY, but with a slight negative bias, will persist in the immediate future. The consistently low volatility in both data sets implies that a significant breakout or breakdown in relative performance is unlikely in the very near term without a material shift in underlying dynamics. The current ratio’s position below the averages and closer to the lows of both recent ranges provides a slight inclination towards continued relative weakness for IWM.
Considering alternative scenarios, there is a low probability that IWM will initiate a period of significant outperformance against SPY, given the weak trend strength and the ratio’s current relative positioning within its recent ranges. Conversely, a sharp increase in IWM’s underperformance is also unlikely to materialize quickly, as the market data does not indicate strong downward momentum, but rather a contained, consolidating phase. Therefore, market participants should anticipate a continuation of range-bound relative performance, with a slight possibility for further gradual erosion in IWM’s relative strength if the ratio breaks below the recent lows of 0.3627 (14-day) and 0.3610 (30-day). However, such a break is not strongly indicated by the current weak sideways trend.
As a seasoned Chartered Market Technician with over 15 years of experience, my analysis of the provided IWM/SPY ratio data for the 90-day period ending October 10th, 2025, focuses strictly on the technical patterns and quantitative metrics presented.
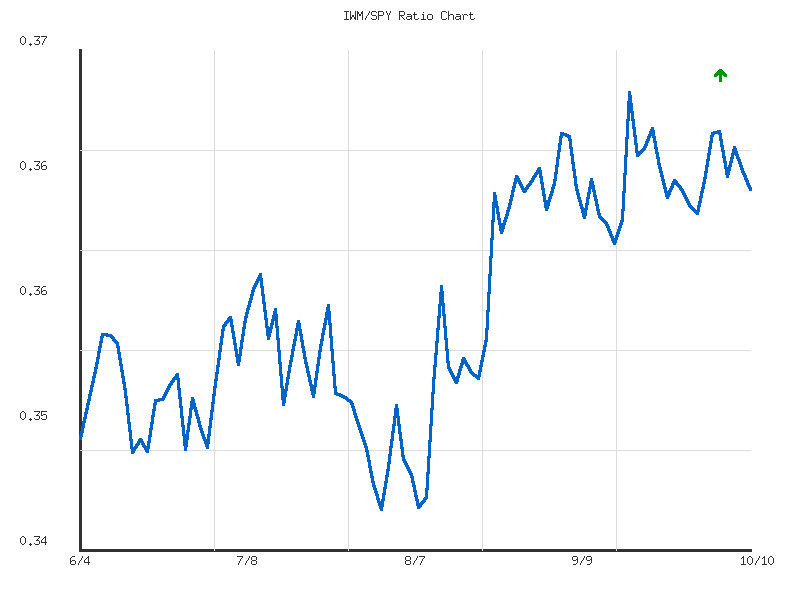
The IWM/SPY ratio, which gauges the relative performance of small-cap stocks (Russell 2000) against large-cap stocks (S&P 500), has demonstrated a clear and sustained upward trend over the past three months. The provided trend data confirms a “moderate” upward direction, with the ratio appreciating by approximately 4.11% from its starting point. The current ratio of 0.3641 is significantly above the period’s average ratio of 0.3573, and its relative position at 0.7683 within the 90-day range indicates a strong placement towards the upper end of its observed performance. This consistent upward bias, coupled with relatively low volatility (0.0000426), suggests that IWM has been outperforming SPY with a stable and persistent momentum throughout this period.
From a structural perspective, the ratio established a notable support floor at approximately 0.3457 on August 1st. On the upside, a primary resistance level was observed at 0.3697 on September 18th. Recent price action shows the ratio peaking at approximately 0.3675 on October 6th, followed by a minor retracement to the current level of 0.3641 as of October 10th. This recent decline appears to be a short-term pullback or consolidation within the context of the larger upward trend. An immediate technical support area has emerged around the 0.3625-0.3630 range, which previously acted as a congestion zone in early and mid-September.
Given the established trend, a continuation of the positive bias in the IWM/SPY ratio is likely. A rebound from the current level, leading to a retest of the recent October 6th high of 0.3675, appears to be a roughly even chance in the immediate term. Should the ratio successfully break above the key resistance at 0.3697, further upward momentum and continued outperformance by IWM would become highly likely. Conversely, if the current pullback persists, a test of the intermediate support zone around 0.3625-0.3630 is likely. A decisive break below this level would increase the probability of a move towards the next technical support, identified by the July 10th peak of approximately 0.3592. However, a complete reversal of the 90-day trend, challenging the major support at 0.3457, appears unlikely without the emergence of more significant bearish technical indications not currently present in the dataset.
Commodities
The following technical analysis is based solely on the provided market data for October 10, 2025, and relevant lookback periods.
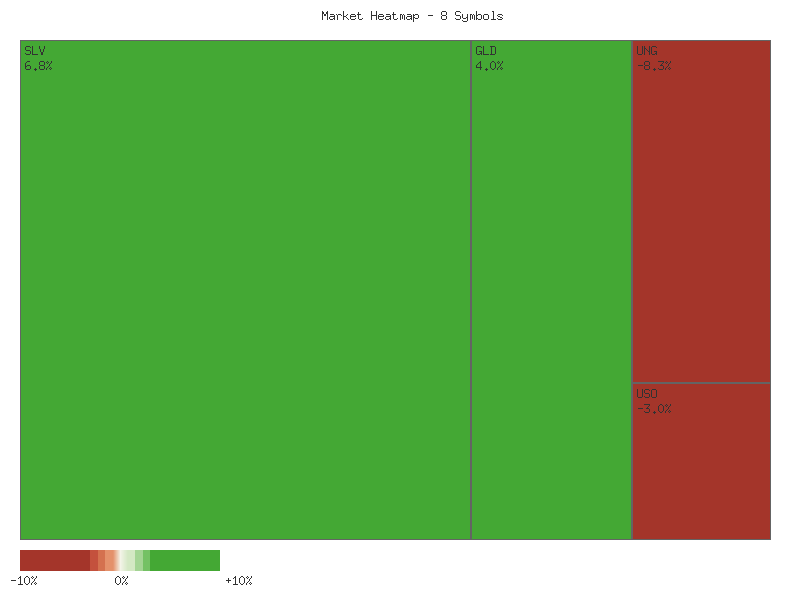
The market data for the specified symbols on October 10, 2025, reveals a predominantly negative performance. A matrix detailing each symbol’s daily percent change, sorted in descending order, is presented below:
| Symbol | Daily Percent Change |
|---|---|
| SLV | 1.610% |
| GLD | 1.010% |
| CORN | -0.860% |
| DBC | -2.129% |
| UGA | -3.103% |
| UNG | -3.218% |
| USO | -4.303% |
| CPER | -4.421% |
Overall, the aggregated daily percent change across these eight commodities futures ETFs for October 10, 2025, sums to approximately -15.414%. This suggests a notably bearish sentiment across the majority of these commodity sectors. While two symbols, SLV and GLD, experienced positive changes, their gains were insufficient to offset the significant declines observed in the remaining six symbols.
Regarding market breadth, the distribution of advancing versus declining symbols indicates a clear directional bias. Two symbols advanced (SLV, GLD) while six symbols declined (CORN, DBC, UGA, UNG, USO, CPER). This represents a 25% advancement rate and a 75% decline rate among the observed commodity ETFs. This breadth suggests widespread weakness across the commodity complex on this particular day, with decliners significantly outnumbering advancers. Such a broad-based decline, particularly in energy-related assets (UGA, UNG, USO) and industrial metals (CPER), points to a prevailing risk-off sentiment or a shift away from these segments. The relatively strong performance of precious metals (SLV, GLD), especially silver, stands out against this backdrop of general weakness.
The GLD/SLV ratio offers insights into the relative strength of gold versus silver over medium-term horizons. For the 14-day period ending October 10, 2025, the ratio exhibits a moderate downward trend, with a change of -6.29%. The current ratio of 8.125 represents the low point for this 14-day period. Similarly, for the 30-day period, the ratio also shows a moderate downward trend, with a more substantial change of -7.55%. The current ratio of 8.125 is likewise the lowest point observed within this longer 30-day timeframe. The consistency of the current ratio marking the low for both periods suggests a sustained and possibly accelerating relative outperformance of silver (SLV) compared to gold (GLD).
The persistent downward trend in the GLD/SLV ratio for both 14-day and 30-day periods implies that silver has been gaining strength relative to gold. This pattern indicates that a capital rotation into silver, or out of gold at a faster pace than silver, has been underway. The current position of the ratio at its 14-day and 30-day low points suggests that this trend remains intact and potentially strong. A continuation of this trend is likely in the immediate term, barring any significant macro or market catalysts that could alter precious metals’ dynamics. However, technical analysis dictates vigilance; should the ratio begin to stabilize or reverse from these multi-week lows, it could signal a shift in relative strength. Therefore, traders might consider a continued relative outperformance of SLV against GLD to be the more probable scenario under current technical conditions.
As a Chartered Market Technician with over 15 years of experience, my analysis of the provided two-day market data is strictly based on the technical patterns observed in price and volume for the given ETFs.
The technical landscape across the examined commodity ETFs (SLV, GLD, CORN, CPER, USO, DBC, UGA, UNG) exhibits a broad-based bearish sentiment over the past two trading days. A significant portion of these assets, particularly within the energy and agricultural sectors, demonstrates clear signs of sustained downward momentum, characterized by successive price declines and confirming volume patterns. Precious metals, while having experienced substantial initial selling pressure, show nuanced price action indicating a potential temporary pause or attempt at consolidation, albeit with a lack of strong conviction for a definitive reversal at this immediate time.
For CORN, CPER, USO, DBC, UGA, and UNG, the technical picture is consistently bearish. Each of these ETFs recorded consecutive red candles, with the second day often presenting a price gap down from the previous day’s close and frequently closing at or near its daily low. This pattern of persistent price decay is reinforced by the accompanying volume: in most instances, volume either notably increased on the second day of decline (e.g., CPER, USO, DBC, UNG) or remained robustly elevated, indicating active and significant selling pressure. This combination of successive lower closes, expanding candle ranges, and rising or sustained high volume is a strong technical signal. Based on these observations, it is highly likely that the bearish momentum in these specific commodity markets will persist in the immediate term. A significant upward reversal without further price consolidation or a clear shift in volume dynamics is considered unlikely.
In contrast, the precious metals ETFs, GLD and SLV, present a somewhat different technical narrative, hinting at a potential short-term stabilization after a sharp drop. Both assets commenced the two-day period with a strong bearish candle, closing near their lows on substantial volume (SLV’s volume being exceptionally high). However, the second day saw a smaller green candle emerge, forming an “inside bar” pattern where the entire price range of the second day remained contained within the previous day’s range. This specific candlestick formation, a “Bullish Harami,” suggests a likely short-term pause in the aggressive selling or a potential minor retracement. Critically, the volume for both GLD and SLV significantly decreased on this second, relatively bullish day. This reduction in volume implies that while the immediate selling pressure may have abated, strong buying conviction necessary for a sustained bullish reversal is not yet firmly established. Therefore, while a minor upward correction has a roughly even chance, a significant and enduring bullish reversal is unlikely at this immediate juncture, with continued consolidation or renewed selling pressure remaining viable alternative scenarios.
In summary, the provided two-day data suggests a dominant bearish trend across the broader commodity market, particularly for energy and agricultural assets, where the continuation of this downtrend is highly likely. For precious metals (GLD, SLV), a short-term consolidation or minor rebound is indicated as likely, but the magnitude of any such rebound is unlikely to be substantial without a significant increase in buying volume to overcome the preceding strong selling pressure. Traders should interpret these divergent signals accordingly, noting the stronger bearish conviction in energy/agricultural commodities versus the more tentative and consolidating action in precious metals.
Technical Analysis of SLV (90-Day View)
SLV has exhibited a robust and persistent uptrend over the past 90 days, transitioning from a consolidation phase in early July around the - range to a pronounced rally that has seen prices ascend above . The price action, characterized by higher highs and higher lows since late August, indicates strong bullish control. This upward trajectory intensified through September and into early October, with significant volume expansions accompanying key upward moves, confirming strong institutional interest and participation in the advance.
The 14-day Relative Strength Index (RSI) corroborates this vigorous bullish momentum, maintaining a prolonged presence in overbought territory. Since early September, the RSI has consistently registered above the 70 threshold, frequently exceeding 80, reaching as high as 81.55 on October 6th and 80.36 on October 10th. While this indicates powerful upward pressure, such sustained extreme overbought readings typically precede a period of consolidation or a price retracement, as buying pressure becomes stretched. A near-term price pullback or sideways consolidation is therefore likely to alleviate these overextended conditions, given the historical tendency for markets to revert from such extremes.
Conversely, the PPO (Percentage Price Oscillator) with 13- and 21-day periods continues to reinforce the underlying strength of the trend. The PPO has been in positive territory since mid-August and has consistently risen, reaching a peak of 2.943 on October 10th. This sustained upward movement in the PPO, without any clear bearish divergence from price action, suggests that the bullish momentum remains robust on a broader perspective. This strong momentum indicator reduces the probability of an immediate and sharp reversal of the primary trend, making a shallow correction or consolidation more likely than a deep decline at this juncture.
Recent price action, specifically the candles on October 9th and 10th, introduces an element of short-term uncertainty. The October 9th candle recorded an all-time high of .35, but closed significantly lower at .71, forming a long upper wick on exceptionally high volume (over 110 million shares). This pattern frequently signals potential buying exhaustion or a supply absorption event at the highs, increasing the likelihood of an imminent short-term top. The subsequent day, October 10th, printed an inside bar, closing at .43 on high, though reduced, volume. This suggests indecision following the previous day’s potential exhaustion.
Considering the confluence of these technical signals, a near-term consolidation or minor pullback in SLV is likely, driven by the extremely overbought RSI and the potential exhaustion indicated by the October 9th candle and associated volume. However, the persistent and rising PPO suggests that the underlying bullish momentum is still intact, indicating that any such pullback would likely represent a healthy correction within the broader uptrend, rather than the onset of a significant downtrend. Therefore, a retest of support levels, potentially in the mid- to low- range, is a likely scenario in the coming trading sessions. The market maintaining above these levels would further suggest the strength of the prevailing trend. However, a break below this range could shift the outlook to a roughly even chance of a deeper correction.
Technical Analysis of GLD (90-day Horizon)
Over the past 90 days, GLD has exhibited a significant bullish transformation, transitioning from a period of range-bound price action to a robust, sustained uptrend. From early June to late August, GLD predominantly traded within a consolidation phase, with prices fluctuating roughly between and . However, a powerful bullish impulse commenced in late August, propelling prices from around to a peak near on October 8th. This aggressive rally was consistently supported by rising daily volumes through September and early October, indicating strong buying interest and participation as the asset advanced.
Recent price action, specifically from October 8th to 10th, introduces a notable shift in market dynamics. Following the high on October 8th, GLD experienced a pronounced bearish reversal on October 9th. This was characterized by a wide-range downward candle that closed significantly below its open, accompanied by the highest volume recorded in the entire 90-day period (33.5 million shares). Such a high-volume bearish day immediately after an extended rally often signals exhaustion among buyers and a significant increase in selling pressure. The subsequent trading day, October 10th, produced a more indecisive candle, closing slightly higher than its open but remaining well below the prior day’s high, on reduced but still elevated volume.
The 14-day Relative Strength Index (RSI) provides crucial context to these recent price movements. During the sustained rally, RSI remained firmly entrenched in overbought territory (above 70) from early September, reaching extreme levels of 86.11 on October 8th. The sharp price decline on October 9th corresponded with an equally rapid drop in RSI from 86.11 to 72.86. Although the RSI technically remains in overbought conditions, this significant and rapid decline from its peak indicates a material loss of upward momentum. Concurrently, the PPO (13, 21) surged throughout the rally, confirming strong bullish momentum and reaching 1.873 on October 8th. However, it subsequently registered a slight decline to 1.841 on October 9th and a marginal recovery to 1.845 on October 10th. While the PPO remains highly positive, its recent peak and subsequent flattening suggest a deceleration in the velocity of price appreciation.
Based on the confluence of these technical signals, a near-term correction or period of consolidation for GLD is likely. The high-volume bearish reversal candle on October 9th, combined with the sharp deceleration in RSI from extreme overbought levels, strongly implies that the previous aggressive rally phase has culminated. A direct continuation of the steep upward trajectory without a material retracement appears unlikely in the immediate future. There is a roughly even chance that GLD could enter a sideways consolidation phase around current levels. Alternatively, a deeper pullback to test prior support levels, implied by the preceding rally, is also a likely scenario given the extensive gains and recent selling pressure.
Bonds
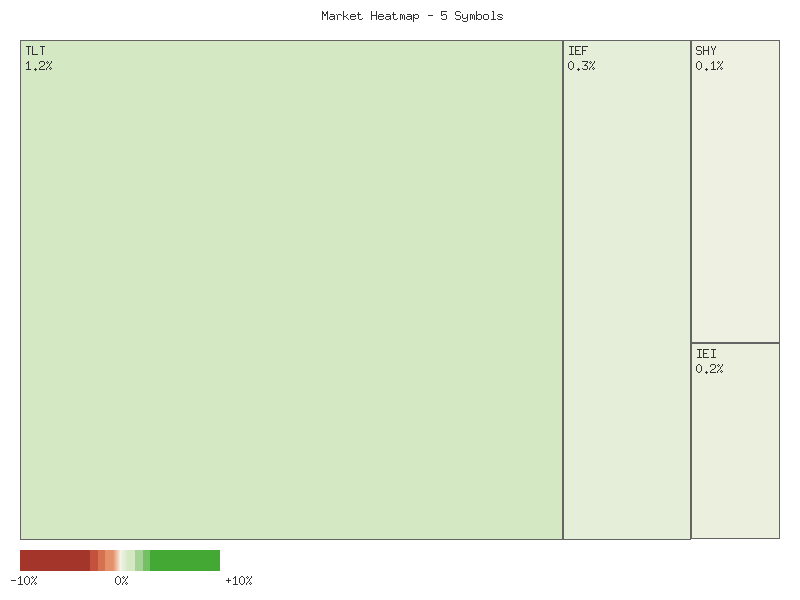
The analysis of the provided daily percentage change data for the listed fixed income ETFs on 2025-10-10 reveals a uniformly positive movement across all observed maturities. The following matrix illustrates the performance for the most recent trading day:
| Symbol | Daily Percent Change (2025-10-10) |
|---|---|
| TLT | 1.615% |
| UTHY | 1.491% |
| IEF | 0.623% |
| IEI | 0.411% |
| SHY | 0.169% |
The aggregate sum of these daily percent changes is approximately +4.31%, indicating an overall significantly higher sentiment for these fixed income instruments on the day. The market breadth is unequivocally positive, with all five symbols advancing and zero declining. This suggests a broad-based upward momentum within this specific cohort of bond ETFs, rather than isolated strength.
The magnitude of the advances on 2025-10-10 shows a clear preference for longer-duration assets, with TLT and UTHY, representing longer-term bonds, exhibiting the largest percentage gains. Intermediate-term bond ETFs, IEF and IEI, showed moderate gains, while the short-term SHY posted the smallest increase. This performance dispersion suggests a probable decline in longer-term interest rates relative to shorter-term rates, or a shift in investor preference towards duration risk. Such a pattern, particularly after the preceding day’s minor declines across all symbols, might indicate a short-term trend reversal favoring bond prices.
Considering the two-day data window, the prior trading day (2025-10-09) showed minor declines across all five symbols. The subsequent strong, broad-based advance on 2025-10-10 represents a notable reversal from universally negative to universally positive performance. This technical pattern suggests a likely shift in short-term market sentiment towards these fixed income assets. While the data is limited to two days, the vigor and breadth of the latest advance make a continuation of upward pressure a more probable scenario in the immediate future for this specific group of instruments.
However, given the limited two-day data points, extrapolating a sustained trend requires caution. There remains a roughly even chance that this two-day pattern could be an isolated event, potentially leading to consolidation or a return to prior levels. An alternative scenario, though less probable given the recent broad strength, would involve profit-taking initiating a downturn. Nevertheless, based solely on the provided technical data, the overwhelming positive breadth and significant aggregate advance on the most recent day strongly suggest that the current technical posture for these bond ETFs is bullish.
Here is a technical analysis of the provided market data:
The observed two-day price action across TLT, UTHY, IEF, IEI, and SHY indicates a pronounced shift towards bullish sentiment. Each of the five Treasury bond ETFs demonstrated upward price movement over the analyzed period. Crucially, the second trading day, October 10th, for every instrument commenced with a price gap higher than the previous day’s close. This was accompanied by a substantial increase in trading volume across the board. This confluence of factors suggests a robust and broad-based strengthening of positive sentiment within these fixed-income instruments, irrespective of their stated maturity profiles or perceived market positioning.
TLT, representing long-term treasuries, and IEF, covering intermediate-term treasuries, exhibited particularly strong bullish impulses. On October 10th, both ETFs experienced significant upward gaps and closed strongly near their daily highs. TLT’s closing price represented a marked increase from its open, supported by a remarkable surge in volume, which more than doubled from the previous day. IEF similarly displayed a strong green candle with a notable increase in trading activity. This price action, combined with the confirming high volume, makes it very likely that upward momentum for these longer-duration instruments is gaining traction, indicating strong demand.
The shorter-duration instruments, IEI (3-7 year) and SHY (1-3 year), while both registering marginal bearish closes on October 9th, executed strong bullish reversals with significant gap-ups and robust closes on October 10th. This indicates that the buying pressure was comprehensive, extending across various segments of the yield curve. UTHY also exhibited strong bullish price action, mirroring the trend observed in TLT, with a substantial gap up and increased volume on the second day. Based purely on the provided data, UTHY’s price movement is consistent with the bullish trend observed in the other Treasury ETFs, rather than an inverse relationship. The sharp increase in volume for IEI, SHY, and UTHY further corroborates the strength and conviction behind the bullish sentiment on the second day.
Considering the broad-based upward price movement, the consistent opening gaps higher, and the confirming increase in volume across all observed ETFs on October 10th, we judge it likely that this bullish momentum could extend into the immediate future. The technical setup points to prevailing buying interest having overcome any prior short-term hesitations. However, it is also important to consider alternative scenarios. While the current technical structure is demonstrably bullish over these two days, should there be a subsequent failure to hold these recent gains, potentially marked by a reversal candle on lower volume or a close below the October 10th open for multiple ETFs, it would present a roughly even chance of a short-term consolidation phase or even a partial reversal of the immediate bullish impulse. For now, the prevailing technical evidence points to continued strength.
Crypto
The following technical analysis reviews the two-day performance of IBIT and ETHA, focusing exclusively on the provided daily percentage change data.
| Symbol | Total Percent Change (2-Day) |
|---|---|
| IBIT | -5.579% |
| ETHA | -11.935% |
Analysis of the provided data indicates a notable bearish trend for both symbols over the two-day period. IBIT registered daily declines of -1.884% on the first day and -3.695% on the second, accumulating a total two-day decrease of -5.579%. ETHA exhibited even more pronounced negative momentum, with declines of -3.980% on the first day and a more significant -7.955% on the second, resulting in a cumulative two-day loss of -11.935%. Both symbols are clearly lower, with ETHA demonstrating a substantially steeper depreciation than IBIT.
ETHA’s performance, characterized by an accelerating decline from -3.980% to -7.955%, suggests a strengthening bearish sentiment. This pattern indicates that selling pressure likely intensified on the second day, which is a key characteristic of a downtrend gaining momentum. A continuation of this accelerating decline is a roughly even chance in the immediate term, particularly without additional data points to suggest a potential reversal or slowing of the negative trend. The observed price action on ETHA appears significantly more volatile and under greater selling pressure compared to IBIT.
Conversely, IBIT also experienced a decline, but its two-day cumulative loss was approximately half that of ETHA. The daily percentage changes for IBIT, -1.884% followed by -3.695%, also indicate an acceleration of bearish momentum, albeit less severe than ETHA. While both symbols are under pressure, the technical data suggests that IBIT is experiencing less aggressive selling. It is plausible that IBIT could follow a similar path of escalating declines as ETHA, given the current two-day pattern, although such a pronounced acceleration is not yet firmly established.
Based on the available data, the market for these two symbols is unambiguously lower. The observed price action makes a flat or mixed overall change highly unlikely. While both symbols are in downtrends, ETHA’s more significant decline and accelerating negative momentum suggest a higher probability of continued bearish sentiment in the near term compared to IBIT. Traders observing these patterns would likely interpret the data as indicative of continued downside risk, particularly for ETHA, given the significant and accelerating price depreciation.
Magnificent 7 & Friends
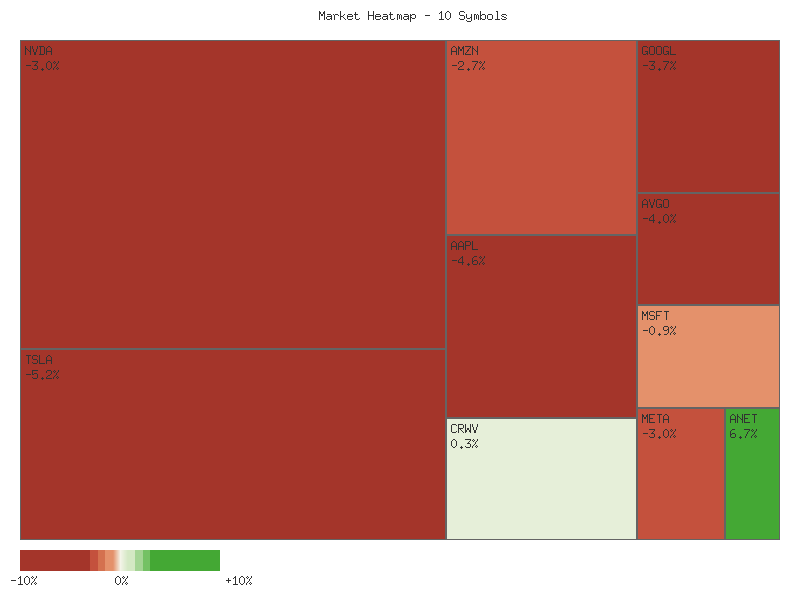
Analysis of the provided technical data for the specified symbols reveals a distinct shift towards a bearish technical posture over the two-day observation period. Examining the cumulative daily percentage change for each symbol over October 9th and October 10th indicates that all ten symbols concluded the period with net negative performance. This universal decline suggests the observed cohort is experiencing significant selling pressure, making an overall higher or flat close highly unlikely. The aggregated negative returns across the entire group provide a strong indication of prevailing downward momentum within this specific collection of equities.
Market breadth metrics highlight a notable deterioration in the technical environment. On October 9th, the breadth was characterized by a roughly even chance distribution, with five symbols (AMZN, NVDA, ANET, META, CRWV) registering positive daily changes and five symbols (TSLA, AAPL, GOOGL, MSFT, AVGO) experiencing declines. This mixed breadth suggests either a period of consolidation or sector-specific rotation. However, this balanced activity gave way to a unanimous decline on October 10th.
The technical picture shifted dramatically on October 10th, with all ten symbols registering negative daily percentage changes. This complete lack of advancing symbols, following a day of mixed performance, is a significant technical development. Such overwhelming bearish breadth strongly implies a synchronized selling event across the observed universe. The widespread nature of these declines makes it highly likely that the near-term technical outlook for this specific cohort remains under pressure. An immediate reversal of this broad-based downturn appears unlikely without new data indicating a change in technical momentum.
The magnitude of the declines on October 10th further reinforces the bearish technical sentiment. Symbols like AVGO, TSLA, AMZN, and NVDA experienced particularly substantial single-day drops, each exceeding 4.8%. While such pronounced, widespread declines could theoretically precede a short-term oversold condition, the provided data set does not include momentum oscillators or volume indicators necessary to confirm such a scenario. Therefore, based solely on the available price action, the predominant technical signal is one of continued downside vulnerability.
The matrix below details the daily percentage change for each symbol on October 10th, sorted in descending order:
| Symbol | Daily Percent Change |
|---|---|
| GOOGL | -2.0535751252432446% |
| MSFT | -2.1898928024502293% |
| ANET | -2.610124502306766% |
| CRWV | -3.249930109029917% |
| AAPL | -3.452212250039357% |
| META | -3.8458916715518585% |
| NVDA | -4.886534766578386% |
| AMZN | -4.9925353473259% |
| TSLA | -5.062680810028932% |
| AVGO | -5.909802330299689% |
As a seasoned CMT, my analysis of the provided two-day market data for TSLA, MSFT, AAPL, META, NVDA, AVGO, GOOGL, AMZN, CRWV, and ANET reveals a pronounced shift towards bearish sentiment across the board. The overwhelming majority of these assets exhibited significant downward price action on October 10th, 2025, following more mixed or moderately positive performance on October 9th. This deterioration in price was predominantly accompanied by a notable increase in trading volume, which typically lends credibility to the observed price movements. The patterns observed suggest a broad-based, short-term negative outlook for these constituents, indicating a likely continuation of selling pressure.
A number of prominent symbols displayed classic strong bearish reversal patterns on October 10th. TSLA, for instance, followed a bullish Day 1 with an exceptionally large red candle on Day 2, engulfing the prior day’s price action and closing near its absolute low, all on significantly increased volume. Similarly, NVDA, CRWV, AMZN, AVGO, META, and ANET all posted strong green candles or relatively neutral candles on October 9th, only to be met with substantially larger red candles on October 10th. These red candles closed near their respective lows, often breaking below the prior day’s lows and opens, indicating a strong rejection of higher prices. The heightened volume accompanying these reversals, especially in NVDA and TSLA, suggests strong selling conviction. It is highly likely that these assets will experience further downward pressure in the immediate future, given the force of these reversals.
Other symbols, such as GOOGL, AAPL, and MSFT, presented bearish continuation patterns. After posting red candles on October 9th, they extended their declines with larger red candles on October 10th, closing at new two-day lows. The increase in volume for these assets on the second day reinforces the bearish momentum. While not as dramatic as the outright reversals seen elsewhere, these patterns still signal a strengthening bearish trend. It is likely that these assets will also face continued selling pressure, maintaining their current downward trajectory.
Considering the collective technical evidence, the immediate outlook for this group of assets is overwhelmingly bearish. The widespread occurrence of strong bearish candle formations, often accompanied by increased trading volume, indicates that sellers have gained control across multiple significant stocks. While a short-term oversold bounce is a possibility following such sharp declines, there is no technical evidence within the provided two-day data to support such a scenario. Based purely on the observed price and volume dynamics, it is highly likely that further downward price discovery will occur for a majority of these stocks in the very near term.
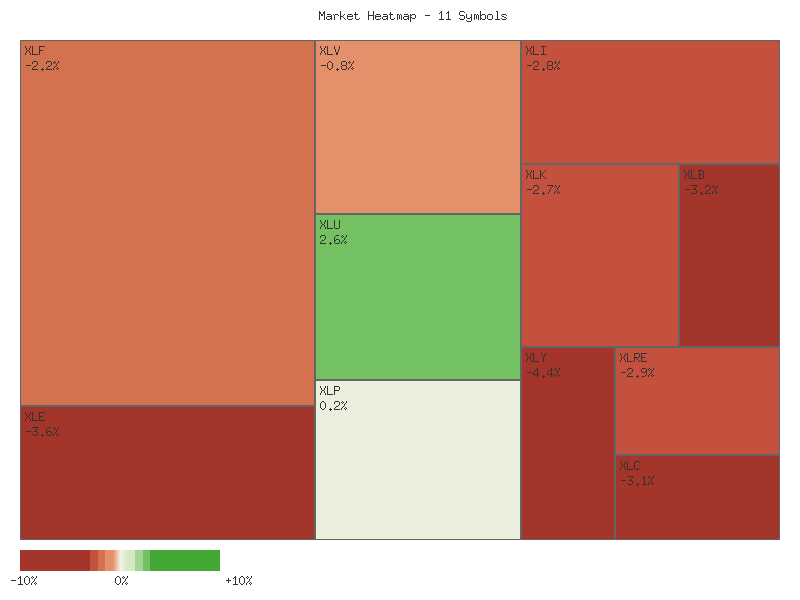
S&P 500 Sector Breadth
The aggregated two-day performance across the provided S&P 500 sectors indicates a substantial overall decline. The sum of all individual sector percentage changes is approximately -27.312%, suggesting a broad market downturn over the observed period. Market breadth is notably weak, with only one out of eleven analyzed symbols, Consumer Staples (XLP), registering an advance. Conversely, ten sectors experienced declines, indicating pervasive negative price action. This overwhelming ratio of declining to advancing symbols strongly implies that selling pressure was widespread and dominant during the two-day interval. It is highly likely that this breadth suggests significant downside momentum across the broader market.
An examination of sector performance reveals a distinct pattern of weakness, particularly among offensive sectors. All six designated offensive sectors—Technology (XLK), Consumer Discretionary (XLY), Financials (XLF), Industrials (XLI), Materials (XLB), and Energy (XLE)—experienced declines. The magnitude of these declines was significant, with Energy (XLE) and Technology (XLK) exhibiting the largest losses, approximately -4.25% and -4.24% respectively. Among the defensive sectors, three out of four—Real Estate (XLRE), Healthcare (XLV), and Utilities (XLU)—also registered declines, although generally with less severe percentage drops compared to many offensive counterparts. The sole advancing sector, Consumer Staples (XLP), gained a modest 0.40%.
Given the widespread declines across both offensive and defensive sectors, the prevailing market sentiment appears distinctly bearish. The uniform decline in offensive sectors, which are typically sensitive to economic growth expectations, suggests a likely deterioration in risk appetite. While Consumer Staples (XLP) demonstrated modest strength, its isolated advance is unlikely to signal a broad market rotation into defensive positioning at this juncture. Rather, the pervasive negative performance, with only one out of eleven sectors advancing, points to a flight from risk generally. An alternative scenario, though less probable given the data, might involve early signs of defensive rotation obscured by broad-based selling, but without further confirming data, this remains a low-confidence assessment. The observed data instead strongly suggests a market grappling with downside pressure, with little evidence of a tactical shift towards safety.
| Symbol | 2-Day Percent Change |
|---|---|
| XLP | 0.398% |
| XLU | -0.662% |
| XLRE | -1.554% |
| XLV | -1.664% |
| XLC | -2.416% |
| XLF | -2.531% |
| XLY | -3.250% |
| XLB | -3.421% |
| XLI | -3.690% |
| XLK | -4.238% |
| XLE | -4.254% |
Here is a technical analysis of the provided market data:
The broad market, as represented by the eleven S&P sector ETFs over the two-day period, exhibits a widespread bearish sentiment, culminating in significant downward price action on the second day. The overwhelming majority of sectors closed near their daily lows on October 10th, following varying degrees of bearishness on October 9th, and critically, this decline was accompanied by a notable surge in trading volume across most instruments. This combination of strong bearish candlestick patterns and confirming high volume suggests a high probability of continued downward pressure in the immediate short-term.
Five sectors, XLK (Technology), XLI (Industrials), XLF (Financials), XLE (Energy), and XLY (Consumer Discretionary), displayed particularly pronounced bearish conviction. XLK, XLI, XLF, and XLY all presented large bearish candles on October 10th, each closing near its absolute low for the day, and recording more than double their respective previous day’s trading volumes. XLK, for instance, experienced a dramatic drop from its open, closing significantly lower. Similarly, XLF’s volume more than doubled as it plunged to its daily low. XLE also saw a bearish continuation with a gap down opening on October 10th, subsequently closing near its low on substantially increased volume, further reinforcing the bearish momentum established on the prior day. For these sectors, a continuation of the downtrend is highly likely.
Several other sectors, including XLRE (Real Estate), XLU (Utilities), XLV (Health Care), XLC (Communication Services), and XLB (Materials), also demonstrated clear bearish patterns, albeit with slightly less extreme price movements compared to the strongest decliners. Each of these ETFs experienced bearish closes on October 10th, often near their daily lows, and on increased volume. For example, XLRE and XLU showed patterns akin to dark cloud cover, where the second day’s bearish candle opened above the prior close but then closed significantly lower, signaling a shift in momentum. The higher volume in these sectors indicates that the selling pressure is broad and sustained. Based on these patterns, further downside movement for these sectors is likely.
The Consumer Staples sector (XLP) stands out as an exception to the broad market weakness, presenting a more ambiguous technical picture. On October 9th, XLP closed flat. On October 10th, it opened higher than the previous close and traded to new highs before ultimately closing at its daily low. While it closed higher than its previous day’s close, the significant increase in volume accompanying a close at the daily low suggests a potential rejection of higher prices, even within an otherwise positive nominal close. This confluence of signals—a higher close on increased volume versus a close at the low, hinting at buyer exhaustion—creates an environment where continuation of upward movement or a reversal to downward movement faces a roughly even chance.
In summary, the aggregated technical data across the majority of the analyzed sectors strongly indicates a market experiencing significant bearish pressure, primarily driven by large-bodied downside candlesticks and substantial increases in trading volume. While XLP shows some relative resilience, the overall technical picture points to a high probability of sustained bearish momentum across most sectors in the immediate future, with an unlikely immediate reversal for the broadly affected indices.
Equity Breadth
The percentage of S&P 500 members trading above their 50-day moving average (SPXA50R) exhibited a notable deterioration over the observed seven-day period. Commencing at 56.89% on October 2nd, the metric initially experienced a minor uptick to 58.68% before initiating a consistent decline. This downward trajectory accelerated significantly in the latter half of the period, culminating in a sharp drop from 55.29% on October 8th to 48.90% on October 9th, and a pronounced fall to 33.73% by October 10th. The decisive move below the 50% threshold on October 9th, and the subsequent substantial retreat, indicates a rapid and broad-based weakening of short-term internal market strength. A decline of this magnitude suggests that a significant majority of S&P 500 constituents are now experiencing short-term downtrends.
Concurrently, the percentage of S&P 500 members above their 200-day moving average (SPXA200R) also demonstrated a weakening trend, albeit from a higher absolute base. Starting at 63.27% on October 2nd, this metric saw an initial slight rise to 63.67% before commencing a more gradual, yet consistent, decline. The trend became more aggressive on October 9th, dropping from 60.88% to 58.48%, and then sharply to 50.30% by October 10th. While still marginally above the critical 50% level, the rapid descent from over 60% and the approach to 50% signal a deterioration in the longer-term breadth of the market. This indicates that a decreasing number of stocks are sustaining their long-term uptrends, raising concerns about the underlying health of the broader market structure.
Throughout most of the seven-day observation window, the 20-day Exponential Moving Average (EMA_20_DAY) for the SPX exhibited a clear upward trajectory, advancing from 6617.79 on October 2nd to a peak of 6663.12 on October 9th. This sustained increase would typically imply a constructive short-term trend for the index itself. However, a material shift occurred on October 10th, with the EMA_20_DAY declining to 6652.58. This single day’s reversal, while not definitive of a downtrend, coincided precisely with the most severe deterioration observed in both SPXA50R and SPXA200R.
The pronounced and accelerating collapse in market breadth, particularly the SPXA50R plummeting below 50% and continuing to 33.73%, creates a strong bearish divergence against the previously rising EMA_20_DAY. Such a sharp decline in participation suggests that the prior upward movement in the SPX was likely driven by a narrowing group of stocks. Given the substantial erosion in internal market strength across both short-term and longer-term participation metrics, it is unlikely that the EMA_20_DAY for the SPX can quickly resume a sustained upward trend. A continued decline in the EMA_20_DAY, or at a minimum, a period of consolidation with downward pressure, appears probable. The observed data points to an elevated risk of further short-term downside for the SPX, with a rapid recovery in the EMA_20_DAY appearing unlikely under these breadth conditions.
SPX Daily
The SPX experienced a significant technical shift on 2025-10-10, concluding a period of sustained, yet recently faltering, bullish momentum. The final trading session produced a substantial bearish candle, closing at 6552.51, decisively below the 50-day Exponential Moving Average (EMA50) at 6534.02. This sharp downturn contrasts with the preceding six trading days (2025-10-01 to 2025-10-09), where the index consistently traded above its EMA50, reaching multi-week highs near 6760. The 14-day Relative Strength Index (RSI) further highlights this reversal; after peaking in overbought territory at 71.61 on 2025-10-06, it plummeted to 42.08 on 2025-10-10. This dramatic RSI drop from elevated levels, alongside the EMA50 breach, signals a powerful and rapid shift in short-term momentum from bullish to bearish. The overarching long-term trend, however, remains defined by the ascending EMA50 above the 200-day EMA (6123.89).
Immediate overhead resistance for the SPX is now established by the recent highs in the 6750-6760 range and critically, the EMA50 at 6534.02, which has transitioned from support to resistance. The prior short-term low of 6569.22 (2025-09-25) was also breached, reinforcing this resistance. On the downside, the closing price of 6552.51 rests just above the EMA50, which may offer fragile, temporary support. A more robust support zone is identified around the 6440-6450 level, corresponding to the low of 6443.98 from 2025-09-05. A significant long-term support level remains at the ascending 200-day EMA, currently at 6123.89, which has provided consistent structural underpinning throughout the 90-day period.
A bearish case for the near future is likely. The decisive breach of the EMA50, coupled with the strong bearish candle and sharp RSI decline, indicates substantial selling pressure. A continuation of this downside movement toward the 6440-6450 support zone is probable. Should this level fail, further decline toward the long-term EMA200 (6123.89) becomes a distinct possibility. A bullish reversal appears unlikely in the immediate term; it would necessitate a swift and sustained reclamation of the EMA50 and a move above the 6700-6750 resistance. A neutral case, implying sideways consolidation, holds a roughly even chance following initial bearish follow-through. The market could find temporary equilibrium above the 6440-6450 level, with the EMA50 potentially acting as dynamic overhead resistance.
The technical data strongly suggests a rapid deterioration of market sentiment, shifting from widespread optimism to heightened caution. The prolonged period of rising prices and consistently high RSI values (above 70 at times) indicated a strong bullish conviction. However, the dramatic price plunge on 2025-10-10, marked by a powerful bearish engulfing candle and a substantial RSI drop, reflects an abrupt unwinding of bullish positions. This decisive breach of the 50-day EMA, a key short-term trend indicator, acts as a significant technical catalyst. Such a breakdown often triggers automated selling and prompts a re-evaluation of risk by market participants, likely reinforcing bearish sentiment and influencing near-term market direction. The magnitude of the move signals a notable increase in fear or profit-taking activity.
SPX Technical Analysis: Momentum Reversal After Extended Rally
The SPX has demonstrated a robust upward trend over the past 90 trading days, marked by consistent higher highs and higher lows, painting a clear picture of a primary bullish market. From early June, the index climbed steadily from approximately 5970 to above 6280 by early July, indicating strong buying conviction. A notable, albeit brief, correction occurred in late July, seeing the index retreat from around 6400 to below 6240 by early August. However, the SPX swiftly recovered, resuming its ascent to establish new all-time highs above 6750 by early October. This prevailing bullish structure underwent a significant challenge on October 10th, 2025, with a sharp one-day decline from an open of 6740.49 to close at 6552.51. This substantial drop decisively breached several recent short-term support levels, marking it as the most significant single-day percentage pullback in the latter half of the observed period.
The 14-day Relative Strength Index (RSI) largely reflected the price action, frequently registering overbought (above 70) during strong advances, peaking at 75.57 in early July. This indicated intense, if potentially unsustainable, buying enthusiasm. The early August correction saw RSI drop significantly to 47.80, effectively normalizing momentum. Subsequent rallies saw RSI again approach or briefly exceed 70 in late September (74.75) and early October (71.60). Critically, on October 10th, the RSI plummeted from 66.12 to 42.07. This dramatic single-day descent from the upper half of the oscillator range strongly indicates an abrupt and significant loss of buying power, signaling that the prior bullish momentum has been severely compromised.
Similarly, the Percentage Price Oscillator (PPO) (13, 21-day) confirmed bullish momentum through June and early July, with positive and rising values peaking near 0.94. The late July to early August price drop briefly turned the PPO negative (reaching 0.422 by August 5th), indicating a temporary bearish shift in intermediate-term momentum. The PPO then recovered, sustaining positive readings and reaching highs around 0.635 in late September and 0.568 in early October. Notably, these recent PPO peaks were, however, lower than earlier highs, which could suggest a subtle deceleration in the overall bullish impulse despite new price highs. On October 10th, the PPO underwent a substantial single-day decline from 0.544 to 0.384. While remaining positive, this abrupt drop points to a rapid erosion of short-term bullish momentum, making an imminent bearish crossover with its signal line (not provided) highly likely.
Synthesizing these technical indicators, the immediate outlook for the SPX warrants heightened caution. The dramatic price reversal on October 10th, combined with the sharp, decisive drops in both the RSI and PPO, strongly suggests a significant shift in market sentiment and underlying momentum. It is highly likely that the SPX will experience further downward pressure or enter a period of protracted consolidation in the immediate future. Key previous price lows around 6400 (from early September) and 6200 (from early August) represent potential support zones that could be tested. However, the magnitude of the recent momentum indicator collapse indicates that these levels may not hold as reliably. An alternative scenario, currently assessed as less likely given the severity of the technical breakdown, posits that this decline is merely a temporary shake-out preceding a quick resumption of the prior uptrend. Should the market swiftly recover and establish closes above the 6650-6700 range, this alternative would gain credibility. Nevertheless, based solely on the provided data, market participants should anticipate increased volatility and a probable downward bias.