Daily Market Technical Analysis
Market Overview
Market analysis reveals widespread bearish sentiment, with all major indices closing lower and significant negative market breadth on October 9th, suggesting pervasive selling pressure. The S&P 500 (SPX) and Nasdaq 100 (QQQ) exhibit decelerating bullish momentum and bearish divergences in RSI and PPO despite recent new highs, making a period of consolidation or moderate pullback likely. Small-caps (IWM) also show weakening momentum, supporting a likely short-term retreat. Sector performance is predominantly negative, with economically sensitive areas displaying strong bearish reversals, while Technology (XLK) shows resilient but consolidating strength. Equity breadth is deteriorating, indicating a fragile rally potentially driven by a few large-cap names, making a more significant market correction or consolidation a roughly even chance. Consequently, a continuation of near-term bearish pressure or consolidation is likely across broader markets, with renewed aggressive upside considered unlikely without fresh catalysts.
Market Indices
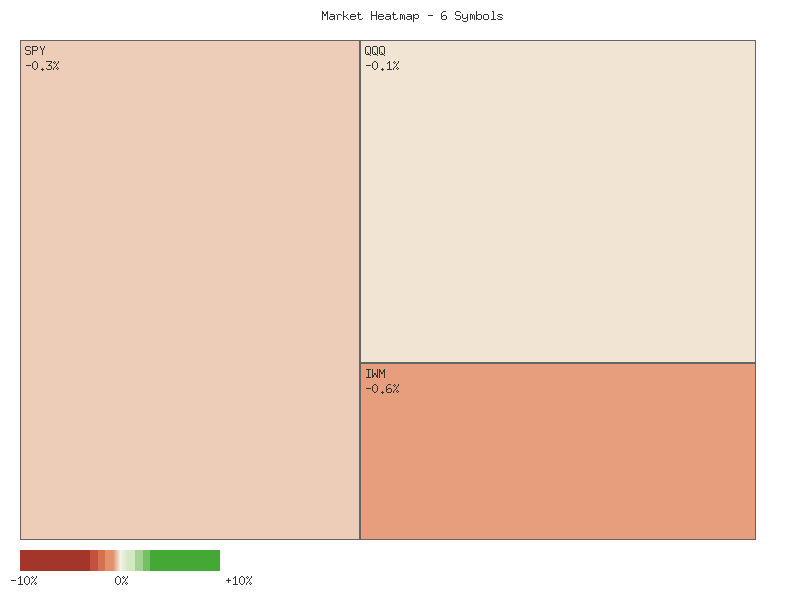
The latest available daily percent change data for key market indices on 2025-10-09 reveals a broadly negative market performance. The following matrix summarizes these changes, sorted in descending order:
| Symbol | Daily Percent Change |
|---|---|
| OEF | -0.1188% |
| QQQ | -0.1210% |
| SPX | -0.2756% |
| IWM | -0.6445% |
| MDY | -1.0882% |
| IJR | -1.1482% |
The summation of these daily percent changes for 2025-10-09 results in a combined decline of approximately -3.3963%. This aggregate figure strongly indicates an overall lower change across these broad market indices for the session.
Analysis of market breadth for 2025-10-09 shows a distinctly bearish sentiment. All six of the reviewed symbols—IJR, IWM, MDY, SPX, OEF, and QQQ—registered negative daily percent changes. Consequently, there were zero advancing symbols and six declining symbols. This complete absence of advancing symbols suggests extremely poor market breadth, indicating that the selling pressure was widespread across different capitalization segments and broad market benchmarks. Such unanimous declines across major indices are highly likely to be interpreted as a technical signal of underlying weakness, and a continuation of negative sentiment is a roughly even chance in the immediate subsequent session, absent other mitigating factors.
Review of the VIX 7-day candlestick data reveals significant volatility within the period. The VIX initially oscillated in a range between 15.93 and 17.28 from October 1st to October 3rd, generally closing in the mid-16s. A notable upward price action occurred on October 7th, with the VIX closing at 17.24, following an intra-day high of 17.55. This suggests an immediate increase in perceived market uncertainty. However, this spike was largely reversed on October 8th, with a sharp decline to a close of 16.30, indicating a temporary easing of fear. The latest candle on October 9th shows a minor positive close at 16.43, suggesting that while the prior day’s sharp reversal was not entirely maintained, significant fear did not re-emerge to challenge the October 7th highs. The pattern of a sharp rise followed by a sharp drop and then a slight recovery suggests the market is attempting to find equilibrium, but volatility remains a factor.
The daily percent change data for the VIX corroborates the candlestick analysis and provides further insight. On 2025-10-08, the VIX experienced a significant decline of -5.45%. This sharp reduction in the volatility index likely corresponded with a period where market participants perceived reduced risk. However, on 2025-10-09, the VIX recorded a positive change of +0.80%. This modest increase in the VIX on a day when all primary equity indices recorded declines is noteworthy. While not a dramatic surge, this simultaneous occurrence of a slightly rising VIX and broadly falling equity indices is a typical market dynamic. This relationship suggests that market participants are likely exhibiting increased caution, albeit not panic, as broader market indices retreated. A continuation of this pattern where the VIX trends higher during equity market declines is a likely scenario if bearish sentiment persists. Conversely, a reversal in VIX, paired with further market weakness, would represent a potential bullish divergence, though such a scenario appears unlikely based on the immediate data.
Market Commentary: Two-Day Sector Performance Analysis
Analysis of the provided two-day market data for SPY, QQQ, IWM, IJR, MDY, and OEF reveals a distinct shift in sentiment and price action. On October 8th, 2025, all tracked instruments exhibited strong bullish performance, with each closing near its daily high. This synchronized upward movement across broad market, technology, mid-cap, small-cap, and micro-cap segments suggested a prevailing positive sentiment and robust buying interest, indicating broad market strength across diverse capitalization ranges.
However, October 9th marked a significant and widespread bearish reversal. SPY, representing the broader market, opened higher than its previous close but finished considerably lower, forming a substantial bearish candle. This downward price action was notably accompanied by an increase in trading volume from the prior day, which provides conviction behind the selling pressure and suggests a likely continuation of this bearish momentum in the immediate term for the broader market. Similarly, small-cap (IWM) and micro-cap (IJR) indices also experienced pronounced bearish reversals with increased volume, reinforcing the observed selling conviction within these risk-on segments. For MDY, the mid-cap index, a strong bearish candle also formed, closing significantly lower, though this occurred on decreased volume.
A degree of divergence in the intensity of selling pressure was observed in QQQ and OEF. While both indices also registered bearish candles on October 9th, their closes remained above their respective opening prices from the strong bullish day of October 8th. QQQ’s bearish move occurred on comparatively lower volume than its preceding bullish day, implying that the selling pressure in the technology-heavy segment might be less forceful or widespread than in the broader market or smaller-cap segments. OEF, tracking the S&P 100, similarly experienced a bearish day with decreased volume, suggesting a less pronounced bearish conviction than what was evident in SPY, IWM, or IJR.
Considering the collective technical patterns, it is likely that the market, as represented by these indices, will experience continued bearish pressure in the very near term. The strong bearish candles, particularly in SPY, IWM, and IJR, accompanied by increased volume, typically suggest that sellers have gained control and are likely to push prices lower. The broad-based nature of this reversal across most tracked indices further strengthens this outlook, pointing to a probable shift in overall market sentiment. However, we cannot rule out a temporary bounce or consolidation, especially if QQQ and OEF demonstrate continued relative resilience due to their comparatively lighter selling volume. Nonetheless, based solely on the provided two-day technical data, a continuation of the recent bearish trend appears likely, with broader market and smaller-cap segments potentially leading the decline.
SPX Technical Commentary: Momentum Deceleration Amidst Sustained Uptrend
The S&P 500 (SPX) has demonstrated a sustained upward trajectory over the past 90 days, advancing from approximately 5938 in early June to closing near 6735 on October 9th. This represents a robust bullish trend, characterized by a series of higher highs and higher lows throughout the period. Notable rallies occurred from late June into early July, and again from late August into mid-September, with the index reaching a 90-day high of 6755.64 intraday on October 9th. While the overall price action reflects a dominant uptrend, intermittent pullbacks, such as the one observed in early August from roughly 6400 to 6238, have punctuated these advances. The current price level is near the high end of this observed range, indicating significant buying pressure over the medium term.
Analysis of the 14-day Relative Strength Index (RSI) reveals recurring patterns of momentum exhaustion coinciding with price peaks. The RSI consistently entered overbought territory (above 70) during periods of strong price acceleration, specifically in early July (peaking at 75.57), late July (peaking at 76.29), mid-September (peaking at 74.75), and early October (peaking at 71.60). Historically, these overbought readings have been followed by either a price consolidation or a minor pullback, allowing the RSI to cool down. In the most recent observation, the RSI declined from an overbought reading of 71.60 on October 6th to 66.12 on October 9th. This retreat from overbought conditions, while not extreme, indicates that bullish momentum is moderating. Given this pattern, a period of price consolidation or a minor retreat is likely in the immediate term.
The 13-21-day Percentage Price Oscillator (PPO) provides a more nuanced view of momentum. During the initial strong rally into early July, the PPO peaked at 0.94, confirming robust momentum. However, as the price continued its ascent through July and August, the PPO displayed significant bearish divergences. Specifically, the PPO peaked around 0.76 in late July and remained in a lower range (around 0.4-0.5) through much of August, even as the SPX recorded fresh highs. This divergence, where price makes higher highs but momentum indicators make lower highs, suggests weakening underlying buying strength. Although the PPO saw a resurgence in late August and early September, reaching 0.63, it has not returned to the levels seen in early July, and currently stands at 0.54, showing a slight decline in the latest data points. The persistent lower peaks in PPO while price achieved higher highs suggests that the recent upward price action has been supported by less robust momentum compared to earlier in the 90-day period.
Synthesizing these technical observations, the SPX is in a clear bullish trend over the 90-day period. However, the recent decline in the 14-day RSI from overbought levels, coupled with the notable bearish divergences observed in the 13-21-day PPO during earlier significant price advances, implies that the current upward momentum may be decelerating. It is likely that the SPX will experience either a period of consolidation or a moderate pullback from current levels in the very near term. A continuation of the aggressive upward trajectory without a renewed surge in momentum, as indicated by PPO, is unlikely. Conversely, a strong re-acceleration of the PPO above its recent peaks, accompanied by a sustained move of the RSI back into deeply overbought territory, would present a roughly even chance for the continuation of the aggressive bullish run towards new higher levels beyond the observed 90-day data. Should the SPX manage to break significantly higher without substantial PPO confirmation, the bearish divergence would intensify, making a subsequent sharper correction likely.
The QQQ exchange-traded fund has demonstrated a pronounced upward trend over the provided 90-day period, with its price steadily climbing from the low in early June to the high by early October. This consistent appreciation is marked by a series of higher highs and higher lows, establishing a clear bullish posture. Notably, there have been periods of price correction, such as the significant pullback at the end of July/early August, and more recently, a dip in late September, which found support before the rally resumed. While volume sometimes increased on down days, potentially indicating heightened selling pressure, a consistent, clear trend in volume that reliably signals impending reversals is not immediately discernible from this data.
Analysis of the 14-day Relative Strength Index (RSI) reveals that QQQ spent considerable time in overbought territory (above 70) throughout June, July, and particularly in September. The RSI reached a peak of 75.35 on September 22nd, at which point QQQ closed at .20. However, as QQQ ascended to a new price high of .44 on October 8th, the RSI registered a value of 70.47, subsequently closing at 69.27 on October 9th. This technical pattern establishes a distinct bearish divergence: QQQ achieved a higher price peak, but its RSI made a lower high. This divergence suggests that the underlying bullish momentum is decelerating despite the price’s continued climb, elevating the likelihood of a forthcoming short-term price correction or a period of sideways consolidation.
Further corroborating this assessment, the Price Percentage Oscillator (PPO) also indicates waning momentum. The PPO remained in positive territory for the majority of the 90-day period, affirming the overall bullish trend. It saw a strong upward surge in September, peaking at 0.80 on September 22nd, aligning with the RSI’s peak and QQQ’s then-current price high. However, similar to the RSI, when QQQ recorded its higher price peak of .44 on October 8th, the PPO reading was 0.759 and 0.768 on October 9th. This represents another bearish divergence, as the PPO failed to reach a new high alongside the price. The confluence of these bearish divergences from both momentum indicators is a notable technical flag.
Considering the combined signals from the price action, RSI, and PPO, it is likely that QQQ will experience a period of price consolidation or a moderate pullback in the near future. The strong indication of decelerating momentum, despite new price highs, typically precedes such market behavior. A plausible downside target in the event of a retracement would be the support area around the late September lows, roughly in the - range. Alternatively, should strong buying interest unexpectedly override these momentum divergences, QQQ could attempt to extend its rally; however, the probability of a sharp, immediate continuation of the uptrend is comparatively lower than a retracement or sideways movement. Consequently, there is roughly an even chance for either a modest pullback or a period of sideways trading as momentum seeks to realign with price.
As a Chartered Market Technician with over 15 years of experience, my analysis of IWM focuses exclusively on the provided 90-day price and indicator data.
IWM has exhibited a sustained bullish trajectory over the past 90 days, advancing from approximately in early June to nearly by early October. The price action is characterized by a series of higher highs and higher lows, indicative of a clear uptrend. Notably, significant rallies were observed from early June to early July, and again from early August through late September. The most recent price data indicates a peak around on October 6, followed by a minor retracement to .13 by October 9. This recent price behavior suggests a possible short-term consolidation or minor pullback after a strong upward move, with price currently trading around its mid-September high.
The Relative Strength Index (RSI 14-day) provides insights into the strength and speed of price changes. Over the 90-day period, RSI moved into overbought territory (above 70) in early July and again in mid-September (71.23 on September 18), consistent with strong upward price movements. Following the September peak, RSI has declined from 71.23 to 60.08 by October 9. While still above the neutral 50 level, indicating that bullish momentum largely persists, the recent descent from overbought conditions suggests a reduction in immediate buying pressure. This cooling of the RSI is likely to precede either a period of consolidation or a further modest price correction.
The Percentage Price Oscillator (PPO 13,21-day), which measures the divergence of two moving averages, confirms the observed price momentum. PPO remained positive throughout most of the 90-day period, oscillating with the underlying price trend. A notable observation is the PPO’s strong decline and near-zero reading (0.084) on August 11, coinciding with a temporary price dip, which was subsequently followed by a robust upward reversal as the PPO surged. More recently, PPO peaked at 1.003 on September 23, then initiated a clear downtrend, falling to 0.689 by October 9. The indicator remains above zero, which suggests that the overarching bullish trend is still intact; however, the persistent decline in PPO from its recent high implies that the strength of this upward momentum is decreasing. This pattern typically signals a weakening of the existing trend, making further immediate significant advances unlikely without a reacceleration in momentum.
Volume analysis reveals several critical points. High volume spikes on strong up days, such as August 22 (58M shares) and September 5 (47M shares), broadly confirmed the strength of the respective rallies. However, the significantly elevated volume on September 17 (79M shares) coinciding with a relatively modest price increase and a close near the low of the day, followed by a minor price drop on September 19 with continued high volume (49M shares), presents a pattern that could indicate exhaustion or profit-taking at short-term highs. Given the current technical posture—price hovering near recent highs, cooling RSI, and decelerating PPO—a period of further sideways consolidation or a minor price retreat is likely in the immediate future. A re-test of support around the 239-240 level is a roughly even chance scenario. Conversely, should IWM convincingly break above the level with renewed strong volume, it would suggest a re-invigoration of bullish momentum, making a continuation of the rally highly likely. A significant break below the identified support, particularly if accompanied by increasing bearish volume and PPO crossing into negative territory, would increase the likelihood of a deeper corrective phase.
Tech Sector Analysis
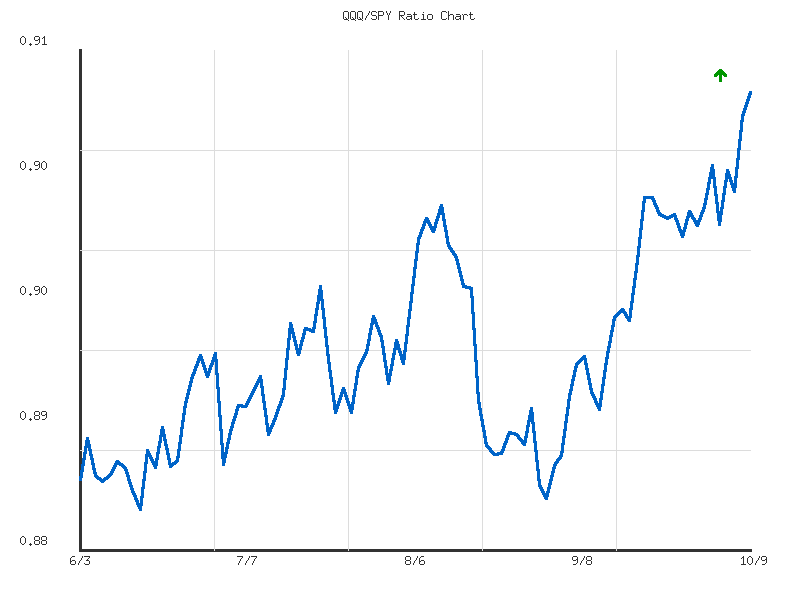
Analysis of the provided QQQ/SPY ratio data indicates distinct patterns over the 14-day and 30-day timeframes, reflecting the relative performance of the NASDAQ-100 compared to the S&P 500. Over the 30-day period, the ratio exhibits an overall upward trend, moving from a low of 0.8834 to its current position at 0.9099, representing a 2.3191% change. This upward trajectory suggests a general outperformance by QQQ over SPY during this longer interval. However, the trend strength for this period is explicitly categorized as “weak,” implying that while the direction is positive, the momentum lacks significant conviction or has been punctuated by notable pauses or retracements rather than a forceful ascent. Notably, the current ratio stands at the highest point observed within this 30-day range.
Shifting focus to the more recent 14-day data, the QQQ/SPY ratio’s trend is classified as “sideways,” also with “weak” strength, showing a comparatively modest 0.7587% change. This indicates that the relative performance over the past two weeks has primarily traded within a range, consolidating previous moves rather than establishing a clear, sustained directional bias. Nevertheless, a critical technical observation is that the current ratio of 0.9099 precisely matches the high point for this 14-day period. This suggests that despite the “sideways” characterization, the ratio has recently resolved to the upside of its short-term range, confirming the momentum observed in the broader 30-day trend.
Considering the technical confluence of the established 30-day upward trend and the current ratio concluding at the high for both the 14-day and 30-day periods, it is likely that QQQ will maintain its relative outperformance against SPY in the immediate future. The resolution to the upside of the recent “sideways” pattern, combined with the longer-term positive trajectory, points towards continued relative strength for technology stocks. However, the persistent designation of “weak” trend strength across both observed periods introduces a degree of uncertainty regarding the pace of further outperformance.
Given the weak trend strength and the ratio reaching its current highs for both periods, there is a roughly even chance that the QQQ/SPY ratio could experience a period of consolidation or a minor retracement from these levels. Such a development would not necessarily negate the broader upward bias but would reflect a natural pause in momentum. A significant and sustained reversal, leading to QQQ underperforming SPY in the near term, is assessed as unlikely, as the prevailing technical pattern, marked by the ratio closing at multi-period highs and supported by the longer-term upward trend, does not provide evidence for such a strong bearish shift in relative performance.
Technical Analysis: QQQ/SPY Ratio (90-Day Perspective)
The QQQ/SPY ratio, representing the relative performance of the Nasdaq 100-tracking QQQ against the broader S&P 500-tracking SPY, has demonstrated a consistent upward trajectory over the past 90 days. Beginning in early June at approximately 0.8846, the ratio has steadily climbed to its current observation of 0.9099 in early October, marking its highest point within this analytical window. This sustained ascent signals a period where QQQ has generally outperformed SPY, indicating a prevailing bullish sentiment for technology and growth-oriented equities relative to the broader market. The overall positive change of 2.86% over the period, while not dramatic, establishes a clear direction of relative strength.
Despite the unambiguous “up” direction, the trend strength is explicitly characterized as “weak” within the provided data, coupled with extremely low volatility (approximately 0.00004). This combination suggests that QQQ’s outperformance has been a gradual and measured process, rather than a sharp, high-momentum rally. The minimal volatility implies that day-to-day fluctuations in the ratio have been subdued, reflecting a market where the relative shift in strength occurred incrementally without significant price swings or strong directional conviction. This interpretation of “weak” strength indicates a slow-and-steady climb to new relative highs.
The current ratio of 0.9099 is notable as it represents the 90-day high, indicating that QQQ’s relative performance against SPY is currently at its peak within this observed period. This “relative position” of 1 is a bullish technical signal. Given the established upward trend and the current achievement of a new relative high, a continuation of QQQ’s relative outperformance appears likely in the immediate term, contingent upon the absence of significant bearish technical reversals. The persistent upward drift has effectively propelled the ratio into a short-term breakout condition relative to its preceding 90-day trading range.
While the present momentum favors continued outperformance, the identified “weak” trend strength and consistently low volatility warrant considering alternative scenarios. A sustained breakout above the current 90-day high, leading to a new, higher regime of relative performance for QQQ, is certainly possible. However, a period of consolidation or a modest pullback following the achievement of a new high is also a roughly even chance, as assets often tend to stabilize or retrace after reaching significant levels, particularly when the underlying trend strength is described as weak. Should the ratio experience a pullback, the average ratio of 0.8929 or prior consolidation levels would likely serve as potential support zones. A decisive breach and sustained movement below this average would imply a shift towards a more balanced performance or even underperformance by QQQ, though such a scenario appears unlikely given the consistent positive trajectory over the entire analyzed period.
IWM vs. SPY
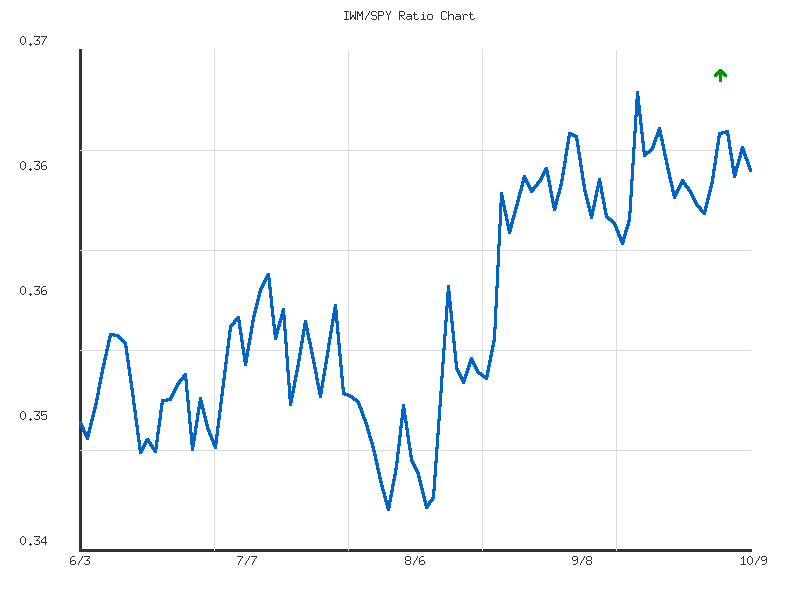
The relative performance of the Russell 2000 (IWM) against the S&P 500 (SPY), as measured by the IWM/SPY ratio, has exhibited a pattern of consolidation across both the 14-day and 30-day timeframes. Both analyses classify the trend direction as “sideways” with “weak” strength. This suggests a current lack of significant directional conviction from market participants regarding the sustained outperformance or underperformance of small-caps versus large-caps. The ratio’s volatility, measured at 0.0000024 for the 14-day period and 0.0000039 for the 30-day period, is notably low, reinforcing the interpretation of a consolidating or equilibrium phase rather than a trending market. The current ratio of 0.365233 resides near the respective average ratios for both periods, specifically at 0.5036 relative to its 14-day range and 0.4845 relative to its 30-day range, further indicating a balanced state.
Over the recent 14-day period, the IWM/SPY ratio registered a minor decline of -0.3428%. This slight negative drift suggests a marginal underperformance of the Russell 2000 relative to the S&P 500 within this immediate short-term window. The ratio initiated the period at approximately 0.3664, observed a temporary dip to its 14-day low of 0.3627 on October 1st, before staging a modest recovery to the current 0.3652 level. While the overall trend remains “sideways,” the recent closing ratio slightly below the period’s average (0.365290) indicates that short-term momentum is not favoring small-caps. Given the weak strength and minor negative change, there is a roughly even chance that this weak relative underperformance could persist in the immediate future, with no strong technical signals suggesting a significant breakout in either direction.
Examining the longer 30-day period reveals a slightly different nuance in overall net performance. Despite the recent consolidation, the ratio shows a positive change of +0.3332% from its starting point, indicating a modest net outperformance by IWM over SPY across the broader timeframe. The ratio peaked at a 30-day high of 0.3697 on September 18th, subsequently experiencing a retracement. The current ratio of 0.3652, while slightly above the 30-day average of 0.3648, is notably below its recent high. The presence of this peak followed by a decline suggests that the initial momentum of outperformance encountered resistance. Consequently, while the broader 30-day trend indicates slight historical small-cap strength, the more recent price action, including the weak sideways trend, suggests that a continuation of this net outperformance is now less likely without a clear technical catalyst.
The convergence of “sideways” trends with “weak” strength across both the 14-day and 30-day periods implies that the market is in a phase of relative equilibrium between small-cap and large-cap leadership. A significant deviation from this pattern is unlikely in the immediate term without a clear break from the established range. For IWM to establish a clear trend of outperformance, the ratio would need to demonstrably break above its recent 14-day high of 0.3676 and approach the 30-day high of 0.3697. Conversely, sustained underperformance would be signaled by a decisive break below the 14-day low of 0.3627, which is also close to the 30-day low of 0.3610. Based solely on the provided data, a continuation of the weak sideways movement is likely for the foreseeable future, as there are no strong technical indications suggesting an imminent shift towards a robust directional trend in either relative performance.
Technical Analysis: IWM/SPY Relative Strength Ratio (90-Day)
Based on the provided 90-day market data for the IWM/SPY ratio, we assess a consistent trend of small-cap outperformance relative to large-cap stocks. The data indicates an “up” trend with “moderate” strength over the observation period, characterized by a 4.15% increase in the ratio from its starting point. The current ratio, at approximately 0.3652, stands notably above the 90-day average of 0.3571, reinforcing the upward trajectory. We judge that the sustained position above the average implies that IWM has generally maintained a leadership role against SPY during this timeframe. Furthermore, the relative position of the current ratio at 81.38% suggests it is firmly in the upper quartile of its 90-day range, closer to the high of 0.3697 than the low of 0.3456. This configuration is indicative of a trend that has matured but has not yet shown definitive signs of exhaustion.
Throughout the 90-day period, the IWM/SPY ratio has generally established a series of higher lows and higher highs, a classic technical hallmark of an uptrend. While the ascent has been moderate rather than parabolic, periods such as early July and mid-August demonstrated clear acceleration, moving from roughly 0.349 to 0.359 in two weeks, and from 0.345 to 0.358 in approximately the same duration, respectively. The ratio has recently approached its 90-day high of 0.3697, established on September 18th, but has since pulled back slightly. This suggests that the area around 0.370 could function as a near-term resistance level. The overall price action suggests a controlled and orderly advance, with the reported volatility figure, while numerically small at 0.0000425, supporting the interpretation of contained daily fluctuations rather than erratic swings.
Considering the established trend and current positioning, we assess that a continuation of IWM’s relative outperformance against SPY is likely in the immediate term. The ratio’s ability to hold above its recent average and previous minor resistance levels strengthens this outlook. We judge there is roughly an even chance that the ratio will re-test the 90-day high of 0.3697 within the next few trading sessions, given its current proximity and the underlying moderate upward momentum. A decisive breakout above this level would signal a continuation of stronger relative leadership from small-cap stocks.
However, alternative scenarios should be considered. If the ratio fails to overcome the 0.3697 resistance level and subsequently breaks below recent support, which appears to be around the 0.362-0.363 area (observed during late September/early October pullbacks), then a period of consolidation or a reversal of the relative strength trend would become more likely. A significant decline below the 90-day average ratio of 0.3571 would strongly suggest a shift in the relative strength dynamic, indicating that large-cap stocks might begin to outperform small-caps. As of the last data point, such a significant breakdown appears unlikely, but sustained failure to make new highs after a strong run typically warrants close monitoring for potential trend exhaustion.
Commodities
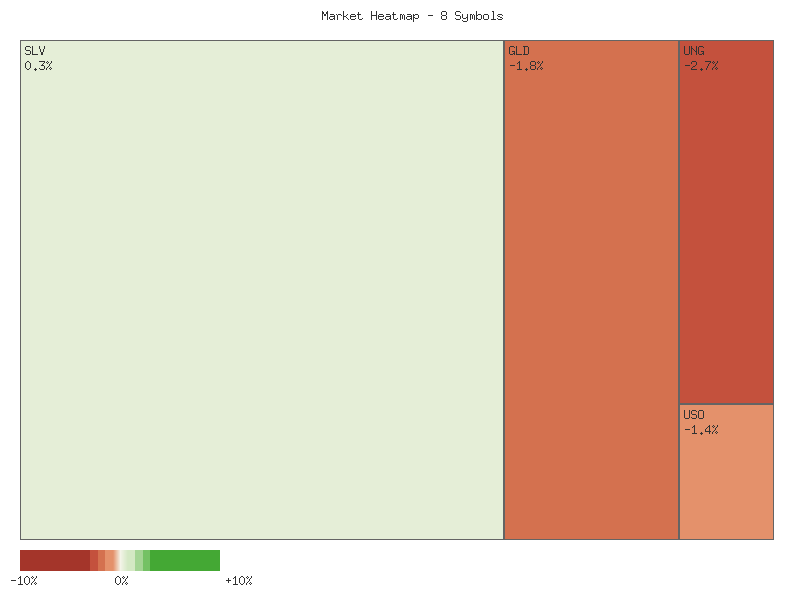
The daily performance across the selected commodities on October 9, 2025, indicates a predominantly bearish sentiment. The matrix below details the daily percent change for each symbol, sorted in descending order:
| Symbol | Daily Percent Change |
|---|---|
| CPER | 0.924% |
| SLV | 0.337% |
| CORN | -0.739% |
| DBC | -0.923% |
| USO | -1.387% |
| UGA | -1.515% |
| GLD | -1.845% |
| UNG | -2.748% |
Analysis of the overall market change for these symbols reveals a significant downward bias. The aggregate sum of the daily percent changes is approximately -7.896%, indicating an overall lower market for this specific basket of commodities. Market breadth is predominantly negative, with only two out of eight symbols (CPER and SLV) exhibiting advances, while six symbols recorded declines. This ratio of decliners to advancers (6:2) suggests a broad-based decline across a substantial portion of these commodity-related instruments, implying a likely continuation of selling pressure in the near term for the broader commodity complex observed. The most notable decliners include UNG, GLD, and UGA, each registering declines exceeding 1.5%.
The GLD/SLV ratio over the 14-day period exhibits a moderate downtrend, with a change of approximately -5.16%. The current ratio of 8.1733 is at the low point of this 14-day observation period, signifying that silver (SLV) has been outperforming gold (GLD) on a relative basis. The average ratio over this period stands at 8.3839. The moderate strength of this downtrend suggests a persistent, rather than erratic, shift in relative strength favoring silver.
Extending the observation to the 30-day GLD/SLV ratio reinforces this pattern of silver outperformance. The 30-day trend also indicates a moderate downtrend, with a more substantial change of approximately -7.84%. The current ratio remains at 8.1733, which is also the low point for the extended 30-day period. The average ratio over the longer term is 8.6268. The consistent downtrend across both timeframes suggests a relatively robust and sustained shift in investor preference or market dynamics favoring silver. It is likely that this relative strength in silver will persist, at least in the immediate future, given the moderate strength and the current ratio’s position at the low end of both observed ranges.
Considering alternative scenarios, while the current data strongly favors silver’s outperformance, a reversal in this trend would likely require a significant technical catalyst for GLD relative to SLV, such as gold establishing a new support level while silver falters. However, based solely on the provided ratio data, the probability of the GLD/SLV ratio continuing its downward trajectory, thereby indicating continued silver outperformance, is considered high. The sustained moderate downtrend across both 14-day and 30-day periods, coupled with the current ratio being at multi-period lows, reduces the likelihood of an immediate reversal in relative strength.
As a Chartered Market Technician with over 15 years of experience, this analysis reviews the two-day candlestick data for select commodity-related instruments: SLV, GLD, CORN, CPER, USO, DBC, UGA, and UNG. The requested heatmap data was not provided and therefore cannot be incorporated into this assessment. Our focus is solely on discernible price and volume patterns from October 8th and 9th, 2025. Across the board, market participants generally expressed a bearish bias, with several key commodities exhibiting significant downward pressure or considerable intraday selling, particularly on the second day.
Within the broader commodity complex, several instruments show bearish indications. USO, representing crude oil, formed a clear bearish engulfing pattern on the second day, closing near its low with increased volume, suggesting a modest decline is likely in the near term. UGA (gasoline) and UNG (natural gas) also demonstrated strong bearish momentum; UGA produced a large bearish candle on significantly increased volume, making a modest decline is likely, while UNG’s two consecutive bearish candles imply a modest decline is likely to persist. In contrast, DBC (broad commodity index) and CORN both closed bearishly, but their declines were accompanied by lower or decreasing volume, respectively. This diminished selling conviction presents a roughly even chance for either continued moderate downward pressure or near-term stabilization for both. CPER (copper) gapped up significantly on October 9th before encountering considerable selling pressure and forming a large upper wick on substantially increased volume. Despite closing higher, this suggests strong overhead resistance, making a modest decline or at least consolidation likely.
The precious metals sector offers a mixed but generally cautionary outlook. GLD demonstrated a strong bearish reversal, forming a large bearish engulfing candle on October 9th, closing near its low with increased volume. This pattern makes a modest decline likely in the immediate term. SLV exhibited extreme volatility. Following a substantial gap-up on October 9th, the price encountered significant selling, driving it to a low well below the previous day’s low, only to recover considerably to close above the prior day’s close. This created a long lower wick on nearly double the volume, indicating robust buying interest at lower levels. However, the dramatic intraday swing and initial selling pressure after the open introduce significant uncertainty. Given these conflicting signals, it is a roughly even chance for either consolidation or a continuation of high volatility in the near term, with potential for either rebound or renewed selling.
In summary, the technical data largely suggests a prevailing bearish sentiment across many commodity instruments. While USO, UGA, UNG, and GLD show patterns indicating a modest decline is likely, DBC and CORN present a more ambiguous outlook with roughly even chances due to reduced volume on their declines. CPER signals overhead resistance, and SLV’s pronounced intraday volatility results in a roughly even chance for its immediate direction. Traders should monitor volume closely for trend confirmation, especially where conflicting signals or reduced conviction are apparent.
As a Chartered Market Technician with over 15 years of experience, I provide the following rigorous technical analysis of SLV based solely on the provided 90-day market data for the candlestick chart, 14-day Relative Strength Index (RSI), and 13-21-day Percentage Price Oscillator (PPO).
Analysis of SLV over the past 90 days reveals a significant upward trajectory, particularly since late August. Following a period of initial advance in early June, SLV experienced a consolidation phase through mid-July. A subsequent rally in mid-July was met with a sharp but brief correction at the end of July. From late August, the price action has been decidedly bullish, ascending from approximately to recent highs around . The sustained increases have been frequently accompanied by elevated trading volumes, signifying strong participant interest. Notably, the final day of the observed data, 2025-10-09, recorded an exceptionally high volume print of 110 million, concurrent with price reaching an intraday high of .35 before retreating significantly to close at .71, well off its peak. This specific price action forms a potential bearish reversal candlestick pattern, suggesting notable selling pressure emerged at these higher levels.
The 14-day Relative Strength Index (RSI) has consistently reflected the underlying price strength. Following initial forays into overbought territory (above 70) in early June and mid-July, the RSI entered a sustained period of extreme overbought conditions from mid-September. It frequently registered values above 70, peaking above 81 on multiple occasions between late September and early October (e.g., 81.50 on 2025-09-29, 81.52 on 2025-10-01, and 81.55 on 2025-10-06). The current RSI reading of 78.37 on 2025-10-09 remains deeply within overbought territory. A crucial observation is the development of a potential bearish divergence: while the price action continued to make marginal new highs in early October (e.g., .56 on 2025-10-08 and an intraday high of .35 on 2025-10-09), the RSI peaked on 2025-10-06 at 81.55 and subsequently registered slightly lower highs (77.94 on 2025-10-08 and 78.37 on 2025-10-09). This divergence between rising price and declining momentum, coupled with the extremely overbought condition, suggests that the current upward momentum is decelerating, and a period of consolidation or correction is becoming likely.
In contrast to the RSI, the Percentage Price Oscillator (PPO) with 13 and 21-day parameters paints a picture of consistently robust momentum. The PPO has remained positive throughout the entire 90-day period, indicating that the shorter-term moving average has continuously stayed above the longer-term average, signifying an ongoing bullish bias. After a noticeable dip in early August (where it declined to values as low as 0.16 on 2025-08-20 but remained positive), the PPO began a strong ascent from late August, mirroring the price rally. It has been making progressively higher highs, culminating in its peak value of 2.87 on 2025-10-09. This continuous upward trajectory and the absence of a bearish divergence on the PPO suggest that, despite the extreme overbought conditions indicated by the RSI, the underlying short-term trend strength remains considerable. The PPO’s strong reading makes an immediate, sharp trend reversal unlikely without further evidence of momentum erosion.
Synthesizing these technical observations, SLV is currently exhibiting characteristics common to extended upward trends nearing a potential inflection point. The combination of sustained extreme overbought RSI readings, the emerging bearish RSI divergence, and the high-volume bearish reversal candlestick on 2025-10-09 strongly suggests that a period of downward price adjustment or sideways consolidation is highly likely in the immediate term. The significant volume on the final trading day, alongside the retreat from intraday highs, reinforces the notion of increased selling interest. However, the persistently strong and rising PPO suggests that any corrective phase may be a temporary rebalancing rather than a wholesale reversal of the broader bullish trend. An alternative, albeit unlikely, scenario is that the strong PPO readings and robust underlying trend could absorb the selling pressure indicated by the RSI and candlestick, leading to a continuation of the rally after a brief pause or minor dip. Traders are advised to monitor for further confirmation of momentum shifts in both indicators and subsequent price action.
GLD has demonstrated a robust upward trajectory over the past three months, initiated from a consolidation phase in late August and culminating in a significant acceleration through September and early October. Price ascended from approximately in late July to recent peak levels near . This pronounced bullish momentum is clearly corroborated by both the Relative Strength Index (RSI) and the Percentage Price Oscillator (PPO). The RSI-14 consistently sustained levels above the overbought threshold of 70 from early September, frequently reaching extreme readings, with a peak at 86.11 on October 8. Concurrently, the PPO (13,21-day) remained in strongly positive territory throughout this period, reaching a zenith of 1.873 on October 8, indicating persistent and expanding upward momentum. The notable increase in trading volume during key upward impulses further confirms substantial buyer conviction behind this ascent.
However, the most recent trading session on October 9 introduced a compelling technical shift. GLD experienced a substantial decline, opening near its previous high and closing significantly lower at .43. This price action formed a large bearish candle, which was accompanied by exceptionally high trading volume of 33.5 million shares—the highest observed within the provided 90-day data set. This surge in volume during a sharp price depreciation strongly suggests significant selling pressure or aggressive profit-taking. Complementing this, the RSI-14 underwent a rapid reversal, plummeting from an extreme overbought reading of 86.11 to 72.86. This abrupt exit from severely overbought conditions, particularly on such elevated volume, makes an immediate continuation of the prior accelerated ascent unlikely.
The Percentage Price Oscillator (PPO), while remaining positive at 1.841, registered a deceleration from its peak of 1.873 observed on October 8. This initial decline in PPO, coinciding with the pronounced bearish candle and the highest volume day, suggests a potential weakening of bullish momentum. The confluence of these indicators—a significant bearish candlestick pattern on peak volume, a sharp drop in RSI from extreme overbought levels, and a PPO showing early signs of deceleration—collectively points to a likely short-term correction or at least a notable pause in GLD’s upward trajectory. Traders should anticipate the formation of a potential near-term peak, if not an immediate reversal.
Given the substantial strength and duration of the preceding uptrend, there remains a roughly even chance that this bearish signal represents a temporary profit-taking event within a broader bullish framework, potentially leading to a period of consolidation before a renewed advance. Nevertheless, the magnitude of the selling pressure and the indicator responses observed on October 9 suggest that further downside exploration is likely in the immediate term. Initial technical support levels would typically be found around prior minor resistance areas that have historically turned into support, which, according to the provided data, might align with the cluster of closes around - from late September. A decisive break below this range would heighten the probability of a more extensive and prolonged correction. Conversely, a rapid recovery and close above the October 8 high on renewed buying interest would indicate that the bearish signal was a short-lived anomaly.
Bonds
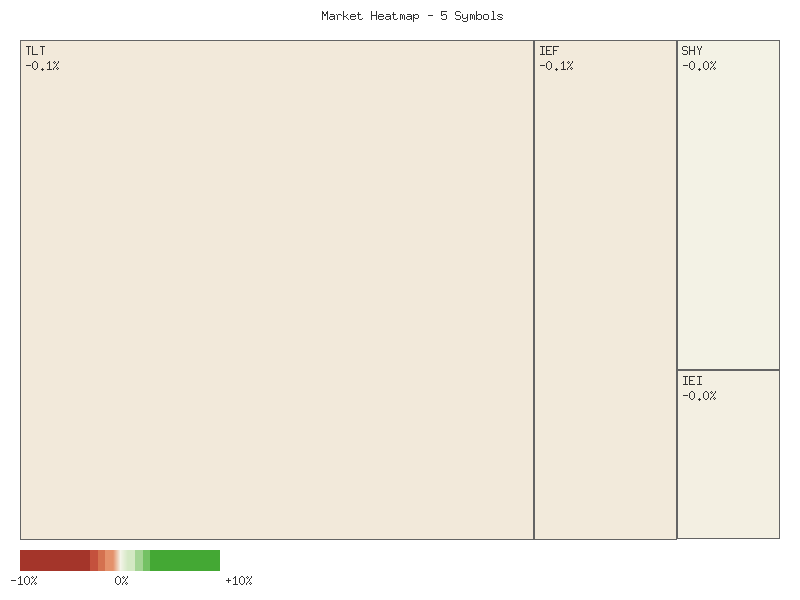
The analysis of the provided daily percentage change data for TLT, UTHY, IEF, IEI, and SHY over the two-day period concludes with the following net performance for each instrument:
| Symbol | Net Daily Percent Change |
|---|---|
| UTHY | 7.274% |
| TLT | 0.006% |
| SHY | -2.415% |
| IEF | -5.187% |
| IEI | -7.540% |
This data indicates a mixed performance across the bond ETFs under review. UTHY experienced a significant positive net change, standing out as the top performer, while IEI registered a substantial decline, making it the weakest. TLT exhibited an almost negligible positive net change, suggesting a period of approximate price stability or a near-perfect reversal over the two days. The dispersion of returns across these fixed-income instruments is notable, with both strong positive and strong negative movements observed within the defined timeframe.
From a market breadth perspective, the data suggests a lean towards bearish sentiment among the specified instruments. Two symbols, UTHY and TLT, concluded the two-day period with positive net changes, while three symbols—SHY, IEF, and IEI—experienced negative net changes. This results in a declining-to-advancing ratio of 3:2. This pattern is indicative of a market where a majority of constituents are under selling pressure or are failing to sustain gains. The preponderance of declining issues signals that the overall market strength, as represented by these specific bond ETFs, is likely weak. While not definitive for broader market trends, within this peer group, the negative breadth is a probable indicator of underlying weakness.
Aggregating the net daily percentage changes for all five symbols yields an overall decline of approximately -7.86% for the collective group over the two-day period. This collective negative movement suggests an overall lower posture for this segment of the fixed-income market as defined by these specific ETFs. Despite UTHY’s robust advance, its positive contribution was insufficient to offset the combined declines from IEF, IEI, and SHY. The total sum reflects a clear downward bias, implying that the capital flow, when viewed in aggregate across these instruments, was predominantly negative. Therefore, the overall trend for this basket of bond ETFs is assessed as lower.
Considering the individual performances, the near-flat net change for TLT (0.006%) represents a point of neutrality, indicating that early gains were almost entirely negated by subsequent declines, or vice versa. This specific pattern in TLT could represent a period of indecision or a short-term equilibrium rather than a sustained directional move. Conversely, UTHY’s strong positive showing appears to be an outlier within the general downtrend observed in the other declining instruments. It is conceivable that UTHY is responding to unique underlying factors or sector-specific catalysts not shared by the broader bond market represented here. Without additional data such as volume or price action details beyond percentage change, discerning the precise drivers for these divergent performances is challenging. However, the data strongly suggests a divergence in performance characteristics among these seemingly related assets.
Based solely on the provided two-day daily percentage change data, the technical posture for this specific grouping of bond ETFs appears predominantly bearish. The market breadth, with more declining issues than advancing ones, reinforces this sentiment. The overall negative aggregate change further underpins the assessment of a lower trend. While UTHY shows notable strength, and TLT demonstrates relative stability, the majority of the instruments experienced declines, collectively pulling the group lower. Future analysis would ideally incorporate additional technical indicators and a broader time horizon to validate these short-term observations and provide greater clarity on potential market direction.
As a Chartered Market Technician with over 15 years of experience, the following analysis is derived strictly from the provided two-day market data for the US Treasury bond ETFs TLT, UTHY, IEF, IEI, and SHY.
A comprehensive technical review of the provided two-day market data for the US Treasury bond ETFs TLT, UTHY, IEF, IEI, and SHY indicates a pervasive, short-term bearish sentiment across various maturities. All five instruments concluded both observed trading sessions with lower closing prices, signaling a broad-based downward pressure within this asset class. The consistency of these declines suggests a prevailing negative disposition among market participants, at least over this limited timeframe. While the magnitude of these declines varies, the uniformity in direction is a notable technical observation.
Focusing on longer-duration instruments, TLT experienced two consecutive days of lower closes, moving from an open of 89.6 on the first day to a close of 89.18 on the second. Volume on the second day (21.55M) slightly decreased from the first (22.45M). While persistent selling was evident, the second day’s close marginally above its open could hint at some intra-day buying support or temporary selling exhaustion. UTHY also saw two lower closes, but notably, its volume surged from 1,558 on the first day to 4,528 on the second during this decline. This increased volume with lower prices suggests higher conviction in UTHY’s short-term bearish trajectory compared to TLT. A continuation of this short-term downtrend in TLT and UTHY is likely, though TLT’s receding volume could present an alternative scenario of near-term consolidation.
For the intermediate-duration bond ETFs, IEF and IEI, the bearish sentiment appears more pronounced, supported by increasing trading volume during their declines. IEF registered two successive lower closes, moving from 96.54 to 96.31. Crucially, its volume increased significantly from 5.08M to 7.08M on the second day. This pattern of lower prices accompanied by rising volume strongly suggests that selling pressure is escalating, indicating higher conviction in the downtrend for IEF. Similarly, IEI also posted two consecutive lower closes, from 119.49 to 119.29, with its volume increasing from 1.23M to 1.73M. The close on the second day for IEI was near its daily low, reinforcing the technical weakness. For both IEF and IEI, the combination of lower closes on increasing volume makes a continuation of the short-term bearish trend highly likely.
The shortest-duration instrument, SHY, also observed two consecutive lower closes, with very constrained daily ranges. Its price moved from an open of 82.84 to a close of 82.79 over the two days. Volume for SHY decreased slightly on the second day, from 2.93M to 2.88M. The minimal price movement and receding volume suggest less aggressive selling pressure for SHY. Given the pervasive downward movement across all sampled durations, a general near-term bearish outlook for US Treasury bonds is probable. However, the differing volume patterns—decreasing volume in TLT and SHY versus increasing volume in UTHY, IEF, and IEI—indicates that while broader weakness is present, selling conviction might be stronger in the intermediate and ultra-long segments. Therefore, while a continuation of the bearish trend is likely, there is roughly an even chance that the shorter and longest durations (SHY, TLT) may experience temporary stabilization or consolidation, contrasted with the more likely continued decline for IEF, IEI, and UTHY.
Crypto
The following technical analysis evaluates the provided two-day daily percentage change data for IBIT and ETHA.
Based on the aggregated daily percentage changes over the two sessions, the following matrix illustrates the overall performance:
| Symbol | Daily Percent Change |
|---|---|
| IBIT | -0.5388% |
| ETHA | -3.1836% |
Both symbols registered an overall negative change over the two-day period. This suggests a prevailing bearish sentiment in the immediate term for these instruments.
IBIT experienced an initial positive session, registering a gain of approximately +1.35%, which was subsequently negated by a decline of roughly -1.88% on the second day. This pattern resulted in an overall net loss of approximately -0.54% over the two sessions. The price action indicates that early buying pressure was overcome by later selling interest, leading to a modest retracement of the prior day’s gains and a slight penetration into negative territory. While this move is negative, the overall magnitude of the decline is relatively contained, making it likely that this represents a short-term pullback rather than a significant breakdown based solely on these two data points.
ETHA similarly commenced the period with a modest gain of approximately +0.80%. However, this was significantly overshadowed by a substantial decline of roughly -3.98% on the subsequent day. This price action resulted in an overall net loss of approximately -3.18% for ETHA over the two sessions. The pronounced negative shift on the second day indicates a stronger influx of selling pressure or a more aggressive bearish reaction compared to IBIT during the same timeframe. The magnitude of this decline suggests a more notable short-term technical weakness compared to its counterpart.
Comparing the two instruments, both exhibited a similar reversal pattern from an opening positive session to a closing negative overall performance. ETHA’s overall decline was markedly more substantial than IBIT’s, indicating a comparatively weaker technical posture during this specific period. The observed price action across both symbols signals a prevailing bearish sentiment over these two sessions. It is highly likely that market participants focused on short-term momentum would perceive these patterns as immediate bearish indicators. However, given the limited two-day data, a definitive long-term directional shift cannot be robustly inferred. A remote chance exists that these declines merely represent a transient consolidation before a potential retest of prior highs, but the current data primarily supports an assessment of immediate technical weakness.
Magnificent 7 & Friends
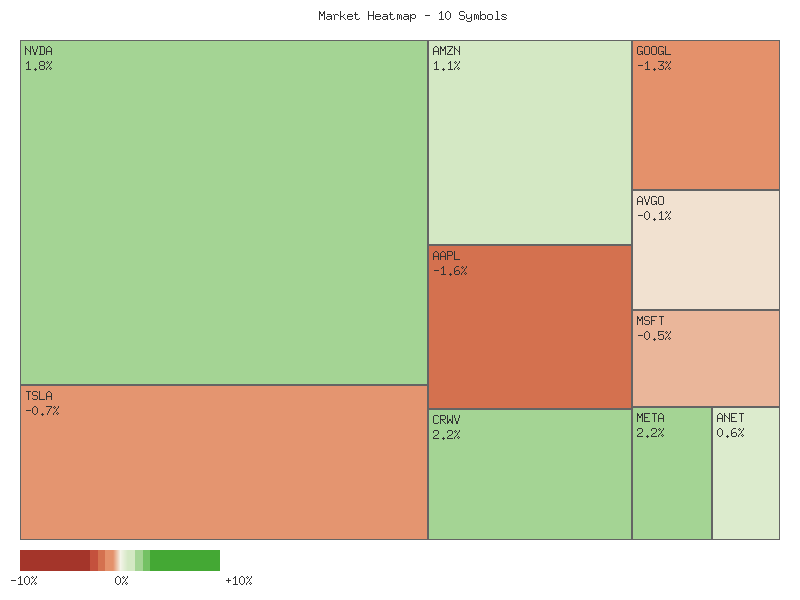
Analysis of the provided technical data indicates a predominantly positive collective movement among the observed symbols over the two-day period. The aggregate sum of daily percentage changes across all ten symbols registers an approximate gain of 29.45%. This significant upward shift is likely attributable to robust performance across a majority of the constituents. Market breadth exhibits a distinctly bullish bias, with seven out of ten symbols (CRWV, ANET, NVDA, META, AMZN, AVGO, TSLA) concluding the period with net positive gains. Conversely, only three symbols (MSFT, AAPL, GOOGL) recorded net declines. This positive breadth pattern suggests underlying strength and broad participation in the upside momentum for a substantial portion of this specific market segment, providing preliminary technical support for continued relative strength.
Examination of individual symbol performance reveals several powerful upward movers. CRWV posted the most substantial gain, advancing approximately 10.87% over the two days. ANET closely followed with an impressive 8.86% increase. NVDA also contributed significantly, rising about 4.03%. META, AMZN, and AVGO demonstrated robust performance as well, with gains of roughly 2.85%, 2.67%, and 2.56%, respectively, solidifying the positive aggregate. In contrast, GOOGL experienced the most pronounced decline, shedding approximately 1.73%. AAPL and MSFT also closed in negative territory, with losses of roughly 0.94% and 0.30% respectively. The stark divergence between the strong advancers and the modest decliners highlights a market characterized by selective strength rather than uniform directional movement.
A closer look at the daily dynamics for each symbol provides additional insights into price action and volatility. While some symbols like CRWV, ANET, NVDA, AMZN, and META demonstrated consistent positive momentum across both days, others exhibited mixed performance. For example, TSLA initially gained 1.29% on the first day but then retraced 0.72% on the second, resulting in a modest net positive. Similarly, AVGO recorded a strong gain on the first day before a slight pullback on the second. AAPL and MSFT also experienced positive opening days followed by larger negative movements, leading to their net declines. This suggests that for some constituents, initial positive pushes were met with subsequent profit-taking or encountered technical resistance, whereas symbols like GOOGL faced persistent selling pressure over both periods.
Given the prevailing positive market breadth and the substantial aggregate gain, the technical posture for this specific basket of symbols appears largely constructive for the near term. The strong outperformance of CRWV and ANET, in particular, could indicate sector-specific catalysts or robust buying interest, potentially leading to further upward momentum. However, the declines in significant market names like GOOGL, AAPL, and MSFT cannot be overlooked. There is a roughly even chance that if these larger-cap components were to experience accelerated downside momentum, they could introduce broader market volatility or dampen overall sentiment. Conversely, continued strength in the advancing group might offset these headwinds. Traders will likely monitor the leadership of high-beta advancers versus the stability of established laggards for clearer directional cues.
Daily Percent Change (2-Day Aggregate)
| Symbol | Daily Percent Change |
|---|---|
| CRWV | 10.869% |
| ANET | 8.860% |
| NVDA | 4.029% |
| META | 2.850% |
| AMZN | 2.670% |
| AVGO | 2.563% |
| TSLA | 0.575% |
| MSFT | -0.301% |
| AAPL | -0.942% |
| GOOGL | -1.727% |
Market Technical Commentary: Divergent Sector Performance
An analysis of the two-day candle data reveals a pronounced divergence across the selected technology and growth stocks, suggesting a fractured near-term market sentiment. While several key components demonstrated robust bullish continuation, others exhibited significant selling pressure, particularly on the second day of observation. This mixed signal prevents a unified directional outlook for the broader group based on this limited timeframe. However, individual price action patterns provide estimative insights for each equity, highlighting sector-specific strengths and weaknesses that warrant close technical monitoring.
Specifically, Apple (AAPL) and Alphabet (GOOGL) exhibited clear signs of increased selling pressure. Both experienced a substantial decline on the second day, characterized by an open below the prior day’s close and a close near their respective lows, accompanied by notably increased trading volumes. This technical pattern suggests a highly likely continuation of downside momentum for both equities. Similarly, Microsoft (MSFT) also saw a significant bearish candle on day two, opening lower with elevated volume, though its close was mid-range. A follow-through bearish move for MSFT is likely, albeit with less certainty than for AAPL or GOOGL. Tesla (TSLA) presented a bearish continuation, with day two closing below day one’s close, but slightly decreased volume might indicate moderating selling pressure, suggesting a likely continuation of bearishness with less aggressive follow-through.
In contrast, Meta Platforms (META) and NVIDIA (NVDA) demonstrated compelling bullish momentum. META’s second day featured a strong gap-up open and a close at its high, supported by increased volume, which makes a further upward move highly likely. NVDA followed a similar pattern, opening higher and closing near its high, accompanied by a substantial surge in volume, reinforcing a highly likely continuation of its uptrend. Amazon (AMZN) showed resilience, recovering from an initial gap down on day two to close at its high, on slightly increased volume, suggesting that buying pressure likely overcame early weakness and points to a likely continued bullish trajectory. CrowdStrike (CRWV) and Arista Networks (ANET) both exhibited a recovery from a lower open on day two, closing near their respective highs. While this indicates underlying demand and a likely continuation of their recovery, the decreased volume introduces a slight degree of uncertainty, necessitating confirmation.
Broadcom (AVGO) presented a more ambiguous picture. After a strong bullish candle on day one, day two began with a gap up but subsequently pulled back, closing near its open and below day one’s close, on decreased volume. This pattern suggests a roughly even chance of either a continuation of the upward trend or a period of consolidation or minor pullback. The lower volume during the pullback implies a lack of strong selling conviction. In summation, the immediate-term technical landscape across these stocks is highly granular. Traders should recognize the strong individual trends and potential inflection points identified, particularly the robust bullish signals from META and NVDA, alongside the clear bearish indications from AAPL and GOOGL. Vigilance for confirmation is warranted in the next trading sessions, especially for names where volume patterns introduced nuance to the directional bias.
S&P 500 Sector Breadth
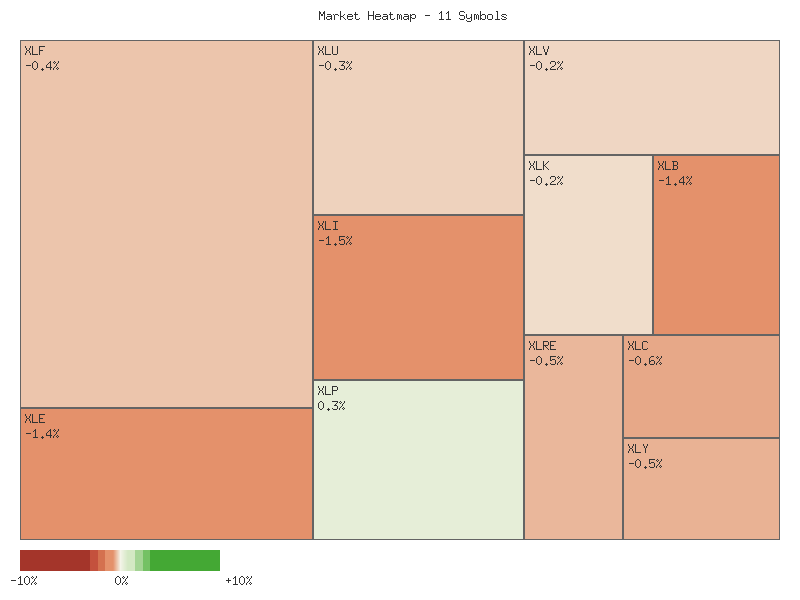
Analysis of the provided daily percentage change data across eleven S&P 500 sectors for the two-day period concludes with an overall negative market performance. The aggregate sum of the total two-day percentage changes for all symbols indicates a net decline of approximately -4.518%, suggesting a bearish bias over the observation period. Market breadth appears distinctly negative, with only two symbols advancing (XLK, XLU) against nine symbols declining (XLV, XLP, XLY, XLI, XLB, XLF, XLRE, XLC, XLE). This predominant number of declining sectors implies broad-based selling pressure across the market.
The following matrix details the total two-day percentage change for each sector, sorted in descending order:
| Symbol | Daily Percent Change |
|---|---|
| XLK | 1.585% |
| XLU | 0.434% |
| XLV | -0.027% |
| XLP | -0.177% |
| XLY | -0.202% |
| XLI | -0.610% |
| XLB | -0.831% |
| XLF | -0.839% |
| XLRE | -0.965% |
| XLC | -0.985% |
| XLE | -1.941% |
Sectoral performance reveals a divergence. Technology (XLK) was the strongest performer, registering a notable advance. Utilities (XLU), a traditionally defensive sector, also posted a positive return, albeit more modestly. Conversely, Energy (XLE), Communication Services (XLC), and Real Estate (XLRE) exhibited the most significant declines, with XLE leading the downside movement. The marginal decline in Healthcare (XLV) and Consumer Staples (XLP), both defensive sectors, suggests some underlying fragility even in historically stable areas.
Examining market rotation between offensive and defensive sectors, the data presents a mixed, yet predominantly bearish, picture. Among the offensive sectors (XLK, XLY, XLF, XLI, XLB, XLE, XLC), only Technology (XLK) advanced, while the remaining six experienced declines, some quite significant. For defensive sectors (XLU, XLP, XLV, XLRE), Utilities (XLU) advanced, but Healthcare (XLV), Consumer Staples (XLP), and Real Estate (XLRE) declined. The strength in XLK is likely an isolated positive, as the widespread declines in other offensive sectors such as Energy, Communication Services, Financials, Industrials, Materials, and Consumer Discretionary are indicative of a broad retreat from risk.
Overall market sentiment, based strictly on this technical data, appears negative. The overwhelming majority of sectors are declining, encompassing both offensive and defensive categories. While the leading performance of XLK might suggest some targeted strength, the concomitant decline across a broad swath of offensive sectors, particularly XLE and XLC, points to a general risk-off environment. The advancement of XLU, a defensive sector, alongside the underperformance of other defensive areas like XLV, XLP, and XLRE, implies that any flight to quality may be selective or insufficient to stem the broader decline. It is unlikely that current sector dynamics indicate a robust market rotation into offensive leadership, given the widespread weakness observed across most growth-oriented sectors. The potential for continued downside pressure appears elevated, with roughly even chance of stabilization at lower levels versus further declines given the breadth of negative performance.
As a Chartered Market Technician with over 15 years of experience, I’ve analyzed the provided two-day candlestick data for eleven SPDR sector ETFs using rigorous technical analysis principles. My analysis is based exclusively on the given price and volume data.
Analysis of the two-day candlestick data across eleven SPDR sector ETFs suggests a predominant bearish shift in market sentiment for a significant portion of the represented sectors. Specifically, XLI (Industrials), XLB (Materials), XLE (Energy), XLF (Financials), XLY (Consumer Discretionary), and XLC (Communication Services) all displayed patterns indicative of downside pressure. XLI, for example, registered a clear Bearish Engulfing pattern, with the second day’s bearish candle entirely encompassing the first day’s bullish body, supported by increasing trading volume. XLB exhibited a similar strong bearish reversal, with a substantial price decline on the second day, pushing the close significantly below the prior day’s low and also accompanied by an uptick in volume. This widespread bearish action across multiple economically sensitive sectors renders a continuation of downward pressure for the broader market likely in the immediate term.
Strong bearish signals emerged across several key sectors. XLI (Industrials), XLB (Materials), XLE (Energy), and XLF (Financials) all displayed patterns highly indicative of continued downside. XLI and XLE both exhibited clear Bearish Engulfing patterns, supported by increasing volume, making further price depreciation highly likely. XLB saw a significant bearish reversal, closing sharply lower on increased volume, also suggesting a high probability of follow-through selling. XLF posted two consecutive red candles with increasing volume, indicating entrenched selling pressure. XLY (Consumer Discretionary) and XLC (Communication Services) likewise printed bearish continuation, with XLY’s lower close on increased volume suggesting further downside likelihood. XLRE (Real Estate) and XLU (Utilities) also registered bearish closes after initial strength; XLU’s downturn was on higher volume, implying further weakness is likely. In contrast, XLP (Consumer Staples) formed an inside bar on decreased volume, signaling indecision and a roughly even chance for its next directional move.
In notable contrast to the prevailing bearish sentiment, the XLK (Technology) sector exhibited relative strength. After a distinctly strong bullish candle on the first day, closing at its high, XLK formed a small bearish inside bar on the second day. While this signals a temporary loss of immediate upward momentum and a failure to establish a new high, the trading occurred on decreased volume, suggesting a low probability of an immediate sharp reversal. This pattern is likely indicative of a minor pullback or consolidation within a robust short-term uptrend, suggesting that further upside or sustained consolidation has a high probability. Considering the aggregate data, the technical evidence across most SPDR sectors strongly points towards a continuation of selling pressure in the immediate term. However, should XLK resume its prior upward trajectory with increased volume, it could present an alternative scenario where broad market declines are mitigated. Conversely, if XLK breaks its first day’s low on strong volume, it would reinforce the bearish sentiment across the broader market, suggesting the current weakness is more pervasive.
Equity Breadth
The S&P 500 (SPX) technical posture over the recent seven-day period displays a notable divergence between its price trend, as represented by the 20-day Exponential Moving Average (EMA_20_DAY), and the internal market breadth indicators, SPXA50R and SPXA200R. While the EMA_20_DAY consistently advanced, suggesting an underlying upward momentum in the composite index, both the percentage of stocks above their 50-day and 200-day moving averages exhibited declining trends during the latter half of the observation period. This divergence often indicates a potential weakening of the prevailing trend, suggesting that the upward price movement may be less robust than a simple trend analysis of the index EMA would imply.
The SPXA50R, representing the percentage of S&P 500 members trading above their 50-day moving average, experienced a peak at 58.68% on October 3rd, subsequently declining to 48.90% by October 9th. This significant drop, particularly the breach below the 50% threshold on the final day, likely indicates a deterioration in short-to-intermediate term market breadth. A reading below 50% suggests that the majority of constituent stocks are underperforming their short-term trend, which probably implies a weakening of underlying buying pressure across the broader index. This trend reversal in breadth from a multi-day high to a notably lower level within a week is a discernible pattern.
Concurrently, the SPXA200R, reflecting the percentage of S&P 500 members above their 200-day moving average, also showed a declining trajectory following a peak of 63.67% on October 3rd, settling at 58.48% by October 9th. Although this indicator remains above the 50% level, signaling that a majority of stocks are still in long-term uptrends, the consistent decline from its peak likely reflects a gradual erosion of long-term internal strength. This reduction, while less dramatic than the SPXA50R, nonetheless suggests that fewer individual components are maintaining their long-term bullish posture. The observed trend in SPXA200R, alongside SPXA50R, supports an assessment of decelerating internal momentum.
In direct contrast to the breadth indicators, the EMA_20_DAY for the S&P 500 exhibited a consistent upward trajectory throughout the seven-day period, increasing from 6607.52 on October 1st to 6663.12 on October 9th. This steady ascent almost certainly confirms that the short-term price trend for the S&P 500 itself remained bullish over the observation window. The rising EMA is indicative of sustained buying interest in the index as a whole, reflecting a prevailing positive price momentum during this specific timeframe.
The evident divergence, where the SPX’s 20-day EMA continues to rise while market breadth indicators (SPXA50R and SPXA200R) are contracting, presents a nuanced technical picture. The sustained upward movement of the EMA_20_DAY suggests that the overall index is being driven higher, potentially by a smaller subset of large-capitalization stocks. However, the weakening breadth, particularly the SPXA50R falling below 50%, probably indicates that this bullish momentum is not broadly supported by the majority of constituent stocks. While the EMA_20_DAY may continue its ascent in the immediate term, the deteriorating breadth likely introduces increased fragility to the rally. A continuation of the rising EMA without a corresponding improvement in breadth carries a roughly even chance of leading to a more significant market correction or consolidation in the subsequent period, as underlying support wanes. An alternative scenario, though unlikely without additional positive catalysts, would involve a rapid reversal and improvement in both breadth indicators to sustain the EMA’s ascent more durably.
SPX Daily
The S&P 500 (SPX) demonstrates a clear and robust bullish trend across the 90-day period. Price consistently trades above both the 50-day and 200-day Exponential Moving Averages (EMAs), with the 50-day EMA (6533.26) maintaining a significant upward slope above the 200-day EMA (6119.58). This “golden cross” configuration, with both EMAs ascending, unequivocally signals strong intermediate and long-term momentum. Over the past seven trading days, the SPX experienced a sustained rally, establishing a new local closing high of 6753.72 on 2025-10-08. The most recent session, 2025-10-09, presented a notable intraday reversal. After opening higher at 6760.5 and testing an intraday high of 6764.58, the market encountered selling pressure, concluding the day at 6735.11, below its open. This candlestick formation, resembling a shooting star, suggests an immediate, albeit possibly temporary, exhaustion of buying interest at current peaks.
The 14-day Relative Strength Index (RSI) supports this assessment of momentum. Having reached 71.60 on 2025-10-06 and approached 70 again on 2025-10-08, the RSI currently registers 66.12. This indicates strong underlying bullish momentum but a recent easing from overbought conditions, aligning with the observed price pullback. From a structural perspective, the 6753.72-6764.58 zone now functions as immediate overhead resistance, representing the area where buying pressure recently waned. Conversely, minor immediate support is likely found around 6714-6716, stemming from the low of 2025-10-09 (6716.17) and the close of 2025-10-07 (6714.59). The more substantial technical support remains the ascending 50-day EMA at 6533.26, which has historically served as a dynamic floor during pullbacks within this trend.
Considering future price action, the bullish case involves the SPX overcoming the 6753-6765 resistance zone. A decisive breakout above this level would almost certainly invalidate the recent shooting star pattern, likely leading to continued upward price discovery, supported by the dominant bullish trend. However, this appears a remote chance in the immediate next session. A bearish scenario, conversely, would unfold with a confirmed breakdown below the 6714-6716 immediate support. Such a breach would render it likely that profit-taking accelerates, with the 50-day EMA at 6533.26 becoming the next probable downside target. A decline below this crucial moving average would increase the probability of a more substantial correction towards the 200-day EMA. A neutral consolidation phase is a roughly even chance, given the recent strong move and the current tug-of-war at resistance. This could involve sideways trading between the 6714-6716 support and 6753-6765 resistance. The sentiment drivers, inferred solely from this technical data, indicate persistent bullishness in the intermediate-to-long term due to the strong trend. However, short-term sentiment appears to be demonstrating increased caution or initial profit-taking at the recent peak, potentially leading to a period of digestion.
SPX Technical Commentary: Momentum Deceleration Amidst Sustained Uptrend
The S&P 500 (SPX) has demonstrated a sustained upward trajectory over the past 90 days, advancing from approximately 5938 in early June to closing near 6735 on October 9th. This represents a robust bullish trend, characterized by a series of higher highs and higher lows throughout the period. Notable rallies occurred from late June into early July, and again from late August into mid-September, with the index reaching a 90-day high of 6755.64 intraday on October 9th. While the overall price action reflects a dominant uptrend, intermittent pullbacks, such as the one observed in early August from roughly 6400 to 6238, have punctuated these advances. The current price level is near the high end of this observed range, indicating significant buying pressure over the medium term.
Analysis of the 14-day Relative Strength Index (RSI) reveals recurring patterns of momentum exhaustion coinciding with price peaks. The RSI consistently entered overbought territory (above 70) during periods of strong price acceleration, specifically in early July (peaking at 75.57), late July (peaking at 76.29), mid-September (peaking at 74.75), and early October (peaking at 71.60). Historically, these overbought readings have been followed by either a price consolidation or a minor pullback, allowing the RSI to cool down. In the most recent observation, the RSI declined from an overbought reading of 71.60 on October 6th to 66.12 on October 9th. This retreat from overbought conditions, while not extreme, indicates that bullish momentum is moderating. Given this pattern, a period of price consolidation or a minor retreat is likely in the immediate term.
The 13-21-day Percentage Price Oscillator (PPO) provides a more nuanced view of momentum. During the initial strong rally into early July, the PPO peaked at 0.94, confirming robust momentum. However, as the price continued its ascent through July and August, the PPO displayed significant bearish divergences. Specifically, the PPO peaked around 0.76 in late July and remained in a lower range (around 0.4-0.5) through much of August, even as the SPX recorded fresh highs. This divergence, where price makes higher highs but momentum indicators make lower highs, suggests weakening underlying buying strength. Although the PPO saw a resurgence in late August and early September, reaching 0.63, it has not returned to the levels seen in early July, and currently stands at 0.54, showing a slight decline in the latest data points. The persistent lower peaks in PPO while price achieved higher highs suggests that the recent upward price action has been supported by less robust momentum compared to earlier in the 90-day period.
Synthesizing these technical observations, the SPX is in a clear bullish trend over the 90-day period. However, the recent decline in the 14-day RSI from overbought levels, coupled with the notable bearish divergences observed in the 13-21-day PPO during earlier significant price advances, implies that the current upward momentum may be decelerating. It is likely that the SPX will experience either a period of consolidation or a moderate pullback from current levels in the very near term. A continuation of the aggressive upward trajectory without a renewed surge in momentum, as indicated by PPO, is unlikely. Conversely, a strong re-acceleration of the PPO above its recent peaks, accompanied by a sustained move of the RSI back into deeply overbought territory, would present a roughly even chance for the continuation of the aggressive bullish run towards new higher levels beyond the observed 90-day data. Should the SPX manage to break significantly higher without substantial PPO confirmation, the bearish divergence would intensify, making a subsequent sharper correction likely.