Daily Market Technical Analysis
Market Overview
The market experienced a robust recovery on October 8th, with most indices posting gains, reversing prior bearish sentiment; large-cap OEF’s immediate upside is almost certain. However, underlying divergences signal caution: QQQ exhibits bearish PPO/RSI divergences and overbought conditions, making near-term consolidation likely. While SPX maintains a strong uptrend, a minor correction is a roughly even chance. Precious metals (GLD, SLV) show likely continued upward momentum, contrasting with highly likely continued downward pressure for Natural Gas (UNG). In bonds, short-duration instruments like SHY face likely downward pressure. Overall equity breadth is narrowing, suggesting further index gains face a roughly even chance of deceleration from current highs.
Market Indices
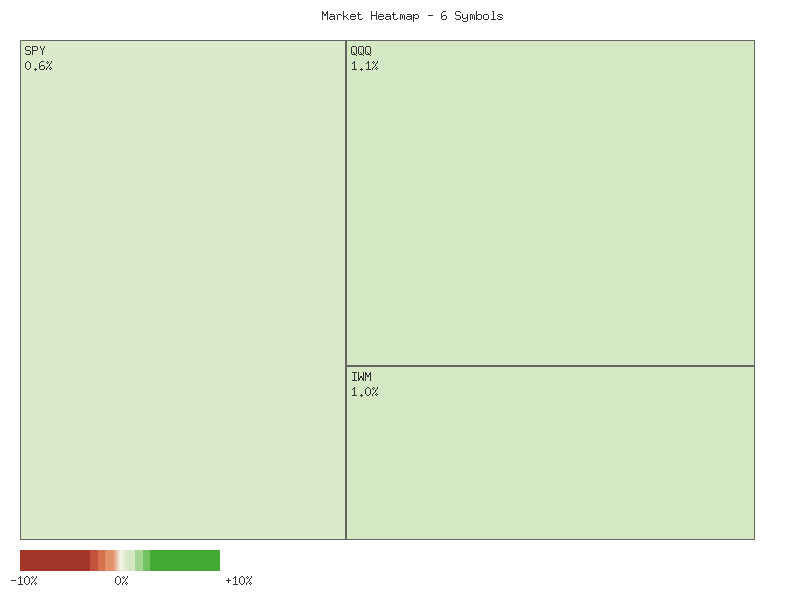
The market observed on October 8, 2025, exhibited a strong positive performance across the analyzed major U.S. indices and exchange-traded funds. The following matrix displays the daily percent change for each symbol, sorted in descending order:
| Symbol | Daily Percent Change |
|---|---|
| QQQ | 1.146% |
| IWM | 1.048% |
| MDY | 0.991% |
| IJR | 0.913% |
| OEF | 0.628% |
| SPX | 0.583% |
The aggregate daily percent change for these six symbols sums to approximately +5.309%, indicating the market for these specific indices was unequivocally overall higher for the session. This broad-based positive movement suggests a day characterized by robust buying interest.
Market breadth, as assessed by the observed symbols, was overwhelmingly positive on October 8. All six symbols—SPX, QQQ, IJR, IWM, MDY, and OEF—registered advances, with zero symbols declining. This suggests strong participation across various market capitalizations, including large-cap (SPX, OEF, QQQ), mid-cap (MDY), and small-cap (IJR, IWM) segments. Such uniform positive breadth is often interpreted as a sign of underlying strength, indicating that the rally was not confined to a few dominant segments.
Concurrent with the equity market’s advance, the CBOE Volatility Index (VIX) experienced a notable reversal. On October 7, the VIX registered a significant daily increase of approximately 5.31%. This move suggested an uptick in perceived near-term market risk. However, on October 8, the VIX declined sharply by approximately 5.45%, concluding the session at 16.30. This inverse correlation—equities rising as VIX falls—is a characteristic market dynamic, implying that the perceived risk premium contracted significantly during the latest session.
Analyzing the VIX’s 7-day candle data, it traded within a range from approximately 15.93 to 17.55. The VIX closed October 7 at 17.24, near the upper end of its recent range and testing overhead resistance, before experiencing a sharp decline on October 8 back towards the middle of this range. Given the VIX’s latest close at 16.30, remaining above the absolute lows of the past week but significantly off the recent high, it is likely that market participants are currently factoring in a moderate level of implied volatility. If the VIX continues its decline from the 16.30 level, it would likely support continued positive sentiment for equity markets. Conversely, a renewed advance in the VIX, particularly if it were to sustain above 17.00, would suggest an increasing level of uncertainty and could challenge the recent equity gains, representing a roughly even chance of increased volatility reasserting itself in the near term.
As a CMT with over 15 years of experience, my analysis of the provided two-day market data across several key ETFs reveals a predominantly constructive, albeit nuanced, technical picture. All six instruments – SPY, QQQ, IWM, IJR, MDY, and OEF – exhibited a decline on the first day followed by a significant recovery on the second day. The second day’s price action generally negated the bearish sentiment of the first, with all closing prices on the second day being higher than their respective prior day’s closes. This broad-market rebound suggests that near-term downside pressure is likely easing, potentially setting a more positive tone for the immediate future.
A closer examination of the large-cap oriented ETFs, specifically SPY, QQQ, and OEF, shows particularly robust bullish reversal action on the second day. QQQ and OEF, in particular, demonstrated strong price recovery, with their second-day closes exceeding their first-day opens, effectively reclaiming the entire range of the previous bearish session. OEF stands out in this group as it was the sole ETF to show an increase in trading volume on its bullish recovery day. This volume confirmation for OEF lends a higher degree of conviction to its upward momentum compared to SPY and QQQ, where the bullish price action on the second day occurred on noticeably lower volume. While the price action for SPY and QQQ is compelling, the declining volume could imply that buying pressure might be somewhat constrained, presenting a roughly even chance of follow-through buying or a pause.
The mid-cap and small-cap segments, represented by MDY, IWM, and IJR, also demonstrated constructive price action on the second day. MDY, the mid-cap ETF, showed a strong piercing-like pattern, with its second-day close recovering a substantial portion of the first day’s decline, approaching its prior open. IWM and IJR, the small-cap proxies, also produced positive second days, closing above their first-day midpoints and indicating a bullish recovery. However, similar to SPY and QQQ, the volume for MDY, IWM, and IJR decreased on their respective up days. This collective volume characteristic suggests that while the immediate selling pressure in these segments has receded, the conviction behind the buying interest appears less emphatic than what was observed in OEF, introducing a degree of uncertainty regarding the sustainability of this bounce.
The disparity in volume characteristics between OEF and the other ETFs is a key technical signal. OEF’s increased volume on its strong up day significantly enhances the reliability of its bullish signal, making further upside continuation for this specific large-cap index almost certain in the immediate very near-term, assuming no significant shifts in subsequent trading. For the rest of the market, the lower volume accompanying the price rebound presents a caution flag. While a continuation of the upward momentum is likely, the absence of strong volume confirmation across SPY, QQQ, IWM, IJR, and MDY raises the possibility of a temporary relief rally rather than the initiation of a sustained upward trend.
Given the data, it is likely that the market, as represented by these ETFs, has experienced a near-term sentiment shift from bearish to cautiously bullish. The strong price reversals across the board are encouraging. However, the predominantly declining volume on the up days for all but OEF suggests that further analysis on subsequent days will be crucial to confirm the underlying strength of this recovery. An alternative scenario, should volume not pick up on future up moves, is that the current bounce could be susceptible to renewed selling pressure, although the immediate technical posture suggests the path of least resistance is presently upward for most instruments, especially OEF.
As a Chartered Market Technician with over 15 years of experience, I offer the following technical analysis of the SPX based solely on the provided 90-day candle, RSI_14_DAY, and PPO_13_21_DAY data.
The SPX has exhibited a robust and sustained bullish trajectory over the past 90 days, advancing consistently from approximately 5896 at the start of June to 6753 by early October. This clear uptrend is characterized by a persistent series of higher highs and higher lows, illustrating a dominant bullish sentiment. A notable, albeit temporary, interruption to this upward momentum occurred from late July into early August, during which the index experienced a pronounced pullback from highs around 6427 down to approximately 6212. However, this dip was quickly absorbed by buying interest, allowing the SPX to promptly resume its ascent and establish new short-term resistance levels, most recently near 6750. The overarching price action strongly indicates that buyers have maintained firm control throughout this period, consistently overcoming brief selling pressures and propelling the index to fresh peaks.
Analysis of the 14-day Relative Strength Index (RSI) largely reinforces the prevailing bullish environment. The RSI has frequently ventured into overbought territory (above 70) during this 90-day span, specifically in late June/early July (peaking at 75.57), late July (peaking at 76.29), mid-September (peaking at 74.75), and most recently touching 71.60 in early October. These periods of overbought readings typically preceded brief phases of price consolidation or minor pullbacks, such as the early August decline, which served to reset the indicator without triggering a significant trend reversal. It is noteworthy that the RSI has not approached oversold levels (below 30) at any point within the observed timeframe, further underscoring the consistent underlying buying pressure. Currently, the RSI stands at 69.90, signifying strong momentum but also indicating that the index is again nearing overbought conditions.
The Price Percentage Oscillator (PPO) with 13 and 21-day parameters provides additional confirmation of the trend’s strength and momentum. A key observation is that the PPO has remained consistently positive throughout the entire 90-day period. This consistently positive reading unequivocally signifies that the shorter-term exponential moving average has been continuously above the longer-term EMA, pointing to an enduring bullish trend. While the PPO maintained its positive posture, its trajectory was not uniform. A noticeable deceleration in momentum occurred from late July, with the PPO declining from a peak near 0.93 to a low around 0.38 by mid-August, even as the price attempted higher highs in late July. This suggested a bearish divergence in momentum, which was subsequently resolved by the price pullback in early August. Following this correction, the PPO has shown a renewed upward trajectory since early September, rising from a low of 0.329 to its current value of 0.559, reflecting a resurgence in bullish momentum, though at levels below its earlier peaks.
In conclusion, the integrated technical picture for the SPX suggests it remains firmly embedded in an upward trend. The sustained price appreciation, supported by a continuously positive PPO, indicates robust underlying bullish control. The RSI’s frequent but contained entries into overbought territory imply a market characteristically prone to rallies followed by temporary consolidations rather than abrupt reversals. Given the ongoing positive momentum, a continuation of the upward trend is likely. However, considering the RSI’s proximity to overbought conditions and the PPO’s current levels being below its prior peak enthusiasm, a near-term period of sideways consolidation or a minor price correction is a roughly even chance before further significant upside. A substantial bearish reversal appears unlikely in the absence of a more pronounced breakdown in the PPO trend or the formation of strong bearish price patterns that breach key support levels. Market participants should remain vigilant, monitoring the established resistance near 6750 and observing how price reacts to potential pullbacks for signs of continued strength.
QQQ Technical Analysis: October 8, 2025
The Invesco QQQ Trust (QQQ) has demonstrated a pronounced uptrend over the past 90 days, with price action moving from approximately in early June to a recent close of .44 on October 8. This sustained ascent is characterized by a series of higher highs and higher lows, indicative of strong underlying demand. Key resistance levels, such as the peak around in mid-August and in late September, have been successfully overcome. While the overall trend is unequivocally bullish, the analysis of momentum and overbought conditions suggests an increasing likelihood of a near-term consolidation or minor pullback. Volume analysis indicates periods of both strong accumulation and significant distribution at higher price points, particularly during the sharper pullbacks observed in early August and late September.
Current momentum, as measured by the Percentage Price Oscillator (PPO) with 13 and 21-day EMAs, remains positive. The PPO value on October 8 stands at 0.759, which is above the zero line, confirming that the short-term average is above the longer-term average and thus indicative of bullish momentum. This positive PPO, however, has not matched its previous peaks seen earlier in the 90-day period (e.g., 1.38 in early June). More critically, while QQQ recorded a higher price high on October 8 compared to its September 22 peak (.44 vs. .20), the PPO registered a lower high (0.759 vs. 0.804). This bearish divergence between price and momentum suggests that the underlying buying pressure supporting the recent price rally may be diminishing, increasing the probability of a loss of upward momentum in the near term.
Complementing this observation, the 14-day Relative Strength Index (RSI) on October 8 registered 70.47. This level places QQQ squarely in overbought territory, signaling that the asset has experienced strong upward price movements and may be susceptible to a correction. Historically within this 90-day period, such elevated RSI readings (e.g., 72.40 on June 30, 73.11 on July 28, and a peak of 75.35 on September 22) have frequently preceded periods of consolidation or brief pullbacks. Furthermore, a significant bearish divergence is also observed on the RSI: as QQQ achieved a higher price high on October 8, the RSI’s corresponding reading (70.47) was lower than its September 22 peak (75.35). This dual divergence across both PPO and RSI provides a strong technical signal that price appreciation may be encountering headwinds.
Considering these indicators, we judge it likely that QQQ will experience a period of consolidation or a minor price correction in the immediate future. The pronounced bearish divergences on both the PPO and RSI, combined with the overbought RSI condition, significantly increase this probability. Alternative scenarios include a continuation of the rally, which would require a decisive break above current levels on increasing volume and a reversal of the observed divergences. However, based solely on the provided data, the technical setup suggests that traders should exercise caution. A failure to hold current levels or a breach of near-term support would reinforce the bearish divergence signals and could lead to a deeper retracement within the established bullish trend.
Technical Analysis: IWM (Russell 2000 ETF) - 90-Day Outlook
Over the past 90 days, the iShares Russell 2000 ETF (IWM) has demonstrated a pronounced upward trend, establishing a series of higher highs and higher lows. Notable price rallies include a strong move from approximately in late June to a peak near in mid-July, and a more recent surge in mid-August propelling the price from to over . A significant upward acceleration was observed in mid-September, pushing IWM to a period high of .57, with volume spikes reinforcing these strong advances, particularly on September 17th and 18th. Following a brief but sharp pullback in late September, IWM has since regained its footing, reaching new highs around in early October. The latest candle on October 8th, characterized by a lower open, a dip, and a strong close near its high (a hammer-like pattern), suggests renewed buying interest after a minor decline, potentially indicating a continuation of upward momentum. Key support levels appear to be forming around .50-.00 and .00, while resistance is established around the recent highs of .00.
The 14-day Relative Strength Index (RSI) has largely mirrored the price action, providing reliable insights into momentum shifts. Periods where the RSI entered overbought territory (above 70), such as on July 3rd (71.57) and September 18th (71.23), were subsequently followed by price consolidations or minor pullbacks. This suggests that these overbought conditions likely signaled a temporary exhaustion of buying pressure. Conversely, the RSI’s dip to 41.36 on August 1st, while not traditionally oversold, coincided with a significant price low from which IWM initiated a powerful rally. Currently, the RSI stands at 64.44. This level indicates strong underlying momentum but suggests that IWM is not yet in an overextended state, implying that there is likely still room for further appreciation before traditionally overbought conditions make a pullback more probable.
The 13,21-day Percentage Price Oscillator (PPO) has served as an effective barometer for trend strength and direction changes throughout the observation period. Bullish momentum shifts, indicated by the PPO crossing above its zero line, have consistently preceded significant upward price movements. For example, the PPO’s positive crossover around June 23rd heralded a substantial rally into early July, and another decisive bullish crossover around August 12th marked the beginning of a robust multi-week advance. Conversely, bearish momentum shifts, specifically the PPO crossing below zero on July 30th and September 25th, accurately foreshadowed noticeable price corrections, with the July 30th signal preceding the most significant pullback of the 90-day window. The PPO currently registers a positive value of 0.72, having recently crossed back above its zero line around October 2nd-3rd. This positive reading suggests that IWM has likely re-established short-term bullish momentum following the late September dip, indicating a renewed upward bias.
Synthesizing these technical indicators, the immediate outlook for IWM appears cautiously bullish. The persistence of the overall uptrend, combined with the recent bullish crossover in the PPO and a moderately strong RSI value, suggests that a continuation of the upward trajectory is likely in the near term. We anticipate IWM will likely retest its recent high around .00 and may attempt to push higher. However, alternative scenarios should be considered. Should IWM encounter strong resistance at the .00 level and fail to achieve a decisive breakout, a period of consolidation or a minor pullback is a roughly even chance, especially if the RSI approaches the 70-mark. A more significant technical concern would emerge if IWM were to decline below the immediate support at .50-.00, particularly if accompanied by a renewed bearish PPO crossover; such a development would make a deeper correction, potentially towards the .00 level, likely. Given the demonstrated resilience after prior pullbacks and the current momentum readings, the probability of an immediate significant reversal is unlikely, favoring continued, albeit potentially measured, upside.
Tech Sector Analysis
The QQQ/SPY 30-day ratio exhibits an “up” trend, indicating QQQ’s outperformance relative to SPY over this longer timeframe. However, the trend strength is categorized as “weak,” suggesting the upward momentum, while present, lacks significant conviction. Over this period, the ratio has appreciated by 2.423%, moving from a low of 0.88340 to its current high of 0.90838. The current ratio stands at the highest point observed within the 30-day period, which is a notable technical characteristic. The volatility, measured at 0.0000506, indicates relatively contained price movements despite the overall upward trajectory.
In contrast, the QQQ/SPY 14-day ratio displays a “sideways” trend, also described as “weak” in strength. This shorter-term perspective suggests a period of consolidation following the more pronounced upward movement seen over 30 days. The ratio’s change over the last 14 days is a modest 0.591%. The 14-day range is tighter, extending from a low of 0.90050 to the current high of 0.90838. Consistent with the 30-day view, the current ratio also sits at its 14-day high. The significantly lower volatility for the 14-day period (0.00000387) implies a compression of price action and reduced daily fluctuations, reinforcing the idea of a consolidating market for relative performance.
The divergence between the 30-day “up” trend and the 14-day “sideways” trend is a critical observation. The longer-term outperformance of QQQ appears to have transitioned into a period of short-term consolidation, albeit with the ratio maintaining its elevated position. Given that the current ratio is at the highest point of both the 14-day and 30-day observation windows, there is a likely chance of continued QQQ outperformance in the immediate term, as the momentum has propelled the ratio to its upper boundary. However, the weak trend strength observed in both timeframes implies that any further outperformance may be gradual rather than explosive.
Considering the weak trend strength and the “sideways” consolidation in the 14-day window, an alternative scenario presents a roughly even chance that the ratio might experience a short-term pullback or further consolidation from its current high before a definitive directional move. Technical patterns often see reversals or corrections after reaching a local peak, especially when the underlying trend strength is weak. Therefore, while continued outperformance is likely, a temporary abatement of upward pressure should not be discounted, potentially leading the ratio towards its 14-day average of 0.90294. Traders should monitor for a sustained breakout above the current high to confirm further outperformance or a breach below recent support levels for a potential shift in relative strength.
Technical Analysis: QQQ/SPY Relative Strength (90-Day Outlook)
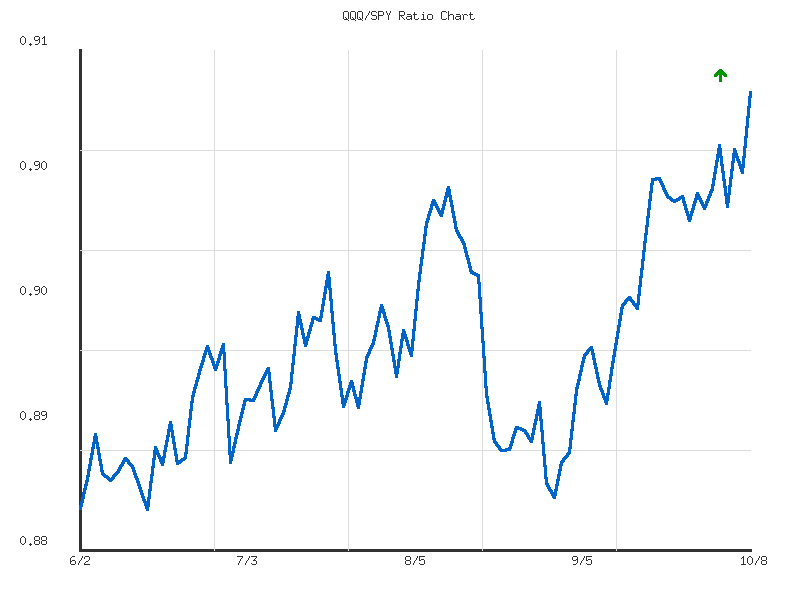
This analysis focuses exclusively on the provided 90-day ratio data for QQQ relative to SPY, from early June to early October 2025. Over this period, the QQQ/SPY ratio has exhibited a clear upward trend, moving from approximately 0.8827 at the start of June to its current level of 0.90838. This represents a 2.90% increase, indicating that the NASDAQ 100 ETF (QQQ) has, on balance, outperformed the S&P 500 ETF (SPY) during this timeframe. The current ratio stands at its 90-day high, suggesting a recent breakout in relative strength.
Despite the unambiguous upward direction, the calculated trend strength is described as “weak.” This implies that while the ratio has consistently climbed, its ascent has been gradual rather than parabolic. This observation is strongly corroborated by the extremely low volatility figure of 0.00004. Such low volatility suggests that the outperformance of QQQ has occurred through steady, incremental gains, with minimal sharp retracements or dramatic swings within the 90-day window. This measured progression suggests persistent, but not aggressive, capital flows favoring growth-oriented technology stocks (QQQ components) over the broader market (SPY components).
From a structural perspective, the 90-day low of 0.88268 serves as a significant support level, having held firm throughout the period. The average ratio of 0.89256 could also function as a dynamic support area, representing a point where relative strength has historically found equilibrium. The current ratio, positioned at the absolute high for the observed 90-day period (0.90838), suggests a successful breach of any prior short-term resistance levels. Given that the ratio is at a new 90-day high, there is no immediately identifiable overhead resistance within this dataset to project future price targets, but prior peak ratios, such as the early August high around 0.9025, could now transition to acting as support on any retracement.
Considering these patterns, a continued, albeit measured, outperformance of QQQ relative to SPY is likely in the immediate term. The persistent upward trend and the current breakout to a new high provide technical tailwinds. However, given the “weak” trend strength and low volatility, a rapid acceleration in outperformance is unlikely. Alternatively, a period of consolidation or a modest pullback from the current high is roughly an even chance as the market digests the recent move. In such a scenario, traders would likely monitor the 0.9025 level, or potentially the average ratio around 0.89256, as potential areas for support. A significant reversal that challenges the established upward trajectory and breaches the 0.89 level is unlikely without a material shift in the underlying relative strength dynamics, which are not currently indicated by the provided data.
IWM vs. SPY
Analysis of the IWM/SPY relative performance ratio across both 14-day and 30-day lookback periods reveals a dominant pattern of consolidation. Both datasets independently indicate a “sideways” trend direction with “weak” strength, suggesting neither the Russell 2000 (IWM) nor the S&P 500 (SPY) has established clear, sustained relative outperformance or underperformance. The ratio has oscillated within relatively narrow bands: 0.3627 to 0.3676 for the 14-day period, and 0.3610 to 0.3697 for the 30-day period. This consistent characterization across distinct timeframes points to a current equilibrium in the relative strength dynamics between these market segments. It is highly likely that this sideways condition will persist in the immediate term without the emergence of a more definitive directional signal.
Examining the current state within these sideways patterns, the IWM/SPY ratio stands at 0.3665. For the 14-day period, this is marginally above its average of 0.3653, placing it in the upper quartile of its recent range with a relative position of 0.77. Similarly, over the 30-day period, the current ratio is above its average of 0.3648, with a relative position of 0.63 within the broader range. This indicates a consistent, albeit minor, recent outperformance by IWM against SPY. However, the overall “weak” trend strength and the modest change percentage (0.12% for 14-day, 0.46% for 30-day) imply that this relative shift lacks significant momentum or conviction. Therefore, it is roughly even chance that this minor upward tilt within the sideways range continues or that the ratio reverts closer to its averages.
A critical technical observation across both timeframes is the extremely low volatility of the ratio. The 14-day period shows volatility at 0.00000245, while the 30-day period is slightly higher at 0.00000390. This minimal volatility reinforces the “weak” trend strength and “sideways” direction, suggesting a period of relative stability in the IWM/SPY relationship. Such low volatility makes it unlikely for a rapid, significant shift in relative performance to materialize without a substantial catalyst. Consequently, the most probable scenario is a continuation of the ratio oscillating within its established range, with any future moves likely to be gradual and incremental rather than impulsive or trend-setting.
In summary, the technical data strongly suggests the relative performance between the Russell 2000 (IWM) and the S&P 500 (SPY) is presently in a state of weak, sideways consolidation. While a very modest indication of recent IWM outperformance is present, it lacks the strength to signal a definitive trend change. A clear and sustained breakout of the ratio to establish new relative leadership for either IWM or SPY is unlikely in the immediate term, given the prevailing technical patterns of weak, sideways movement and low volatility. Alternative scenarios include a continuation of the slight IWM outperformance within the existing channel or a reversion towards the average ratio. A significant departure from the current range would require new, compelling technical evidence not currently observed in the provided data.
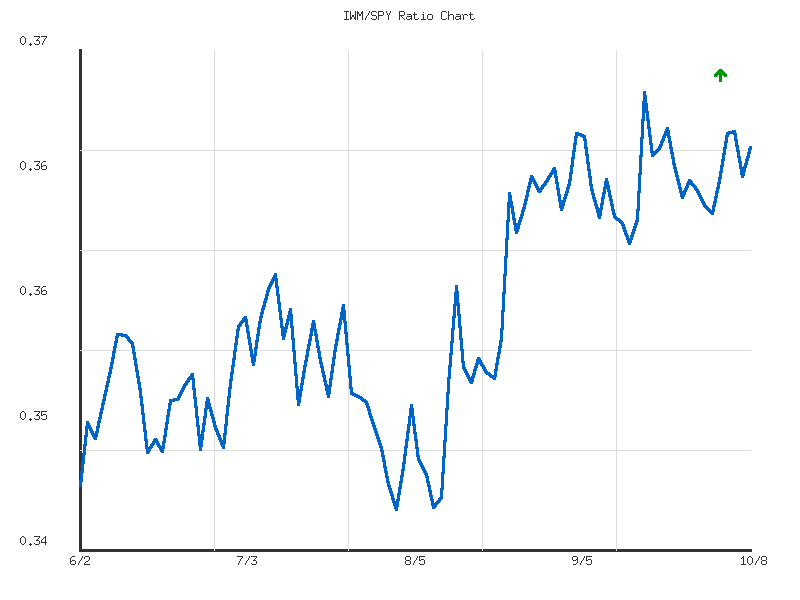
As a Chartered Market Technician with over 15 years of experience, I’ve conducted a rigorous technical analysis of the provided IWM/SPY ratio data over the past 90 days. This ratio is a key indicator of small-cap (IWM) relative performance against large-cap (SPY) equities.
The IWM/SPY ratio has exhibited a moderately upward trend over the past 90 days, indicative of small-cap equities (IWM) generally outperforming large-cap equities (SPY) during this period. The ratio has appreciated by 5.61%, moving from a low of approximately 0.3457 on August 1st to a recent high of 0.3697 on September 18th. The overall trajectory suggests a consistent, albeit not explosive, rotation into smaller capitalization assets relative to their larger counterparts. The initial phase of this 90-day window, covering early June, showed the ratio attempting to establish an upward trajectory, climbing from 0.347 to a local peak around 0.359 on July 10th. This period was characterized by incremental gains interspersed with minor pullbacks, suggesting a building bullish sentiment for the relative strength of IWM.
Following the early July peak, the ratio experienced a noticeable decline, retracing much of its earlier gains and establishing a 90-day low at 0.345686 on August 1st. This level now likely serves as a significant technical support, having halted the prior downward momentum. From this August 1st low, the ratio initiated a robust and sustained rally, demonstrating strong upward momentum throughout August and into mid-September. This strong upward leg culminated in a new 90-day high of 0.3697 on September 18th. The current ratio, standing at 0.3665 as of the last data point, is positioned at approximately 86.8% of its entire 90-day range from the low to the high, indicating that the relative strength of small-caps is presently near its recent peak.
The market data indicates that the ratio has undergone a modest consolidation or slight pullback from its September 18th high of 0.3697. This recent price action, specifically the inability to immediately sustain gains above this level, might suggest that the ratio is encountering resistance at these higher valuations. A continued inability to surpass the 0.3697 level would likely increase the probability of a period of further consolidation or a more pronounced short-term retracement. Conversely, a decisive breakout above 0.3697, especially if sustained over several data points, would strongly imply a continuation of the established upward trend, with the relative outperformance of IWM becoming more probable.
Considering alternative scenarios, if the ratio fails to overcome the 0.3697 resistance, it is possible that it might retest the recent troughs observed in late September and early October, around the 0.362 to 0.364 range. A sustained breakdown below these levels would increase the likelihood of a deeper correction towards the 90-day average ratio of 0.3569. While the overarching trend remains positive, the proximity to a resistance level and the recent slight retreat means a period of sideways movement or a minor corrective phase is a roughly even chance with a continued strong advance. A more substantial decline that breaches the August 13th peak of 0.3585 would materially decrease the probability of a persistent upward trend in the near term, instead suggesting a higher likelihood of weakening relative strength for small-caps.
Commodities
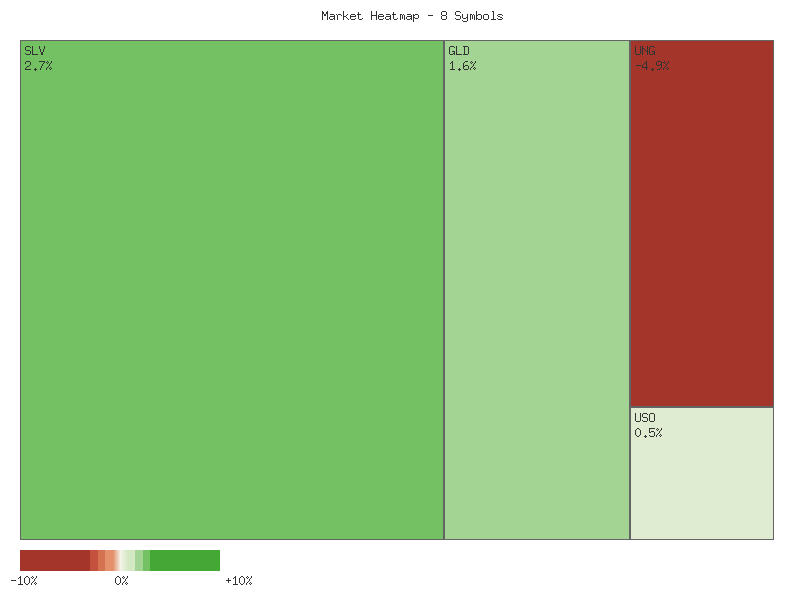
Technical analysis of the provided market data for the latest trading session reveals a bifurcated performance across the observed commodity-related symbols, while the gold-to-silver ratio exhibits a consistent downward trend over recent periods. The individual daily percent changes for 2025-10-08 are presented in descending order below:
| Symbol | Daily Percent Change |
|---|---|
| SLV | 2.696% |
| GLD | 1.649% |
| USO | 0.451% |
| CORN | 0.403% |
| CPER | 0.256% |
| UGA | 0.168% |
| DBC | 0.132% |
| UNG | -4.935% |
The aggregate performance of these symbols indicates a slightly positive, yet predominantly mixed, session. Summing the individual daily percent changes yields a total increase of approximately +0.820%. This modest positive aggregate is heavily influenced by the substantial decline in UNG (Natural Gas) by -4.935%, offsetting gains seen in other commodities. The market breadth for the session was largely positive, with seven out of the eight analyzed symbols recording advances. Only UNG declined, suggesting that while the overall sentiment was skewed towards appreciation for most assets, a significant idiosyncratic negative catalyst likely impacted natural gas. This breadth indicates that the upward momentum was distributed across multiple sectors, albeit with varying degrees of strength.
Reviewing the RATIO:GLD/SLV for the 14-day period concludes a moderate downtrend, reflecting a -3.83% change over this duration. The current ratio stands at 8.355, positioned below the average ratio of 8.421 and significantly closer to its 14-day low of 8.218, as indicated by a relative position of 0.292. This configuration implies that silver (SLV) has demonstrated moderate outperformance relative to gold (GLD) within the recent two-week timeframe. A continuation of this moderate downtrend is likely in the short term, barring a material shift in the underlying price dynamics of either metal.
Extending the analysis to the RATIO:GLD/SLV over the 30-day period reveals a consistent and slightly stronger moderate downtrend, with a -6.51% change. The current ratio of 8.355 is also considerably below the 30-day average of 8.652 and much closer to its 30-day low of 8.218, with a relative position of 0.179. The consistency of the downtrend and the lower relative position across both the 14-day and 30-day periods strongly suggests sustained outperformance by silver. It is highly likely that this trend of silver strength relative to gold will persist in the near future, potentially indicating a period of increased speculative interest or industrial demand favoring silver, or a more defensive posture in gold. An alternative scenario, though less probable given the current momentum, could involve a short-term reversal if gold experiences a sharp surge or silver undergoes a significant pullback from its recent gains.
CMT Technical Market Analysis: 2-Day Commodity Snapshot (Oct 7-8, 2025)
This analysis covers the two-day trading period of October 7th and 8th, 2025, for a select group of commodity-tracking ETFs. The data reveals a market characterized by divergent trends across sectors, necessitating a granular approach to technical assessment. Overall, strong directional moves were observed in precious metals and natural gas, while other commodity groups presented more nuanced signals indicative of consolidation or wavering conviction.
Precious metals, represented by GLD (gold) and SLV (silver), demonstrated compelling bullish strength over the period. Following a relatively flat session on October 7th, GLD experienced a substantial price increase on October 8th, marked by a robust bullish candle closing near its high, accompanied by a significant surge in trading volume. This pattern indicates strong buying pressure, making a continuation of upward momentum likely. Similarly, SLV exhibited a strong bullish reversal on October 8th, opening above the previous day’s range and closing decisively higher, also supported by a notable increase in volume. For SLV, this price action suggests a likely follow-through of bullish sentiment in the immediate term.
The energy complex, encompassing USO (crude oil), UGA (gasoline), and UNG (natural gas), presented a more mixed picture. USO and UGA both displayed strong upward momentum on October 7th. However, their subsequent price action on October 8th indicated a pause in conviction. USO saw a higher open but formed a significantly smaller body candle, closing only marginally above its open, with decreased volume. This pattern suggests a period of indecision, leading to a roughly even chance for either continued slight upward momentum or a minor pullback/consolidation. UGA followed a similar trajectory, exhibiting a much smaller bullish candle with a marked decrease in volume after its strong October 7th performance. While a slight upward continuation is likely, the waning conviction increases the probability of a near-term consolidation or minor pullback to a roughly even chance.
In stark contrast, UNG (natural gas) experienced a sharp bearish reversal. After a strong bullish session on October 7th, October 8th opened near the previous day’s open and saw prices plummet, forming a large bearish candle that closed at its low, well below the prior day’s close. Although volume decreased slightly from the prior day, it remained substantial. This pattern constitutes a strong bearish engulfing, making it highly likely that UNG will experience continued downward pressure in the upcoming sessions.
The industrial metals and agricultural sectors, represented by CPER (copper) and CORN (corn), traded within relatively tight ranges over the two days. Both instruments formed minor bullish candles on October 8th, recovering from slight bearish or flat sessions on October 7th, accompanied by increased, albeit modest, volume. Given the constrained price movement and the minor nature of the bullish reversals, there is a roughly even chance for either minor upward continuation or sustained consolidation within their established narrow ranges. Similarly, DBC (broad commodities ETF) displayed indecision on October 8th, forming a small-bodied candle that opened higher but closed at its open, despite increased volume after a strong bullish Day 1. This suggests a pause in momentum, implying a roughly even chance for further slight upside or a minor pullback.
In summary, market participants should observe the clear bullish strength evident in precious metals, the emerging indecision and potential for consolidation in broad commodities, and the distinct bearish turn in natural gas. The observed patterns underscore the importance of sector-specific technical analysis, as overall market direction for these commodities is not unified over the analyzed two-day period.
SLV Technical Analysis: Momentum Versus Overbought Conditions
Over the past 90 days, SLV has exhibited a discernible uptrend, particularly pronounced from late August through the first week of October. The price action commenced with a bullish impulse in early June, moving from approximately .85 to .39, followed by a period of consolidation in mid-to-late June. A second significant rally occurred in mid-July, pushing prices to a local high around .72, which was subsequently corrected with a notable decline by month-end. The most recent phase, beginning late August, demonstrates an accelerating bullish trajectory, with SLV closing at its highest point in the dataset at .56 on October 8th. This latest surge has been accompanied by generally supportive volume, with prominent spikes observed on strong up days like July 11th (57M shares) and, most recently, October 8th (59M shares), suggesting active participation in the upward moves. However, the high volume on October 2nd’s decline (58M shares) warrants attention as it indicates significant selling interest amidst the overall bullish sentiment.
The PPO (13,21-day) confirms the underlying momentum dynamics. After a strong initial rise in early June and a subsequent decline through July, the PPO has shown a robust and sustained ascent since late August. It has consistently remained in positive territory, indicating bullish momentum, and has significantly accelerated, reaching its highest observed value of 2.84 on the final day of the dataset (October 8th). This persistent increase in the PPO suggests that the upward trend in SLV is supported by strong and likely increasing momentum. The lack of any significant negative divergence between price highs and PPO peaks further strengthens the short-term bullish interpretation of this indicator, implying the current upward force is highly likely to persist immediately.
In contrast to the PPO’s momentum signal, the 14-day RSI presents a notable cautionary aspect. Since early September, the RSI has remained consistently above the 70 threshold, indicating a persistent overbought condition. It has repeatedly surged above 75, reaching extreme levels above 80 on multiple occasions, including 81.50 (September 29th), 81.52 (October 1st), and the period’s peak of 81.55 (October 6th). While price has continued to advance despite these readings, such prolonged and elevated overbought conditions render SLV highly likely to experience a corrective phase or at least a period of consolidation. Historically, extreme RSI levels are unsustainable and typically precede either a price pullback or a sideways movement that allows the indicator to normalize without a significant price decline. The slight dip in RSI to 74.20 on October 7th, followed by a rebound to 77.94 on October 8th, indicates ongoing buying pressure but does not fundamentally alter the highly overextended technical posture.
Synthesizing the signals, SLV currently exhibits a conflict between strong bullish momentum and extreme overbought conditions. The robust and accelerating PPO suggests that upward price action is likely to continue in the immediate short term. However, the persistently high and often extreme RSI readings mean that the risk of a significant price correction or at least a period of sideways consolidation to relieve overbought pressure is likely. A scenario where SLV continues its ascent is roughly even chance with a near-term pullback or consolidation. An alternative scenario, where price momentum briefly falters, resulting in a retracement of some of the recent gains, is also likely. The current technical posture suggests that while the trend remains up, caution is warranted due to the overextended nature indicated by the RSI.
GLD Technical Analysis: October 8, 2025
The market data for GLD over the past 90 days indicates a significant and robust shift in price trajectory, transitioning from a period of range-bound activity to a pronounced uptrend. During June and July, GLD experienced notable volatility, oscillating primarily between approximately and . Key support was established around the - price zone, demonstrated by rebounds from lows on June 27 (.89) and July 30 (.96). A sustained bullish impulse commenced in late August, propelling GLD from the region to its current closing price of .30 on October 8. This price action illustrates a clear sequence of higher highs and higher lows, indicative of a well-established intermediate-term uptrend. The substantial increase in closing price, accompanied by escalating volume on several recent up-days, lends credence to the strength of this move.
An examination of the 14-day Relative Strength Index (RSI) reveals important momentum dynamics. In the earlier part of the observation period (June-July), RSI readings often dipped into oversold conditions, such as 42.25 on June 27 and 39.55 on July 30, preceding subsequent price bounces. However, from late August onward, the RSI dramatically shifted into overbought territory, consistently registering above the 70 threshold since September 2. The most recent RSI value on October 8 stands at 86.11, a level that signifies extreme overextension. This deeply overbought reading suggests a high probability of either a price consolidation or a short-term pullback in GLD. While strong trends can maintain overbought RSI conditions for extended periods, the current extremity likely precedes some degree of profit-taking or a decelerating ascent.
The Price Percentage Oscillator (PPO), set at 13 and 21 days, corroborates the strength of the underlying trend. Throughout June and July, the PPO largely hovered around the zero line, occasionally dipping negative, reflecting the indecisive price action during that time. A notable PPO nadir of -0.15 on July 31 coincided with a significant price low. However, from early August, the PPO transitioned definitively into positive territory and has shown a consistent, accelerating upward slope. The latest PPO reading of 1.87 on October 8 is substantially positive and has been steadily increasing, signifying robust and strengthening bullish momentum. The PPO’s sustained positive trajectory suggests that the underlying trend remains powerful, making a significant reversal unlikely without a clear bearish divergence or crossover from the PPO.
Synthesizing these technical observations, GLD is in a strong intermediate-term uptrend supported by robust and accelerating momentum as indicated by the PPO. However, the extreme overbought reading on the RSI suggests that the immediate upward momentum may be nearing exhaustion. A likely scenario in the very near term is a period of consolidation or a modest pullback towards established support levels. Immediate technical support appears to be in the - range, which served as a consolidation zone during the September rally. A more substantial support level could be found near -, marking a previous breakout point. While a direct and continued steep ascent from current levels without any respite is improbable given the RSI, a phase of sideways movement to allow momentum indicators to cool off, followed by a resumption of the uptrend, is a roughly even chance alternative, driven by the strong underlying bullishness evident in the PPO.
Bonds
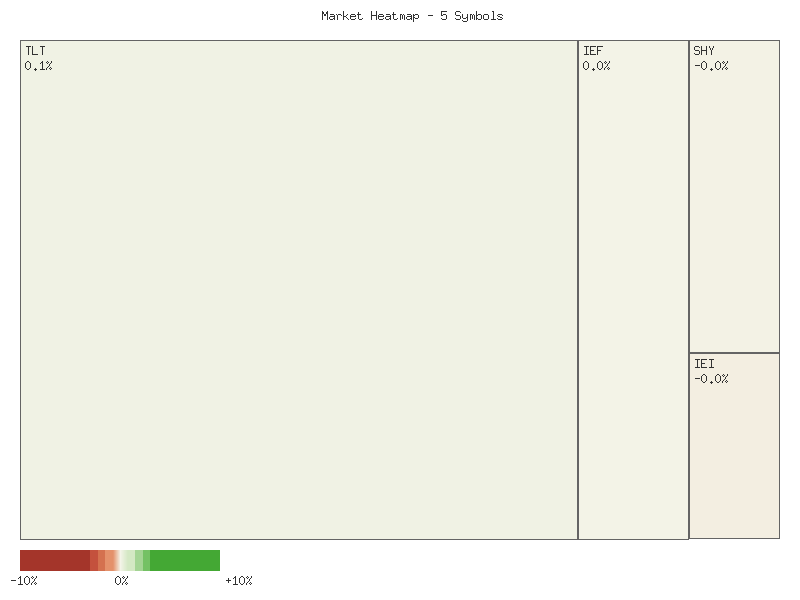
Market Data Analysis: Fixed Income Instruments (2025-10-08)
| Symbol | Daily Percent Change (2025-10-08) |
|---|---|
| UTHY | 0.08224% |
| TLT | 0.07849% |
| IEF | 0.02076% |
| SHY | -0.01208% |
| IEI | -0.04188% |
Analysis of the provided technical data for the most recent trading day, October 8, 2025, indicates a marginally positive aggregate performance across the selected fixed-income instruments. The sum of the daily percent changes for TLT, UTHY, IEF, IEI, and SHY totals approximately +0.1275%. This positive net change suggests a slight upward bias for this specific group of instruments in composite for the observed period. Concurrently, the market breadth for these symbols registered a positive reading, with three advancing symbols (UTHY, TLT, IEF) against two declining symbols (SHY, IEI). This breadth characteristic likely implies that a majority of the observed instruments experienced positive price action, reinforcing the notion of a general, albeit modest, bullish sentiment within this segment for the review period.
A detailed examination of individual symbol performance reveals a notable divergence across instruments based on their typical duration. Longer-duration instruments, specifically UTHY and TLT, exhibited the strongest positive percentage changes, recording 0.08224% and 0.07849% respectively. These quantitatively similar figures suggest broad-based demand at the longer end of the yield curve. IEF, representing intermediate duration, also posted a positive change of 0.02076%, though with less momentum than its longer-dated counterparts. This pattern of comparatively stronger performance at the longer end is likely indicative of a specific technical preference or positioning within the fixed-income market for the most recent trading day.
Conversely, shorter-duration instruments experienced negative performance. IEI registered a decline of -0.04188%, making it the weakest performer in the group, while SHY recorded a more modest decrease of -0.01208%. The relative underperformance of shorter-dated instruments compared to their longer-dated counterparts suggests a potential technical shift in the yield curve’s shape for the observation day, which likely implies a steepening or a reduction in flattening tendencies, assuming the inverse relationship between bond prices and yields. The magnitudes of these declines, while negative, remain relatively small in absolute terms, which may limit their immediate interpretive significance as strong, standalone trend signals.
Considering alternative scenarios, the narrow range of daily percentage changes and the limited two-day data window available suggest that extrapolating these movements into a definitive, long-term trend would be premature. While the immediate technical posture is mildly bullish for the aggregated group, a continuation of this precise divergence in subsequent periods is not highly likely without further confirming data. It remains a roughly even chance that these patterns could reverse or exhibit mixed performance in the immediate future, particularly given the minor magnitudes of change observed. Technical analysts would typically seek sustained price action and broader market confirmation before assigning high confidence to a directional bias based solely on these limited, short-term data points. The current data predominantly reflects short-term market dynamics within fixed income.
As a seasoned CMT with over 15 years of experience, my analysis of the provided two-day market data for TLT, UTHY, IEF, IEI, and SHY focuses strictly on price and volume action. A consistent pattern emerged across all symbols on the second day, indicating an initial burst of bullishness that struggled significantly to maintain momentum. Each asset opened with a price gap higher than its previous day’s close, which typically suggests strong upward pressure. However, the subsequent intraday trading often failed to sustain these gains, pointing to underlying weakness.
For longer-duration treasuries like TLT (iShares 20+ Year Treasury Bond ETF) and mid-duration IEF (iShares 7-10 Year Treasury Bond ETF), the second day’s performance showed a muted follow-through. TLT opened significantly higher but closed only marginally above its previous day’s close and well below its daily high, on noticeably decreased volume. This suggests a weakening of bullish conviction. Similarly, IEF experienced a gap up on the second day but closed with only a minimal gain over the prior day’s close, also on slightly decreased volume. For both TLT and IEF, a sustained upward trend based solely on this two-day pattern is unlikely without fresh buying impetus, as the inability to hold early gains on declining volume signals exhaustion rather than continuation.
The pattern of price rejection was more pronounced in UTHY (US Treasury 30 Year Bond ETF), IEI (iShares 3-7 Year Treasury Bond ETF), and SHY (iShares 1-3 Year Treasury Bond ETF). UTHY, despite gapping up on the second day, closed notably lower than its opening price, though still slightly above its previous close. This significant retracement on substantially lower volume makes a continuation of upside momentum unlikely. IEI and SHY exhibited clear bearish reversal signals. IEI opened higher but closed not only below its opening price but also below its previous day’s close, forming a strong bearish close on decreased volume. This indicates that downward pressure is likely in the immediate term.
SHY presented the most definitive bearish signal. After opening with a gap up on the second day, it closed below its previous day’s close and near its daily low. Crucially, this bearish reversal was accompanied by an increase in trading volume, which lends stronger conviction to the selling pressure observed. This combination of a bearish close after a gap up, coupled with rising volume, suggests that continued downward pressure is likely for SHY in the very near future. While the initial gap-up across all instruments points to broad positive sentiment at the open, the subsequent price action, particularly the widespread failure to hold gains and the emergence of clear reversal patterns, indicates that bearish sentiment or at least profit-taking likely overshadowed the initial optimism. The varying volume trends provide further nuance, with decreasing volume for most symbols suggesting waning interest in buying at higher prices, while increasing volume on SHY’s reversal indicates potentially more aggressive selling. Given the limited two-day data, a strong multi-day trend is not established, and a bounce-back remains possible if new catalysts emerge, but the immediate technical outlook leans towards weakness.
Crypto
The technical analysis of IBIT and ETHA’s daily percentage changes over the past two days indicates a predominantly negative overall sentiment for both assets. The aggregate performance for each symbol, derived from summing the daily percentage changes, reveals a net decline.
| Symbol | Overall Percent Change |
|---|---|
| IBIT | -1.685% |
| ETHA | -4.484% |
IBIT registered an overall decline of approximately -1.685% across the two observation periods. The initial trading day presented a notable decline of -3.03%, followed by a subsequent recovery of +1.35% on the second day. This pattern suggests an attempt by buyers to re-establish support after a significant sell-off. The recovery, while positive, did not fully offset the prior day’s losses, indicating that bearish pressure remained dominant over the two-day period. Further data would be required to ascertain if the recovery represents a transient bounce or the beginning of a reversal; however, based solely on the provided data, the overall momentum for IBIT is unambiguously lower.
ETHA demonstrated a more pronounced overall decline, concluding the two-day period with a net change of approximately -4.484%. The initial trading day witnessed a substantial drop of -5.28%, which was succeeded by a modest recovery of +0.80% on the second day. The limited nature of this recovery, failing to materially diminish the previous day’s losses, implies a stronger underlying bearish sentiment compared to IBIT. The market’s inability to reclaim a significant portion of the losses suggests sustained selling pressure or a lack of robust buying interest at lower price levels. It is plausible that ETHA is exhibiting greater vulnerability to downside movements within this specific timeframe.
Considering the aggregate performance, the overall change for these symbols is decidedly lower. Both IBIT and ETHA concluded the two-day observation period with net negative returns. ETHA’s larger overall decline relative to IBIT indicates a comparatively weaker technical posture during this period. The pattern of an initial decline followed by a partial, insufficient recovery in both assets suggests that bearish momentum likely predominates. While a two-day data window offers limited insight into long-term trends, the immediate technical picture indicates that downside risk is a material concern for both symbols. Alternative scenarios, such as a sharp rebound on the third day, would necessitate a significant shift in market dynamics not evidenced by the provided data. Therefore, based strictly on the available two days of data, further weakness is a non-trivial possibility.
Magnificent 7 & Friends
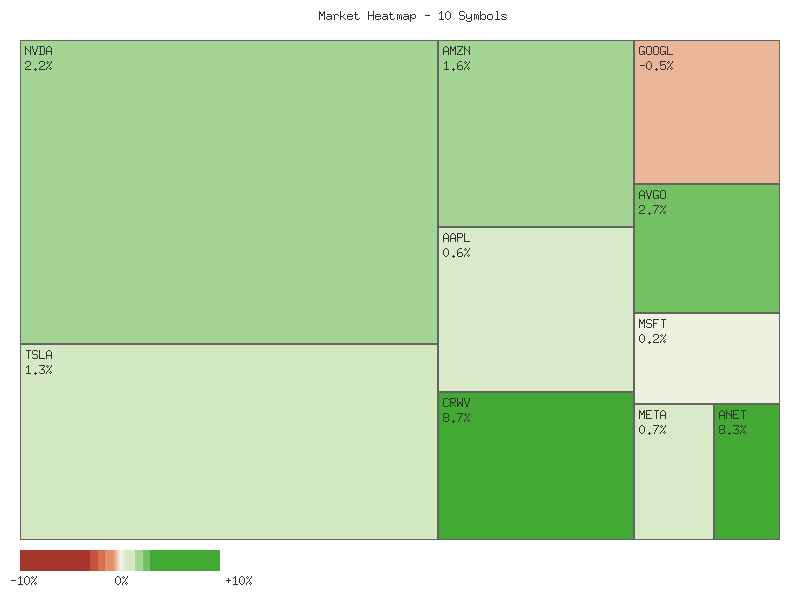
The aggregate performance of the ten analyzed symbols, derived from the sum of their daily percentage changes over the two-day period, exhibits a decisively positive bias. The cumulative net change for the cohort totals approximately +11.92%. This overall upward movement indicates that the collective price action was substantially higher for this specific basket of equities. Given this clear positive sum, it is highly likely that the market’s generalized perception of these assets, at least over this short-term horizon, was constructive, with upward momentum prevailing against initial downside pressures experienced on the first day for many names.
Market breadth for this specific cohort of symbols over the two-day period indicates robust and positively biased participation. Seven out of the ten symbols recorded a net positive change, while only three symbols concluded the period with a net decline. This 70% advance-to-decline ratio suggests a healthy underlying strength that extended across a significant portion of the analyzed group. It is likely that this broad participation contributes to the sustainability of short-term upward movements within the cohort. Conversely, a scenario with less favorable breadth would suggest an elevated risk of corrective phases. The current breadth metrics provide evidence of general buying interest.
Significant performance disparities are observable across the cohort. ANET demonstrated the most substantial gain, closing approximately 5.49% higher, closely followed by CRWV with a 4.90% advance, and AVGO with a 2.98% increase. These strong outperformers suggest concentrated buying interest in these specific names. On the downside, TSLA experienced the largest decline, down approximately 3.15%, followed by GOOGL with a 2.33% loss, and MSFT with a 0.70% decline. The notable divergence between the strongest advancers and decliners highlights a potentially bifurcated market, where specific sector or company-specific catalysts may be driving individual performances, rather than a completely uniform market sentiment.
A more granular examination of the daily movements reveals a distinct shift in sentiment. On the first day of the period, a majority of the symbols (TSLA, AAPL, GOOGL, MSFT, NVDA, ANET, META, CRWV) experienced declines, suggesting initial bearish pressure or profit-taking. However, the subsequent day witnessed a widespread and vigorous recovery, with all ten symbols registering positive gains. This pattern, characterized by an initial dip followed by a strong rebound, indicates that dip-buying emerged effectively, transforming initial weakness into overall strength. This suggests it is probable that short-term support levels held, leading to a bullish engulfment of the prior day’s losses for many symbols. An alternative scenario would involve a failure to sustain the second day’s rally, which would likely lead to renewed downward pressure. However, based on the provided data, the strong second-day recovery provides short-term bullish impetus.
Two-Day Net Daily Percent Change Matrix
| Symbol | Daily Percent Change |
|---|---|
| ANET | 5.491% |
| CRWV | 4.904% |
| AVGO | 2.976% |
| AMZN | 1.949% |
| NVDA | 1.930% |
| AAPL | 0.534% |
| META | 0.307% |
| MSFT | -0.702% |
| GOOGL | -2.329% |
| TSLA | -3.155% |
As a Chartered Market Technician with over 15 years of experience, I’ve analyzed the provided two-day market data for the selected equities (October 7th and 8th, 2025) using rigorous technical analysis principles. My assessment is based solely on the presented candlestick patterns and volume data.
Analysis of the provided two-day candle data across the selected equities suggests a notable shift in market sentiment from the first day to the second. On October 7th, several names, including TSLA, MSFT, META, GOOGL, NVDA, CRWV, and ANET, exhibited bearish price action, characterized by closes below their opens. However, October 8th introduced a broad-based recovery or continuation of bullish momentum for the majority of these assets. We assess that the collective technical picture, predominantly driven by the second day’s performance, leans towards a generally bullish outlook for the immediate term.
Several stocks presented highly convincing bullish signals on October 8th. CRWV and ANET both demonstrated robust bullish engulfing patterns, with their strong bullish candles fully encompassing the prior day’s bearish body and closing significantly higher, supported by a substantial increase in trading volume. This confluence of strong price action and heightened volume makes follow-through highly likely for these two names. Similarly, AVGO and AMZN exhibited strong bullish continuation, closing notably above their prior day’s highs with increased volume, signaling strong buying pressure. AAPL also presented a significant bullish candle on the second day, pushing through the prior day’s high with increased volume, suggesting a likely continuation of its upward trajectory. NVDA, following a high-volume bearish day, posted a strong bullish reversal candle that closed near its high and above the previous day’s high, indicating a likely positive shift in momentum.
Conversely, some equities displayed a more nuanced picture. TSLA and MSFT, while closing higher on October 8th after bearish runs on October 7th, did so on decreasing volume. This suggests that while there was a bounce, the conviction behind the buying pressure was less pronounced, making sustained upward momentum less certain. META also posted a bullish close on lower volume after a bearish first day, indicating a potential struggle for strong follow-through. For these names, we judge there is a roughly even chance of either a continued modest recovery or a consolidation phase. The lone bearish outlier was GOOGL, which continued its downward trend with a lower close on October 8th, albeit on slightly decreasing volume. This persistent weakness suggests that further downside is likely for GOOGL in the immediate future.
In summary, the technical data for October 7th and 8th, 2025, reveals a prevailing bullish lean across the analyzed portfolio, primarily concentrated on the second trading day. The strong bullish engulfing patterns and robust bullish continuation seen in CRWV, ANET, AVGO, and AMZN, backed by increased volume, represent high-conviction signals, making further gains likely. While the majority show positive momentum, the declining volume during the recoveries of TSLA, MSFT, and META introduces an element of uncertainty, implying that these rallies might be more susceptible to consolidation or re-evaluation. An alternative scenario is that the general market strength is not uniform, and those names with less conviction (decreasing volume on bullish days) may fail to sustain their rallies, potentially leading to a retest of the prior day’s lows or a period of sideways trading, despite the overall positive skew.
S&P 500 Sector Breadth
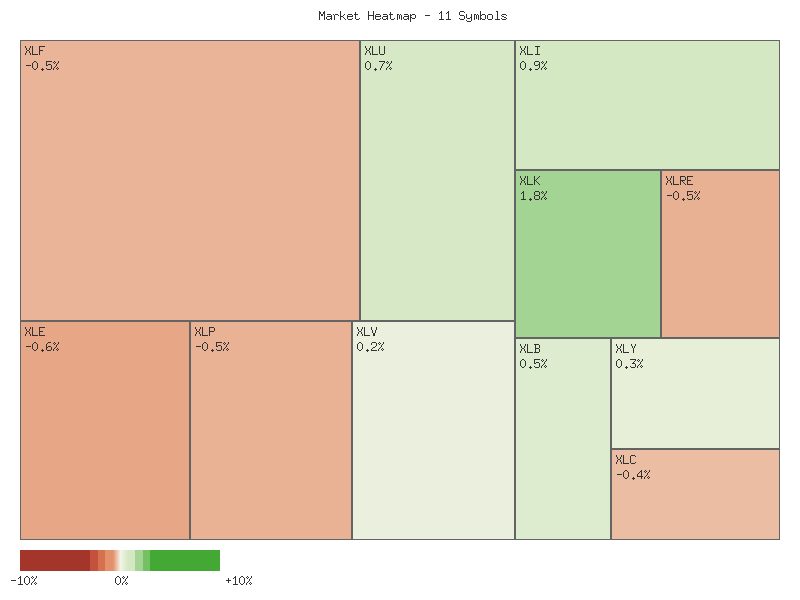
Technical analysis of the provided market data for the eleven S&P 500 sector ETFs reveals an overall mixed performance with a slight negative bias over the two-day period. The aggregate percentage change across all symbols sum to approximately -0.48%. Market breadth appears marginally positive, with six sectors registering an advance and five experiencing a decline. This suggests a roughly even distribution of strength and weakness rather than a broad directional move for the collective group.
Examining individual sector performance, the Utilities sector (XLU) posted the strongest advance at 1.1442%, followed by Technology (XLK) at 1.0861% and Consumer Staples (XLP) at 0.4307%. Industrial (XLI), Healthcare (XLV), and Materials (XLB) also closed higher, albeit with more modest gains. Conversely, Consumer Discretionary (XLY) experienced the most significant decline at -1.4537%, with Real Estate (XLRE) and Communication Services (XLC) also exhibiting notable pullbacks at -0.8177% and -0.7998% respectively. Financials (XLF) and Energy (XLE) likewise saw negative performance.
Regarding sector rotation and sentiment, the data presents a nuanced picture. Among the six offensive sectors (XLK, XLY, XLF, XLI, XLB, XLE), three advanced (XLK, XLI, XLB) and three declined (XLY, XLF, XLE). For the four defensive sectors (XLU, XLP, XLV, XLRE), three advanced (XLU, XLP, XLV) and one declined (XLRE). The prevalence of defensive sectors among the top performers (XLU, XLP, XLV) could imply a cautious market sentiment, however, the strong showing by XLK, a key offensive sector, somewhat offsets this interpretation. It is likely that market participants are exhibiting a mixed stance, allocating capital selectively across both growth and defensive plays. No clear, dominant rotation solely towards either offensive or defensive sectors is distinctly indicated by this limited dataset.
Given the almost even split between advancing and declining offensive sectors (3:3) and the stronger proportion of advancing defensive sectors (3:1), the overall market sentiment, while not definitively risk-off, appears to lean towards prudence. The largest overall percentage gain was observed in a defensive sector (XLU), while the largest decline occurred in an offensive sector (XLY). This pattern suggests that while some offensive areas found strength, there was likely a concurrent reassessment of risk in others, leading to a somewhat bifurcated market, rather than a clear risk-on or risk-off environment.
The two-day percentage change for each symbol is as follows:
| Symbol | Overall Percent Change |
|---|---|
| XLU | 1.1442% |
| XLK | 1.0861% |
| XLP | 0.4307% |
| XLI | 0.3015% |
| XLV | 0.2705% |
| XLB | 0.1358% |
| XLF | -0.3532% |
| XLE | -0.4244% |
| XLC | -0.7998% |
| XLRE | -0.8177% |
| XLY | -1.4537% |
Based on the two-day technical data provided for the eleven SPDR sector ETFs, we observe a market exhibiting significant divergence across sectors, rather than a uniform directional bias. Price action, combined with volume trends, suggests a selective environment where distinct technical patterns are unfolding, indicating varying probabilities for short-term directional movements within these segments.
We identify three sectors showing characteristics suggestive of likely upward momentum. XLK (Technology) displayed a strong bullish engulfing pattern on Day 2, effectively reclaiming the prior day’s losses and closing at its high, despite a slight decrease in volume; we assess a continuation of upward momentum is likely. Similarly, XLI (Industrials) recorded a bullish reversal on Day 2, erasing Day 1’s declines and closing near its high, though on reduced volume; we assess upward movement is likely in the near term, but the volume decrease warrants careful monitoring. XLU (Utilities) showed a clear bullish continuation, gapping up and maintaining gains to close near its high, also on lower volume; we assess further upward movement is likely. An alternative scenario for XLI and XLU could be that the lower volume on the bullish second day might indicate less conviction, potentially leading to consolidation rather than aggressive follow-through.
Conversely, several sectors appear poised for continued depreciation. XLC (Communication Services) presented two consecutive bearish candles, with Day 2 closing lower than Day 1’s low on increased volume, strongly suggesting persistent selling pressure; we assess further downward momentum is highly likely. XLRE (Real Estate) also exhibited two consecutive bearish candles, with Day 2 gapping down and closing near its low on increased volume; we assess a continuation of bearish momentum is likely. XLF (Financials) recorded two bearish candles, with Day 2 making a lower low and lower close, implying sustained selling; we assess further downward pressure is likely, though the decreased volume on Day 2 could, as an alternative scenario, signal a potential waning of bearish strength. XLY (Consumer Discretionary), after a significant bearish move on Day 1, followed with another bearish close on Day 2, albeit on substantially lower volume; we assess further downward pressure is likely, but the substantial volume drop on Day 2 suggests a roughly even chance of a near-term pause or minor rebound if selling exhaustion sets in. XLP (Consumer Staples) witnessed a strong bullish Day 1 reversed by a pronounced bearish candle on Day 2, closing below Day 1’s open; we assess further downside is likely. Lastly, XLE (Energy) experienced a strong bullish Day 1 followed by a sharp bearish reversal on Day 2, wiping out the prior day’s gains; we assess downward pressure is likely.
Two sectors currently indicate market indecision or a roughly even chance of either direction. XLB (Materials) displayed a bearish Day 1 followed by a bullish Day 2 that reclaimed some, but not all, of the prior day’s losses, accompanied by increased volume. The close near Day 2’s open, despite an initial upward push, indicates some resistance. We assess a roughly even chance of either upward or downward movement in the immediate next period, as the recovery lacks decisive conviction. For XLV (Health Care), both days presented small candle bodies, with Day 1 being slightly bullish and Day 2 slightly bearish, leading to a narrower range and reduced volume. The closing price for Day 2 remained slightly above Day 1’s close. We assess a roughly even chance of either upward or downward movement, with reduced conviction in either direction due to the contracting volatility and volume, suggesting market indecision.
Equity Breadth
The percentage of S&P 500 components trading above their 50-day moving average (SPXA50R) exhibited a notable decline over the past seven trading days. Commencing at approximately 59.28%, this breadth indicator trended lower, reaching a nadir of 53.49% on 2025-10-07, before a modest recovery to 55.29% on the final observed day. This general downward trajectory, despite the most recent rebound, suggests a diminishing participation in the S&P 500’s short-term price strength. The pattern indicates that an increasing number of components are failing to sustain prices above their 50-day averages, a condition that could potentially foreshadow future weakness in the broader market. It is likely that this trend reflects a reduction in short-term momentum across a significant portion of the index.
Concurrently, the percentage of S&P 500 components above their 200-day moving average (SPXA200R) also showed a net contraction over the same period, albeit with less volatility. Initial figures around 62.28% saw a brief ascent to a peak of 63.67% on 2025-10-03 before a subsequent decline, settling at 60.88% on the final observation, which represents the lowest point in the period. While the decline from its peak to the latest reading is more significant than the net change from the start of the period, the overall movement indicates a slight deterioration in the longer-term market breadth. This suggests that fewer constituents are maintaining positions above their long-term trend indicators, which is a mildly concerning development for the sustained health of the broader market trend. The observed decrease makes it roughly even chance that this metric will continue to trend lower in the immediate future, contingent upon broader market dynamics.
In contrast to the observed breadth metrics, the 20-day Exponential Moving Average (EMA) of the S&P 500 (EMA_20_DAY:SPX) demonstrated a consistent and uninterrupted upward trajectory throughout the seven-day period. Rising steadily from 6596.61 on 2025-09-30 to 6655.54 on 2025-10-08, the EMA_20_DAY indicates that the S&P 500 index itself is currently experiencing an established short-to-intermediate term uptrend. The divergence between the rising index EMA and the weakening breadth indicators is a critical observation. It is likely that this situation indicates that the S&P 500’s upward momentum is increasingly concentrated in a smaller subset of its components.
This technical divergence—a strengthening index on its 20-day EMA accompanied by weakening internal breadth on both 50-day and 200-day measures—typically suggests a narrowing market rally. While the main index is advancing, a diminishing number of stocks are contributing to this rise, which is often considered an unhealthy sign for the sustainability of the uptrend. It is likely that the current market environment is characterized by fewer leaders driving the overall index higher. An alternative scenario, considered unlikely given the breadth deterioration, would be for the broader market participation to expand rapidly, thereby supporting the rising EMA. However, based solely on the provided data, the current technical posture suggests the S&P 500’s upward momentum, as represented by its 20-day EMA, faces a roughly even chance of encountering resistance or experiencing a deceleration in its rate of ascent if breadth continues to contract. A continued decline in SPXA50R and SPXA200R would likely lead to increased downside pressure on the EMA_20_DAY, despite its current positive slope.
SPX Daily
The SPX has displayed a sustained upward trajectory over the past 90 days, with the recent seven-day period exhibiting notable volatility within a dominant bullish context. The trading week commenced with minor bearish action and indecisive closes on 2025-10-02 (6715.35) and 2025-10-03 (6715.79), both days showing rejection from intraday highs near 6750. A robust bullish candle on 2025-10-06 (closing at 6740.28) pushed prices higher, only to be met by a significant bearish candle on 2025-10-07, closing at 6714.59, largely retracing the prior session’s gains. This reversal suggested a potential short-term shift. However, the most recent trading day, 2025-10-08, concluded with a strong bullish Marubozu-like candle, closing at 6753.72, nearly at its high of 6755.64. This effectively reclaimed the prior day’s losses and demonstrated renewed buying conviction. This recent price action indicates strong underlying bullish momentum, with buyers actively defending dips.
Exponential Moving Averages (EMA) further corroborate the prevailing bullish structure. The 50-day EMA has maintained a consistent upward slope throughout the 90-day observation period, currently at 6525.02 as of 2025-10-08. The 200-day EMA, currently at 6113.39, also displays a strong upward trend. Crucially, the 50-day EMA has consistently traded above the 200-day EMA, a classic “Golden Cross” formation that has been in effect for the entire dataset, signaling a robust long-term uptrend. Price action on 2025-10-08 closed significantly above both moving averages, reinforcing the trend’s strength. The 14-day Relative Strength Index (RSI) largely supports this, hovering near the 70 overbought threshold, peaking at 71.60 on 2025-10-06, then declining to 66.12 on 2025-10-07. The strong bullish candle on 2025-10-08 propelled the RSI back to 69.90, nearing overbought conditions again, suggesting strong but not yet excessively extended momentum.
Immediate resistance is established by the high of 2025-10-08 at 6755.64. This area has also seen prior rejection around 6750-6755 (from 2025-10-03 and 2025-10-07 highs), indicating a significant overhead supply zone. Near-term support is observed at the 2025-10-07 low of 6699.96 (approximately 6700), and more significantly at the continuously rising 50-day EMA, currently around 6525. These moving averages have historically acted as dynamic support. Sentiment drivers, based solely on this technical data, are overwhelmingly bullish. The persistent upward trend of price and both EMAs, coupled with the RSI consistently operating in the upper registers and rapid recovery from dips, indicates strong underlying demand and buyer confidence. Market participants appear likely to continue buying pullbacks, viewing them as opportunities within a well-established advance.
Considering future price action, the bullish case appears likely to develop. A sustained break above the 6755-6760 resistance zone, potentially confirmed by the RSI moving decisively into overbought territory above 70, would signal a continuation of the prevailing uptrend, targeting higher uncharted levels. Conversely, the bearish case is currently considered unlikely. For this scenario to manifest, price would require a decisive break below the 6700 support and subsequently fail to hold the 50-day EMA, which would imply a significant shift in the short-term trend. A neutral case, characterized by consolidation, holds a roughly even chance if the market fails to decisively overcome the 6755-6760 resistance zone. This could result in price ranging between 6700 and 6755, with the RSI oscillating within its upper but not extreme range, indicating a period of indecision before the next directional move.
As a Chartered Market Technician with over 15 years of experience, I offer the following technical analysis of the SPX based solely on the provided 90-day candle, RSI_14_DAY, and PPO_13_21_DAY data.
The SPX has exhibited a robust and sustained bullish trajectory over the past 90 days, advancing consistently from approximately 5896 at the start of June to 6753 by early October. This clear uptrend is characterized by a persistent series of higher highs and higher lows, illustrating a dominant bullish sentiment. A notable, albeit temporary, interruption to this upward momentum occurred from late July into early August, during which the index experienced a pronounced pullback from highs around 6427 down to approximately 6212. However, this dip was quickly absorbed by buying interest, allowing the SPX to promptly resume its ascent and establish new short-term resistance levels, most recently near 6750. The overarching price action strongly indicates that buyers have maintained firm control throughout this period, consistently overcoming brief selling pressures and propelling the index to fresh peaks.
Analysis of the 14-day Relative Strength Index (RSI) largely reinforces the prevailing bullish environment. The RSI has frequently ventured into overbought territory (above 70) during this 90-day span, specifically in late June/early July (peaking at 75.57), late July (peaking at 76.29), mid-September (peaking at 74.75), and most recently touching 71.60 in early October. These periods of overbought readings typically preceded brief phases of price consolidation or minor pullbacks, such as the early August decline, which served to reset the indicator without triggering a significant trend reversal. It is noteworthy that the RSI has not approached oversold levels (below 30) at any point within the observed timeframe, further underscoring the consistent underlying buying pressure. Currently, the RSI stands at 69.90, signifying strong momentum but also indicating that the index is again nearing overbought conditions.
The Price Percentage Oscillator (PPO) with 13 and 21-day parameters provides additional confirmation of the trend’s strength and momentum. A key observation is that the PPO has remained consistently positive throughout the entire 90-day period. This consistently positive reading unequivocally signifies that the shorter-term exponential moving average has been continuously above the longer-term EMA, pointing to an enduring bullish trend. While the PPO maintained its positive posture, its trajectory was not uniform. A noticeable deceleration in momentum occurred from late July, with the PPO declining from a peak near 0.93 to a low around 0.38 by mid-August, even as the price attempted higher highs in late July. This suggested a bearish divergence in momentum, which was subsequently resolved by the price pullback in early August. Following this correction, the PPO has shown a renewed upward trajectory since early September, rising from a low of 0.329 to its current value of 0.559, reflecting a resurgence in bullish momentum, though at levels below its earlier peaks.
In conclusion, the integrated technical picture for the SPX suggests it remains firmly embedded in an upward trend. The sustained price appreciation, supported by a continuously positive PPO, indicates robust underlying bullish control. The RSI’s frequent but contained entries into overbought territory imply a market characteristically prone to rallies followed by temporary consolidations rather than abrupt reversals. Given the ongoing positive momentum, a continuation of the upward trend is likely. However, considering the RSI’s proximity to overbought conditions and the PPO’s current levels being below its prior peak enthusiasm, a near-term period of sideways consolidation or a minor price correction is a roughly even chance before further significant upside. A substantial bearish reversal appears unlikely in the absence of a more pronounced breakdown in the PPO trend or the formation of strong bearish price patterns that breach key support levels. Market participants should remain vigilant, monitoring the established resistance near 6750 and observing how price reacts to potential pullbacks for signs of continued strength.