Daily Market Technical Analysis
Market Overview
The equity market exhibited broad-based weakness, evidenced by unanimous index declines, a VIX surge, and widespread bearish reversal patterns across major ETFs. SPX shows likely weakening upward momentum due to dual bearish divergences in RSI and PPO, suggesting a near-term pullback. Concurrently, several Magnificent 7 stocks, including TSLA and ANET, face almost certain continued downside after strong bearish engulfment patterns. In commodities, GLD’s robust uptrend strongly suggests continuation, while SLV is highly likely to face further downward pressure. Fixed-income instruments display a mixed reversal, with longer-duration bonds facing likely sustained selling despite short-term rallies. Overall, a cautious sentiment prevails, with significant downside pressure likely for many equity components and a roughly even chance for consolidation in others.
Market Indices
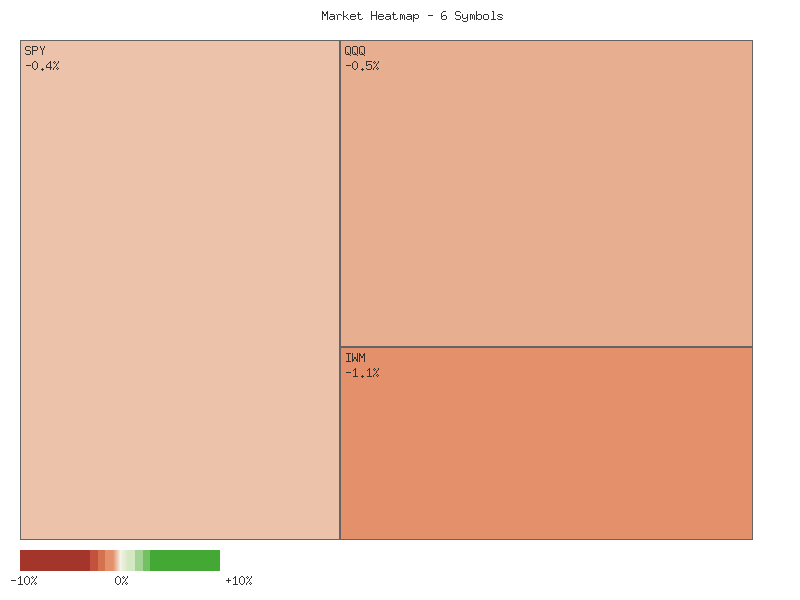
The equity market, as represented by the selected indices for 2025-10-07, exhibited broad-based weakness. All six observed symbols—OEF, SPX, QQQ, IWM, MDY, and IJR—registered negative daily percentage changes. The overall market change, calculated by summing these daily values, was -4.628%. This aggregate decline suggests a demonstrably lower market sentiment for these constituents on the day. Market breadth was entirely negative, with zero advancing symbols against six declining symbols, indicating a widespread downside movement rather than sector-specific weakness. The matrix below details the individual performance:
| Symbol | Daily Percent Change (2025-10-07) |
|---|---|
| OEF | -0.289% |
| SPX | -0.381% |
| QQQ | -0.527% |
| IWM | -1.074% |
| MDY | -1.081% |
| IJR | -1.277% |
Analyzing the magnitudes of the declines, the large-cap segments, specifically OEF and SPX, exhibited the least severe percentage losses at -0.289% and -0.381%, respectively. The technology-heavy QQQ also demonstrated a relatively contained decline of -0.527%. In contrast, mid-cap (MDY) and small-cap (IWM, IJR) indices experienced more substantial percentage drops, with IJR leading the downside at -1.277%. This pattern suggests a potential preference for larger, more established companies in a risk-off environment, or perhaps these segments were more resilient to selling pressure. The relatively stronger performance in large-cap and tech indices, while still negative, might indicate that market participants perceived these areas as offering comparatively greater stability during the observed downturn.
The Volatility Index (VIX) experienced a notable increase on 2025-10-07, rising by 5.31% to close at 17.24. This advance in the VIX coincided directly with the broad-based declines observed across the equity indices. The VIX candle for the day was robustly bullish, opening at 16.58 and closing significantly higher at 17.24, after touching an intraday high of 17.55. This suggests a likely acceleration in implied volatility and a heightened perception of market risk, characteristic of an inverse correlation with equity performance during periods of selling pressure.
Over the past seven days, the VIX has generally exhibited an upward trajectory, moving from a close of 16.12 on 2025-09-29 to its latest close of 17.24. While there was a minor dip on 2025-10-06 (-1.68%), the significant surge on 2025-10-07 places the VIX at its highest closing level within the provided data set. The sustained higher closes in the VIX from October 1st through October 3rd, followed by the definitive upward move on October 7th, collectively indicate an increasing level of market uncertainty and risk aversion. This pattern implies that market participants are likely preparing for, or hedging against, potentially larger price fluctuations in the near term.
Given the unanimous declines across the primary equity indices and the corresponding surge in the VIX, a prevailing bearish sentiment is strongly indicated. A continuation of this trend in the immediate short term is likely, particularly if the VIX remains elevated or continues its ascent. Alternatively, the intensity of the single-day decline across all measured indices, especially in the small and mid-cap segments, could potentially set the stage for a short-term technical bounce due to an oversold condition. However, without further data points for confirmation, the current technical posture suggests that market participants are likely to remain cautious, and a resumption of downside pressure remains a non-negligible possibility.
As a CMT with extensive experience, I will provide a technical analysis of the provided market data, focusing solely on the price and volume patterns for SPY, QQQ, IWM, IJR, MDY, and OEF over the two-day period. Our assessment employs rigorous technical analysis principles and adheres strictly to ICD-203 estimative language guidelines.
Across the examined ETFs, we observe a broadly bearish technical posture emerging over the two-day period, particularly with the candle patterns on the second day. For SPY, following a day of significant indecision characterized by a narrow body and close near the open, the subsequent day printed a strong bearish candle. This second candle opened near its high and closed near its low, breaking below the previous day’s low, and was accompanied by a notable increase in trading volume from approximately 53.76 million to 71.83 million shares. This pattern suggests a shift in market sentiment from equilibrium to decisive selling pressure, and it is highly likely that SPY will face continued downward pressure in the immediate short term.
Similarly, QQQ and IWM also exhibited clear bearish continuation patterns. QQQ experienced a minor bearish close on the first day, which was then followed by a large bearish candle on the second day, again opening near its high and closing significantly lower, well below the previous day’s low. This bearish move was supported by a substantial increase in volume, rising from approximately 41.50 million to 58.00 million. IWM presented an even more pronounced bearish move on the second day, forming a large bearish candle that decisively broke below the prior day’s low, with volume remaining consistent at around 31 million shares. The conviction of sellers in both these indices appears to have strengthened, making it likely that the downward momentum could persist.
The mid-cap and small-cap indices reinforce this broad market weakness. IJR, representing small-cap stocks, showed two consecutive bearish candles, with the second day’s candle exhibiting a larger range and closing at a new two-day low. Volume saw a slight increase, from 3.85 million to 4.01 million, lending some support to the bearishness. MDY, tracking mid-cap stocks, displayed an exceptionally strong bearish signal on the second day; a large bearish candle closed significantly below the previous day’s low, and importantly, volume more than doubled from approximately 0.59 million to 1.32 million. This significant increase in selling volume combined with price depreciation in MDY makes further declines highly likely.
Conversely, OEF, comprising large-cap stocks, showed a slight bullish close on the first day. However, the second day reverted to a bearish candle, opening near its high and closing below the prior day’s close. Notably, OEF’s volume decreased from 0.46 million to 0.32 million on the second day. While this candle still indicates a short-term bearish shift, the decreasing volume suggests that the selling pressure may not be as aggressive or as broadly supported as observed in the other major indices. Therefore, OEF presents a roughly even chance of either consolidating around current levels or experiencing minor further downside, with the probability of a sharp decline appearing unlikely given the volume dynamics.
Considering the widespread and often high-volume bearish price action across SPY, QQQ, IWM, IJR, and MDY, we estimate a high likelihood of continued short-term downside pressure across the broader market. While OEF’s volume dynamics introduce a slight element of caution against overly aggressive bearish forecasts for that specific index, the overwhelming evidence from the other major ETFs points to a market facing significant selling pressure. An alternative scenario, though appearing unlikely given the strength of the second day’s bearish candles and associated volume, would involve an immediate reversal of sentiment. However, such a reversal would require an equally strong, high-volume bullish counter-move to negate the current technical setup.
Here is a technical analysis of the S&P 500 (SPX) based solely on the provided 90-day data for price action, the 14-day Relative Strength Index (RSI), and the 13-21 day Percentage Price Oscillator (PPO).
The S&P 500 (SPX) has exhibited a discernible uptrend over the past 90 days, with the price consistently establishing higher highs and higher lows. From a closing value of 5911.69 on May 30th, the index advanced to 6714.59 by October 7th, demonstrating persistent buying pressure throughout the period. This upward trajectory has been punctuated by several consolidation phases, but the general direction remains clearly bullish, reflecting a robust underlying sentiment based purely on price action. Notably, despite minor pullbacks, the index has generally maintained its upward momentum, reinforcing the primary trend.
Examination of the 14-day Relative Strength Index (RSI) reveals periods where momentum was strongly in favor of the bulls. The RSI frequently entered overbought territory (above 70) during sustained rallies, particularly in late June through late July, and again in mid-September. Notable peaks include 75.57 on July 3rd and 76.29 on July 28th, coinciding with strong price advancements. More recently, the RSI peaked at 74.75 on September 22nd when the SPX closed at 6693.75. While the SPX made a higher close of 6740.28 on October 6th, the RSI registered a lower peak of 71.60 on the same day. This pattern, where price achieves a higher high but the RSI forms a lower high, constitutes a bearish divergence. On October 7th, the RSI declined further to 66.12, retreating significantly from overbought levels, which often indicates waning buying interest.
The 13-21 day Percentage Price Oscillator (PPO) generally supported the bullish trend, remaining in positive territory for the majority of the 90-day period. The indicator’s positive values confirm that the shorter-term exponential moving average (13-day) has consistently been above the longer-term EMA (21-day), indicative of an enduring uptrend. However, similar to the RSI, the PPO data also presents a potential cautionary signal. The PPO reached a peak of 0.635 on September 22nd, aligning with the SPX’s close of 6693.75. As the SPX subsequently recorded a higher close of 6740.28 on October 6th, the PPO only managed a peak of 0.568. This concurrent pattern of a higher price high and a lower PPO high establishes another instance of bearish divergence, suggesting that the upward momentum is decelerating relative to price gains. On October 7th, the PPO slightly declined to 0.550, reinforcing the weakening momentum suggested by the divergence.
Considering the dual bearish divergences observed in both the 14-day RSI and the 13-21 day PPO against the recent higher price highs, it is likely that the SPX is experiencing weakening upward momentum. The retreat of the RSI from overbought conditions on October 7th further supports this assessment. While the overall trend has been robustly bullish, these divergences suggest that a period of consolidation or a near-term price pullback is likely. An alternative scenario is that the market might attempt another push higher; however, the current technical signals indicate that the likelihood of a sustained upward continuation without a prior corrective phase is reduced. Traders would be prudent to acknowledge these waning momentum signals, as they often precede shifts in short-term price direction within an ongoing primary trend. A failure to quickly recover positive momentum in both oscillators, especially if accompanied by further price weakness, would increase the probability of a more significant retracement.
As a Chartered Market Technician with over 15 years of experience, I’ve analyzed the provided 90-day technical data for QQQ, focusing on price action, RSI (14-day), and PPO (13,21-day). This analysis is solely based on the given indicators and price data, without external context.
From late May through much of July, QQQ displayed a clear upward trend. The 14-day Relative Strength Index (RSI) frequently entered the overbought zone, peaking at 73.1 on July 28th, which suggested an extended period of strong buying pressure and made a short-term correction likely. The Percentage Price Oscillator (PPO) remained positive but showed moderation, hinting at potential waning strength despite rising prices. This overextension preceded a sharp decline on August 1st, confirmed by a significant volume spike and the RSI plummeting to a neutral 48.26. Following this, QQQ established a series of higher lows (.88 on August 1st to .07 by September 3rd). Critically, during this stabilization, the PPO continued its decline, reaching a low of 0.177 on September 3rd. This pattern—where price forms higher lows while momentum (PPO) forms lower lows—constitutes a bullish divergence, indicating that underlying selling pressure was potentially exhausting and an upward price movement was likely.
September subsequently commenced with a renewed and robust uptrend for QQQ. The PPO decisively reversed its trajectory, climbing steadily from 0.177 on September 3rd to a peak of 0.812 on September 23rd, affirming a strong resurgence in positive momentum. The RSI simultaneously reflected this renewed buying interest, accelerating back into overbought territory, reaching 75.35 on September 22nd. This collective technical evidence strongly supported the continuation of the prevailing bullish trend through the latter half of September.
As of early October, QQQ’s price remains in a strong upward trend, trading near its recent highs. However, both momentum indicators suggest a temporary moderation. The RSI has pulled back from its overbought extreme of 75.35 to 65.23 on October 7th, suggesting a cooling of immediate buying enthusiasm and a potential for consolidation or a minor pullback in the very short term. Similarly, the PPO has exhibited a slight downtick from its recent peak of 0.812 to 0.727, corroborating the RSI’s indication of moderating momentum. Despite this, the PPO remains well above the zero line, indicating that the broader bullish momentum likely remains intact.
Considering these patterns, it is likely that QQQ may experience a brief period of consolidation or a shallow retracement in the immediate future as the market digests recent gains. A roughly even chance exists for QQQ to either continue its ascent after a minor pause or engage in a more pronounced, albeit short-lived, pullback, provided the PPO does not cross below the zero line and the RSI sustains above the 50-level. A breach of these key technical levels would imply a higher likelihood of a deeper correction. Conversely, if momentum re-accelerates from current levels, indicated by renewed upward movement in both PPO and RSI, it would signal a high likelihood of the existing uptrend continuing towards new highs.
Here is a technical analysis of IWM based exclusively on the provided 90-day market data for RSI (14-day), PPO (13, 21-day), and candle prices.
The price action for IWM over the past 90 days exhibits a clear and sustained bullish trend, characterized by a consistent pattern of higher highs and higher lows. From late July, where prices were consolidating around the 215-220 range, IWM initiated a strong upward movement, culminating in a series of new swing highs. The most recent price data shows IWM closing at 244.16 on October 7, following a high of 246.81 on October 6. This upward trajectory suggests a well-established intermediate-term advance, with price managing to hold gains after minor pullbacks.
Analysis of the 14-day Relative Strength Index (RSI) reveals periods of strong bullish momentum throughout the observed timeframe. The RSI frequently climbed into the upper 60s, touching overbought territory (above 70) in early July (71.57) and again in mid-September (71.23). Historically, these instances of RSI exceeding 70 were followed by brief periods of price consolidation or minor corrections. More recently, the RSI surged from 55.30 on September 25 to a robust 68.07 on October 6, indicating significant buying interest. However, the latest data point shows a retreat to 60.12 on October 7, suggesting a cooling of the intense upward pressure, although the RSI remains firmly in bullish territory above the 50-level.
The Price Percentage Oscillator (PPO), employing 13 and 21-day EMAs, has predominantly maintained positive values, further confirming the underlying bullish momentum in IWM. The PPO’s overall trend has mirrored the price, advancing during rallies and receding during pullbacks, yet consistently staying above its zero line. Notable PPO peaks were observed in mid-July (1.17) and again in late August/early September (1.01), with another peak reaching 1.00 on September 23. Following this, the PPO experienced a decline to 0.67 by October 1, indicating a temporary deceleration of momentum. While it subsequently rebounded to 0.74 on October 6, the latest value of 0.705 on October 7 shows a slight dip. This recent fluctuation indicates that while bullish momentum is still present, it has moderated from its recent high points.
In synthesis, the collective technical evidence points to an ongoing bullish environment for IWM. The consistent pattern of higher highs and higher lows in price action, complemented by a PPO that has largely remained positive over the 90-day period, suggests that the intermediate-term uptrend is likely to persist. Nevertheless, the recent decline in both the RSI from its near-overbought levels and the PPO from its recent peak indicates a moderation of immediate buying enthusiasm. Therefore, a period of near-term price consolidation or a minor pullback is a roughly even chance development before the broader bullish trajectory potentially reasserts itself. There are no definitive technical signals within the provided data to suggest an imminent reversal of the primary uptrend.
Tech Sector Analysis
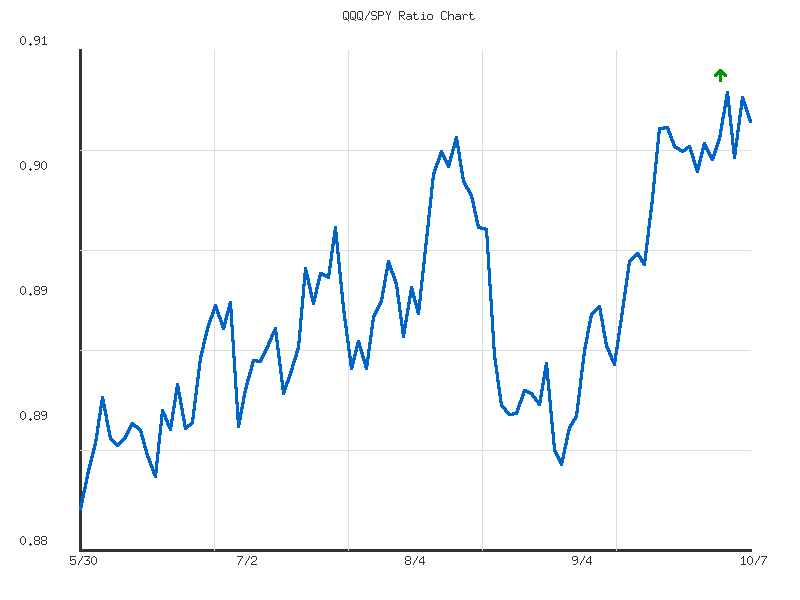
Technical analysis of the QQQ/SPY ratio indicates a divergence in relative performance trends across different time horizons, necessitating a nuanced interpretation. Over the 30-day period, the ratio demonstrates an upward trend, signifying outperformance by the technology-heavy NASDAQ-100 (QQQ) relative to the broader S&P 500 (SPY). This trend, however, is characterized as “weak” despite a cumulative change of 1.79%. The current ratio of 0.90344 is positioned near the high end of its 30-day range (0.90513), specifically at a relative position of 0.922, suggesting that the recent price action contributed significantly to this outperformance. Given the established upward trajectory and the current ratio’s high relative position within the longer timeframe, it is likely that QQQ has sustained a period of relative strength against SPY.
Conversely, the shorter 14-day timeframe reveals a “sideways” trend for the QQQ/SPY ratio, also described as “weak” in strength. The change percent over this period is a minimal 0.50%, further underscoring the lack of strong directional conviction. The current ratio of 0.90344, while consistent with the 30-day measure, resides at a relative position of 0.728 within its 14-day range, indicating it is above average but not at the absolute high of this more recent period. The volatility in the 14-day window is significantly lower compared to the 30-day period (0.00000245 vs. 0.0000477), implying a consolidation phase or a period of reduced relative momentum. This suggests that the prior outperformance observed over the past month has entered a pause or equilibrium state in the immediate short term.
Reconciling these timeframes, the overall technical posture indicates a decelerating outperformance by QQQ. While the 30-day trend points to QQQ having the upper hand, the 14-day consolidation suggests a diminished appetite for continued aggressive outperformance. The “weak” strength attribute for both timeframes implies that even during the upward trend, the conviction behind the move was not robust, and the subsequent sideways movement lacked strong bearish pressure. Therefore, there is a roughly even chance that QQQ’s relative outperformance will resume its upward trajectory from its current consolidation, as there is that it will continue to trade in a sideways pattern.
For QQQ to decisively resume its outperformance, the ratio would need to breach the 14-day high of 0.90513 with strong momentum, preferably on increased volatility. Conversely, a sustained break below the 14-day average ratio of 0.90226 would signal a likely shift towards relative underperformance or a more pronounced period of consolidation. Given the low volatility and weak trend strength across both timeframes, strong directional moves in relative performance are unlikely in the immediate future without new technical catalysts emerging from the ratio’s price action itself.
Greetings, fellow traders. As a CMT with over 15 years of experience, I’ve conducted a rigorous technical analysis of the QQQ/SPY ratio over the past 90 days. This ratio provides valuable insight into the relative strength of the Nasdaq 100 ETF (QQQ) against the S&P 500 ETF (SPY), essentially gauging whether growth-oriented technology stocks are outperforming the broader market. Our analysis is based purely on the provided data, without external context.
The QQQ/SPY ratio has exhibited a discernible upward trend over the 90-day period, commencing from approximately 0.8807 at the end of May and closing at 0.9034 on October 7th. This upward movement represents a 2.575% increase, clearly indicating a period of outperformance by QQQ relative to SPY. Despite this positive trajectory, the trend strength is officially characterized as “weak” within the provided data. This classification suggests that while the direction of QQQ’s relative outperformance is evident, the momentum or conviction behind this move may not have been exceptionally forceful or consistently strong, possibly incorporating periods of consolidation or minor pullbacks within the larger uptrend. The current ratio stands notably near the top of its historical range for this specific timeframe.
Examination of the ratio’s price action reveals a well-defined range, with a 90-day low established at 0.8807 and a recent high reached at 0.9051. The ratio experienced a significant push higher in late September and early October, culminating in a fresh 90-day peak of 0.9051 on October 2nd. This breach above prior resistance around the 0.9030 area is technically notable, hinting at increased conviction in QQQ’s relative strength. However, the immediate reaction on October 3rd saw a swift retracement to 0.9013, suggesting some profit-taking or supply emerging at the new high. The subsequent strong rebound on October 6th to 0.9048, which closely retested the peak, followed by a slight dip to 0.9034 on October 7th, indicates ongoing contention around this newly established resistance level.
A crucial aspect of this data is the extremely low volatility metric of 0.000039. This implies a remarkably smooth and consistent ascent in the ratio, rather than sharp, erratic price swings. This subdued volatility, combined with the “weak” trend strength, paints a picture of a gradual, persistent outperformance that has avoided significant corrections or accelerations. Given the ratio’s current positioning at the 93rd percentile of its 90-day range and the recent challenge of a new high, it is likely that the ratio will either consolidate around these current levels or initiate another attempt to decisively break above the 0.9051 resistance in the near term. A sustained move above this level would typically signal continued outperformance by QQQ.
Considering alternative scenarios, should the ratio fail to establish a convincing hold above the 0.9051 level, there is a roughly even chance that it could pull back towards the prior resistance-turned-potential-support area, approximately around the 0.9000 to 0.9010 range. A more substantial retracement, potentially targeting the 90-day average ratio of 0.8922, appears unlikely in the immediate short-term, especially given the observed positive momentum and the very low volatility. Nevertheless, if the ratio were to experience a decisive close below 0.9000, the probability of such a deeper correction would increase. The current technical landscape suggests that market participants lean towards QQQ outperformance, with the recent 90-day high and immediate support levels being critical focal points for future price action.
IWM vs. SPY
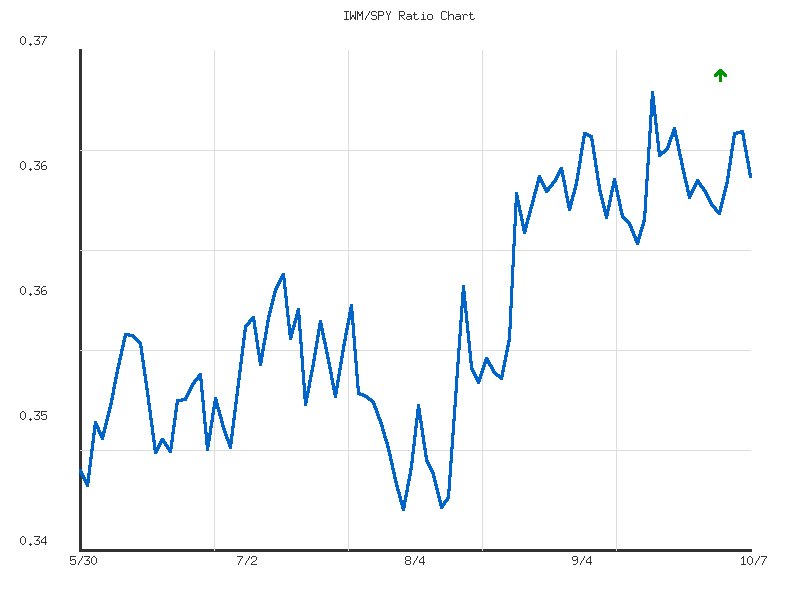
Analysis of the IWM/SPY ratio provides insight into the relative performance between the Russell 2000 and the S&P 500. Over the most recent 14-day period, the ratio exhibits a weak downward trend, evidenced by a -1.30% change. This indicates a period of underperformance by IWM relative to SPY in the short term. The current ratio stands at 0.364897, which is below the 14-day average of 0.365578 and positioned in the lower third of its range, with a relative position of 0.307. Despite the downward bias, the observed volatility for this period is notably low (0.0000036), suggesting that the relative movements have been contained within a narrow channel. Given this established weak downward momentum and the current ratio’s lower-end positioning, it is likely that IWM will continue to underperform SPY in the immediate future, assuming the current technical environment persists.
Conversely, the 30-day analysis of the IWM/SPY ratio presents a weak sideways trend, characterized by a marginal positive change of 0.48%. This suggests that over the broader intermediate term, neither IWM nor SPY has established a clear, sustained relative performance advantage. The current ratio of 0.364897 is marginally above the 30-day average of 0.364719, and its relative position of 0.445 within the 30-day range places it near the midpoint. The volatility for the 30-day period is also low (0.0000038), reinforcing the characterization of a stable, range-bound relative performance. Considering the weak sideways trend over the intermediate term, it is a roughly even chance that IWM will either mildly outperform or underperform SPY in the coming period, provided no new technical catalysts significantly disrupt the current equilibrium.
A comparative analysis of these two timeframes reveals a divergence in short-term and intermediate-term relative performance dynamics. The 14-day data points to recent IWM underperformance, while the 30-day data suggests a more neutral, balanced relative strength. The current ratio has recently pulled below its short-term average but remains closely aligned with its intermediate-term average. This configuration implies that while immediate momentum favors SPY, the broader relative strength landscape remains finely balanced. It is likely that the IWM/SPY ratio will continue to exhibit relatively low volatility. For the immediate future, continued weak underperformance by IWM is likely, following the established 14-day trend. However, a significant or accelerated move lower in relative terms would be unlikely to sustain without a clear break from the observed intermediate-term sideways consolidation. An alternative scenario exists where the ratio could revert higher towards its 30-day average, signaling a moderation of IWM’s recent underperformance; this alternative carries a roughly even chance given the weak nature of both trends and the ratio’s position near its longer-term average. A decisive technical signal, such as a confirmed break above the 14-day average or a breach of the 30-day low, would be necessary to establish a more definitive directional bias.
As a CMT with extensive experience, my analysis of the provided IWM/SPY ratio data over the 90-day period reveals a discernible technical picture of relative strength.
The IWM/SPY ratio has exhibited a clear upward trend of moderate strength throughout the observed 90-day period. This sustained ascent, marked by a 4.87% increase from the initial data point, indicates a consistent outperformance by the Russell 2000 (IWM) relative to the S&P 500 (SPY). The current ratio, standing at approximately 0.3649, is notably positioned above the 90-day average of 0.3567, underscoring the ongoing positive momentum. The reported low volatility for the period suggests that this trend has developed with relatively stable movements, rather than erratic price swings.
From a structural perspective, key technical levels are identifiable within the provided data. The 90-day high, established at approximately 0.3697 on September 18th, represents a significant resistance level that the ratio recently approached. Conversely, the 90-day low of roughly 0.3457, recorded on August 1st, serves as a primary support level. Closer examination of the data points reveals an intermediate support zone forming around the 0.350-0.352 range, where the ratio found consistent buying interest or consolidated on multiple occasions. The current ratio of 0.3649 places it at approximately 80% of its observed 90-day range, indicating a strong relative position skewed towards the upper end of its recent trading activity.
Analyzing the recent price action, the ratio experienced a minor retracement after testing the 0.3697 resistance on September 18th. This pullback found subsequent support around the 0.360-0.362 level, from which the ratio has since rebounded to its current standing of 0.3649. Given the established moderate upward trend and the current strong relative positioning, it is likely that the IWM/SPY ratio will re-challenge the resistance at 0.3697 in the near term. A decisive breach above this level would signal a likely continuation of IWM’s outperformance, potentially leading to further gains and establishing new relative highs.
However, alternative scenarios warrant consideration. Should the ratio fail to convincingly surpass the 0.3697 resistance, it is roughly even chance that it would enter a period of consolidation or experience a deeper pullback. In such a scenario, a retest of the intermediate support zone around 0.360-0.362 would become likely. A break below this intermediate support would increase the likelihood of the ratio declining towards the more significant 0.350-0.352 support area. While the observed low volatility suggests that sharp, abrupt reversals are unlikely, a sustained lack of buying interest could gradually erode the current moderate uptrend.
Commodities
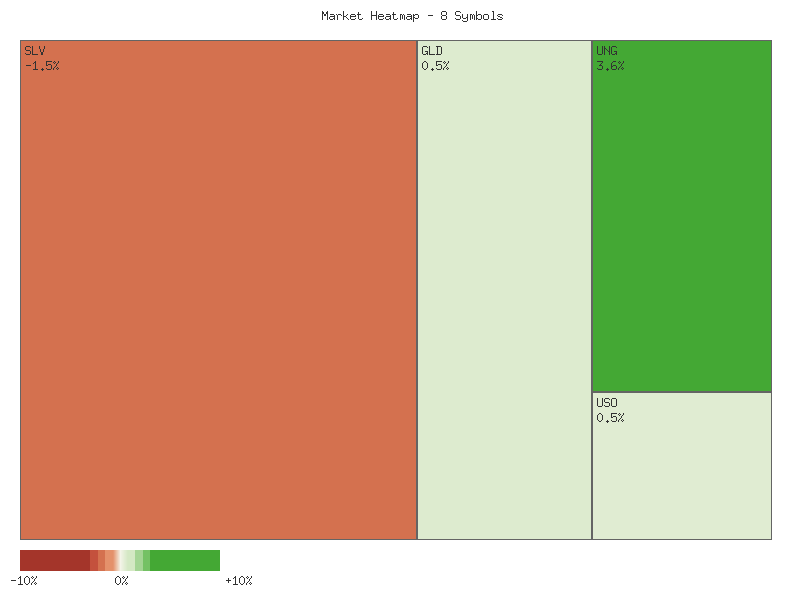
The provided market data for 2025-10-07 indicates a mixed but generally advancing performance across the selected commodity symbols. The daily percent changes are summarized in the following matrix:
| Symbol | Daily Percent Change |
|---|---|
| UNG | 3.609% |
| CPER | 0.546% |
| GLD | 0.516% |
| USO | 0.453% |
| DBC | 0.398% |
| UGA | 0.212% |
| CORN | -0.515% |
| SLV | -1.521% |
The aggregate sum of the daily percent changes across all eight symbols is approximately +3.698%. This net positive movement suggests an overall higher valuation for this specific basket of commodities on the observed day. Market breadth leans decisively positive, with six out of the eight analyzed symbols advancing (UNG, CPER, GLD, USO, DBC, UGA) and only two symbols declining (CORN, SLV). This broad participation in price appreciation suggests that upward momentum was prevalent across a significant portion of this commodity group.
UNG exhibited the strongest performance, advancing by a considerable 3.609%, functioning as a clear outlier. Following UNG, CPER, GLD, USO, DBC, and UGA recorded positive daily changes, ranging from 0.546% down to 0.212%. Conversely, CORN and SLV experienced declines of -0.515% and -1.521% respectively, with SLV demonstrating the most significant drawdown. The robust performance of UNG likely contributed substantially to the overall positive aggregate change; absent UNG’s contribution, the overall market movement would appear less decisively positive.
Analysis of the GLD/SLV ratio over the past 14 days reveals a moderate downward trend, characterized by a change of approximately -4.45%. The current ratio of 8.441 is marginally below its 14-day average of 8.455, indicating a period of silver outperformance relative to gold. The ratio’s relative position within its 14-day range, at 0.362, suggests it is closer to its low than its high, reinforcing the perception of silver’s comparative strength. The current daily data, where GLD advanced while SLV declined with greater magnitude, appears consistent with silver’s short-term underperformance on that specific day, however, this contradicts the broader 14-day trend of silver outperformance.
Extending the observation to the 30-day period, the GLD/SLV ratio also exhibits a moderate downward trend, marked by a larger change of approximately -5.28%. The current ratio of 8.441 is notably below its 30-day average of 8.671, suggesting a more sustained period of silver outperformance relative to gold. The relative position of 0.291 confirms the ratio is near the lower end of its 30-day range, implying persistent weakness in gold relative to silver over this extended timeframe. The higher volatility (0.060) observed over the 30-day period compared to the 14-day period (0.035) indicates more pronounced fluctuations in the gold-to-silver relationship in the longer term.
Considering the persistent moderate downward trend in the GLD/SLV ratio across both 14-day and 30-day periods, a continuation of silver outperforming gold is likely in the near-to-medium term. The current ratio residing well below its respective average values, coupled with its position closer to 30-day lows, points to a probable continuation of this dynamic. However, the increased volatility over the 30-day period implies that sharp, short-term reversals in this established trend are plausible, though such reversals are less likely to alter the overall downtrend without substantial new market drivers.
As a seasoned CMT with over 15 years of experience, a rigorous technical analysis of the provided two-day market data for various commodity ETFs reveals a notably divergent landscape across different sectors. While certain energy components and precious metals exhibit discernible bullish patterns, other segments, particularly silver and corn, indicate emerging weakness or indecision. This divergence suggests that a unified directional move across the broader commodity complex is currently unlikely based purely on these short-term technical observations.
In the energy sector, the technical picture is largely constructive. The United States Oil Fund (USO) recorded higher highs, higher lows, and higher closes over both days, indicating a likely continuation of its upward trajectory. Although volume slightly decreased on the second day, the consistent price appreciation suggests sustained buying interest. The United States Natural Gas Fund (UNG) presented a particularly strong bullish signal, closing significantly higher on the second day with a notable increase in volume, which strongly indicates a likely continuation of the bullish trend for natural gas. The United States Gasoline Fund (UGA) also posted a higher close; however, the substantially lower volume on its second day suggests a roughly even chance of either further consolidation or a slowdown in upward momentum, despite the net positive price action.
Precious metals show a clear divergence. The SPDR Gold Shares (GLD) demonstrated robust bullish momentum, posting higher highs, higher lows, and higher closes with a gap up on the second day’s open. This pattern indicates a likely continuation of its established uptrend. Conversely, the iShares Silver Trust (SLV) exhibited a distinctly bearish two-day pattern, characterized by lower highs, lower lows, and a significant lower close on the second day, accompanied by an increase in volume. This confirms selling pressure and makes it highly likely that SLV will face further downward pressure in the immediate term.
Turning to industrial metals and agriculture, the technical signals are more nuanced. The iPath Series B Bloomberg Copper Subindex Total Return ETN (CPER) opened strongly on the second day but closed with a relatively short body and a long upper wick, indicating some resistance or profit-taking after the initial surge. Coupled with declining volume on the second day, this pattern suggests a roughly even chance of either a pause or consolidation, rather than a strong directional move. For the Teucrium Corn Fund (CORN), the price action was largely sideways on the first day, followed by a lower close near its low on the second day, on reduced volume. This suggests a likely predisposition for further weakness, although the low volume on both days implies limited conviction behind these moves. The Invesco DB Commodity Index Tracking Fund (DBC), being diversified, registered higher highs, higher lows, and higher closes with increasing volume, which suggests a likely continuation of this upward momentum, possibly driven by its more bullish energy components outweighing some of the weaker elements.
Technical Analysis of SLV (90-Day Outlook)
SLV has demonstrated a robust bullish trend over the past 90 days, characterized by a significant upward price trajectory from approximately in late May to recent highs near in early October. The early part of the period, from late May through early July, saw SLV consolidate around the -.50 range after an initial surge. This was followed by an acceleration in upward momentum, particularly noticeable from late August into September and October. Volume analysis indicates periods of strong conviction during upward movements, such as the initial rally in early June (over 50 million shares), and sustained high volume throughout September and early October (frequently exceeding 30-40 million shares), which supported the continuation of the rally. However, the most recent trading day, October 7th, recorded a slight price pullback on notable volume (over 42 million shares) from the previous day’s high of .26, closing at .39, suggesting a potential shift in immediate-term dynamics.
The Relative Strength Index (RSI-14) provides crucial insights into the momentum of this uptrend. RSI consistently entered overbought territory (above 70) during periods of strong price appreciation, particularly in early June, mid-July, and multiple times throughout September and early October. On September 15th, RSI reached a peak of 75.38, corresponding with a local price high. More recently, RSI climbed to an extreme high of 81.55 on October 6th, indicative of an extended overbought condition. However, on October 7th, despite the price trading near its recent highs, the RSI declined sharply to 74.20. This pronounced dip in RSI while price sustained near peak levels, combined with significant volume on the down day, suggests a potential loss of strong bullish momentum and could be interpreted as a bearish divergence, where price continues to make new highs or consolidates at highs, but the internal strength (RSI) is weakening.
The Price Percentage Oscillator (PPO 13,21-day) generally confirms the bullish trend, having remained positive throughout the entire 90-day observation period, indicating that the shorter-term moving average (13-day) has consistently stayed above the longer-term one (21-day). PPO reached its highest point in the dataset on October 6th, registering 2.83, reflecting extremely strong momentum. However, similar to the RSI, the PPO experienced a slight pullback to 2.78 on October 7th. While still at highly elevated levels and indicative of an overarching strong uptrend, this minor decline in PPO at the very end of the period, coupled with the notable RSI deceleration, suggests that the rate of ascent may be beginning to slow.
Considering the technical landscape, it is likely that SLV could experience a short-term consolidation or minor pullback following the prolonged and aggressive rally. The combination of an extended period in overbought RSI territory, the recent sharp decline in RSI from its peak, and the slight deceleration in PPO, even from highly bullish levels, collectively point to an increasing probability of a temporary relief in upward pressure. A near-term retracement towards the - area, which could act as initial support, appears to have a roughly even chance. However, given the strong underlying uptrend evident from the sustained positive PPO and previous instances where SLV consolidated before resuming its climb, a more significant trend reversal is unlikely at this immediate juncture unless accompanied by further decisive breakdowns in price and momentum indicators. Traders should monitor volume on any potential downside moves, as heavy selling volume would strengthen the case for a deeper correction. Conversely, a quick rebound above on strong volume would negate these near-term concerns.
GLD Technical Analysis: Sustained Bullish Momentum with Extreme Overbought Conditions
The technical analysis of GLD over the past 90 days reveals a pronounced and robust uptrend, particularly notable from late August through the current period. Price action initially exhibited a choppy, range-bound behavior from late May to early August, primarily trading between approximately and . However, a significant shift occurred in late August, transitioning into a strong, ascending channel characterized by a consistent series of higher highs and higher lows. This upward price movement has been accompanied by generally increasing volume during major rallies, especially noticeable in early September and late September/early October, which likely reinforces the conviction behind the buying pressure. The most recent price points, culminating in the October 7th close at .26, indicate a continuation of this strong upward trajectory, with the daily candle closing near its high, suggesting persistent bullish sentiment.
The 14-day Relative Strength Index (RSI) corroborates this strong bullish momentum. After fluctuating within a neutral range (roughly 40-65) for much of June and July, the RSI decisively moved into overbought territory (above 70) around late August and has remained significantly elevated since. On October 7th, the RSI registered an extreme value of 83.69. While such deeply overbought readings could potentially foreshadow a period of consolidation or a short-term pullback, it is important to note that a sustained RSI above 70 is also characteristic of powerful, trending markets. At this juncture, there is no clear indication of bearish divergence, where price makes new highs not confirmed by RSI, suggesting the underlying momentum is still robust.
Further validating the strength of the current trend is the 13-21-day Percentage Price Oscillator (PPO). The PPO, a momentum oscillator, crossed above its zero line in early August and has maintained a positive and consistently increasing trajectory thereafter. The current PPO value of 1.752 on October 7th is markedly high, providing a strong technical confirmation of the bullish momentum observed in both price and RSI. The PPO’s sustained positive values make it likely that the intermediate-term trend remains firmly positive, as it signals that the shorter-term exponential moving average is significantly above the longer-term one.
Considering the confluence of these indicators, the overall technical posture for GLD is decidedly bullish. The clear uptrend in price action, coupled with strong volume and sustained positive momentum from both RSI and PPO, strongly suggests a continuation of the upward movement. While the extremely overbought RSI reading raises the possibility of a short-term consolidation or minor retracement, there is no compelling evidence within the provided data to indicate an imminent trend reversal. Should GLD begin to show weaker closing prices on higher volume, or if the RSI starts to exhibit bearish divergence from price, a deceleration in the current ascent would likely occur. However, based solely on the data provided, the prevailing technical conditions imply continued strength.
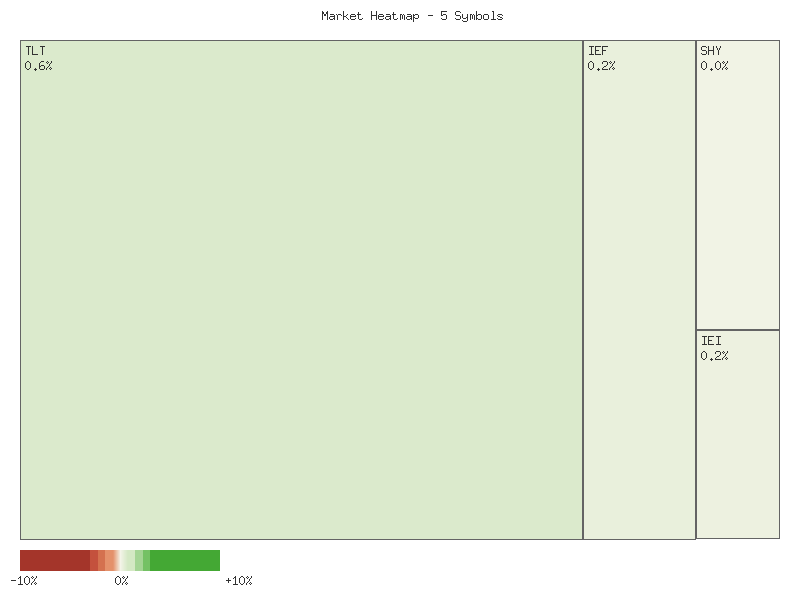
Bonds
The provided technical data for TLT, UTHY, IEF, IEI, and SHY reflects their daily percentage changes over a two-day period. Aggregating the individual daily changes provides a consolidated view of performance for each symbol. The cumulative two-day percentage changes are presented in the following matrix, sorted in descending order:
| Symbol | Cumulative 2-Day Percent Change |
|---|---|
| IEI | 0.025% |
| SHY | 0.024% |
| IEF | -0.041% |
| UTHY | -0.180% |
| TLT | -0.219% |
From this aggregated perspective, the performance of these fixed-income-oriented instruments appears predominantly negative over the two-day observation window, despite some marginal positive moves from the shorter duration instruments.
The aggregate performance across all five symbols for the two-day period resulted in a net change of approximately -0.391%. This figure indicates an overall lower trajectory for the observed basket of instruments. Given the narrow range of values, with the largest decline being -0.219% (TLT) and the largest advance being 0.025% (IEI), the magnitude of this overall decline is relatively contained. It is unlikely that this constitutes a significant trend development without further corroborating data points. Instead, this aggregate movement might be indicative of a period of slight pressure or consolidation within these specific duration segments.
Analyzing the market breadth on the initial day, October 6, 2025, reveals a clear pattern of uniform decline. All five symbols (TLT, UTHY, IEF, IEI, SHY) registered negative daily percentage changes. This translates to zero advancing symbols and five declining symbols, representing 0% advancers and 100% decliners. Such unanimous downside participation across the monitored assets indicates a broad-based bearish sentiment for this specific group on that particular day. It is highly likely that this broad-based selling pressure was driven by a common underlying factor affecting fixed-income instruments, although the provided data does not offer insight into the specific catalysts.
Conversely, the market breadth shifted dramatically on the subsequent day, October 7, 2025. On this day, all five symbols recorded positive daily percentage changes. This implies a market breadth of five advancing symbols against zero declining symbols, or 100% advancers. This complete reversal from the prior day’s breadth is a significant technical observation. It strongly suggests a rebound or a shift in sentiment for these instruments. The pattern of a complete downturn followed by a complete upturn within a two-day window, while limited in scope, might indicate a short-term whipsaw action or a potential mean reversion tendency. It is unlikely that this represents a sustained bullish breakout given the overall two-day cumulative performance, which remained negative for the majority.
The observed two-day price action demonstrates a pronounced pattern of reversal. Day one exhibited unanimous declines, followed by day two’s unanimous advances. This ‘down then up’ sequence for all instruments implies a potential short-term bounce after initial selling pressure. However, the cumulative two-day performance for the longer-duration instruments (TLT, UTHY, IEF) remained in negative territory, suggesting that the day two rally was insufficient to fully offset the prior day’s losses. The shorter-duration instruments (IEI, SHY) managed to eke out marginal positive cumulative gains. The narrowness of the dataset, spanning only two days and five symbols, limits the robustness of long-term trend conclusions. It is roughly an even chance that this two-day pattern signifies either the initiation of a broader consolidation phase or merely a short-term technical reaction within a prevailing trend. Without additional data points, particularly volume analysis and longer-term moving averages, it is difficult to ascertain the predictive power of this two-day whipsaw. Continued monitoring for confirmation of either a sustained recovery or a resumption of prior trends would be prudent.
Technical Market Commentary: U.S. Treasury Bond ETFs (Oct 6-7, 2025)
Analysis of the provided 2-day candle data for various U.S. Treasury bond ETFs indicates a general shift towards positive price action on October 7th, 2025, following a period of relative indecision or slight weakness on October 6th. This broadly suggests a likely short-term upward momentum across the Treasury curve, though with varying degrees of conviction among different maturities. The market appears to have resolved the prior day’s consolidation in favor of the bulls for most of these instruments.
The iShares 20+ Year Treasury Bond ETF (TLT) exhibited a particularly notable shift. On October 6th, TLT presented a very small bearish candle, indicating a roughly even chance between buyers and sellers, closing near its open. However, October 7th saw a decisive bullish candle, opening higher than the previous day’s close and closing near its daily high of 89.18. The increase in volume on this bullish day, from approximately 28.3 million to 29.1 million shares, suggests a likely increase in buying conviction accompanying the price advance. This pattern of a strong bullish close on increased volume, following prior indecision, makes it probable that TLT will experience continued upward price pressure in the immediate short-term, with the high of 89.38 potentially serving as a near-term resistance target.
Moving to the intermediate-term bond ETFs, the iShares 7-10 Year Treasury Bond ETF (IEF) and the iShares 3-7 Year Treasury Bond ETF (IEI) both mirrored TLT’s general upward trajectory on October 7th. IEI, with a slightly increased volume (1.6M to 1.8M), demonstrates a likely more robust bullish sentiment compared to IEF, which saw its volume decrease from 6.3M to 5.1M during its bullish advance. This divergence in volume suggests that while both are showing upward price movement, the strength of the rally in IEI is probably more sustainable in the immediate term than that in IEF. UTHY, a leveraged ETN tracking longer-term Treasuries, also closed significantly higher on October 7th after a prior bearish close. However, UTHY’s substantial volume decrease from 11.5K to 3.5K on the bullish day implies that this particular upward move is unlikely to be sustained without renewed buying interest, potentially leading to a roughly even chance of consolidation or a slight retracement.
The iShares 1-3 Year Treasury Bond ETF (SHY) presented the most stable price action over the two days. Both candles were very small, indicating minimal volatility and tight trading ranges. While October 7th did close slightly higher with a small bullish candle, the reduced volume and narrow range make it very unlikely that SHY is entering a significant trend, rather suggesting a high probability of continued range-bound trading in the immediate future. Overall, the data points to a likely bullish bias for the longer end of the Treasury curve (TLT, IEI) in the immediate short-term, primarily driven by stronger buying conviction. However, for instruments like IEF and UTHY, the declining volume accompanying their price increases suggests a roughly even chance that these rallies may encounter resistance or consolidate in the very near term as conviction wanes. An alternative scenario to sustained upside across the curve would involve a swift reversal, particularly if subsequent trading days exhibit strong bearish candles on increasing volume, a scenario which, given the current data, appears unlikely in the very short-term for TLT and IEI but remains a possibility for IEF and UTHY.
Crypto
The provided market data reveals a clear two-day technical pattern for both IBIT and ETHA, characterized by an initial positive movement followed by a larger negative reversal, resulting in overall declines for both instruments. The aggregated two-day performance for each symbol is presented in the following matrix, sorted by net percent change in descending order:
| Symbol | Net Percent Change (2-day) |
|---|---|
| ETHA | -0.815% |
| IBIT | -0.910% |
Analysis of IBIT’s two-day performance shows an initial gain of 2.12% on the first day, subsequently negated by a more significant decline of 3.03% on the second day. This dynamic indicates a likely exhaustion of buying pressure following the initial rally, with sellers taking control to push the price lower. The second day’s price action not only erased the prior day’s gains but also pushed the overall change into negative territory, resulting in a net decline of approximately 0.91%. This pattern suggests a probable shift in short-term momentum from bullish to bearish, with the closing price of the two-day period falling below the opening price of the period, which technical analysts often interpret as a two-day bearish reversal.
Similarly, ETHA exhibited an initial advance of 4.47% on the first day, which was then entirely surrendered by a larger drop of 5.28% on the subsequent day. The magnitude of these daily swings highlights a higher degree of short-term volatility in ETHA compared to IBIT. Despite the larger absolute movements, ETHA’s net decline of approximately 0.81% was marginally less severe than IBIT’s. However, the overarching pattern remains consistent with IBIT: an initial surge followed by a more dominant sell-off, indicating a probable lack of sustained buying interest at elevated levels and a likely increase in selling pressure.
The overall change for both IBIT and ETHA over the two-day period is definitively lower. Both symbols demonstrate a ’negative reversal’ pattern, where initial gains are aggressively given back, suggesting probable profit-taking or the encounter of significant resistance at intraday highs. This implies that while there was initial bullish intent, it was insufficient to maintain upward trajectory, with bearish forces ultimately prevailing. It is unlikely that an immediate upward trend is developing for either instrument based solely on this two-day data, as the larger negative movements on the second day for both symbols indicate waning bullish conviction. There is a roughly even chance that this short-term negative momentum could persist into the immediate trading sessions, or that prices could stabilize before finding a clear direction, given the lack of further historical data to establish trend strength or support levels.
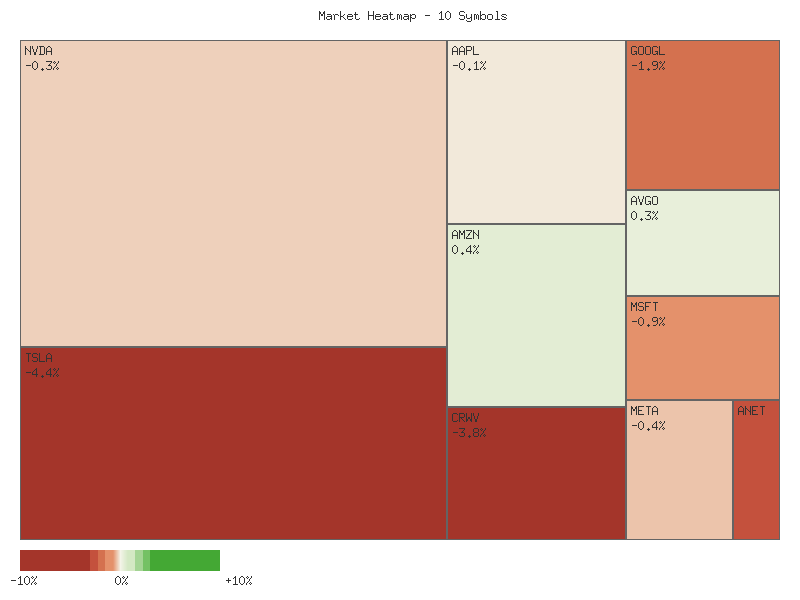
Magnificent 7 & Friends
Analysis of the provided technical data reveals a predominantly mixed market sentiment across the selected symbols over the two-day period, despite an aggregate net decline. The summation of the two-day percentage changes for all ten symbols indicates an overall decrease of approximately -3.17%. This suggests a slight downward bias for the aggregate portfolio under review. However, a deeper examination of market breadth provides a more nuanced perspective, highlighting internal crosscurrents rather than a uniform directional move.
Market breadth metrics for this specific basket of symbols show an even distribution of advancing and declining issues. Five symbols concluded the two-day period with positive cumulative returns (MSFT, AMZN, TSLA, META, GOOGL), while five symbols registered negative cumulative returns (ANET, AVGO, AAPL, NVDA, CRWV). This perfectly balanced breadth ratio suggests that the market’s underlying conviction is likely equivocal, with bullish and bearish forces achieving a rough equilibrium across these components. Such mixed breadth makes it difficult to ascertain a strong short-term directional bias for the collective group, implying that rotational dynamics may be more influential than broad-based sentiment.
Individual symbol performance exhibits considerable dispersion, underscoring the mixed sentiment. Microsoft (MSFT) demonstrated notable strength, registering the highest cumulative gain of approximately 1.30%, followed closely by Amazon (AMZN) at roughly 1.03%. Conversely, CRWV experienced the most significant weakness, declining by approximately -4.45% over the period, indicating a likely continuation of bearish momentum for this specific equity. Tesla (TSLA) displayed significant intraday volatility, with a substantial gain on the first day largely offset by a decline on the second, resulting in a modest net positive change of approximately 1.00%. Similarly, Arista Networks (ANET) saw a strong advance followed by a near-equal decline, closing out with a marginally negative cumulative change of roughly -0.07%, suggesting that directional conviction was notably absent for this symbol.
The presence of symbols exhibiting large daily swings, such as TSLA and ANET, suggests that intra-period volatility was a salient characteristic for certain names. Despite the overall aggregate portfolio decline, the equal number of advancing and declining stocks makes a definitive directional forecast for the immediate future of this group highly uncertain. It is plausible that sector-specific or idiosyncratic factors are influencing individual stock performance more significantly than broad market themes. Consequently, while the aggregate value of this basket moved lower, the underlying technical patterns point to a market environment characterized by a roughly even chance of either slight upward or downward movement in the near term, depending on which components exert greater influence.
The cumulative two-day percentage changes for each symbol are presented below:
| Symbol | Total Daily Percent Change |
|---|---|
| MSFT | 1.30% |
| AMZN | 1.03% |
| TSLA | 1.00% |
| META | 0.36% |
| GOOGL | 0.21% |
| ANET | -0.07% |
| AVGO | -0.58% |
| AAPL | -0.60% |
| NVDA | -1.38% |
| CRWV | -4.45% |
Here is a technical analysis of the provided market data for the past two trading days, presented in a format suitable for retail traders:
The market activity observed over the past two days, October 6th and 7th, 2025, indicates a notable shift in sentiment across several major equities. While October 6th saw a predominantly bullish bias with many stocks closing strong, October 7th witnessed significant reversals and continuations of bearish momentum in a majority of the analyzed symbols. This suggests a likely increase in selling pressure outweighing buying interest for a significant portion of this group. The breadth of this shift points to a collective market re-evaluation rather than isolated stock-specific movements.
Several stocks displayed a distinct bearish reversal pattern, indicative of a shift in short-term momentum. NVDA, after a small bullish close on October 6th, presented a Dark Cloud Cover pattern on October 7th, opening above the prior close but ultimately closing significantly lower. This suggests a likely increase in selling pressure. Similarly, GOOGL and MSFT, following strong bullish closes on October 6th, experienced large bearish candles on October 7th, with GOOGL exhibiting a gap down at open and a strong bearish close near its low, making a continued downward movement highly likely. TSLA also showcased a strong bullish candle on October 6th, which was significantly negated by a large bearish candle on October 7th with higher volume, strongly indicating a bearish engulfment pattern and making further downside highly likely. META also formed a Dark Cloud Cover pattern, suggesting a likely retracement.
The bearish sentiment was not limited to reversals, as some stocks showed strong bearish continuation. CRWV, which on October 6th formed a bearish candle with a long upper shadow, saw a strong bearish follow-through on October 7th with higher volume and a close at a new two-day low. This robust bearish action makes a continued downward trend almost certain in the immediate term. ANET exhibited a similar pattern, with two consecutive large bearish candles closing near their lows, accompanied by sustained high volume, suggesting that a further decline is almost certain.
Conversely, a few symbols demonstrated resilience or even potential bullish reversal. AMZN, after forming a bullish hammer-like candle with a long lower shadow on October 6th, saw a continuation of upward movement on October 7th with a higher close, albeit on lower volume. This suggests that the buying interest at the lows is likely persisting. AVGO, despite an initial rejection from highs on October 6th, formed a hammer-like candle on October 7th, closing higher than its open after posting a significantly lower intraday low. This suggests a likely emergence of buying interest at lower levels, potentially setting the stage for a short-term bounce. AAPL remained largely indecisive over the two-day period, with both candles showing small negative bodies and constrained ranges, suggesting a roughly even chance of either a breakout or breakdown from this consolidation.
In conclusion, the market data over these two days reveals a significant bearish turn for a majority of the analyzed stocks, particularly those that initially showed strength. Strong bearish reversal patterns were evident in NVDA, GOOGL, TSLA, MSFT, and META, while CRWV and ANET confirmed a continuation of their downward trajectories. While AMZN and AVGO showed signs of potential bullish resilience, the broad-based weakness observed in other major names indicates that a continuation of selling pressure is likely to dominate the short-term outlook for the overall group.
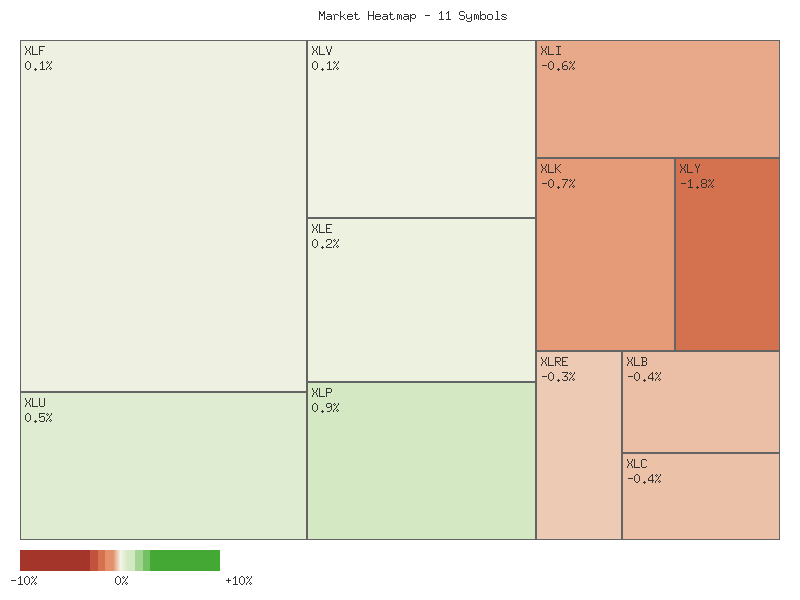
S&P 500 Sector Breadth
Analysis of the aggregated daily percent changes across the eleven S&P 500 sectors for the period indicates an overall net decline in market value. The sum of all sector percentage changes registers at approximately -0.77%, suggesting the aggregate market experienced a slight downward drift. Market breadth metrics reveal a modest negative bias; five sectors concluded the period with positive aggregate returns (advancing symbols), while six sectors posted negative aggregate returns (declining symbols). This ratio suggests that decliners slightly outnumbered advancers, signaling a relatively soft underlying market condition, though not decisively bearish. The overall performance is best characterized as mixed with a slightly negative aggregate bias.
Reviewing individual sector performance, Utilities (XLU) demonstrated the strongest advance, posting a cumulative gain of 1.42%. Energy (XLE) and Technology (XLK) also showed notable strength, with gains of 0.65% and 0.34% respectively. Consumer Staples (XLP) and Financials (XLF) registered more modest positive changes. On the downside, Real Estate (XLRE) exhibited the most significant decline, contracting by 1.31%, followed by Consumer Discretionary (XLY) with a -0.89% change. Materials (XLB) and Health Care (XLV) also posted negative returns, while Industrials (XLI) and Communication Services (XLC) experienced smaller, though still negative, shifts. The dispersion in performance across sectors suggests specific drivers rather than a broad-based directional move.
Regarding sector rotation, the data presents a mixed signal for both offensive and defensive categories. Among the six offensive sectors, three posted gains (XLE, XLK, XLF), and three recorded losses (XLI, XLB, XLY). Conversely, within the four designated defensive sectors, two advanced (XLU, XLP) and two declined (XLV, XLRE). While the leading advancer (XLU) is a defensive sector, an offensive sector (XLE) holds the second-highest gain. Similarly, both the largest decliner (XLRE) and the second-largest decliner (XLY) are defensive and offensive respectively. This distribution makes it difficult to ascertain a clear rotational preference between offensive and defensive postures. There is roughly an even chance that capital is either maintaining its current allocation or exhibiting highly localized shifts rather than broad re-positioning between risk-on and risk-off assets. The unclassified Communications Services (XLC) also declined.
The overall market sentiment, based solely on this two-day technical data, appears to be cautious and lacking a strong directional conviction. The slight negative aggregate performance combined with a marginally negative breadth, where declining symbols outnumber advancing ones, points towards a market under minor selling pressure. However, the absence of a clear consensus in sector leadership, particularly the mixed performance within both offensive and defensive categories, suggests that market participants are not making a decisive move towards either aggressive growth or capital preservation. The environment is indicative of a market searching for direction, with individual sector technicals overriding broader thematic shifts at this specific juncture. A continuation of this mixed performance is likely in the immediate term, barring new technical developments.
| Symbol | Daily Percent Change |
|---|---|
| XLU | 1.423993% |
| XLE | 0.651570% |
| XLK | 0.343926% |
| XLP | 0.199024% |
| XLF | 0.093124% |
| XLI | -0.100975% |
| XLC | -0.283131% |
| XLV | -0.407033% |
| XLB | -0.490008% |
| XLY | -0.893082% |
| XLRE | -1.310149% |
As a seasoned CMT, my analysis of the provided two-day market data reveals a notable divergence in sector performance, with a majority of sectors exhibiting bearish tendencies while a few defensive areas show signs of strength. This assessment is based exclusively on the candlestick formations, price ranges, and corresponding volume data for October 6th and 7th, 2025.
A significant portion of the sectors displayed clear bearish momentum during this two-day period. XLK (Technology), XLI (Industrials), XLY (Consumer Discretionary), XLB (Materials), XLRE (Real Estate), and XLC (Communication Services) all closed lower on October 7th than on October 6th, often with strong downward price action. For XLI, a sharp decline on October 7th, closing well below the prior day’s close on substantially increased volume, indicates that continued selling pressure is likely. Similarly, XLY’s notable drop and lower high on increased volume suggest further downside is probable. XLK also saw a significant decline, though on slightly decreasing volume, which might indicate less conviction in the selling, but the price action remains decidedly bearish. XLRE and XLB experienced bearish continuation patterns, with lower closes on increased volume, making further declines likely. XLC formed a strong bearish engulfing pattern, and while volume slightly decreased, continued downward movement is likely.
Conversely, XLU (Utilities) and XLP (Consumer Staples) demonstrated clear bullish strength. XLU experienced a higher close on both days, with the second day’s upward movement supported by a substantial increase in volume, suggesting that continued upward momentum is likely. XLP showed a strong bullish reversal, closing significantly higher on October 7th after an initial dip on October 6th, and this upward move was accompanied by increased volume. This bullish engulfing pattern makes a continuation of the rally likely. XLE (Energy) also presented a cautiously bullish signal; after a minor decline on October 6th, it closed higher on October 7th with increased volume, recovering the prior day’s loss. This suggests a short-term upward bias is possible, though its strength is not as pronounced as XLU or XLP.
The remaining sectors, XLF (Financials) and XLV (Healthcare), exhibited patterns of indecision or consolidation. XLF traded within a narrow range over both days, with negligible net price change and relatively stable, high volume. This price action suggests a roughly even chance of either a breakout or breakdown in the immediate future, as neither buyers nor sellers demonstrated clear dominance. XLV also showed a narrow range, with a slight recovery on October 7th, but on decreasing volume. This lack of conviction on the recovery, following a bearish close on October 6th, means there is a roughly even chance of continued sideways movement or a renewed decline. Traders should observe these sectors for confirmation of a clear directional bias in the upcoming sessions, as alternative scenarios remain highly plausible given the limited data.
Equity Breadth
The percentage of S&P 500 members trading above their 50-day moving average (SPXA50R) has exhibited a pattern of short-term weakening over the observed 7-day period. Beginning at approximately 58.08%, the metric saw a modest increase before declining to 56.29% mid-period, then recovered partially. A significant decline was observed on the final day, dropping from 57.68% to 53.49%. This suggests an erosion of short-term internal market strength, implying that a decreasing number of constituents are participating in upward momentum above their intermediate-term averages. Such a notable contraction in short-term breadth is often interpreted as a yellow flag for the overall index’s near-term robustness.
In contrast, the percentage of S&P 500 members trading above their 200-day moving average (SPXA200R) has demonstrated relative stability, broadly maintaining levels above 60% throughout the period. The metric started near 62.48%, saw a minor rise to a peak of 63.67%, and then consolidated to finish at 62.28%. This stability indicates that the long-term structural health of a substantial portion of the S&P 500 components remains generally intact, providing a degree of underlying support to the market. While there was a slight retreat from the period’s peak, the indicator did not show significant deterioration, suggesting that long-term broad market participation is not yet significantly eroding.
Simultaneously, the 20-day Exponential Moving Average (EMA_20_DAY) for the SPX has shown a clear and consistent upward trajectory across all observed days, ascending from 6586.94 to 6645.20. This consistent ascent strongly suggests that the S&P 500 index itself has been in a short-term bullish trend during this period. However, the observed divergence between the rising SPX 20-day EMA and the declining SPXA50R is noteworthy. While the aggregate index’s trend is upward, the weakening short-term breadth indicates that this advance may be becoming more concentrated, potentially reliant on a smaller subset of strong performers.
Considering the entirety of the data, it is likely that the current upward trend of the SPX’s 20-day EMA may face headwinds in the near-term. The significant weakening in SPXA50R, especially the recent sharp decline, points to an increasing vulnerability in short-term momentum, even as the aggregate index continues to climb. There is a roughly even chance that this divergence could lead to a period of consolidation or a moderation in the pace of the index’s ascent. An alternative scenario, considered less likely given the SPXA50R data, is a continued robust upward move supported by broad participation. The sustained level of SPXA200R suggests that a wholesale breakdown into a strong bearish trend is improbable in the immediate future, but the short-term internal weakness cannot be disregarded for the index’s near-term directional bias.
SPX Daily
The S&P 500 (SPX) has maintained a demonstrably strong uptrend over the past 90 days, evidenced by the consistent upward trajectory of both the 50-day and 200-day Exponential Moving Averages (EMAs). The 50-day EMA is positioned well above the 200-day EMA, further reinforcing the robust long-term bullish bias. In the immediate past seven trading days, prior to the most recent session, price action generally confirmed this upward momentum. From September 29th through October 6th, the SPX posted five consecutive days of higher closes, advancing from 6661.21 to 6740.28. This upward movement pushed the 14-day Relative Strength Index (RSI) into overbought territory on October 6th, reaching 71.60. This suggested that the market was experiencing increasing buying pressure, but also raised the probability of a near-term pullback due to stretched momentum readings.
The price action on October 7th introduced a notable shift. The SPX opened at 6746.14, reached an intraday high of 6754.49, but subsequently experienced significant selling pressure, closing at 6714.59, near its intraday low of 6699.96. This substantial bearish candle, which nearly engulfs the body of the previous day’s bullish candle, suggests a likely rejection of higher prices and a probable increase in short-term selling impetus. This development has pulled the RSI down to 66.12, out of the overbought zone, but still indicative of elevated momentum. Immediate overhead resistance is established by the recent highs in the 6749.52-6754.49 range. The recent low around 6699.96 on October 7th acts as immediate support, with a more significant support zone likely forming near the previous resistance cluster around 6600-6620 (from mid-September highs) and further down, the ascending 50-day EMA, currently at 6515.68.
A bullish continuation would likely involve the SPX successfully holding above the 6700 level, followed by a decisive break above the 6750-6755 resistance zone. Should this resistance be breached, it would signal a probable reassertion of the prior upward trend, with the next logical resistance area based on historical price action being the high of 6754.49, with potential for new all-time highs. A resurgence in momentum, reflected by the RSI trending back towards overbought conditions and maintaining its current upward slope, would lend further support to this scenario. The presence of both EMAs well below current price action suggests a strong underlying trend that could reassert itself after this minor pullback.
Conversely, a bearish scenario would unfold if the SPX fails to sustain above the 6700 immediate support and breaches the 6699.96 low established on October 7th. A break below this level would likely target the previous consolidation area around 6600-6620. A more significant bearish development would involve a penetration below the continuously rising 50-day EMA (currently 6515.68). Such an event, especially if accompanied by a further decline in RSI below 50, would indicate a significant loss of short-term momentum and would increase the probability of a deeper correction towards the 200-day EMA (currently 6106.95), which serves as robust long-term dynamic support.
A neutral case suggests the SPX could enter a period of consolidation. Price might trade within the recently established range of approximately 6690 to 6750. This sideways movement would likely be characterized by smaller candle bodies and an RSI oscillating between 50 and 70, reflecting a temporary equilibrium between buying and selling pressures. Technical sentiment drivers in the near future will likely be focused on whether the recent bearish candle on October 7th represents a temporary profit-taking event in an otherwise strong uptrend or the initial indication of a more substantial reversal. The market’s reaction to the 6700 level will be highly indicative of prevailing sentiment. A failure to quickly recover from the October 7th decline could lead to a psychological shift, with traders increasingly interpreting the upper wick and bearish close as significant resistance, thereby increasing the likelihood of further downward pressure. Conversely, a quick recovery would indicate that bullish sentiment remains largely intact.
Here is a technical analysis of the S&P 500 (SPX) based solely on the provided 90-day data for price action, the 14-day Relative Strength Index (RSI), and the 13-21 day Percentage Price Oscillator (PPO).
The S&P 500 (SPX) has exhibited a discernible uptrend over the past 90 days, with the price consistently establishing higher highs and higher lows. From a closing value of 5911.69 on May 30th, the index advanced to 6714.59 by October 7th, demonstrating persistent buying pressure throughout the period. This upward trajectory has been punctuated by several consolidation phases, but the general direction remains clearly bullish, reflecting a robust underlying sentiment based purely on price action. Notably, despite minor pullbacks, the index has generally maintained its upward momentum, reinforcing the primary trend.
Examination of the 14-day Relative Strength Index (RSI) reveals periods where momentum was strongly in favor of the bulls. The RSI frequently entered overbought territory (above 70) during sustained rallies, particularly in late June through late July, and again in mid-September. Notable peaks include 75.57 on July 3rd and 76.29 on July 28th, coinciding with strong price advancements. More recently, the RSI peaked at 74.75 on September 22nd when the SPX closed at 6693.75. While the SPX made a higher close of 6740.28 on October 6th, the RSI registered a lower peak of 71.60 on the same day. This pattern, where price achieves a higher high but the RSI forms a lower high, constitutes a bearish divergence. On October 7th, the RSI declined further to 66.12, retreating significantly from overbought levels, which often indicates waning buying interest.
The 13-21 day Percentage Price Oscillator (PPO) generally supported the bullish trend, remaining in positive territory for the majority of the 90-day period. The indicator’s positive values confirm that the shorter-term exponential moving average (13-day) has consistently been above the longer-term EMA (21-day), indicative of an enduring uptrend. However, similar to the RSI, the PPO data also presents a potential cautionary signal. The PPO reached a peak of 0.635 on September 22nd, aligning with the SPX’s close of 6693.75. As the SPX subsequently recorded a higher close of 6740.28 on October 6th, the PPO only managed a peak of 0.568. This concurrent pattern of a higher price high and a lower PPO high establishes another instance of bearish divergence, suggesting that the upward momentum is decelerating relative to price gains. On October 7th, the PPO slightly declined to 0.550, reinforcing the weakening momentum suggested by the divergence.
Considering the dual bearish divergences observed in both the 14-day RSI and the 13-21 day PPO against the recent higher price highs, it is likely that the SPX is experiencing weakening upward momentum. The retreat of the RSI from overbought conditions on October 7th further supports this assessment. While the overall trend has been robustly bullish, these divergences suggest that a period of consolidation or a near-term price pullback is likely. An alternative scenario is that the market might attempt another push higher; however, the current technical signals indicate that the likelihood of a sustained upward continuation without a prior corrective phase is reduced. Traders would be prudent to acknowledge these waning momentum signals, as they often precede shifts in short-term price direction within an ongoing primary trend. A failure to quickly recover positive momentum in both oscillators, especially if accompanied by further price weakness, would increase the probability of a more significant retracement.