Daily Market Technical Analysis
Market Overview
The market exhibits divergent technical signals. Large-cap growth (QQQ, OEF) shows strong bullish momentum, but QQQ’s overbought status makes short-term consolidation likely. Small-cap segments (IJR, IWM) display bearish reversals, with further downside highly likely for IJR. The S&P 500 is overbought with bearish momentum divergences, suggesting a likely consolidation. Weakening S&P 500 market breadth against a rising index raises the likelihood of future trend shifts, yet a short-term pullback for the index is roughly an even chance. Bonds face uniformly bearish pressure, with continued weakness highly likely, while overbought precious metals are likely to see a near-term pullback. Cryptocurrencies maintain robust bullish momentum, likely to persist.
Market Indices
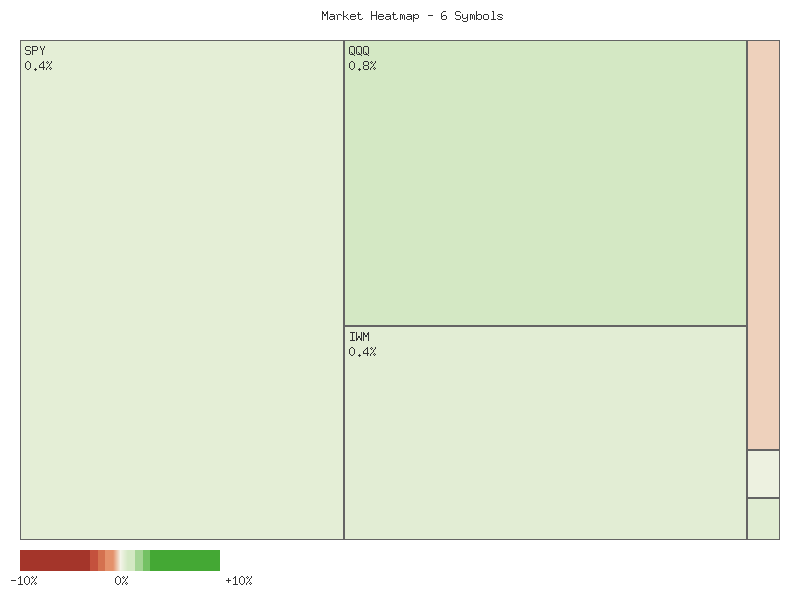
The provided daily percent change data for key market indices on 2025-10-06 indicates a predominantly positive trading session. The performance of these symbols, sorted in descending order for their most recent daily percent change, is as follows:
| Symbol | Daily Percent Change (2025-10-06) |
|---|---|
| QQQ | 0.7510% |
| OEF | 0.4551% |
| IWM | 0.3986% |
| SPX | 0.3647% |
| MDY | 0.1482% |
| IJR | -0.2582% |
The aggregate performance of these symbols for 2025-10-06 reflects an overall higher market close. The sum of the daily percent changes for these six indices totals approximately 1.859%. This positive sum suggests that the market, as broadly represented by these large-cap, mid-cap, and small-cap indices, experienced an overall upward trajectory.
Market breadth on 2025-10-06 was largely positive among the included indices, with five symbols advancing and only one declining. QQQ, representing the NASDAQ 100, demonstrated the strongest outperformance, followed by OEF (S&P 100), IWM (Russell 2000), SPX (S&P 500), and MDY (S&P MidCap 400). IJR, the S&P SmallCap 600, was the sole decliner for the session. This pattern suggests a likely preference for large-cap and growth-oriented segments, as evidenced by the robust gains in QQQ and OEF, while the small-cap segment experienced a marginal pullback. The disparity in performance between larger and smaller capitalization indices may suggest a selective risk-on sentiment for the session.
Analysis of the CBOE Volatility Index (VIX) on a two-day basis reveals a notable shift. On 2025-10-03, VIX recorded a marginal increase of approximately 0.12%. However, on 2025-10-06, VIX experienced a significant decline of approximately 1.68%. This pronounced decrease in the VIX, coinciding with broad market advances, strongly suggests a reduction in immediate-term market anxiety. It is likely that market participants perceived a decreased probability of sharp downward movements following the positive market close, contributing to a lower implied volatility.
Reviewing the 7-day candle data for VIX provides further insight into volatility dynamics. Following an initial strong down day on 2025-09-26, VIX recorded higher closes for three consecutive days (2025-09-29 to 2025-10-01). The candles on 2025-10-01 and 2025-10-03 exhibited notable upper shadows, which may indicate attempts by volatility to move higher that were ultimately rejected, suggesting a degree of selling pressure at elevated VIX levels. The latest candle on 2025-10-06 shows VIX declining from its open and closing near its daily low, accompanied by a significant upper shadow. This pattern, coupled with the -1.68% daily change, suggests that while there were intraday efforts to push implied volatility higher during the period, especially on days with long upper shadows, the prevailing technical pressure ultimately drove VIX lower, closing near the lower end of its range for the day. The combination of declining VIX and advancing equity markets makes a continuation of this low-volatility environment somewhat likely in the very near term, contingent on no significant shifts in the underlying technical structure.
Good morning traders, as a CMT with over 15 years of experience, let’s delve into the recent two-day market data using rigorous technical analysis principles.
The two-day price action across major U.S. equity ETFs presents a mixed picture. SPY, representing large-cap equities, closed slightly higher on the second day, but its candle was indecisive, with the close almost matching the open. Both days exhibited upper shadows near the 672.50-672.67 region, suggesting immediate resistance. Critically, volume on the second day decreased by approximately 23.5% for SPY. This reduced participation on a modest upward close makes a significant continuation of the rally from these levels unlikely without renewed buying conviction. The pattern indicates that SPY is facing a roughly even chance of either consolidating around current levels or experiencing a minor pullback in the near term.
In contrast, QQQ and OEF, representing large-cap growth and the S&P 100 respectively, demonstrated more convincing bullish momentum. QQQ printed a strong bullish candle on the second day, effectively overcoming the prior day’s decline and reaching new highs within the two-day period. OEF showed a similar strong bullish reversal, closing significantly higher and recovering its prior day’s losses. While the price action for both is strongly bullish, their respective volumes also decreased on the second day. The combination of strong upward price movement with declining volume suggests that while an immediate upward bias is likely for these segments, the sustainability of a robust breakout without retesting previous levels or consolidation is unlikely. These segments appear to be leading the market with some caution under the surface.
Conversely, the small-cap and mid-cap sectors showed signs of weakness. IJR, a small-cap ETF, exhibited a clear bearish reversal. After attempting to rally on the first day, it recorded a large bearish candle on the second, closing near the two-day low and indicating strong selling pressure. This significant price depreciation occurred on substantially reduced volume (down 38.5%). This pattern makes further downside for IJR highly likely in the immediate term. IWM, the Russell 2000 ETF, also showed signs of struggle, with consistent rejection from the 248 level despite attempting higher opens. It closed lower than its open on the second day, again on decreased volume. MDY, the mid-cap 400 ETF, showed indecisive price action with consistent upper shadow rejection, signaling resistance around the 604-604.6 area. The collective performance of these smaller capitalization segments indicates a likely shift in sentiment towards caution, and potentially a leadership divergence in the market.
The observed divergence between larger-cap resilience and smaller-cap vulnerability, coupled with broad volume contraction, signals a market lacking unified conviction. While QQQ and OEF appear poised for further upside, the lack of volume confirmation and the clear bearish signals from IJR and IWM indicate underlying caution. This mixed technical picture suggests that a broad market uptrend confirmation is currently unlikely. Instead, the market is facing a roughly even chance of either rotational price action, where strength in one area offsets weakness in another, or a period of general consolidation. Traders should monitor volume closely for any moves, as current trends are not broadly supported by increasing participation, making short-term reversals or consolidations likely.
SPX Technical Commentary: Momentum Signals and Price Extension
The S&P 500 (SPX) has demonstrated a generally ascending trajectory over the past 90 days, with the most recent price action indicating a continuation of this upward movement, closing at 6740.28 on October 6th. An examination of the Percentage Price Oscillator (PPO) and the 14-day Relative Strength Index (RSI) offers insights into the underlying momentum and potential areas of concern for traders.
Throughout the 90-day period, the PPO (13,21) has largely remained in positive territory, which typically suggests that the shorter-term moving average is above the longer-term moving average, confirming a prevailing bullish momentum bias. We observed the PPO reaching a peak around 0.99 in late May, followed by a significant decline to a low of approximately 0.32 in early September. This decline in PPO during periods of rising price, particularly when comparing the PPO peak in early July (0.93 at price 6279) to the current PPO (0.56 at price 6740), suggests a bearish divergence. Specifically, the price has achieved higher highs while the PPO has printed a lower high, indicating that the upward momentum strength has unlikely been as robust as previous rallies, despite the continued price ascent. Since early September, the PPO has shown renewed upward momentum, rising from its low, which aligns with the recent positive price action.
Concurrently, the 14-day RSI provides additional perspective on price velocity and potential overextensions. The RSI has frequently entered overbought territory (above 70) during this period, notably around early July (75.5), late July (76.2), and late September (74.7). Each instance was followed by a subsequent pullback or consolidation in price, which is a common characteristic of overbought conditions. The most recent RSI reading for October 6th is 71.6, once again placing the index in overbought territory. This suggests that the SPX may be extended in the near term, and a reversal or consolidation is a roughly even chance. Furthermore, similar to the PPO, a bearish divergence is observable: the SPX has achieved higher price highs from early July to early October, while the corresponding RSI highs have shown a declining trend (75.5 to 71.6). This pattern likely indicates weakening underlying momentum despite ongoing price appreciation.
Considering these technical patterns, the market is currently in an overbought condition based on the RSI, and both the PPO and RSI exhibit bearish divergences relative to price over the broader 90-day window. While the prevailing price trend remains upward, the combination of an overbought RSI and the observed divergences in both momentum indicators suggests that a period of consolidation or a minor pullback is likely in the near future. An alternative scenario, though currently less likely given the indicator readings, involves a continuation of the upward trend, possibly fueled by strong buying interest that could override these momentum signals, potentially pushing the RSI further into overbought territory before any significant correction. Traders are advised to monitor for a potential loss of momentum or a shift in the immediate trend as these divergences could foreshadow future price weakness.
QQQ Technical Analysis: Navigating the Extended Uptrend
The QQQ has demonstrated a robust bullish trend over the past 90 days, characterized by a discernible series of higher highs and higher lows. From late May, price ascended from approximately , initially reaching the mid- by mid-June, and subsequently accelerating sharply to a peak around by late July. Throughout this primary upward move, the 14-day Relative Strength Index (RSI) consistently resided above 60, frequently entering overbought territory (>70) and peaking at 73.11 on July 28. This sustained overbought condition, while indicative of strong buying conviction, also raised the likelihood of an impending consolidation. The 13-21 day Percentage Price Oscillator (PPO) unequivocally confirmed this bullish momentum, remaining positive and showing an upward slope during this entire period. Volume generally supported rallies.
Following its July peak, QQQ experienced a significant corrective phase spanning from late July through mid-August. Price declined sharply from roughly to a low of on August 1, and again to approximately by August 21 after an attempted recovery. This correction effectively reset momentum indicators. The RSI plummeted from overbought levels, falling below 50 to a low of 47.05 on August 21, indicating a clear loss of bullish impetus. Concurrently, the PPO crossed decisively below its zero line on August 1, remaining negative until August 22, signaling a bearish shift in intermediate-term momentum. Importantly, elevated trading volumes on August 1 (69.4M) and August 20 (76.78M) during these declines suggest significant distribution.
From late August, QQQ promptly resumed its upward trajectory, rallying consistently from the to its current level of .71 on October 6. This renewed advance has pushed the RSI back into overbought territory, with its most recent reading at 70.60. While this reiterates strong buying momentum, it also suggests that the immediate trend is stretched, making a short-term pause or minor pullback a likely near-term development. The PPO has vigorously crossed back above its zero line since August 22 and has maintained a consistent upward trend, reaching 0.75 by October 6. This sustained positive PPO reading firmly reaffirms the underlying bullish momentum and confirms the resumption of the primary uptrend, with price action consistently making higher highs.
The technical picture for QQQ currently indicates a strong, well-established bullish trend, corroborated by consistent positive PPO readings and robust price action. However, the current RSI at 70.60 suggests an overbought condition, making a temporary period of consolidation or a shallow pullback a likely near-term occurrence. Such a price adjustment, if it holds above the approximate - support range (established during the September 23-25 pullback), would be constructive for re-energizing the ascent. A continuation of the current upward trend, potentially towards new highs, is probable. A significant reversal of the overarching uptrend appears unlikely given existing momentum, but a breach of key support coupled with a sustained negative PPO could present a roughly even chance of a more extended corrective phase.
Here is a technical analysis of IWM based exclusively on the provided 90-day candle, RSI, and PPO data:
The price action for IWM over the 90-day period, from late May to early October 2025, suggests a pronounced bullish trend. The asset has generally advanced from approximately .12 to .81, marking a significant upward movement. This trend is characterized by higher highs and higher lows, indicative of sustained buying interest. Notable support appears to have been established around the - range during the early August pullback, which was subsequently overcome by robust buying activity. Key resistance levels were broken, including the late July highs near .71 and late August highs near .22. The most recent price action culminates in the - range. Volume analysis indicates varied participation; periods of significant upward movement, particularly in mid-August and late September, were accompanied by elevated volume, suggesting strong conviction behind these advances. Conversely, some declines, such as on August 1st, also saw increased volume, indicating some degree of selling pressure at those points.
The 14-day Relative Strength Index (RSI) provides additional insights into momentum. Throughout the 90-day period, the RSI generally remained above the 50-level, further supporting the observed bullish sentiment. The indicator registered overbought conditions, exceeding 70, on July 3rd (71.57) and again on September 18th (71.23), which were followed by brief periods of consolidation or minor pullbacks in price. This suggests a tendency for the asset to ease off gains after reaching extended momentum levels. Currently, the RSI stands at 68.07 as of October 6th, approaching overbought territory but not yet signaling an immediate reversal. However, a significant observation is a bearish divergence between price and RSI. While IWM recorded a new high on October 6th (.81), the corresponding RSI reading (68.07) is lower than previous RSI highs, specifically the July 3rd and September 18th readings. This divergence increases the likelihood of a weakening in upward momentum, potentially foreshadowing a price correction or a period of consolidation.
The 13/21-day Percentage Price Oscillator (PPO) complements the RSI by illustrating the strength and direction of the momentum trend. Throughout the entire 90-day span, the PPO consistently remained above the zero line, reinforcing the overall bullish narrative and suggesting that short-term momentum generally surpassed longer-term momentum. Peak PPO values, indicating strong upward momentum, were observed on July 10th (1.170) and again on August 28th (1.001) and September 22nd (1.003). Similar to the RSI, the most recent PPO reading of 0.743 on October 6th presents another instance of bearish divergence. While IWM reached a new price high, the PPO value is notably lower than its prior peaks. This pattern, where price makes a higher high but the momentum indicator makes a lower high, increases the likelihood of a deceleration in the underlying buying pressure. The declining PPO peaks, despite rising price, suggests that the current rally may be less robust than previous upward thrusts.
In synthesis, IWM has experienced a strong upward trend over the past 90 days, marked by clear price appreciation and generally supportive volume. Both the RSI and PPO have largely confirmed this bullish momentum, consistently staying in positive territory. However, the development of bearish divergences in both the RSI and PPO on the most recent data point (October 6th) is a critical technical signal. Price is making a higher high, yet both momentum indicators are showing lower highs. This combination likely indicates a weakening of the buying momentum that has propelled the recent price increases. While the immediate trend remains upward, the presence of these divergences suggests an elevated risk of a near-term price pullback or a period of sideways consolidation. It is a roughly even chance that IWM could continue its ascent in the very short term, possibly testing the next psychological resistance level, given the current PPO is rising from a recent low and RSI is not yet overbought. However, the cumulative weight of the momentum divergences makes it likely that any further upward movement would be challenged soon, possibly leading to a retracement or a more significant consolidation phase in the coming weeks. Traders would be prudent to monitor for a potential bearish cross in PPO or a breakdown from recent support levels.
Tech Sector Analysis
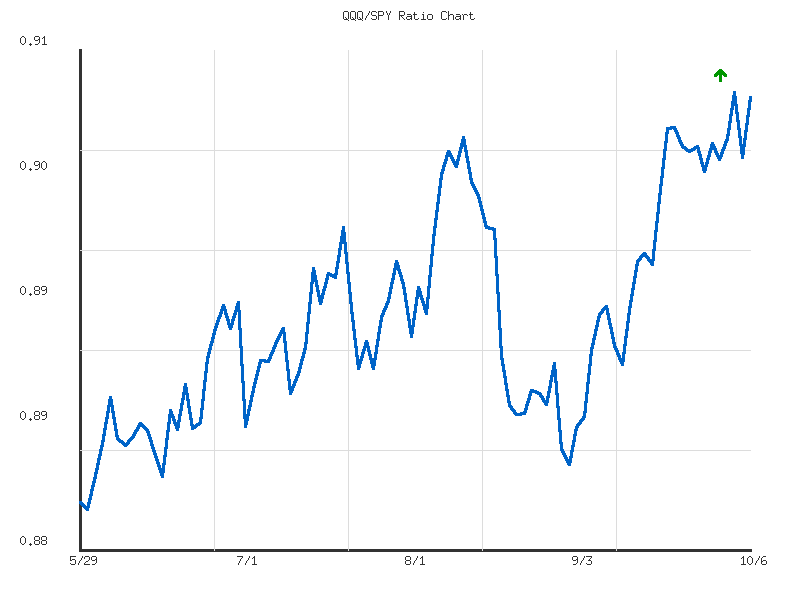
The 14-day QQQ/SPY ratio indicates a clear, albeit weak, upward trend, signaling outperformance of the NASDAQ-100 relative to the S&P 500 during this period. The ratio initiated at approximately 0.895 and concluded at 0.9048, representing a 1.09% increase over the period. The current ratio of 0.904855 resides near the high end of its recent range (0.905128), significantly above the average ratio of 0.901665. The observed volatility over these 14 days is notably low, suggesting a relatively stable and gradual appreciation in QQQ’s relative strength against SPY, rather than sharp fluctuations.
Extending the analysis to the 30-day timeframe reinforces the prevailing sentiment. The QQQ/SPY ratio exhibits a consistent upward trend, mirroring the shorter-term observation, though its strength remains categorized as “weak.” Over this longer period, the ratio experienced a 1.93% increase from its lowest point (0.883408) to its highest, with the current ratio again settling very near the 30-day high (0.905128). The average ratio for this 30-day window is 0.895064, indicating that the current ratio is comfortably positioned above its monthly mean. Volatility for the 30-day period is slightly higher than the 14-day, yet still suggests controlled movements in relative performance.
The convergence of “weak” upward trends across both the 14-day and 30-day perspectives implies that while QQQ is consistently outperforming SPY, the momentum driving this outperformance is not exceptionally strong or accelerating. The consistent positioning of the current ratio near its respective period highs, coupled with low volatility, suggests that the market has steadily priced in this relative strength. This pattern does not typically signal an imminent aggressive acceleration of QQQ’s outperformance.
Based on the technical data, it is likely that QQQ will maintain its relative outperformance against SPY in the near to medium term, given the established upward trend across both timeframes. However, due to the “weak” trend strength and the ratio’s current proximity to its recent high, there is a roughly even chance the QQQ/SPY ratio may experience a period of consolidation or a minor pullback towards its average levels before potentially resuming its upward trajectory. A significant and sustained shift to QQQ underperforming SPY is considered unlikely without further technical indications of a reversal in the prevailing trend.
CMT Technical Analysis: QQQ/SPY Ratio (90-Day Perspective)
This analysis focuses exclusively on the provided 90-day performance ratio of the Nasdaq 100 ETF (QQQ) to the S&P 500 ETF (SPY), covering the period from late May 2025 to early October 2025. The ratio serves as an indicator of technology and growth stock outperformance relative to the broader market. Over the observed timeframe, the QQQ/SPY ratio has established a clear upward trend, moving from approximately 0.881 at the beginning of the period to a current value near 0.905. This represents a net gain of approximately 2.69% in relative strength for QQQ against SPY. Despite the consistent upward trajectory, the underlying trend strength is formally classified as “weak,” which implies a gradual ascent rather than a robust, high-momentum surge. The noted low volatility, quantified at 0.000039, further supports the characterization of a relatively stable, albeit sustained, directional movement.
Examination of the ratio’s price action reveals a pattern of higher lows and higher highs, consistent with an established uptrend channel. The ratio commenced near its 90-day low of 0.8807 on May 30th, subsequently oscillating within a generally ascending path. Notable advancements occurred from late June into July, pushing the ratio toward the 0.895-0.900 area, followed by a consolidation phase. A renewed upward push in August saw the ratio briefly touch above 0.902, after which a slight retreat and further consolidation around the 0.89-0.90 levels were observed through mid-September. The sustained ascent in late September and early October has propelled the ratio to its highest point within this 90-day data set, reaching 0.9051 on October 2nd.
The current ratio stands at 0.9048, which is remarkably close to the 90-day high. This positioning suggests the ratio is presently testing a significant short-term resistance level, which is the ceiling of its observed trading range. Given the established upward trend, even with its “weak” strength, a breakout above the 0.9051 level is roughly an even chance. However, the weak trend strength and low volatility suggest that any potential breakout might be gradual rather than explosive. There is also roughly an even chance that the ratio might encounter resistance at this level, leading to a period of consolidation or a minor pullback towards the average ratio of 0.8920 before attempting another push higher. A sustained downturn below the most recent higher lows established in late August (around 0.883-0.884) would be an unlikely scenario based solely on the data provided.
Considering alternative scenarios, if the ratio fails to break definitively above the 0.9051 resistance in the immediate term, it is likely to retest the upper boundary of its rising channel or a support level closer to the 0.898-0.900 area, representing previous consolidation points. Conversely, a decisive move above 0.9051, particularly if accompanied by an increase in volatility (not yet observed in the trend metrics), would signal a likely continuation of QQQ’s relative outperformance against SPY, projecting the ratio into uncharted territory for this specific 90-day period. The overall consistent upward bias, despite its weak strength, makes a reversal into a downtrend an unlikely development in the very near term based on this data alone.
IWM vs. SPY
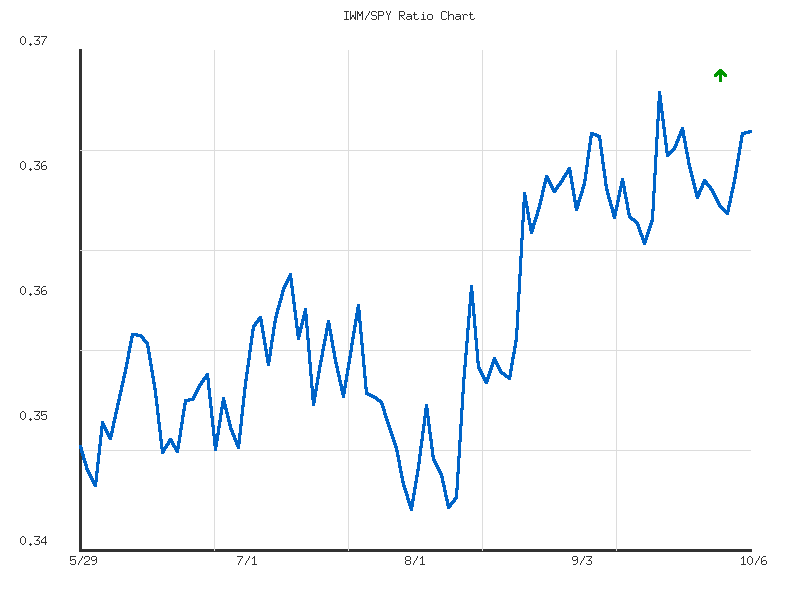
The IWM/SPY ratio, which gauges the relative performance of the Russell 2000 (IWM) against the S&P 500 (SPY), indicates that IWM is currently outperforming SPY. Across both the 14-day and 30-day observation periods, the ratio’s trend is assessed as “up,” yet its strength is consistently characterized as “weak.” The current ratio, at approximately 0.3675, resides in the upper quartile of both recent trading ranges, specifically positioned at roughly 70% and 74% from their respective low points to their high points. This sustained positioning suggests a consistent, albeit modest, upward bias in IWM’s relative performance against SPY.
Focusing on the 14-day period, the data reveals a minor upward trajectory in the IWM/SPY ratio, exhibiting a 1.40% increase over the timeframe. The designation of “weak” trend strength implies that this upward movement lacks significant underlying momentum, suggesting a gradual rather than an aggressive shift. Despite this weak strength, the ratio has maintained values above its 14-day average of 0.3654, culminating at its present level. The observed volatility within this shorter timeframe is exceptionally low, suggesting a highly stable, non-erratic relative performance rather than sharp, impulsive swings. The combination of low volatility and weak trend strength implies that while IWM is indeed gaining on SPY, it is doing so in a subdued manner without strong technical conviction.
Extending the analysis to the 30-day timeframe corroborates the relative outperformance, showing a slightly more pronounced 1.61% increase in the ratio compared to the 14-day period. Consistent with the shorter term, the trend strength is again categorized as “weak,” reinforcing the observation of a gradual, rather than aggressive, shift in market leadership. The current ratio remains firmly above its 30-day average of 0.3646, further supporting the consistent, albeit slow, upward movement of IWM relative to SPY. Notably, volatility remains exceptionally low across the entire 30-day span. This persistent characteristic suggests that any potential reversals or accelerations in relative performance are unlikely to be rapid or dramatic without a significant and sustained change in the underlying price dynamics of either IWM or SPY.
Considering the established “up” trend across both observed timeframes, albeit with persistent “weak” strength, a continued gradual relative outperformance of IWM against SPY is likely in the immediate term. However, the consistent characterization of “weak” strength significantly diminishes the probability of a rapid acceleration in this outperformance. A significant and sudden reversal, which would favor SPY, appears unlikely, given the absence of high volatility or a breakdown below recent average ratio levels. There is a roughly even chance that the ratio could consolidate around its current elevated levels within the recent ranges, maintaining its current relative position without a strong directional move, given the inherent weak trend strength and low volatility. A scenario where the trend strength strengthens to “moderate” or “strong” is considered unlikely without further evidence of sustained higher percentage changes or an increase in volatility indicating a more decisive shift in conviction.
As a CMT with extensive experience, I offer the following technical analysis of the IWM/SPY ratio over the past 90 days, based solely on the provided market data.
The IWM/SPY ratio has demonstrated a clear and consistent upward trend over the observed 90-day period, commencing in late May and concluding on October 6th. The data explicitly defines this as a “moderate” upward trend, reflecting a 5.1996% increase from its initial levels. This sustained rise indicates that small-capitalization stocks, as represented by IWM, have generally outperformed large-capitalization stocks, represented by SPY, throughout this timeframe. The ratio began around 0.349 and has advanced to its current level of 0.36749. This closing ratio is positioned strongly within the upper end of its 90-day range, specifically at 90.78% of the way from its lowest point to its highest point, signaling significant relative strength in small-caps.
During this 90-day window, the ratio established a definitive low at 0.34568 and a prominent high at 0.36970. The current ratio of 0.36749 is notably close to this 90-day high, which acts as a critical technical resistance level. Price action in the more recent past shows the ratio consolidating below or repeatedly testing this high. For instance, after reaching its peak on September 18th, it experienced a minor retracement before resuming its ascent towards the resistance. The provided volatility metric of 0.00004259 suggests that despite the clear directional bias, the day-to-day fluctuations have been relatively contained, implying a methodical rather than erratic approach to the resistance zone.
The persistent upward trajectory of the IWM/SPY ratio implies that investors have likely maintained a preference for the Russell 2000 over the S&P 500 for a considerable portion of the last three months. The ratio’s current proximity to its 90-day high of 0.36970 represents a pivotal juncture. A decisive breakout above this level, characterized by sustained trading and closes above it, would very likely signal a continuation of small-cap outperformance and could mark the beginning of a new phase of relative strength. Conversely, a failure to overcome this resistance, leading to a notable pullback from current levels, would suggest a likely pause in small-cap leadership, implying a roughly even chance that large-caps could begin to reclaim relative strength in the near term.
Considering the established moderate upward trend and the current position near the 90-day high, it is likely that the IWM/SPY ratio will continue to test the 0.36970 resistance level in the immediate future. A successful and sustained move above this level would make it very likely that the underlying moderate upward trend in relative strength will endure, further extending small-cap outperformance. However, there is a roughly even chance that this level could prove to be formidable resistance, leading to a period of consolidation or a moderate retracement within the prevailing trend. A significant and sustained reversal below the 90-day average ratio of 0.35656 would make renewed large-cap outperformance likely. Based purely on the observed data patterns, the ratio’s immediate trajectory appears poised either for a continued challenge of the resistance or a short-term consolidation before another attempt.
Commodities
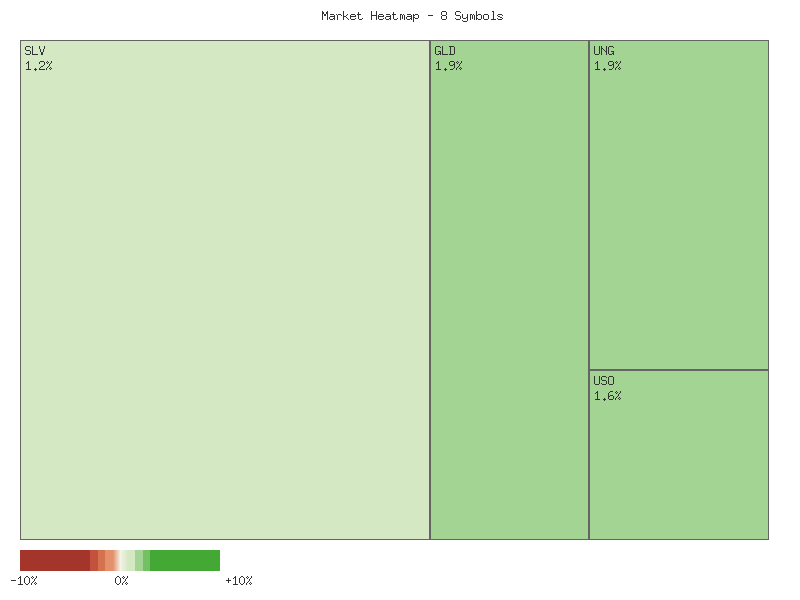
The latest daily percent changes across the observed commodity-linked symbols for October 6, 2025, are presented below, sorted in descending order:
| Symbol | Daily Percent Change |
|---|---|
| UGA | 2.161% |
| UNG | 1.916% |
| GLD | 1.885% |
| USO | 1.618% |
| SLV | 1.241% |
| DBC | 1.026% |
| CORN | -0.057% |
| CPER | -0.607% |
The collective daily performance of these instruments suggests an overall upward bias for the session. Summing the individual daily percent changes yields an aggregate positive change of approximately 9.183%, indicating an overall higher market sentiment across this specific basket of commodities. This collective gain is notable, especially considering the diverse nature of the underlying assets represented within the group.
Market breadth for this selection of symbols appears robustly positive for the observed period. Six out of the eight symbols advanced, while only two experienced declines. This 3:1 advancing-to-declining ratio is a clear indicator of positive momentum and suggests that bullish sentiment was broadly distributed across the majority of these commodity sectors. It is highly likely that this broad participation contributes significantly to the aggregate positive change. A continuation of such breadth patterns in subsequent sessions would likely support further upward movement for the composite. Conversely, a weakening of this breadth, indicated by an increase in declining symbols or a significant reduction in the magnitude of gains, would suggest a weakening of the current bullish impetus and a possible shift towards a more mixed or negative overall market.
Analysis of the GLD/SLV 14-day ratio reveals a clear moderate downtrend. The ratio has declined by approximately 7.25% over this period, moving from a high of 8.917 to a current value of 8.270. This downtrend indicates that SLV (silver) has demonstrated stronger performance relative to GLD (gold) over the past two weeks. The current ratio’s relative position at 0.075, near the lower end of its 14-day range, further corroborates this observation, suggesting silver has been consistently outperforming gold during this timeframe. The moderate volatility within this period indicates a relatively consistent directional move rather than extreme fluctuations. It is highly likely that this trend reflects an increasing preference for silver over gold, or a stronger aversion to gold than to silver among participants tracking these instruments.
Extending the lookback to 30 days, the GLD/SLV ratio similarly exhibits a moderate downtrend, with a change of approximately -6.52%. The current ratio of 8.270 is also situated near the lower end of its 30-day range, with a relative position of 0.068, reinforcing the long-standing outperformance of SLV against GLD. The 30-day high was 8.985, indicating a sustained period of silver strength. However, a divergence is observed when comparing the ratio’s established downtrend with the most recent daily performance: on October 6, GLD advanced 1.885% while SLV advanced 1.241%. This suggests that gold momentarily outperformed silver, which runs counter to the prevailing downtrend in the GLD/SLV ratio. This short-term reversal makes it roughly an even chance that the ratio’s moderate downtrend may pause or experience a minor correction in the immediate future, potentially signaling a temporary shift in the relative strength dynamics between gold and silver. A sustained period of GLD outperformance relative to SLV would be required to signal a more structural change in the ratio’s trend.
Technical Analysis Report: 2-Day Market Overview
This analysis provides a rigorous technical assessment of the provided 2-day candlestick data for select commodity-focused ETFs (UNG, SLV, GLD, CORN, CPER, USO, DBC, UGA). Our focus remains entirely on price and volume patterns within the specified timeframe, adhering strictly to estimative language guidelines.
GLD demonstrates a robust short-term bullish trend. Following an initial bullish session, the subsequent day saw a significant price gap higher, closing near its high with an increase in trading volume. This price action, supported by confirming volume, indicates strong buyer conviction. Consequently, a continuation of upward momentum for GLD is highly likely in the immediate term.
Other assets also show bullish price action, albeit with a cautionary note regarding volume. SLV, UGA, and USO each exhibited strong upward movement, including notable price gaps on the second day. While this signals immediate buying pressure, the accompanying decrease in volume for these assets suggests that the upward move, while likely to continue in the short term, may face challenges in sustainability without renewed buying interest. For these, a continuation of the upward price trend is likely, yet traders should observe subsequent volume for confirmation of conviction.
DBC and UNG present a more mixed picture. DBC saw a neutral first day followed by a strong bullish gap-up and close on the second day; however, this significant move occurred on substantially decreased volume. While an immediate upward continuation is likely, the sustainability of this rally beyond the short term is a roughly even chance, given the diminished participation. UNG experienced a bearish first day, followed by a bullish second day which failed to reclaim the prior day’s open, also on decreased volume. For UNG, there is roughly an even chance of either continued consolidation or a resumption of downward pressure.
Finally, CORN and CPER indicate either weakening bullishness or a bearish bias. CORN registered two consecutive days of slight downward drift or consolidation, with the second day being an inside bar and showing reduced volume. A continuation of this consolidating or slightly downward trend is likely, and a significant bullish reversal is unlikely. CPER observed a bullish first day followed by a bearish second day that closed lower than the prior day’s close, also on decreased volume. This pattern suggests a loss of upward momentum and a likely scenario of further consolidation or downward pressure, with a short-term bullish continuation being unlikely.
In summary, the 2-day data reveals clear strength in precious metals (GLD, SLV) and energy-related commodities (USO, UGA), although volume dynamics warrant close observation for all except GLD. Broad commodities (DBC) show a strong immediate move but with volume concerns, while natural gas (UNG) and agricultural commodities (CORN) alongside industrial metals (CPER) present less convincing or outright weakening technical pictures. Traders should recognize the short-term nature of this analysis and monitor future price and volume action for developing trends.
SLV has demonstrated a distinct and robust upward trend over the provided 90-day period, advancing from approximately in late May to a closing price of .06 on October 6th. This sustained appreciation is characterized by a clear sequence of higher highs and higher lows, indicative of strong buyer control. Periods of significant upward price movement, particularly visible in early June, mid-July, and the accelerated ascent from late August through early October, have been consistently supported by notably higher trading volumes. This increased volume during rallies suggests a strong conviction behind the upward moves and reinforces the legitimacy of the prevailing bullish sentiment. Following minor consolidations, such as those observed in late June and late July, the asset has demonstrated a pronounced tendency to resume its upward trajectory with renewed vigor, ultimately closing near its high for the observed window.
Analysis of the PPO (13,21-day) indicator largely corroborates the robust bullish momentum inferred from the price action. The PPO has primarily maintained a positive value throughout the 90-day data set, signifying that the shorter-term exponential moving average (13-day) has consistently remained above its longer-term counterpart (21-day). After a notable dip in late July, which coincided with a period of price consolidation, the PPO decisively turned upwards in mid-August. Since this inflection point, the PPO has exhibited an accelerating upward trend, reaching an elevated value of 2.83 by the conclusion of the data series. This sustained and expanding positive divergence of the PPO is characteristic of a strong, established uptrend, indicating that underlying buying pressure remains significant and has not yet shown signs of abating based on this momentum oscillator.
While the price action and PPO confirm strong bullish momentum, the 14-day Relative Strength Index (RSI) presents a critical consideration for the near-term outlook. The RSI has been in overbought territory (above 70) for several prolonged periods within the 90-day window, notably in early June, mid-July, early September, and most conspicuously from mid-September through early October. On the final day of the data, October 6th, the RSI stands at an exceptionally elevated 81.55. Such persistently high RSI readings, particularly when consistently above 80, are widely interpreted as signaling that the asset is deeply overbought. This condition suggests that, despite ongoing momentum, a short-term price correction or at least a period of sideways consolidation is becoming increasingly likely. The extended overbought state of the RSI raises the probability of a temporary reversal in the immediate future.
Considering the confluence of indicators, a continuation of the upward movement remains plausible, especially if the strong buying pressure and positive PPO momentum persist. However, the deeply overbought condition of the 14-day RSI makes a near-term price pullback or sideways consolidation likely. There is a roughly even chance that SLV could experience a modest decline to test prior technical support levels, such as the - range established in early September, or potentially the - range from mid-August, before potentially attempting another leg higher. Conversely, if current buying intensity is sustained, SLV could continue its ascent despite the overextended RSI, pushing into new highs. Nevertheless, the combined technical indicators suggest that the current rate of price appreciation is unsustainable in the immediate term, and traders should regard the present price levels with increased caution due to the elevated risk of a short-term reversal.
GLD Technical Outlook: Extreme Momentum Driving Strong Uptrend
GLD has experienced a very strong bullish trend over the past 90 days, particularly accelerating from late August through early October. The price has advanced significantly from approximately to over at the close of the period, demonstrating a clear pattern of higher highs and higher lows. This robust upward movement is corroborated by generally increasing volume during rallies, which suggests strong buyer conviction and participation in the advance. The overall technical posture of GLD is definitively bullish, having carved out a sustained uptrend over the analyzed timeframe.
Analysis of momentum indicators, specifically the 14-day Relative Strength Index (RSI) and the 13,21-day Percentage Price Oscillator (PPO), provides further insight into the strength of this trend. Following a period of neutral or slightly negative momentum in late July and early August, where RSI values hovered in the 40s and the PPO briefly dipped below zero, both indicators decisively turned positive. The PPO crossed above its zero line around early August and has since sustained a robust positive trajectory, reaching its highest point in the observed period at 1.678 on October 6. Concurrently, the 14-day RSI entered overbought territory (above 70) in early September and has largely remained there, currently registering an extreme reading of 82.82.
The sustained and extreme overbought readings on the RSI, combined with the parabolic ascent of the PPO, indicate that GLD is experiencing very strong bullish momentum. However, such extended periods in extreme overbought territory, while characteristic of robust uptrends, increase the likelihood of a near-term price consolidation or a minor corrective pullback. A roughly even chance exists for GLD to either continue its ascent, albeit at a potentially slower pace, or to enter a period of consolidation to digest recent gains. A significant reversal of the established multi-month uptrend in the immediate future appears unlikely, given the absence of notable bearish divergences on these indicators at the most recent peaks and the strength of the underlying price action.
While the overall technical picture remains strongly bullish, traders should be prepared for the possibility of a temporary pause or a modest retracement from these extended levels. Monitoring for a potential bearish divergence, where price records new highs but momentum indicators fail to confirm with corresponding higher highs, or a definitive break of any emerging short-term support levels, would be prudent. The current technical evidence suggests that GLD is highly likely to remain in a bullish regime for the foreseeable future, though the very high momentum readings imply that a period of reduced volatility or a shallow correction is likely before the next significant leg up.
Bonds
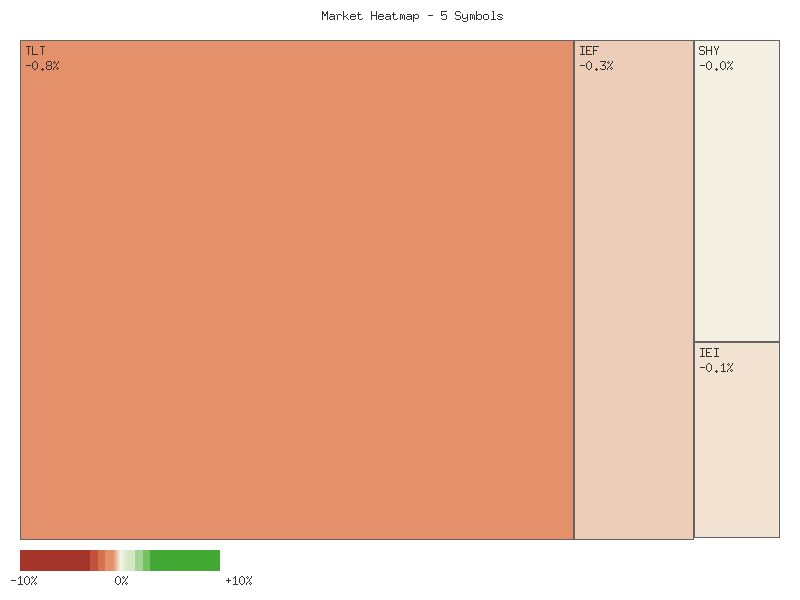
Technical analysis of the provided daily percentage change data for TLT, UTHY, IEF, IEI, and SHY over a two-day period (October 3rd and October 6th, 2025) reveals a uniformly bearish technical posture across all examined instruments. The aggregated daily percentage changes for each symbol are presented below, sorted in descending order of performance:
| Symbol | Daily Percent Change (2-day aggregated) |
|---|---|
| SHY | -0.06038% |
| IEI | -0.27630% |
| IEF | -0.48716% |
| UTHY | -0.93464% |
| TLT | -0.98420% |
A review of the collective daily percentage changes indicates an overall lower trend for these symbols. The sum of the aggregated daily percentage changes across all five instruments totals approximately -2.743%. This widespread negative performance is a strong technical signal of downside pressure. The complete absence of advancing symbols and the presence of five declining symbols results in a market breadth ratio of 0 advancing to 5 declining. This uniform bearish breadth indicates with high confidence that selling pressure was pervasive across this specific segment of the market during the observed period.
The magnitude of decline appears to be inversely correlated with duration, with longer-duration instruments exhibiting greater percentage losses. TLT and UTHY, representing longer-term fixed income, registered the most substantial two-day declines at -0.984% and -0.935% respectively. Conversely, SHY, a short-duration instrument, experienced the mildest decline at -0.060%. This discernible pattern strongly suggests that longer-duration instruments are exhibiting increased sensitivity to prevailing market forces, likely indicating a technical preference for shorter-duration assets or a collective aversion to duration risk within the analyzed universe.
An examination of the daily progression from October 3rd to October 6th suggests an acceleration of selling pressure in the longer-duration assets. TLT’s daily decline increased from approximately -0.19% to -0.79%, while UTHY’s decline intensified from -0.25% to -0.68%. IEF also saw a marginal acceleration from -0.20% to -0.29%. This pattern of increasing negative momentum within the longer-duration instruments is technically significant, indicating that downside impetus was building rather than dissipating over the two trading days. In contrast, IEI and SHY demonstrated a more tempered trend, with SHY’s daily decline actually moderating from -0.036% to -0.024%, which may point to comparatively higher resilience in the very short end of the duration curve.
Based strictly on the provided two-day data, the technical posture of these instruments is almost certainly bearish. The combination of widespread declines, uniformly negative market breadth, and accelerating downside momentum in key longer-duration assets collectively points to a high probability of continued weakness in the immediate term for this segment. However, the limited temporal scope of this data necessitates caution when extrapolating longer-term trends; while a continuation of this bearish trend is likely, a reversal of momentum after only two days of data is a plausible, albeit less probable, alternative scenario if subsequent sessions show distinct shifts in price action and breadth.
As a Chartered Market Technician with over 15 years of experience, my analysis of the provided two-day market data for TLT, UTHY, IEF, IEI, and SHY indicates a clear and consistent bearish trend across all observed Treasury bond ETFs. The price action over October 3rd and October 6th demonstrates broad-based selling pressure, impacting instruments across various duration profiles. This synchronized movement suggests a prevailing negative sentiment within this asset class.
Detailed examination of the candlesticks reveals a uniform bearish pattern. On October 3rd, all five instruments formed bearish candles, closing lower than their open prices. This initial bearish signal was strongly reinforced on October 6th, as every ETF opened with a significant price gap down relative to its prior day’s close. Furthermore, each instrument concluded the October 6th trading session at or very near its daily low, forming a clear second consecutive bearish candle. This consistent display of lower opens and weak closes across the board is a compelling technical indication of downward momentum.
The price declines were accompanied by a notable increase in trading volume for all instruments on October 6th compared to October 3rd. For example, TLT saw its volume jump from approximately 24.6 million to 28.3 million shares, with similar percentage increases observed in IEF, IEI, SHY, and UTHY. Rising volume on down days adds conviction to the bearish price action, suggesting that the selling is driven by genuine market participation rather than thin liquidity. This volume expansion reinforces the technical significance of the observed price depreciation.
Based solely on this two-day technical data, the near-term outlook for these Treasury bond ETFs is decidedly bearish. The combination of consecutive bearish candlesticks, significant opening gaps down, and increasing volume confirming the declines points to strong selling conviction. It is likely that this bearish momentum will persist in the immediate future, continuing to exert downward pressure on prices. We observe no technical patterns within this limited dataset that would suggest an imminent reversal or a significant pause in the current trend.
While a two-day dataset provides a constrained view for long-term trend forecasting, for the very short-term, the probability of further downward price action for these instruments remains elevated. For the observed bearish trend to reverse course, we would need to see a sudden and substantial influx of buying interest, potentially manifested as a strong bullish engulfing pattern or a significant upward price gap on much higher volume. Given the existing data, such a reversal is unlikely in the immediate term, as the prevailing technical evidence strongly supports continuation of the downtrend.
Crypto
The aggregated daily percentage changes across the observed instruments, IBIT and ETHA, reveal a pronounced positive momentum over the two-day period. The following matrix summarizes the cumulative performance:
| Symbol | Total Daily Percent Change |
|---|---|
| ETHA | 5.083% |
| IBIT | 3.632% |
The summed daily percentage change for both instruments amounts to approximately 8.715%, indicative of a generally bullish sentiment pervading this market segment. This aggregate positive shift suggests that an upward bias is likely to be the dominant force in the very short term.
ETHA’s performance demonstrates a robust upward trajectory. The daily percentage change accelerated considerably, moving from a gain of approximately 0.617% on the first observed day to a more significant 4.466% on the second. This sequential increase in positive momentum, specifically the near 625% increase in daily gain from the first to the second data point, signals strong buying interest. The asset is exhibiting notable relative strength, which, based on this short-term data, makes a continued upward price action likely in the immediate trading sessions, assuming the prevailing market conditions for this asset class remain supportive.
IBIT also registered consistent positive daily percentage changes, advancing approximately 1.512% on the first day and 2.120% on the second. While its cumulative gain trails ETHA, the sequential acceleration, approximately 40% higher on the second day, confirms a positive short-term trend. The pattern of increasing positive daily changes, even if more modest than ETHA’s, suggests that buyer conviction is strengthening. Continued positive momentum for IBIT is probable as long as broader market sentiment in its specific segment remains constructive.
A comparative analysis reveals that ETHA is exhibiting superior short-term momentum and relative strength against IBIT, with a substantially larger second-day gain contributing to its higher cumulative return. This divergence in performance, particularly the magnitude of ETHA’s acceleration, suggests that capital flow may be favoring ETHA within this specific two-day observation. While both instruments demonstrate bullish inclinations, ETHA’s outperformance is likely to persist in the very near term, should the market continue its current upward trajectory. However, with only two data points, the sustainability of this divergence requires further observation.
Considering the observed gains, a roughly even chance exists for a brief period of consolidation or minor profit-taking in either or both instruments. This is a natural market reaction following positive movements, even when underlying momentum is strong. However, a sharp reversal of the observed trend for either IBIT or ETHA is unlikely given the consistent positive daily changes and the clear acceleration in buying interest. Technical analysis of these two data points indicates a market segment currently dominated by positive momentum, with ETHA exhibiting a more aggressive upward impulse. Further data points would be necessary to confirm longer-term trends or the establishment of new support/resistance levels.
Magnificent 7 & Friends
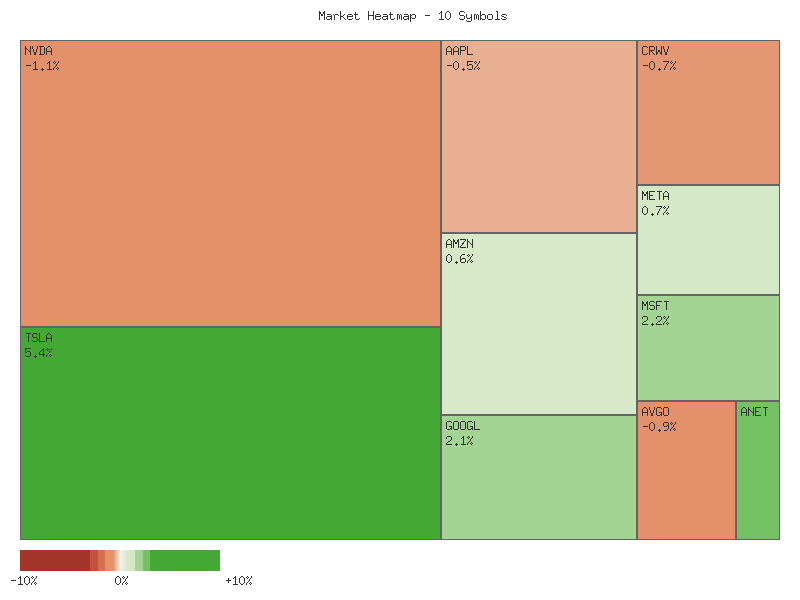
Analysis of the provided technical data for the specified symbols reveals a market exhibiting a discernible degree of divergence, with strength concentrated in a subset of securities despite a positive aggregate movement. The overall summation of the net daily percentage changes across all ten symbols indicates an aggregate gain of approximately +3.93%. However, an examination of market breadth suggests underlying weakness. Six of the ten symbols (AAPL, AMZN, NVDA, AVGO, META, CRWV) registered a net decline over the two-day period, while only four (TSLA, GOOGL, MSFT, ANET) advanced. This distribution implies a negative market breadth, with declining issues outnumbering advancing issues, which often indicates selective capital flow rather than broad-based market strength. The overall market for this specific basket of symbols is best characterized as mixed to selectively higher, with more individual components experiencing downward pressure.
Among the advancing symbols, TSLA exhibited the most substantial positive movement, recording a net gain of approximately +4.03%. This represents a significant recovery from its preceding day’s decline, suggesting a strong bullish technical reversal or short-term momentum. ANET followed with a robust net increase of approximately +3.47%, while MSFT and GOOGL also posted notable gains of roughly +2.48% and +1.93%, respectively. The presence of these prominent technology names among the top performers indicates that capital was likely rotating into specific high-cap growth assets during this period. The magnitude of these gains suggests strong buying interest, making it probable that these symbols could maintain upward momentum in the immediate short term, provided no significant bearish technical signals emerge.
Conversely, a majority of the analyzed symbols experienced net declines. CRWV was the most significant underperformer, registering a substantial net loss of approximately -3.02%. NVDA and META also posted notable drawdowns, with net declines of approximately -1.78% and -1.55%, respectively. AMZN and AVGO showed more moderate, yet still negative, net changes of approximately -0.67% and -0.79%. AAPL also concluded the two-day period with a marginal net decline of approximately -0.17%. The broad distribution of decliners suggests that selling pressure or profit-taking was more prevalent across the broader segment of this cohort. For symbols like CRWV, the persistent decline over both observed days makes it likely that further downside pressure could develop in the immediate future unless significant buying volume materializes.
Considering the data, while the aggregate change for this specific group of symbols is positive, the negative market breadth strongly suggests that the upward movement is not broad-based. It is likely that capital allocation remains concentrated in a few outperforming names, potentially leading to increased volatility or rotational shifts in the near term. There is a roughly even chance that this pattern of selective strength and broader weakness could persist, indicating a market environment where individual stock selection based on specific technical patterns may prove more critical than broad market exposure. The disparity between strong performers and the higher count of declining symbols could point to underlying caution among market participants despite headline aggregate gains.
Here is the matrix of each symbol and its net daily percent change, sorted in descending order:
| Symbol | Net Daily Percent Change |
|---|---|
| TSLA | 4.034% |
| ANET | 3.469% |
| MSFT | 2.481% |
| GOOGL | 1.932% |
| AAPL | -0.169% |
| AMZN | -0.671% |
| AVGO | -0.795% |
| META | -1.550% |
| NVDA | -1.781% |
| CRWV | -3.023% |
Technical Market Commentary: Two-Day Analysis of Select Equities
The two-day price action across the selected symbols presents a notably divergent technical picture, suggesting a bifurcated market sentiment among these specific equities. We observe distinct momentum shifts and continuations within this short timeframe, with some symbols exhibiting strong bullish conviction while others display equally strong bearish tendencies. Volume analysis, where notable, provides further insight into the underlying commitment behind these price movements. It is important to remember that this analysis is confined strictly to the provided two days of trading data.
Several symbols notably displayed strong upward momentum. TSLA formed a significant bullish reversal pattern on Friday, closing well above its open and the prior day’s high, largely negating Thursday’s decline. This suggests a likely continuation of buying pressure. MSFT also showed robust bullish action, with Friday’s strong candle closing near its high on increased volume, indicating probable follow-through buying. Similarly, GOOGL displayed clear upward trajectory, with Friday’s price action reflecting strong buyer control and closing near its high, making further upward movement likely. META executed a classic bullish engulfing pattern on Friday, with increased volume confirming a reversal from Thursday’s selling pressure. This pattern provides a high probability signal for a near-term bounce or reversal to the upside.
Conversely, a segment of the analyzed group demonstrated clear bearish tendencies. NVDA exhibited two consecutive bearish candles, with Friday’s session closing lower on notably increased selling volume. This pattern suggests a likely continuation of downward pressure. AVGO similarly displayed two bearish candles, with Friday’s session closing near its low despite earlier attempts to rally, reinforced by increased volume. This indicates that downward momentum is likely to persist. CRWV also falls into this category; Friday’s candle showed a strong rejection of higher prices (long upper shadow) and closed lower on increased volume, suggesting selling pressure remains dominant and further declines are probable.
A few symbols presented more ambiguous or consolidating technical signals. AAPL saw a strong bullish day followed by a bearish close below its open on Friday, though still within the prior day’s range. This could indicate a temporary pause or a loss of buying conviction; we assess it as having a roughly even chance of either a minor pullback or a consolidation phase. AMZN experienced a sharp bearish day followed by a recovery on Friday, closing above its open and prior close, but with Friday’s low significantly undercutting Thursday’s low. While the recovery is positive, it suggests a roughly even chance of continued consolidation or a retest of the lower bound. ANET gapped up significantly on Friday, only to reverse sharply and close near its open, forming a “shooting star”-like pattern. This rejection of higher prices makes further upward momentum unlikely in the immediate term, with a probable scenario of either a pullback or consolidation around current levels.
In summary, the provided data indicates a notable divergence across the examined securities. A cluster of strong bullish patterns (TSLA, MSFT, GOOGL, META) suggests a likely positive short-term outlook. Conversely, NVDA, AVGO, and CRWV are exhibiting clear technical weakness, making continued bearish pressure probable. For AAPL, AMZN, and ANET, the patterns are less decisive, suggesting periods of consolidation or indecision are roughly even, with ANET leaning towards a loss of upward momentum. Traders are advised to monitor subsequent price action to confirm these nascent trends.
S&P 500 Sector Breadth
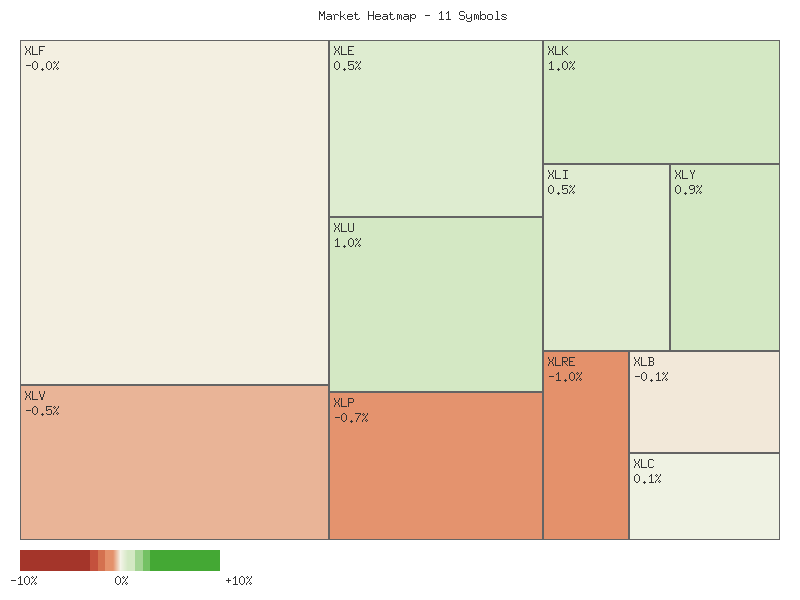
An analysis of the combined daily percentage changes across the eleven S&P 500 sectors over the past two trading days indicates an overall upward trajectory. The cumulative sum of all sector daily percentage changes for this period is notably positive, suggesting that aggregate market performance for these observed sectors has been higher. Utilities (XLU) exhibited the strongest two-day performance, experiencing a significant advance, followed by Energy (XLE) and Financials (XLF). This broader positive movement across a majority of sectors over the two-day period makes it likely that the underlying market demonstrated a constructive bias during this specific timeframe.
Focusing on the most recent trading day, October 6th, the market breadth presented a slightly positive bias among the observed sectors. Six symbols registered gains, while five symbols experienced declines, indicating a roughly even chance, with a slight edge towards advancing issues. Utilities (XLU), Technology (XLK), and Consumer Discretionary (XLY) were among the strongest performers on this specific day. Conversely, Real Estate (XLRE), Consumer Staples (XLP), and Health Care (XLV) registered the most significant declines. This mixed performance within individual sectors might suggest underlying cross-currents within the market, rather than a uniform directional movement.
Examining sector rotation between offensive and defensive categories on October 6th reveals a complex picture. Among the offensive sectors (XLK, XLY, XLF, XLI, XLB, XLE), four advanced (XLK, XLY, XLI, XLE) and two declined (XLF, XLB). For defensive sectors (XLU, XLP, XLV, XLRE), one advanced (XLU) while three declined (XLP, XLRE, XLV). The observed prevalence of advancing offensive sectors, particularly in Technology (XLK) and Consumer Discretionary (XLY), likely signals a general preference for growth-oriented segments. However, the strong performance of the defensive Utilities sector (XLU) alongside significant declines in other defensive sectors (XLP, XLRE, XLV) could indicate a degree of investor caution or a rotation within defensive plays. The market sentiment, based on the slightly positive breadth and the stronger representation of advancing offensive sectors, is likely inclined towards a risk-on environment, although the declines in multiple defensive and two offensive sectors prevent a strong assertion of unequivocally bullish sentiment. An alternative scenario might suggest that capital flows are highly selective, favoring specific growth narratives while shedding others, rather than a broad directional shift.
The following matrix details the cumulative daily percentage change for each symbol over the two-day period, sorted in descending order of performance, providing a clear visual representation of relative sector strength:
| Symbol | Total Percent Change |
|---|---|
| XLU | 2.12781% |
| XLE | 1.02631% |
| XLF | 0.65630% |
| XLV | 0.65499% |
| XLI | 0.60248% |
| XLK | 0.50831% |
| XLY | 0.21438% |
| XLB | 0.07818% |
| XLC | 0.05158% |
| XLP | -0.61502% |
| XLRE | -0.59247% |
From this matrix, it is evident that Utilities (XLU) and Energy (XLE) were the strongest performers over the two days, while Consumer Staples (XLP) and Real Estate (XLRE) were the weakest. This distribution suggests a divergent market where certain defensive sectors (XLU, XLV) can outperform alongside some offensive sectors (XLE, XLF, XLI, XLK, XLY), while others lag, further supporting the observation of selective capital deployment.
Market Commentary: Two-Day Sector Performance Analysis (October 3-6, 2025)
This analysis examines the two-day price and volume data for eleven SPDR Sector ETFs, providing a technical perspective on immediate market trends and potential short-term movements. The data suggests a bifurcated market, with distinct bullish and bearish forces evident across different sectors, and some showing clear indecision. All observations are based strictly on the provided candlestick data and associated volume.
Evidence of Bullish Momentum and Reversal: Several sectors exhibit robust buying interest. XLK (Technology), following a bearish close on October 3rd, demonstrated a significant bullish gap up on October 6th, closing higher despite some intra-day profit-taking. A continuation of bullish momentum is likely in the near term. Similarly, XLY (Consumer Discretionary) showed a strong bullish reversal, gapping up and recovering most of the previous day’s losses, indicating that further upward movement is likely. XLI (Industrials) resolved previous indecision with a clear bullish candle on October 6th, suggesting bullish continuation is likely. XLU (Utilities) and XLE (Energy) both presented consecutive bullish candles, with October 6th marking higher closes and strong price action, making further bullish continuation likely for both sectors. XLC (Communication Services) closed higher on increased volume on October 6th, recovering from intra-day lows, indicating that buying pressure is likely to continue pushing prices upward.
Bearish Trends and Reversal Patterns: Conversely, other sectors displayed notable bearish activity. XLP (Consumer Staples) experienced a significant down day on October 6th, closing below the previous day’s low on increased volume. This strong bearish price action makes a continuation of selling pressure likely. XLRE (Real Estate) also showed a bearish continuation, closing near its low and below the prior day’s low, which suggests further downside is likely. XLV (Health Care) indicated a bearish reversal; after attempting to rally on October 3rd (evidenced by a long upper shadow), October 6th saw it open higher but decisively close below the previous day’s closing price. This suggests that bearish sentiment is likely to persist.
Sectors Showing Indecision or Mixed Signals: Two sectors presented more ambiguous technical pictures, suggesting a roughly even chance of either bullish or bearish continuation in the immediate future. XLB (Materials) exhibited two consecutive small-bodied candles with decreasing volume, and October 6th closed marginally lower. This pattern denotes a period of consolidation and indecision, where neither buyers nor sellers are demonstrating clear control. A decisive breakout in either direction would require confirming price action and volume. XLF (Financials), on October 6th, opened with a gap up and attempted to rally, but faced strong selling pressure that pushed prices back to close marginally below the previous day’s close. While the net change was minimal, the failure to hold gains on high volume, alongside significant upper and lower shadows, points to a struggle between supply and demand. A bearish bias is present due to the rejection of higher prices, but the conviction for a sustained downtrend is not exceptionally high based solely on these two candles.
In summary, the provided two-day data suggests a market characterized by selective strength in growth-oriented and cyclical sectors, juxtaposed with clear weakness in some defensive sectors. While several sectors demonstrate clear directional bias supported by volume trends, the limited timeframe of the data calls for cautious interpretation. Traders should monitor subsequent price action to confirm these nascent trends.
Equity Breadth
The analysis of market breadth for the S&P 500 (SPX) over the past seven trading days reveals conflicting signals with respect to underlying participation. The percentage of S&P 500 members trading above their 50-day moving average (SPXA50R) displayed an oscillatory pattern, initially rising from approximately 57.49% to a high of 59.28% before retreating to 56.29% and then recovering partially. The latest reading shows a value of 57.68%, which represents a modest decline from the prior day’s 58.68%. This recent softening in the SPXA50R suggests that short-term participation among S&P 500 constituents experienced a minor loss of momentum towards the end of the period. While the overall trend for the 50-day breadth appears to be ranging within a defined band, the recent downturn raises the likelihood of short-term consolidation or a minor pullback in individual stock performance.
More critically, the percentage of S&P 500 members trading above their 200-day moving average (SPXA200R) exhibits a clear pattern of deterioration in the latter half of the observed period. Starting at approximately 62.08%, this metric initially showed strength, ascending to a peak of 63.67% on 2025-10-03. However, the subsequent trading day witnessed a significant decline to 61.88%, which is notably the lowest reading within this seven-day timeframe. This sharp decrease suggests a pronounced reduction in the number of S&P 500 components sustaining their long-term bullish trends. Such a retreat in the SPXA200R is typically indicative of weakening underlying market strength and raises concerns regarding the sustainability of any broad market advances. It is highly likely that this contraction reflects increasing pressure on stocks with weaker long-term technical postures.
In contrast to the breadth indicators, the 20-day Exponential Moving Average (EMA_20_DAY) for the SPX itself presents a consistent and robust upward trajectory throughout the entire seven-day period. The EMA_20_DAY steadily climbed from 6579.12 to 6637.90, with each day registering a higher value than the preceding one. This persistent ascent unequivocally signals a clear and established short-term uptrend for the benchmark index. However, the apparent divergence between this rising index EMA and the weakening breadth metrics, particularly the SPXA200R, is a noteworthy technical development. When the index continues to advance while fewer constituents participate or maintain their underlying strength, it suggests that the advance may be becoming concentrated in a smaller number of leading stocks.
Given the consistent upward momentum of the SPX EMA_20_DAY, the current trend direction is judged to be upward. However, the observed weakening in market breadth, especially the SPXA200R’s significant decline, implies that the sustainability of this upward trend faces increasing scrutiny. It is likely that the current index strength is less broad-based, potentially making the trend more vulnerable to shifts in leadership or selling pressure. A continuation of the current EMA_20_DAY ascent is probable in the immediate term, but a sustained decline in SPXA200R or further weakening in SPXA50R would considerably increase the likelihood of the EMA_20_DAY’s ascent decelerating or potentially reversing in the medium term. Alternatively, a rapid recovery in breadth indicators would suggest the recent weakness was transitory, reinforcing the current EMA_20_DAY uptrend, but such a development appears less likely given the magnitude of the recent SPXA200R drop. Therefore, while the SPX EMA_20_DAY trend is currently bullish, the breadth indicators suggest that underlying support for this trend is eroding, implying an elevated risk of a future trend shift.
SPX Daily
The SPX has exhibited a discernible upward trajectory over the past seven trading days, with the closing price advancing from 6661.21 on 2025-09-29 to 6740.28 on 2025-10-06. This constitutes an approximate 1.18% gain, indicating persistent bullish momentum. Analysis of individual candles within this period reveals a pattern of higher closes in most sessions, notably a strong bullish close on 2025-10-01 at 6711.20, followed by minor retracements and subsequent recovery. The most recent trading session on 2025-10-06 closed at 6740.28, forming a bullish candle with an open of 6733.86 and a high of 6749.52. This suggests that while there was an attempt to push prices higher during the day, selling pressure emerged near the high, causing the close to be off the day’s peak, yet still a net gain for the session. The overall direction remains firmly bullish based on this short-term price action.
Examining the exponential moving averages provides additional insights into direction and momentum. The 50-day EMA stands at 6507.57 on 2025-10-06, consistently trading above the 200-day EMA, which is at 6100.85. This “golden cross” configuration, maintained throughout the 90-day period and strengthening recently, indicates a robust, long-term uptrend. The current price (6740.28) is well above both moving averages, confirming strong upward momentum and indicating a pronounced bullish phase. Concurrently, the 14-day Relative Strength Index (RSI) registers at 71.61 on 2025-10-06. The RSI has been steadily climbing from 64.47 on 2025-09-29, crossing above the 70 threshold, which traditionally signals an overbought condition. This suggests that while momentum is strong, the current buying pressure might be excessive in the very near term, raising the probability of a forthcoming consolidation or a minor pullback.
From the provided candle data, immediate resistance is observable near the recent highs. The highest intraday price recorded in the past week was 6750.87 on 2025-10-03, with the most recent high being 6749.52 on 2025-10-06. This suggests a resistance zone approximately between 6749-6751. A sustained break above this level would imply a continuation of the upward trend. On the downside, immediate support is likely to be found around the prior day’s close of 6715.79 and the recent low of 6717.78 on 2025-10-06. More significant support levels include the cluster of closes around 6600-6615 from late September. The 50-day EMA at 6507.57 represents a dynamic support level, which has not been tested by price action recently, underscoring the strength of the current uptrend.
The prevailing technical posture suggests a continuation of the bullish trend is plausible, especially if the SPX can conclusively break above the 6751 resistance level. Should this occur, a movement towards uncharted territory for the provided data, potentially targeting the 6800 region, appears likely. The continuously ascending 50-day and 200-day EMAs provide a strong underlying bullish argument. Conversely, a bearish scenario could unfold if the market fails to sustain above current levels, leading to a rejection at the 6751 resistance. Given the overbought RSI, a short-term pullback to test the 6715-6717 support is a roughly even chance. A break below this immediate support would increase the probability of a retest of the 6600-6615 area, and subsequently the 50-day EMA at 6507.57. A sustained move below the 50-day EMA is currently assessed as unlikely due to the robust long-term trend, but would warrant a re-evaluation of the bullish narrative.
A neutral case might see the SPX consolidating within the 6700-6751 range for several sessions, allowing the RSI to moderate without a significant price correction. This sideways movement would reflect a temporary equilibrium between buying and selling pressures. Sentiment, as inferred solely from the provided technical data, appears predominantly bullish, supported by the consistent upward trajectory of price and the favorable alignment of the EMAs. The persistent strength suggests market participants have maintained strong buying conviction over the observation period, with each minor dip being quickly absorbed. However, the 14-day RSI entering overbought territory implies that short-term exuberance might be peaking. This could act as a technical driver for sentiment to shift towards caution, potentially prompting some participants to consider profit-taking or to reduce new long positions, leading to the aforementioned consolidation or minor pullback. The sustained bullish trend over the 90-day window suggests that underlying confidence remains high, but the overbought condition introduces a near-term cautionary element to an otherwise strong technical picture.
SPX Technical Commentary: Momentum Signals and Price Extension
The S&P 500 (SPX) has demonstrated a generally ascending trajectory over the past 90 days, with the most recent price action indicating a continuation of this upward movement, closing at 6740.28 on October 6th. An examination of the Percentage Price Oscillator (PPO) and the 14-day Relative Strength Index (RSI) offers insights into the underlying momentum and potential areas of concern for traders.
Throughout the 90-day period, the PPO (13,21) has largely remained in positive territory, which typically suggests that the shorter-term moving average is above the longer-term moving average, confirming a prevailing bullish momentum bias. We observed the PPO reaching a peak around 0.99 in late May, followed by a significant decline to a low of approximately 0.32 in early September. This decline in PPO during periods of rising price, particularly when comparing the PPO peak in early July (0.93 at price 6279) to the current PPO (0.56 at price 6740), suggests a bearish divergence. Specifically, the price has achieved higher highs while the PPO has printed a lower high, indicating that the upward momentum strength has unlikely been as robust as previous rallies, despite the continued price ascent. Since early September, the PPO has shown renewed upward momentum, rising from its low, which aligns with the recent positive price action.
Concurrently, the 14-day RSI provides additional perspective on price velocity and potential overextensions. The RSI has frequently entered overbought territory (above 70) during this period, notably around early July (75.5), late July (76.2), and late September (74.7). Each instance was followed by a subsequent pullback or consolidation in price, which is a common characteristic of overbought conditions. The most recent RSI reading for October 6th is 71.6, once again placing the index in overbought territory. This suggests that the SPX may be extended in the near term, and a reversal or consolidation is a roughly even chance. Furthermore, similar to the PPO, a bearish divergence is observable: the SPX has achieved higher price highs from early July to early October, while the corresponding RSI highs have shown a declining trend (75.5 to 71.6). This pattern likely indicates weakening underlying momentum despite ongoing price appreciation.
Considering these technical patterns, the market is currently in an overbought condition based on the RSI, and both the PPO and RSI exhibit bearish divergences relative to price over the broader 90-day window. While the prevailing price trend remains upward, the combination of an overbought RSI and the observed divergences in both momentum indicators suggests that a period of consolidation or a minor pullback is likely in the near future. An alternative scenario, though currently less likely given the indicator readings, involves a continuation of the upward trend, possibly fueled by strong buying interest that could override these momentum signals, potentially pushing the RSI further into overbought territory before any significant correction. Traders are advised to monitor for a potential loss of momentum or a shift in the immediate trend as these divergences could foreshadow future price weakness.