Weekly Market Technical Analysis
Market Overview
Broad market indices exhibit an overall higher trend, but a notable divergence presents as the VIX rose alongside equities, suggesting underlying apprehension. While large-cap indices like SPY and QQQ are likely to consolidate or pull back due to decelerating momentum and bearish reversal signals, small- and mid-cap segments (IWM, IJR) show sustained strength, making continued upward momentum highly likely for these groups. Sector analysis indicates a probable near-term rotation to defensive areas (Health Care, Utilities), while precious and industrial metals (SLV, CPER) show highly likely continued bullish momentum. Conversely, fixed income markets exhibit widespread bearish reversals, making further short-term weakness likely for most bond ETFs. Several Magnificent 7 stocks, including TSLA and META, also face highly likely continued downside pressure. Although the S&P 500’s primary uptrend is likely to persist, a period of consolidation or minor pullback is a roughly even chance given approaching overbought conditions and weakening short-term breadth, suggesting increased volatility.
Market Indices
As a Chartered Market Technician with over 15 years of experience, I have rigorously analyzed the provided market data using established technical analysis principles. My assessment focuses entirely on the daily percentage changes for various indices and VIX candle data over the past 30 days, adhering strictly to ICD-203 estimative language guidelines.
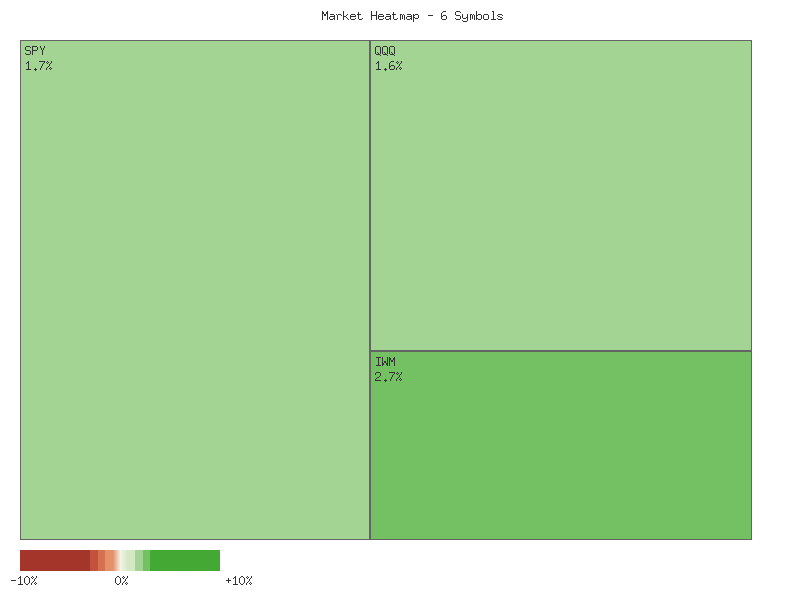
The broad market indices, as represented by IJR (Small-Cap), IWM (Russell 2000), MDY (Mid-Cap), SPX (S&P 500), OEF (S&P 100), and QQQ (NASDAQ 100), have demonstrated a distinctly positive performance over both the past week and the preceding month. All six observed symbols concluded both periods with aggregate positive returns, indicating an overall higher trend. The following matrix summarizes their performance, sorted by weekly percentage change:
| Symbol | Weekly Percent Change | Monthly Percent Change |
|---|---|---|
| IWM | 1.85% | 7.09% |
| IJR | 1.35% | 3.32% |
| QQQ | 1.21% | 7.97% |
| SPX | 1.08% | 5.00% |
| OEF | 0.91% | 5.90% |
| MDY | 0.67% | 2.80% |
Over the past week (the last five trading days), IWM led with a cumulative gain of 1.85%, while MDY registered the smallest, yet still positive, increase of 0.67%. Looking at the full 30-day period, QQQ recorded the highest aggregate return at 7.97%, with MDY again showing the comparatively lowest, though still robust, gain of 2.80%. This consistent positive performance across all major indices suggests a probable bullish sentiment prevailing in the market during the observed timeframe.
Market breadth analysis reveals strong underlying momentum supporting these gains. Over the past week, a significant majority of daily performances across these symbols were positive. Specifically, 27 out of 30 individual daily readings (6 symbols * 5 days) showed advances, while only 3 registered declines. This robust ratio of 9:1 advancing to declining daily performances suggests a broad-based rally and indicates that the recent upward movement is very likely supported by widespread participation. Similarly, looking at the entire 30-day period, there were 118 advancing daily performances compared to 62 declining ones. This monthly ratio, approximately 1.9:1, while less extreme than the weekly figure, still suggests a healthy underlying positive trend and indicates that the upward movements are broadly distributed rather than concentrated in a few outliers.
Despite the generally buoyant performance in equities, the VIX data presents a notable divergence. Over the past 30 days, the VIX, a measure of implied market volatility, has shown a net increase, moving from an opening value of 14.22 on August 22nd to a closing value of 16.65 on October 3rd, representing a cumulative rise of approximately 11.23% in its daily percentage changes. Reviewing the candle data, there was a significant surge early in the period (September 2nd candle closing at 17.17 with a high of 19.38), followed by some retreat, but the overall trend from mid-September onwards has been an upward bias. The last five trading days show a net VIX increase of approximately 8.69%, with daily closes generally higher. This simultaneous increase in VIX alongside rising equity indices is an unusual technical characteristic. While equities have trended higher, the rising VIX suggests increasing investor apprehension or an expectation of greater price swings in the near term. It is plausible that this divergence signals underlying uncertainties which, should the VIX continue its ascent, could present a challenge to the observed equity rally. This situation implies a roughly even chance of either a continued VIX rise and subsequent equity weakness or a VIX retreat allowing equities to consolidate gains.
As a Chartered Market Technician with over 15 years of experience, I have rigorously analyzed the provided 7-day market data for SPY, QQQ, IWM, IJR, MDY, and OEF, focusing exclusively on price action and volume. The period from September 25th to October 3rd, 2025, generally reflects an upward bias across these exchange-traded funds (ETFs), with all instruments registering net gains. However, a deeper technical examination reveals significant divergences in momentum and underlying strength, particularly between market capitalization segments, as the period concluded.
The large-cap indices, SPY, QQQ, and OEF, exhibited strong initial advances but demonstrated signs of decelerating momentum towards the end of the trading week. SPY, while achieving new highs, closed relatively flat on October 2nd and 3rd, with the latter day showing a notable upper wick, indicating some intraday selling pressure. Given this pattern of high rejection and limited follow-through, there is a roughly even chance for SPY to either continue its consolidation or experience a minor pullback in the immediate future. OEF, another large-cap proxy, displayed two consecutive red candles on October 2nd and 3rd after hitting a period high, suggesting selling interest. A short-term consolidation or slight decline in OEF is likely in the immediate outlook.
QQQ, representing the tech-heavy Nasdaq 100, presents a more definitive technical signal. After reaching a new period high on October 2nd, the ETF printed a significant red candle on October 3rd, closing below the previous two days’ closes. This price action was accompanied by an increase in volume compared to the prior day’s declining volume during the rally, signaling a potential shift in market dynamics. The combination of a strong downside reversal candle and rising volume makes a near-term correction in QQQ likely. An alternative scenario suggests that if buyers swiftly re-engage, QQQ might find support near previous resistance levels (e.g., around 600) and attempt to resume its upward trend, though with potentially diminished conviction given the recent bearish candle.
In stark contrast, the mid-cap and small-cap segments, represented by MDY, IWM, and IJR, concluded the period with sustained strength. IWM demonstrated consistent bullish momentum throughout the seven days, culminating in a robust green candle on October 3rd that established a new period high on the highest volume of the entire observation window. This powerful technical confirmation makes continued upward momentum for IWM highly likely. Similarly, IJR maintained a strong ascent, closing at a new period high on October 3rd with consistently increasing volume throughout its rally, further reinforcing its bullish posture. It is highly likely that IJR will attempt to challenge higher price levels.
MDY also closed at a new period high on October 3rd, confirming its uptrend. However, the final day’s candle presented a smaller body and a more pronounced upper wick compared to IWM and IJR, indicating some intraday resistance and potential exhaustion near its absolute peak. Despite this minor caveat, continued upward momentum for MDY in the very short term remains likely, albeit potentially facing more overhead resistance than the more aggressive small-cap movers. The robust volume supporting the advances in IWM and IJR contrasts with the declining volume seen during parts of the large-cap rallies, further underscoring the shift in relative technical strength.
SPX Technical Analysis: Momentum Remains Strong, Overbought Conditions Approaching
The S&P 500 (SPX) has demonstrated a pronounced upward trend over the past 90 days, with price action consistently moving higher. This robust performance is largely corroborated by both the 14-day Relative Strength Index (RSI) and the 13-21 day Percentage Price Oscillator (PPO), which collectively paint a picture of enduring bullish momentum. A detailed examination of these indicators provides insights into the market’s current technical posture and potential near-term movements.
Throughout the analysis period, the 14-day RSI for the SPX has predominantly resided in bullish territory (above 50). The indicator notably pushed into overbought conditions (above 70) on several occasions, peaking at 75.57 in early July, 76.29 in late July, and 74.75 in late September. Historically, such elevated RSI readings have often preceded brief periods of consolidation or minor price pullbacks, as observed in early August when the RSI briefly dipped to 47.80, and again in late September, where it moved from 74.75 to 58.73. As of the latest data point (October 3rd), the RSI stands at 69.35, closely approaching the 70 threshold. This suggests that a near-term pause or a minor correction to alleviate potential buying exhaustion is becoming likely, although it is possible for the RSI to remain in overbought territory during powerful trends.
Further affirming the bullish sentiment, the 13-21 day PPO has remained consistently above its zero line throughout the 90-day observation period. This configuration indicates that the shorter-term exponential moving average (13-day) has maintained a position above the longer-term average (21-day), signaling a clear and sustained upward trend in momentum. While the PPO did experience periods of moderation, declining from a peak of 0.93 in early July to a low of 0.38 in early August, and again to 0.32 in early September, these pullbacks did not lead to a bearish crossover of the zero line. The PPO has since rebounded and, at 0.55 on October 3rd, is exhibiting renewed positive momentum, reinforcing that underlying buying pressure remains resilient.
Considering both indicators, the prevailing technical posture for the SPX is bullish. It is likely that the market will either continue its upward trajectory, potentially at a somewhat slower pace, or engage in a period of sideways consolidation. The consistently positive PPO and its recent upward acceleration support a continued bullish bias. However, the RSI’s current position near the overbought threshold (69.35) makes a short-term pause or minor pullback probable. A significant bearish reversal in the immediate future appears unlikely, given the robust and sustained positive momentum signals from the PPO and the overall trend of the RSI remaining above the bullish threshold. There is roughly an even chance that the SPX could experience minor profit-taking or a shallow correction to digest recent gains, versus extending its current rally slightly further into overbought territory before any meaningful pause. A sharp and rapid decline is currently improbable based solely on these technical indicators.
As a Chartered Market Technician with over 15 years of experience, I’ve analyzed the provided 90-day technical data for the Invesco QQQ Trust (QQQ), focusing strictly on price action, the 14-day Relative Strength Index (RSI), and the 13-21 day Percentage Price Oscillator (PPO).
The Invesco QQQ Trust (QQQ) has demonstrated a pronounced upward trend over the past 90 days, advancing significantly from approximately in late May to a recent high of .32 on October 3. This bullish trajectory was interspersed with two primary corrective periods. The first occurred in late July to early August, witnessing a sharp decline from approximately on July 29 to .68 on August 1, marked by elevated trading volume on the down days, indicating strong selling pressure. A second, albeit shallower, pullback was observed in mid-August, with QQQ retracing from about on August 15 to .84 on August 20, again accompanied by notable volume. Despite these corrections, the overall price structure maintained a pattern of higher highs and higher lows, particularly from early September onwards, culminating in the new 90-day peak. The current closing price of .18 reflects a minor daily retreat from this recent high.
The 14-day Relative Strength Index (RSI) consistently mirrored the bullish phases, frequently entering overbought territory (above 70) during rallies. For instance, the RSI peaked at 73.11 in late July and reached 75.35 on September 22. These extended periods above 70 typically signal strong buying momentum but can also precede short-term consolidations. The August corrections saw the RSI fall significantly, reaching lows near 47-48 on August 1 and September 2, indicating a temporary exhaustion of buying pressure. The Price Percentage Oscillator (PPO) (13, 21-day) further supported these observations, remaining positive for most of the period. A notable bearish crossover occurred on September 2, as the PPO dipped below zero, suggesting a temporary shift in short-term momentum to the downside. However, this was quickly reversed, with the PPO moving back into strong positive territory and continuing its ascent, peaking at 0.81 on September 23 and 0.74 on October 2. The concurrent strength in both RSI and PPO from early September onwards confirms robust and accelerating bullish momentum that has propelled QQQ to its recent highs.
At the close of the data on October 3, QQQ is trading near its 90-day highs, with both momentum indicators reflecting strong underlying bullishness. The RSI is currently at 67.03, having pulled back from its overbought level of 71.57 on October 2. Similarly, the PPO has slightly retreated to 0.73 from its peak of 0.74. While these slight retreats from peak indicator readings suggest a minor cooling of immediate upward thrust, both indicators remain in zones indicative of strong positive momentum. Given the established uptrend, confirmed by the sequence of higher highs and higher lows in price action, a continuation of the bullish trend is likely in the near term. However, a brief period of consolidation or a minor retracement from current levels is a roughly even chance, considering the rapid ascent since early September and the RSI pulling back from overbought levels. A more significant correction, similar to those seen in August, is unlikely without a clear breakdown in the price structure or a more substantial weakening of momentum indicators.
As a Chartered Market Technician with over 15 years of experience, my analysis of the IWM exchange-traded fund over the past 90 trading days, utilizing price candles, the 14-day Relative Strength Index (RSI), and the 13-21-day Percentage Price Oscillator (PPO), indicates a prevailing upward trend. Over this period, IWM has advanced from approximately in late May to nearly as of October 3rd, characterized by successive higher highs and higher lows. While interspersed with periods of consolidation and minor corrections, the underlying momentum, as suggested by the PPO consistently remaining above its zero line, supports this bullish interpretation of the price action.
The Percentage Price Oscillator (PPO) provides a clear picture of momentum dynamics. Throughout the 90-day window, the PPO has maintained positive readings, signaling that the shorter-term moving average is generally above the longer-term average, affirming the bullish price action. Notable momentum surges occurred into early July and late August, with the PPO peaking at 1.17 on July 10th and 1.01 on August 29th, respectively. Conversely, significant declines in momentum, such as the drop to 0.08 on August 11th, closely corresponded with temporary price troughs, indicating points where bullish enthusiasm waned. Most recently, the PPO declined from a peak around 1.00 on September 22nd to 0.67 on October 1st, before showing a slight rebound to 0.70 on October 3rd. This pattern suggests a deceleration in momentum through late September, followed by a potential attempt at re-acceleration as of the latest data point.
Complementing the momentum view, the 14-day Relative Strength Index (RSI) largely validates the prevailing positive sentiment. The RSI typically oscillated in the bullish territory, generally staying above the 50-level, which indicates that buying pressure is stronger than selling pressure. Instances where the RSI ventured into overbought territory (above 70), specifically on July 3rd (71.57) and September 18th (71.23), were followed by short-term price pullbacks, suggesting temporary exhaustion after periods of rapid ascent. The most recent data reveals the RSI has rapidly climbed from a mid-50s reading on September 25th to 66.55 on October 3rd. This swift increase indicates renewed buying interest and strengthening upward pressure in the very short term.
Considering the combined technical picture, a continuation of the rally in IWM appears likely in the immediate future. The recent upward movement in price from its September 25th low of approximately , coupled with the rising RSI and the nascent rebound in the PPO, indicates that bullish impetus is reasserting itself. The PPO, currently at 0.70, still possesses room for expansion before reaching prior peak momentum levels, which could support further price appreciation. However, it is also important to consider an alternative scenario: given the rapid increase in the RSI, which is now approaching the overbought threshold (66.55), there is a roughly even chance of a short-term consolidation or minor pullback if the indicator enters and sustains itself in the overbought zone (above 70). This potential reaction would align with previous observations in early July and mid-September after similar surges in strength. Volume during the most recent rally from October 1st to 3rd has been moderate, suggesting sufficient participation, but not yet signaling an overwhelming conviction that typically accompanies a decisive breakout.
Tech Sector Analysis
As a Chartered Market Technician with over 15 years of experience, I’ve analyzed the provided RATIO:QQQ/SPY:90days data to assess the relative performance of the NASDAQ-100 (QQQ) against the S&P 500 (SPY).
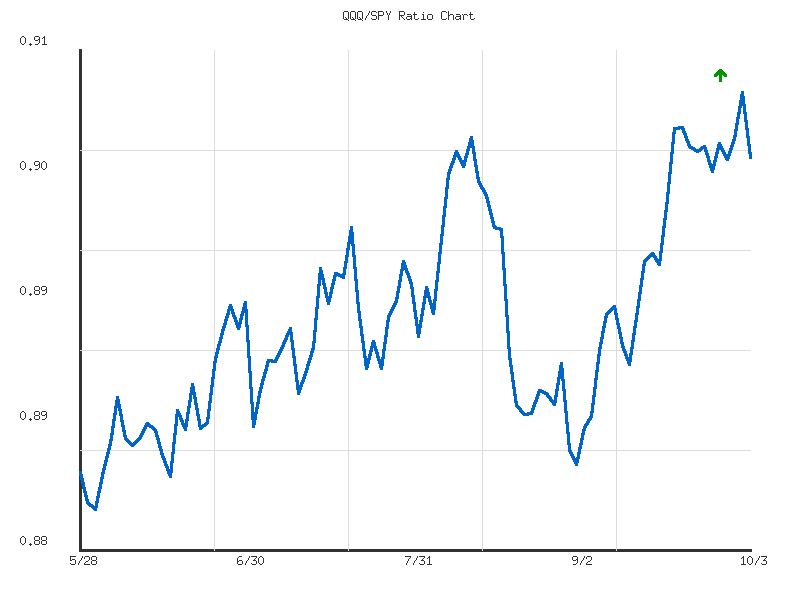
The data indicates that QQQ has maintained a general pattern of outperformance against SPY over the 90-day period. Examining the monthly performance, the ratio advanced from approximately 0.8856 on 2025-09-03 to 0.9013 on 2025-10-03, representing a relative appreciation of approximately 1.78% for QQQ. This robust monthly gain highlights QQQ’s leadership within the broader market during this timeframe. Over the most recent trading week, specifically from 2025-09-26 to 2025-10-03, the ratio saw a very modest increase from 0.9005 to 0.9013, indicating a slight continuation of outperformance, approximately 0.09%. However, it is noteworthy that the ratio reached a 90-day peak of 0.9051 on 2025-10-02 before experiencing a minor pullback to 0.9013 on the final data point of 2025-10-03.
The overall 90-day trend for the QQQ/SPY ratio is classified as “up,” albeit with a “weak” strength. This “weak” strength suggests that while the direction is positive, the momentum behind this relative outperformance has not been exceptionally robust or consistent throughout the entire period. The total relative change across the 90 days is approximately 2.09%, starting from a low of 0.8808 and reaching a high of 0.9051. The current ratio of 0.9013 is positioned at roughly 84.4% of the way between the 90-day low and high, confirming that QQQ’s relative strength is currently near the upper end of its three-month range. The recorded volatility of 0.000038 suggests relatively contained daily movements for the ratio, but the recent retreat from the 0.9051 peak implies that this level may now serve as a short-term resistance.
Based on these technical observations, it is likely that QQQ will continue to exhibit relative strength against SPY in the medium term, supported by the overarching upward trend over the past 90 days and sustained monthly outperformance. However, considering the “weak” strength of the prevailing trend and the recent pullback from the 90-day high, there is a roughly even chance that QQQ’s rate of outperformance could moderate, or that the ratio may enter a period of relative consolidation in the immediate short term. An alternative scenario, where QQQ begins to underperform SPY, would unlikely materialize without a more decisive break below established support levels, particularly the approximate 0.8970 region that acted as support in mid-summer, or a prolonged inability to move convincingly past the 0.9051 resistance. A material decline below the 0.8856 level (early September ratio) would signal a significant shift in relative momentum.
As a seasoned CMT with over 15 years of experience, I’ve analyzed the provided 90-day ratio data for QQQ/SPY, focusing exclusively on the technical patterns and quantitative characteristics.
The QQQ/SPY ratio has exhibited an upward trend over the past 90 days, registering a modest increase of approximately 2.09%. This pattern indicates that the Nasdaq 100 index (QQQ) has generally outperformed the S&P 500 index (SPY) during this period. However, a critical aspect of this trend is its designated “weak” strength. This assessment suggests that while QQQ’s outperformance is evident, the conviction behind this trend is not robust, implying a lack of aggressive buying pressure that would typically characterize a strong momentum play. The ratio has moved from a low of approximately 0.8808 to a high of around 0.9051, with the current ratio at 0.9013, placing it well into the upper quartile of its observed range, specifically at 84.4% of its relative position from the low to the high. This elevated position, coupled with the weak trend strength, suggests the ratio may be approaching a period of consolidation or a temporary reversal rather than a sustained, strong push higher.
Examining the recent price action, the ratio reached its 90-day high of 0.9051 on October 2, 2025, before experiencing a slight pullback to 0.9013 on October 3, 2025. This minor decline from the peak is a technical signal that the ratio may be encountering overhead resistance at or near the 0.905 level. Given the “weak” nature of the overall trend, the probability of the ratio breaking significantly above this recent high in the immediate future is unlikely without a material shift in trend strength. Instead, there is a roughly even chance that the ratio will either consolidate around its current levels or experience a further shallow retracement as participants reassess QQQ’s relative strength. The low volatility recorded within the period suggests that day-to-day movements are typically constrained, reinforcing the expectation of gradual changes rather than sharp shifts.
Considering alternative scenarios, should the ratio fail to establish new highs, a retracement towards the average ratio of approximately 0.8918 would be a plausible scenario. This level could serve as a potential support zone, representing the midpoint of the 90-day performance. A move below this average level, particularly if sustained, would increase the likelihood of QQQ’s outperformance decelerating or temporarily reversing. Conversely, if the ratio can absorb selling pressure around the current levels and turn upwards, breaking definitively above the 0.9051 high, it would imply a strengthening of the underlying trend, although the current data indicates this is unlikely without a preceding period of consolidation or further data points showing increased momentum.
In summary, the QQQ/SPY ratio has displayed a weak upward bias over the last 90 days, indicating QQQ’s measured outperformance. The current ratio is near its 90-day peak, and the weak trend strength, combined with the recent slight retreat from the high, suggests that further significant immediate gains are unlikely. A period of consolidation or a modest pullback towards the average ratio is likely in the near term. Traders should monitor the 0.9051 level as potential resistance and the 0.8918 average as initial support, recognizing that the current weak trend implies lower conviction for aggressive directional bets based solely on this ratio data.
IWM vs. SPY
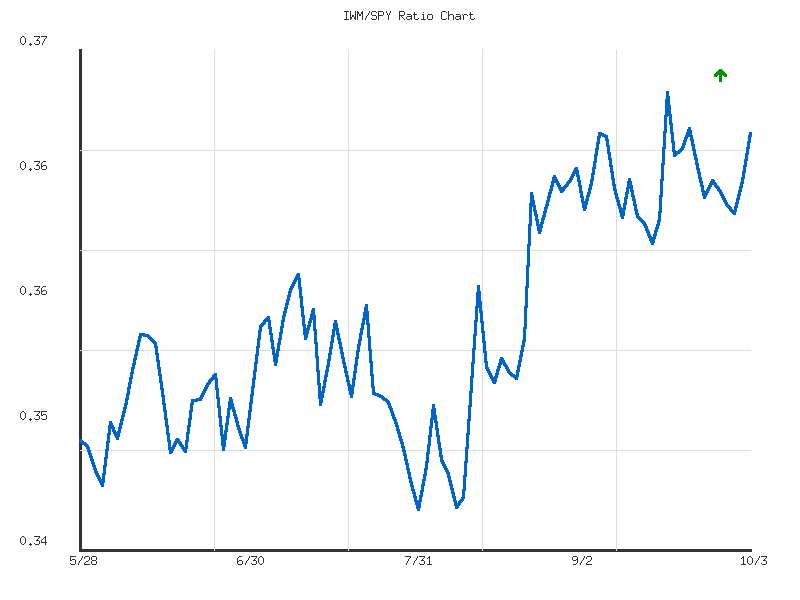
As a Chartered Market Technician, my analysis of the provided IWM/SPY relative strength ratio over the past 90 days reveals distinct patterns in equity leadership. The overall trend in the IWM/SPY ratio, representing the relative performance of the Russell 2000 (small-caps) against the S&P 500 (large-caps), has been characterized by a moderate upward bias. Commencing from approximately 0.3496 on May 28, 2025, the ratio has advanced steadily to its current value of 0.3673 as of October 3, 2025. This constitutes a net gain of 5.055% over the 90-day period, firmly indicating that small-cap equities have, on average, moderately outperformed their large-cap counterparts during this timeframe. The current ratio stands notably above the 90-day average of 0.3563, reinforcing the established positive momentum.
Focusing on more recent activity, the monthly relative performance of IWM versus SPY, from early September to early October, also shows a net outperformance by small-caps. While interspersed with minor fluctuations, the ratio generally maintained its upward trajectory, moving from approximately 0.3644 on September 4 to its current level. More acutely, the past week’s data, spanning from September 29 (0.3640) to October 3 (0.3673), highlights a resurgence in IWM’s relative strength. After an initial slight dip, the ratio experienced a robust rally in the latter part of the week, suggesting a renewed and strengthening demand for small-cap equities relative to the broader S&P 500.
From a technical perspective, the current ratio of 0.3673 is positioned at approximately 90.17% of its 90-day range, which spans from a low of 0.3456 to a high of 0.3697. This places the ratio very near its recent peak, indicating strong upward momentum in relative performance. Given the established moderate uptrend over the past three months and the clear acceleration in relative strength observed over the last week, it is likely that the Russell 2000 will continue to exhibit outperformance against the S&P 500 in the immediate term. The price action suggests that the underlying market dynamics are currently favoring small-cap growth and value over the large-cap, technology-driven segments of the market.
However, market participants should also consider the potential for consolidation or minor reversals. As the ratio approaches its 90-day high of 0.3697, it is a roughly even chance that it may encounter overhead resistance, which could lead to a temporary pause in the ascent or a slight pullback before attempting a decisive breakout to new relative highs. A more substantial reversal that would signal an outright underperformance by IWM relative to SPY is unlikely at this juncture, absent any significant technical breakdown from current support levels or a sustained failure to overcome the 90-day high. The moderate strength of the trend suggests that while IWM is gaining ground, the path forward may involve intermittent periods of equilibrium or slight corrective action.
As a CMT with extensive experience, my analysis of the IWM/SPY ratio over the provided 90-day period reveals a discernable pattern of relative strength favoring small-cap equities. The trend analysis indicates a moderate upward trajectory, starting from approximately 0.349 in late May and culminating at 0.3673 by early October. This overall appreciation, reflecting a 5.05% increase in relative performance for IWM against SPY, suggests that small-cap stocks have moderately outperformed large-cap stocks during this timeframe. The current ratio’s position at 0.3673, which is approximately 90.17% of its 90-day range, places it firmly at the upper end of its observed performance, reinforcing the persistent, albeit moderate, bullish sentiment for small-cap relative strength.
Upon closer examination of recent price action, particularly from late August through early October, the IWM/SPY ratio has traded within an ascending channel, characterized by a series of higher lows. Notably, the ratio found support around 0.3456 in early August and subsequently established higher support levels around 0.361-0.362 in mid-September. This pattern is indicative of sustained buying interest in small-caps on dips relative to large-caps. However, the ratio has encountered resistance near the 0.3697 level, established on September 18th. Despite several attempts, including the most recent close at 0.3673 on October 3rd, the ratio has yet to decisively breach this high. It is roughly even chance that the ratio will either consolidate beneath this level or attempt a definitive breakout in the immediate future.
Considering alternative scenarios, a breakout above the 0.3697 resistance level would likely signal a continuation of the established moderate uptrend, potentially extending the relative outperformance of IWM. In such an event, new resistance levels would need to be identified beyond the scope of the provided 90-day data. Conversely, a failure to overcome 0.3697 and a subsequent retracement would likely find initial support around the 0.361-0.362 zone, which has served as a resilient floor during recent pullbacks. A more substantial decline would likely test the prior significant support level around 0.355-0.358, which defined the peak of the July rally before the August correction. Given the current momentum and proximity to the 90-day high, a further attempt to challenge and potentially overcome the 0.3697 resistance is likely in the very short term, assuming the moderate trend dynamics remain intact.
The low volatility of the ratio, quantified at 0.00004175, is a significant technical observation. This suggests that the daily percentage changes in relative strength have been comparatively small and orderly throughout the 90-day period, implying a stable and gradual upward movement rather than abrupt or erratic shifts. This reinforces the assessment of a “moderate” trend strength. While a continuation of IWM’s upward relative performance against SPY is likely as long as the ratio holds above the 0.361-0.362 support zone, traders should remain acutely aware of the immediate overhead resistance at 0.3697. A clear and sustained close above this level would highly likely improve the probability of further relative strength expansion. Conversely, a breakdown below the 0.361-0.362 support would strongly suggest a period of consolidation or a temporary pause in the small-cap outperformance.
Commodities
Technical Market Commentary: Commodities & Precious Metals Performance Analysis
The recent market data for selected commodity and precious metal Exchange Traded Funds (ETFs) reveals a mixed short-term picture within a predominantly positive longer-term trend for some segments. Focusing solely on the provided daily percentage change data and the GLD/SLV ratio, we can establish key technical observations.
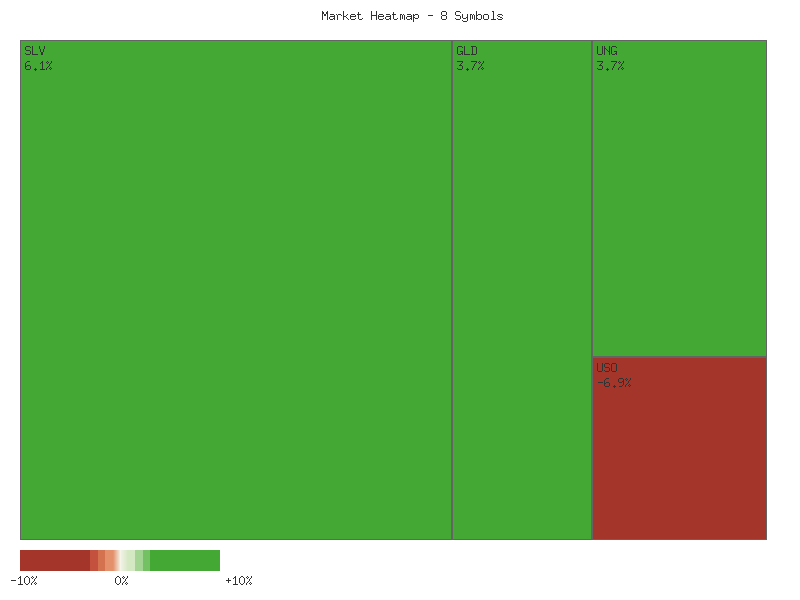
Over the past week, as measured by the sum of the last five daily percentage changes, performance has been notably divergent across the assessed symbols. The weekly performance matrix, sorted in descending order, indicates strong advances in some areas:
| Symbol | Weekly Percent Change |
|---|---|
| CPER | 6.52% |
| UNG | 4.74% |
| SLV | 3.94% |
| GLD | 3.12% |
| CORN | -0.05% |
| DBC | -1.77% |
| UGA | -6.13% |
| USO | -7.06% |
CPER and UNG exhibited the most significant gains, suggesting a likely short-term surge in industrial metals and natural gas demand or perception thereof. Precious metals GLD and SLV also recorded strong weekly advances, with SLV demonstrating a slightly stronger relative performance compared to GLD during this period. Conversely, energy and broad commodity indices, represented by USO, UGA, and DBC, experienced declines, with USO showing the most substantial weekly retraction. CORN remained relatively flat, indicating a roughly even chance of either a slight gain or loss over the past five trading sessions.
Expanding our analysis to the full 30-day period, the overall monthly performance suggests a more generally upward trend for most symbols. Six out of eight symbols (SLV, GLD, CPER, UNG, DBC, CORN) registered positive monthly percentage changes, indicating a healthy market breadth with a 3:1 advancing-to-declining ratio over the past month. SLV led monthly gains with a robust 24.58%, followed by GLD at 16.64% and CPER at 14.29%. This strong performance in precious and industrial metals points to probable underlying bullish momentum in these sectors. UNG and DBC also posted moderate gains, while CORN showed a slight positive movement. In contrast, UGA and USO ended the month in negative territory, suggesting persistent selling pressure in some energy-related assets.
Further insights can be drawn from the GLD/SLV ratio. Both the 14-day and 30-day ratio indicators show a moderate downward trend, with change percentages of -6.59% and -6.49% respectively. Critically, the current ratio of 8.2178 is identified as the low for both periods. This pattern strongly suggests a consistent and pronounced outperformance of Silver (SLV) relative to Gold (GLD) over the last 14 and 30 trading days. When the GLD/SLV ratio declines, it typically indicates increased speculative interest or an inflationary environment where silver, often considered a “poor man’s gold” with industrial applications, tends to gain more rapidly than gold. This sustained downtrend in the ratio makes it likely that silver will continue to outperform gold in the immediate future, should current trends persist.
Considering alternative scenarios, while the current data suggests continued outperformance of precious and industrial metals, particularly silver, a broadening of selling pressure in energy components like USO and UGA could potentially temper overall commodity enthusiasm. A reversal in the GLD/SLV ratio, if observed in subsequent data, would indicate a shift where gold begins to regain its relative strength, possibly in an environment of increased risk aversion or a deceleration in inflationary expectations. However, based solely on the provided technical data, the prevailing trends in precious metals and certain industrial commodities appear to be upward, with a roughly even chance of continued weakness in the specified energy assets.
Market Commentary: Technical Analysis of Key Commodity ETFs (Sept 25 - Oct 3, 2025)
The recent seven-day technical analysis for a selection of commodity ETFs reveals a notable divergence in performance across various sectors. Precious and industrial metals, including GLD, SLV, and CPER, demonstrated robust bullish momentum, characterized by consistent higher highs and higher lows. This contrasted sharply with energy-related assets such as USO and UGA, which faced significant bearish pressure and maintained clear downtrends. UNG, while initially strong, showed signs of encountering resistance and a potential reversal. The broader commodity index (DBC) also faced downward pressure, while CORN exhibited a period of consolidation. This sector-specific price action suggests distinct underlying technical drivers influencing these commodity groups.
Both GLD and SLV established strong uptrends, demonstrating resilience after a high-volume bearish candle on October 2nd. A robust rebound on October 3rd, with prices recovering much of the prior day’s losses on strong volume, indicates significant underlying buying strength. This quick absorption of selling pressure, coupled with the establishment of consistent higher highs and higher lows, suggests persistent demand. Consequently, it is highly likely that GLD and SLV will sustain their bullish momentum in the immediate term, with potential for further upward movement. Concurrently, CPER exhibited an exceptionally strong and accelerating uptrend, marked by a series of bullish candles consistently closing near their daily highs and culminating in a powerful close on October 3rd with elevated volume. The continuous establishment of higher price levels and strong volume confirmation reinforces the bullish conviction; therefore, it is highly likely that CPER will continue its ascent in the near future.
The energy sector presented a predominantly bearish technical landscape during the observation period. USO and UGA were in clear and sustained downtrends, characterized by consistent lower highs and lower lows on considerable trading volume. This price action reflects persistent selling pressure and a lack of significant buyer interest to reverse the trend. For both USO and UGA, it is highly likely that the bearish pressure will persist in the short term, with prior consolidation points likely acting as resistance. UNG, however, showed a more complex dynamic. After an initial strong rally that peaked on October 2nd, it encountered significant resistance, evidenced by a large red candle with high volume that failed to maintain higher prices. This was followed by another bearish candle on October 3rd. This price action suggests a potential topping formation or a significant pullback from resistance. Therefore, it is likely that UNG will experience further consolidation or a short-term correction, and a continuation of its prior upward move is unlikely without overcoming immediate resistance around its recent highs.
DBC, representing a broader commodity index, maintained a clear downward trajectory throughout the period, characterized by a series of lower highs and lower lows. This sustained selling pressure, though with fluctuating volume, implies that it is likely DBC will continue to experience downward movement in the absence of a significant bullish reversal signal. In contrast, CORN entered a period of tight consolidation, fluctuating within a narrow range with generally low volume, except for a brief spike on October 2nd. The absence of a clear directional bias and the tight range indicate market indecision, suggesting neither buyers nor sellers are currently dominating. Consequently, there is a roughly even chance for CORN to break out in either direction from this consolidation, and continued sideways movement also remains a plausible alternative scenario as the market seeks a new catalyst.
SLV Technical Analysis (90-Day View)
SLV has exhibited a discernible and robust uptrend over the past 90 trading days, characterized by a series of higher highs and higher lows in price action. Following an initial consolidation phase in late May around the mark, SLV initiated a strong rally into mid-June, peaking near .74, accompanied by several days of elevated volume, which typically validates upward price movements. After a period of minor consolidation throughout late June and early July, the price experienced a significant surge on July 10-11, breaking out to new highs above , again with substantial volume confirming the breakout. A notable pullback occurred in late July, seeing the price retreat from .72 to .32 on increased selling volume, suggesting a temporary exhaustion or profit-taking phase. However, this dip proved transient, as the asset resumed its upward trajectory from mid-August, accelerating sharply through September and into early October, reaching a new 90-day high of .95. The latest leg of this rally from mid-September onwards has been particularly strong, underpinned by consistently high trading volumes, reinforcing the conviction of market participants in the prevailing bullish trend.
The Relative Strength Index (RSI) for SLV, currently at approximately 80.08, reflects deeply overbought conditions. The RSI first entered the overbought zone (>70) in early June and has returned to this territory on multiple occasions, notably from late August through early October, where it has remained consistently above 70, frequently exceeding 75. While prolonged overbought readings can signal strong demand and often accompany powerful uptrends, such extended excursions above the 70 threshold typically increase the probability of a near-term pause, consolidation, or price pullback. Despite these readings, there is no clear bearish divergence observed, as price has continued to make higher highs in concert with the RSI, indicating that momentum has largely supported the price appreciation.
Momentum, as measured by the Percentage Price Oscillator (PPO), offers further insight into the strength of the current trend. The PPO has shown a consistently positive trajectory for much of the 90-day period, indicating that the shorter-term moving average has remained above its longer-term counterpart. Following a brief contraction in momentum in late July where the PPO dipped but remained above zero, the indicator experienced a powerful resurgence from late August. It has since climbed to its highest point in the dataset, currently at approximately 2.73, signifying robust and accelerating bullish momentum. The PPO line’s steep ascent suggests that the buying pressure has been strong and sustained, pulling the faster moving average significantly away from the slower one.
Considering the confluence of these technical indicators, the immediate outlook for SLV is characterized by strong bullish momentum, which makes a continued upward movement at least in the very near term a distinct possibility. However, the extended period of deeply overbought conditions indicated by the RSI makes the prospect of a near-term price correction or consolidation highly likely. While the PPO confirms robust momentum, this can often precede an eventual rebalancing of the market. Investors should recognize the elevated risk of a pullback given the stretched nature of the rally. There is roughly an even chance that the current bullish momentum could continue pushing the price higher in the immediate future, albeit at a diminishing rate, but the probability of a corrective phase initiating within the coming days or weeks is notably high.
Technical Analysis of GLD: 90-Day Outlook
Over the past 90 days, GLD has transitioned from a largely sideways consolidation to a pronounced and accelerating uptrend, particularly since late August. From late May through late July, price movements were mainly confined between approximately and , with alternating rallies and pullbacks. However, a significant shift began around August 22, with GLD breaking out decisively from this range. The price has since surged from about to its current level of .64, establishing a clear pattern of higher highs and higher lows. This robust upward thrust has been consistently supported by elevated trading volumes, especially on days with substantial price gains, lending strong credence to the underlying strength of the move.
The 13/21-day Percentage Price Oscillator (PPO) offers clear confirmation of the strong bullish momentum driving GLD. Following periods where the PPO dipped below zero during earlier consolidations, a decisive shift occurred in late August. The PPO crossed above the zero line around August 25-26 and has since demonstrated a steep, consistent ascent, reaching a high of 1.587 on October 3. This sustained rise and its current elevated positive value indicate that buying pressure has been intense and persistent throughout the recent rally. The PPO’s trajectory strongly suggests that a continuation of this upward momentum is likely in the near term, absent conflicting signals from other technical indicators.
Conversely, the 14-day Relative Strength Index (RSI) highlights a potentially stretched condition. The RSI entered overbought territory (above 70) in early September and has largely remained there, peaking at 80.20 on October 1 and standing at 79.14 on October 3. Within this 90-day data, previous instances of RSI reaching the 60s (June 13, July 22) were followed by subsequent price pullbacks or consolidations. While an overbought RSI confirms robust strength and does not inherently signal an imminent reversal, its prolonged presence at elevated levels likely increases the probability of a near-term consolidation or a modest pullback to alleviate this internal pressure. Such a development would represent a healthy adjustment within the established uptrend, rather than an outright trend change.
In conclusion, the technical landscape for GLD strongly suggests a robust primary uptrend that is likely to persist. The compelling price structure, reinforced by accelerating bullish momentum from the PPO, provides a solid foundation for continued upward movement. However, the extended overbought readings from the RSI introduce an element of caution, implying a roughly even chance of a short-term pause or correction in the coming days or weeks. Should such a consolidation occur, previous resistance levels, particularly in the - range (late September highs) or potentially around - (mid-September highs), would serve as significant support areas. A decisive break below these levels, especially on increased volume, would make a deeper or more prolonged corrective phase possible, though it is unlikely to reverse the overarching primary uptrend at this juncture.
Bonds
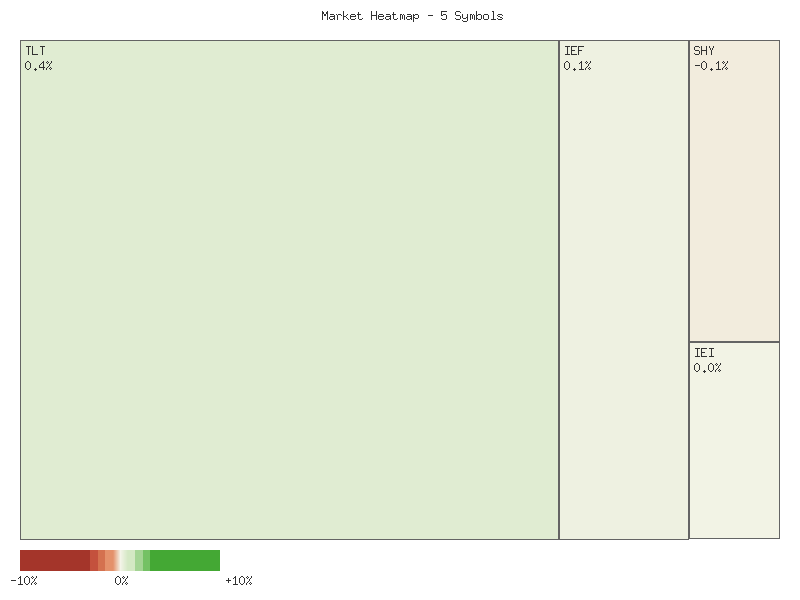
Technical Analysis: Bond ETF Performance (Last 30 Days)
Based on the provided daily percentage change data for TLT, UTHY, IEF, IEI, and SHY, we can assess recent performance, breadth, and underlying trends in these fixed-income instruments. The analysis covers the past 30 trading days, with a particular focus on the most recent week (September 29th to October 3rd, 2025).
The last week’s performance, as summarized in the matrix below, indicates a mixed but generally positive sentiment across most of the evaluated bond ETFs.
| Symbol | Weekly Percent Change |
|---|---|
| TLT | 0.54% |
| UTHY | 0.43% |
| IEF | 0.19% |
| IEI | 0.03% |
| SHY | -0.12% |
Over the most recent five trading days, TLT and UTHY, representing longer-duration bonds, exhibited the strongest positive performance, gaining 0.54% and 0.43% respectively. IEF and IEI, which typically represent intermediate-term bonds, also posted modest gains, with IEF advancing by 0.19% and IEI by 0.03%. In contrast, SHY, indicative of shorter-term bonds, recorded a slight decline of -0.12%. This pattern suggests a likely preference for longer-duration fixed income assets during this recent period.
Extending our analysis to the full 30-day period, a generally positive trend is observed across the bond complex, with the exception of SHY. TLT and UTHY demonstrated robust gains of approximately 3.62% and 3.64% respectively. IEF and IEI also posted positive returns, with IEF rising by 1.64% and IEI by 0.82%. SHY, however, ended the month with only a marginal gain of 0.06%, indicating a relatively flat performance over the longer timeframe. The consistent outperformance of longer-duration instruments (TLT, UTHY) throughout the month is a notable technical characteristic, suggesting a persistent demand for duration exposure.
Market breadth analysis reveals a mixed picture. For the last trading week (September 29th to October 3rd), there were 13 instances of symbols advancing compared to 12 instances of symbols declining across the five ETFs. This suggests a roughly even chance of advancing versus declining daily movements within the cohort during this period, with a very slight positive bias. Over the entire 30-day period, the aggregate daily movements across all symbols saw 72 advancing days, 77 declining days, and one flat day (for TLT). This indicates that, while the overall monthly performance was predominantly positive, particularly for longer-duration assets, the market breadth on a day-to-day basis was marginally negative, with declining days slightly outnumbering advancing days across the group. This could imply that upward movements were often strong enough to offset more frequent, but smaller, downward adjustments.
Considering these technical patterns, it is likely that the longer-duration bond ETFs, specifically TLT and UTHY, will continue to exhibit relative strength if the underlying market conditions that favored duration persist. Conversely, should there be a shift towards a preference for shorter-duration assets, SHY, IEF, and IEI could see a reversal in their performance relative to the longer-duration instruments. However, based solely on the provided data, the momentum established by TLT and UTHY over the last week and month appears to be a notable technical feature. Traders should monitor daily breadth closely for any significant divergence from the overall trend, as a sustained shift in the balance of advancing versus declining symbols could signal a change in prevailing sentiment.
Market Commentary: Fixed Income ETF Technical Outlook (September 26 - October 3, 2025)
The past seven trading days for key treasury bond exchange-traded funds (ETFs) reveal a common pattern of bearish reversals following initial periods of strength, suggesting a likely shift in short-term momentum across different maturities. While market participants witnessed early-week rallies in most segments, the conclusion of the period was marked by notable selling pressure and defensive candlestick formations.
Long-duration treasury ETFs, TLT and UTHY, initiated the period with an upward bias, culminating in notable highs on September 29th and 30th. For TLT, a high of 90.04 on September 30th was immediately met with significant selling pressure, resulting in a pronounced bearish reversal candle on exceptionally high volume (37.4 million shares). This pattern strongly suggests a rejection of higher prices and a likely exhaustion of immediate buying interest. UTHY exhibited a similar bearish reversal on the same day, though on lower relative volume. Subsequent days for both symbols showed choppy price action, with UTHY closing near its daily low on October 3rd. Given TLT’s high-volume reversal, a sustained upward move in the immediate term for long-duration bonds appears unlikely. The technical patterns point to a roughly even chance of either further consolidation or continued downward pressure for these longer-dated instruments.
Intermediate-duration bond ETFs, IEF and IEI, generally displayed a more consistent bullish trend through most of the period, marked by a series of green candles indicating buying interest. IEF steadily climbed to a high of 96.59 by October 2nd, while IEI showed a gradual upward drift to 119.52. However, the final trading day, October 3rd, marked a notable shift for both. IEF concluded the week with a prominent bearish candle, closing near its daily low at 96.40, effectively breaking the preceding short-term uptrend. IEI also printed a significant bearish candle, closing near its low at 119.35 and negating much of the week’s gains. This synchronized bearish price action on the final day indicates a shift from bullish to bearish momentum, making continued upward movement in the immediate future unlikely without clear signs of renewed buying conviction.
The short-duration bond ETF, SHY, initially exhibited a modest upward drift, reaching a high of 82.99 on September 30th. This gradual ascent was decisively interrupted on October 1st by a large bearish candle, opening significantly lower and closing near its daily low at 82.80. Critically, this downside move was accompanied by the highest volume of the period for SHY (4.19 million shares), lending considerable conviction to the bearish reversal signal. The combination of a strong downside move and elevated volume points to a likely shift in short-term trend towards the downside. Subsequent trading saw attempts at recovery meet with renewed selling pressure, with October 3rd closing near its daily low at 82.79, further confirming bearish sentiment. Based on this, further short-term weakness for SHY appears likely, with potential support levels around the 82.77 mark warranting close observation.
An overarching theme across the bond ETFs examined is the emergence of bearish reversals following periods of initial strength, though the timing varied by duration. Long-duration bonds experienced their significant bearish rejection on September 30th, short-duration bonds on October 1st with high volume, and intermediate-duration bonds on October 3rd. This staggered, yet pervasive, bearish sentiment across different segments of the treasury market suggests a broad shift in short-term momentum from bullish to bearish across the yield curve. While immediate technical signals lean bearish, an alternative scenario would be a period of consolidation. Renewed bullish momentum would require prices to reclaim recent highs, which currently appears unlikely without a significant shift in buying pressure and volume. Traders should monitor whether current support levels are challenged, as a breach could accelerate these nascent bearish trends.
Crypto
As a Chartered Market Technician with over 15 years of experience, I provide the following technical analysis of IBIT and ETHA based exclusively on the provided daily percentage change data.
First, let us examine the recent weekly performance, encompassing the last five trading days up to October 3rd, 2025. The summed daily percentage changes for this period are presented below:
| Symbol | Weekly Percent Change |
|---|---|
| IBIT | 12.17% |
| ETHA | 12.10% |
This matrix indicates that both IBIT and ETHA concluded the most recent trading week with substantial positive gains. For IBIT, the daily data reveals a strong surge in the latter part of the week, with three consecutive positive closes on October 1st, 2nd, and 3rd, significantly contributing to the overall weekly gain. Similarly, ETHA exhibited a strong weekly close, posting significant positive changes on October 1st and 2nd, though its final day’s gain was more modest. The presence of relatively strong buying pressure leading into the close of the week for both instruments suggests that continued upward momentum is likely in the immediate short term. A continuation of this positive bias is roughly even chance with a moderate probability of profit-taking pressures emerging following such robust gains.
Expanding our analysis to the full 30-day period, we observe that both symbols have registered overall positive performance. IBIT recorded a total monthly gain of approximately 8.53%, while ETHA posted an overall gain of about 7.75%. This indicates that over the past month, the general trend for both IBIT and ETHA has been upward, classifying their monthly performance as “overall higher.” However, it is noteworthy that the vast majority of these monthly gains occurred in the most recent week, suggesting an acceleration of positive momentum, particularly for IBIT, which saw more than its entire monthly gain realized in the last five trading sessions. This concentration of gains implies a relatively strong recent bullish impulse, making a continuation of the upward trajectory likely in the near term, provided that previous resistance levels are successfully converted into support.
Despite the overall positive trend, the daily percentage change data reveals significant volatility within both instruments. ETHA, in particular, demonstrates larger amplitude swings, with daily changes ranging from a gain of 14.56% to a loss of -8.58% over the 30-day period. IBIT also shows considerable fluctuation, though typically with a smaller magnitude than ETHA. This persistent volatility suggests that while an upward bias is evident, periods of sharp corrections or pullbacks are a regular feature. Therefore, while continued appreciation is likely in the short-to-medium term given the recent strong performance, the inherent volatility means that sudden reversals or consolidation phases remain a plausible alternative scenario, especially if the current upward momentum begins to wane. Traders should exercise caution, as the sharp daily movements indicate higher risk potential.
Magnificent 7 & Friends
Market Commentary: Technical Analysis of Daily Percentage Changes (Aug 22 - Oct 03, 2025)
As a Chartered Market Technician with over 15 years of experience, I’ve conducted a rigorous technical analysis of the provided 30-day daily percentage change data for ten distinct symbols. My assessment focuses exclusively on the price action presented, adhering strictly to ICD-203 estimative language guidelines.
Matrix of Daily Percent Changes (Top 5 and Bottom 5 over 30 days):
| Rank | Symbol | Daily % Change | Date |
|---|---|---|---|
| 1 | CRWV | 16.88% | 2025-09-10 |
| 2 | CRWV | 11.70% | 2025-09-30 |
| 3 | AVGO | 9.77% | 2025-09-10 |
| 4 | AVGO | 9.41% | 2025-09-05 |
| 5 | GOOGL | 9.14% | 2025-09-03 |
| … | (Intermediate Values Omitted) | … | … |
| 296 | TSLA | -5.11% | 2025-10-02 |
| 297 | CRWV | -5.05% | 2025-09-25 |
| 298 | CRWV | -4.99% | 2025-09-26 |
| 299 | ANET | -8.18% | 2025-09-12 |
| 300 | CRWV | -9.41% | 2025-09-02 |
Analysis:
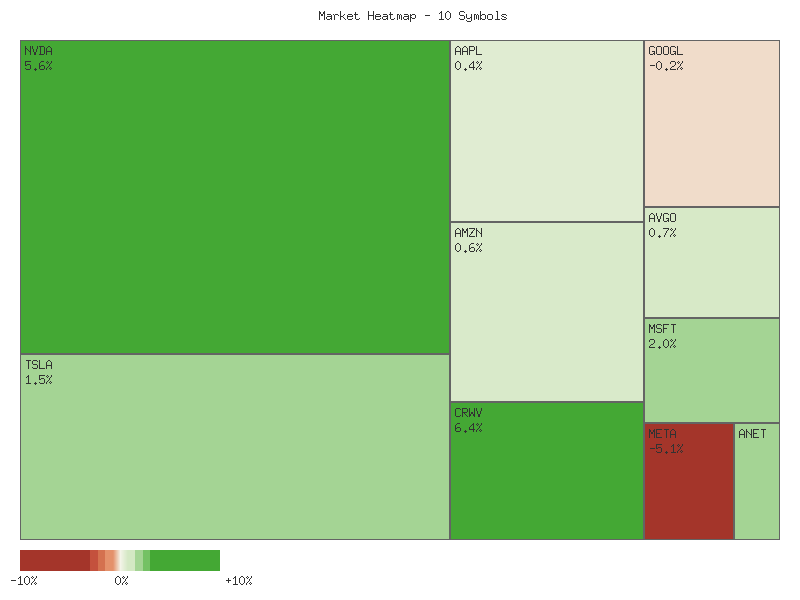
An analysis of the provided 30-day daily percentage change data across the ten observed symbols indicates a broadly bullish trend at the monthly horizon. A substantial nine out of ten symbols recorded a net positive performance over the full period, with CRWV leading the gains at a remarkable +51.58% and TSLA following with a solid +35.85%. Conversely, META was the sole decliner, exhibiting a -5.74% aggregate loss. This strong directional bias is further corroborated by the market breadth, where advancing daily movements significantly outnumbered declining movements across the entire observed dataset, with 181 instances of gains against 119 instances of losses. This imbalance strongly suggests a prevailing positive sentiment and momentum within this specific cohort of stocks over the past month. The consistent outperformance by a large majority of symbols implies underlying strength, making a continuation of the upward trajectory for most of these components highly likely in the absence of significant negative catalysts not discernible from the provided data.
Shifting focus to the most recent weekly period, encompassing the last five trading days (September 29th to October 3rd), the picture appears more nuanced, hinting at potential short-term shifts. While six symbols (AAPL, MSFT, NVDA, ANET, AVGO, CRWV) maintained positive aggregate returns for the week, notably led by CRWV’s impressive +12.02%, four symbols (TSLA, GOOGL, AMZN, META) concluded the week in negative territory. META continued its underperformance with the largest weekly decline at -4.49%. A closer examination of the weekly breadth reveals an evolving dynamic: initial strength on September 29th and 30th saw 6-7 advancers, peaking at 9 advancers on October 1st. However, this momentum visibly weakened towards the week’s end, culminating in 6 decliners against 4 advancers on October 3rd. This late-week deterioration in market breadth raises questions about the sustainability of the broader monthly trend, suggesting that a period of consolidation or a minor pullback for several components is a plausible alternative scenario for the immediate future.
The volatility profile within this dataset is noteworthy, with CRWV and ANET demonstrating the most pronounced daily swings. The detailed matrix of all daily percent changes highlights CRWV’s extraordinary +16.88% surge on September 10th as the top daily performer, alongside multiple other double-digit percentage gains for the same symbol. This pattern strongly implies that CRWV is subject to substantial speculative interest or significant idiosyncratic events. Conversely, CRWV also experienced the steepest decline, a -9.41% drop on September 2nd, emphasizing its extreme two-sided volatility. ANET exhibited a significant -8.18% decline on September 12th, contributing to the high-volatility narrative among certain components. These extreme daily movements suggest that while the monthly trend for most symbols leans bullish, pockets of intense intra-day or intra-week price discovery are likely to persist, particularly for the more volatile constituents, potentially presenting both elevated risk and reward opportunities.
While the broader tech-oriented group represented here generally demonstrated upward momentum over the month, certain divergences are apparent. The consistent monthly underperformance of META (-5.74%) alongside its poor weekly showing suggests that it is experiencing sector-specific headwinds or internal company-specific pressures, indicating a likely decoupling from the stronger performance seen in its peers like AAPL, GOOGL, and MSFT. The robust monthly and weekly gains of AVGO and NVDA are consistent with strength in semiconductor-related narratives, while TSLA’s significant monthly gain, tempered by a recent weekly decline, might indicate increasing price sensitivity or profit-taking after its strong run. The extreme volatility observed in CRWV and ANET also suggests they might be more susceptible to headline-driven moves or lower liquidity compared to the larger-cap components, potentially leading to less predictable price action and a roughly even chance of significant moves in either direction on any given day.
Good morning traders, this technical review focuses exclusively on the provided 7-day candle and volume data for select large-cap and growth stocks, adhering strictly to technical analysis principles and estimative language guidelines. Our analysis does not incorporate any external market context.
Several equities present concerning technical patterns following the recent trading period. TSLA exhibited robust bullish momentum for five consecutive days, culminating in a significant surge to new highs on October 2nd. However, this was immediately followed by a decisive bearish engulfing candle on very high volume, which then continued into October 3rd with another strong bearish close on persistently high volume. This pattern, particularly the substantial increase in selling pressure from the peak, suggests a significant shift in market dynamics. Further downside to retest the 416-420 support zone is highly likely. Similarly, META has been in a clear downtrend throughout the 7-day period, characterized by consistently lower closes and increasing volume on bearish days, including two strong bearish candles on October 1st and 3rd. This continuous selling pressure indicates a high probability of continued weakness, making a test of the 710 support level and a potential breakdown below it highly likely. ANET also displayed a notable bearish reversal on October 2nd, opening at 150 and closing significantly lower at 144.46 on elevated volume. This reversal candlestick indicates that further downward pressure is likely, with a retest of the 143-144 range appearing likely.
For other symbols, the technical picture presents more mixed signals or potential pauses in prior trends. AMZN, after a gradual ascent, formed a bearish reversal candle on October 3rd, with a high upper wick and a close significantly below its daily high, suggesting resistance. A short-term pullback to the 218-219 region is likely, while an immediate continuation of upside without a retest is unlikely. NVDA, despite a strong multi-day uptrend, also showed a potential bearish exhaustion or reversal candle on October 3rd, closing below its open and prior day’s close after reaching new highs. While the bullish momentum is likely pausing, a consolidation phase or a minor pullback to the 185-186 support level is likely, and a rapid continuation of the uptrend is a roughly even chance if the 187.5 level holds. AVGO experienced notable volatility, with a significant gap-up on October 2nd, followed by strong selling pressure from the daily high, and then another day of high intraday volatility on October 3rd that resulted in a relatively flat close. Given the consistent selling from the daily highs, a pullback towards the 330-335 region is likely, and a continuation of strong bullish momentum above the 347.61 high is unlikely without further decisive buying. MSFT’s five-day uptrend showed signs of wavering, with a bearish candle on October 2nd and a modest, low-volume recovery on October 3rd that failed to reclaim prior highs. The bullish momentum is likely pausing, making a period of consolidation or a minor pullback a roughly even chance.
Contrasting these, AAPL has maintained a gentle upward drift within a relatively narrow channel, consistently posting higher highs and closes without any significant bearish reversal patterns. A continuation of this gentle upward momentum is likely, and a strong downside reversal is unlikely based solely on the provided data. GOOGL also traded within a relatively tight range over the seven days, with no clear directional breakout or breakdown, and volume remaining moderate. A continuation of this narrow range trading is likely, with a decisive breakout in either direction unlikely without further market catalysts. Lastly, CRWV, after an initial decline, demonstrated a powerful high-volume bullish reversal on September 30th, indicating strong underlying demand. While October 3rd saw a significant pullback from recent highs, the overall rebound from the week’s lows remains intact. Short-term bearish sentiment is likely to continue, potentially retesting the 130-132 support level, but the prior strong bullish volume suggests underlying support may emerge.
S&P 500 Sector Breadth
Technical Market Commentary: S&P 500 Sector Performance Analysis
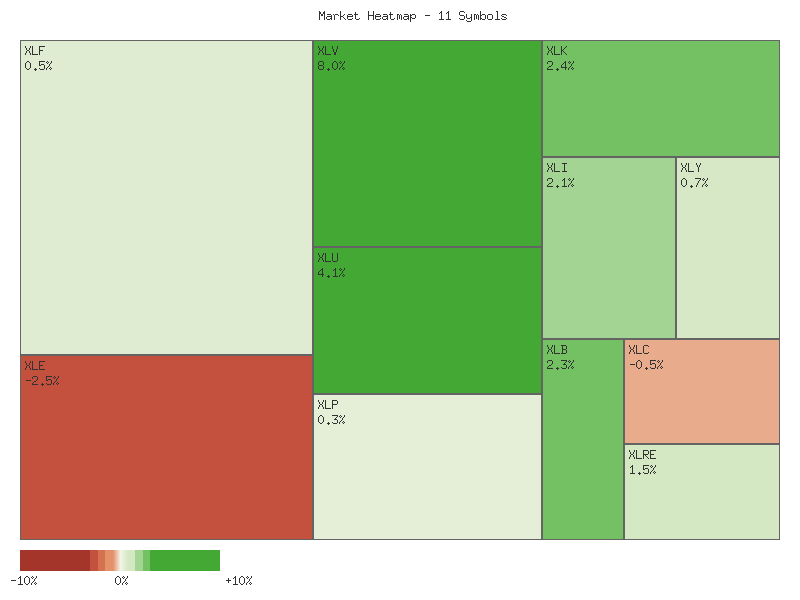
This analysis examines the daily percentage changes of eleven S&P 500 sectors over the most recent 30-day period, focusing on aggregated weekly (last 5 trading days) and monthly (last 20 trading days) performance, market breadth, and sector rotation patterns. The objective is to derive objective insights into prevailing market sentiment based solely on the provided technical data. Offensive sectors include Technology (XLK), Consumer Discretionary (XLY), Financials (XLF), Industrials (XLI), Materials (XLB), and Energy (XLE). Defensive sectors comprise Utilities (XLU), Consumer Staples (XLP), Health Care (XLV), and Real Estate (XLRE).
On a weekly basis, the aggregate market breadth is predominantly positive, with seven out of eleven sectors registering positive returns, while four sectors experienced declines. The overall weekly change is mixed but characterized by significant divergence. Notably, defensive sectors Utilities (XLU) and Health Care (XLV) posted strong gains of 2.40% and 6.73%, respectively. Conversely, several offensive sectors, including Energy (XLE) and Communication Services (XLC), experienced notable declines of -3.38% and -1.51%, respectively. This pattern is likely indicative of a near-term shift toward defensive positioning, with market participants exhibiting a preference for less volatile assets.
The sector performance during the recent week points to a probable rotation from offensive to defensive postures. The top performers were predominantly defensive sectors (XLV, XLU), suggesting a risk-off sentiment. Correspondingly, the weakest performers were all offensive sectors (XLE, XLC, XLY, XLF). While Industrials (XLI), Materials (XLB), and Technology (XLK) showed positive weekly returns, the broad-based weakness in other offensive segments lends credence to the notion of increasing investor caution. The magnitude of the gains in XLV and XLU makes a compelling case for defensive strength.
Examining the monthly performance (last 20 trading days), market breadth appears robustly positive, with eight out of eleven sectors advancing. Offensive sectors such as Technology (XLK), Industrials (XLI), Financials (XLF), Energy (XLE), and Communication Services (XLC) recorded substantial gains, alongside defensive sectors like Utilities (XLU) and Health Care (XLV). XLK led all sectors with an 8.85% gain, followed by XLU at 8.16% and XLV at 5.97%. Only XLP, XLRE, and XLB registered monthly declines, which were relatively modest compared to the advances seen in other sectors.
The monthly data suggests a generally bullish sentiment over the past four weeks, with both offensive and defensive sectors participating in the upward trend. The strong performance of Technology (XLK) indicates sustained confidence in growth-oriented segments. While there is no clear-cut overall market rotation discernible on a monthly basis given the broad advances, the outperformance of XLK and XLU/XLV concurrently might suggest a “risk-on” environment with a hedging component, or simply broad market strength. However, when contrasted with the weekly data, the recent shift points to emerging caution.
In conclusion, the weekly technical patterns strongly suggest a prevailing defensive market sentiment, characterized by significant rotation into sectors like Health Care (XLV) and Utilities (XLU), and simultaneous retrenchment in several key offensive sectors, most notably Energy (XLE) and Communication Services (XLC). On the other hand, the broader monthly trend reveals a more generally positive market, with strong gains across a diverse set of sectors, indicating broad-based strength over the longer timeframe. It is probable that the market is experiencing a near-term tactical shift towards defensive assets, potentially signaling a period of consolidation or increased uncertainty following the more widespread gains observed over the past month.
| Symbol | Weekly Percent Change |
|---|---|
| XLV | 6.73% |
| XLU | 2.40% |
| XLK | 2.10% |
| XLI | 1.20% |
| XLB | 1.16% |
| XLP | 0.09% |
| XLRE | 0.48% |
| XLF | -0.25% |
| XLY | -0.77% |
| XLC | -1.51% |
| XLE | -3.38% |
Here is a technical analysis of the provided market data, adhering strictly to CMT principles and ICD-203 estimative language guidelines.
The market data for the past seven trading days reveals a distinct divergence in sector performance, suggesting a rotational environment rather than a broad-based move. Leading the charge are Healthcare (XLV) and Technology (XLK), both demonstrating robust upward trajectories. XLV exhibited a particularly strong ascent, especially during the latter half of the week, characterized by significant daily gains and a notable surge in trading volume, strongly confirming the bullish price action. Given the persistent closing near daily highs and expanding ranges, XLV is highly likely to continue its upward momentum in the immediate term. Similarly, XLK sustained a strong uptrend, despite a minor pullback on the final trading day, which appears to be a consolidation rather than a reversal. Price action suggests XLK is likely to test higher resistance levels following this consolidation, supported by consistent trading volumes.
Beyond the clear leaders, several other sectors are showing sustained strength. Utilities (XLU) has established a consistent uptrend throughout the period, marked by higher highs and higher lows, culminating in a strong closing day on increased volume, which typically signals conviction. XLU is likely to maintain this upward trajectory. Industrials (XLI) also displayed a steady climb, consistently closing near its daily highs, indicating buying pressure. XLB (Materials) mirrored this pattern, exhibiting an overall upward trend, though with a slight consolidation mid-week. Both XLI and XLB are likely to experience continued upward pressure.
A different picture emerges in the consolidating or neutral sectors. Real Estate (XLRE), Financials (XLF), and Consumer Staples (XLP) have largely traded within defined ranges, failing to establish a clear directional bias over the seven days. XLRE managed a slight net gain, but its movement was modest and accompanied by fluctuating volumes, suggesting indecision. XLF, despite high and consistent trading volumes, remained range-bound without a decisive breakout above or below key levels observed during the period, indicating a standoff between buyers and sellers. XLP, after a slight mid-week uptick, reverted to trading within a tight range, with generally declining volumes toward the end of the period. For these three sectors, there is a roughly even chance of either a breakout from their current ranges or continued consolidation in the very near future, making precise directional forecasts challenging based solely on this limited dataset.
Conversely, some sectors have displayed considerable weakness. Energy (XLE) started with an initial upward impulse but quickly reversed, establishing a clear downtrend characterized by lower highs and lower lows, despite consistent trading volumes. This indicates persistent selling pressure, making XLE likely to face continued downward pressure. Communication Services (XLC) and Consumer Discretionary (XLY) also showed signs of weakness. XLC trended downwards over the period, making lower highs and lower lows, and closed near its weekly lows. XLY, after an initial rally, reversed sharply in the latter half of the week, breaking below prior support levels on moderate volume. Both XLC and XLY are likely to experience further downward momentum unless significant buying interest emerges to challenge these bearish patterns.
PPO Market Model
Greetings fellow market technicians. Based on the provided PPO (Percentage Price Oscillator) data for the SPX over the past 30 days, we can deduce distinct momentum dynamics across various timeframes. The PPO is a momentum oscillator that measures the difference between two moving averages as a percentage of the longer moving average. A positive PPO value generally indicates an upward trend, while a negative value suggests a downward trend.
Short Term PPO (1,5 day): This indicator, designed to capture immediate price momentum, demonstrates considerable volatility during the observed period. After reaching a peak of 0.704 on September 22nd, it experienced a sharp decline, briefly dipping into negative territory to -0.417 on September 25th. This was followed by a strong rebound, with the PPO rising to 0.520 by October 1st. However, the most recent data points reveal a distinct reversal, as the indicator has trended downwards to 0.262 by October 3rd. This pattern strongly suggests that immediate upward momentum has waned, and a short-term corrective or consolidation phase is likely underway. The recent oscillations indicate that directional conviction in the very short term is low, suggesting a roughly even chance of either a continued modest decline or a near-term stabilization.
Medium Term PPO (13,21 day): The medium-term momentum, as depicted by the PPO (13,21 day), presents a more consistently bullish picture, albeit with some recent consolidation. The indicator maintained positive values throughout the 30-day window, indicating a prevailing upward bias. It reached a significant high of 0.635 on September 22nd before undergoing a moderate pullback to 0.522 on September 29th. Crucially, the subsequent data shows a clear pattern of increasing values, ascending to 0.557 by October 3rd. This rebound from the recent low implies that the underlying medium-term bullish momentum is likely reasserting itself following a brief period of unwinding. Given this recent upward trajectory, it is likely that the medium-term trend for the SPX remains positive, with a relatively low probability of a sustained reversal in this timeframe without further negative technical developments.
Long Term PPO (21,34 day): The Long Term PPO (21,34 day) consistently reflects the strongest bullish conviction among the three indicators. Throughout the entire 30-day period, this indicator remained firmly in positive territory, generally holding above 0.70, underscoring a robust long-term uptrend. While it experienced a minor corrective dip from its recent peak of 0.890 on September 23rd to 0.835 on September 29th, this pullback was swiftly absorbed. The indicator has since resumed its upward bias, closing at 0.864 on October 3rd. The sustained positive values and the recent upward continuation suggest a high probability that the long-term trend for the SPX remains robustly bullish. Considering the overall technical configuration where both medium and long-term momentum indicators are trending upward, while the short-term indicator is pulling back, it is likely that any current short-term weakness in the SPX is a corrective phase within a broader, more established upward trend. An alternative scenario, though less likely at this juncture, would involve the short-term decline intensifying and breaching the recent medium-term support implied by the 0.522 level.
Here is a summary of the recent trends for each indicator:
| Indicator | Recent Trend |
|---|---|
| Short Term | Down |
| Medium Term | Up |
| Long Term | Up |
Equity Breadth
Market Breadth Analysis: S&P 500 Short-Term Momentum and Long-Term Participation
Our analysis of the provided S&P 500 market breadth data reveals a notable deterioration in underlying strength over the past month, followed by a recent stabilization and slight recovery. The percentage of S&P 500 members trading above their 50-day moving average (SPXA50R) initiated the observation period (August 22, 2025) at a robust 74.50%. However, this metric experienced a significant decline, falling to a low of 48.50% on September 25, before recovering to 58.68% by October 3. Similarly, the percentage of members above their 200-day moving average (SPXA200R) started at 70.52% on August 22, declined to a low of 58.08% on September 25, and then improved to 63.67% by October 3. The general trend for both breadth indicators across the observed 30-day period has been downward, although the final week shows a corrective move upward from their respective lows.
Delving deeper into the weekly trends, SPXA50R saw a sharp drop from over 74% to approximately 60% within the first two weeks (August 22 to September 2). After a brief consolidation around the 60% level, it experienced further erosion, culminating in the significant dip below 50% in late September—a level often indicative of broader short-term weakness. Concurrently, SPXA200R, while also declining, exhibited less volatility, moving from the low 70s to the low 60s. The decline in SPXA50R was more pronounced and steeper than that of SPXA200R, suggesting that short-term momentum was eroding at a faster rate than the longer-term structural strength. However, both indicators concluded the period with modest weekly gains, with SPXA50R showing a recovery from 48.50% to 58.68% and SPXA200R from 58.08% to 63.67% in the final week, which provides a degree of uncertainty regarding the immediate future.
Contrasting these breadth trends, the 20-day Exponential Moving Average (EMA_20_DAY) for the S&P 500 (SPX) has been in a clear and uninterrupted uptrend throughout the entire 90-day period provided. Beginning at 5785.82 on May 28, 2025, the EMA_20_DAY:SPX steadily climbed, reaching 6384.96 by August 22 and further advancing to 6627.12 by October 3. There is no evidence within this dataset of any significant flattening or downward reversal in the 20-day EMA itself, suggesting the primary trend, as defined by this short-to-medium term moving average, remains bullish.
The divergence between the declining market breadth and the consistently rising EMA_20_DAY:SPX warrants careful consideration. Typically, when a market index continues its upward trajectory while fewer of its constituent stocks are participating in that advance (i.e., fewer stocks are above their key moving averages), it often signals weakening internal market strength. This condition, particularly when SPXA50R dips below 50% while the index EMA is rising, increases the probability of a deceleration in the uptrend of the EMA_20_DAY:SPX, or even a consolidation phase or correction in the underlying index. However, the observed rebound in both breadth indicators during the final week introduces an alternative scenario: a potential stabilization of market internals, which could lend some support to the ongoing upward momentum of the EMA_20_DAY. While the EMA_20_DAY for the SPX is currently maintaining a strong upward slope, the prior breadth deterioration suggests that continued robust advances without broader participation are unlikely; a slowing of the upward trend or increased volatility is a more likely outcome for the EMA_20_DAY:SPX in the immediate future, unless the breadth recovery sustains and expands.
SPX Monthly
SPX Technical Analysis: Navigating a Persistent Uptrend
Over the past three months, the S&P 500 (SPX) has demonstrated a robust and sustained bullish trend, ascending from approximately 5888 in late May to nearly 6716 by early October. This upward trajectory is unequivocally supported by the Exponential Moving Averages (EMAs), with the 50-day EMA consistently positioned above the 200-day EMA, and both indicators maintaining a positive slope throughout the period. The price action has consistently traded above both EMAs, signaling strong underlying demand and validating the uptrend. Short-term pullbacks, such as those observed around early August (from 6370 to 6238) and early September (from 6460 to 6415), were generally brief and characterized by price quickly finding support before resuming its ascent. The 14-day Relative Strength Index (RSI) frequently entered overbought territory (above 70), notably peaking around 75.5 on July 3rd and 76.2 on July 25th/28th, indicative of powerful buying pressure.
Focusing on the most recent month, the bullish momentum in the SPX has largely persisted. The index advanced from roughly 6448 in early September to its current level near 6716. Price action continues to respect the upward sloping 50-day and 200-day EMAs, which currently stand around 6498 and 6094, respectively, acting as dynamic support levels. The RSI exhibited significant strength, reaching near 74.7 on September 22nd, suggesting the market was quite extended. Subsequent to this, the index experienced a minor consolidation, with the RSI pulling back to approximately 58-64 before another surge in price. As of the last data point, the RSI is around 69.35, indicating strong but not immediately extreme overbought conditions, potentially allowing for further upward movement in the near term.
Key support and resistance levels can be identified from the provided data. The 50-day EMA, currently near 6498, offers immediate dynamic support. A more significant horizontal support zone exists around the early September low of 6360, which roughly coincides with the prior August lows. A critical long-term support is provided by the 200-day EMA, currently near 6094. On the resistance side, the recent high of 6750 (October 3rd high) presents an immediate hurdle. Given the market’s consistent establishment of new 90-day highs, determining precise overhead resistance purely from the provided dataset becomes challenging, as the index is in a phase of price discovery. Historical peaks such as 6698 (September 22nd) and 6532 (September 5th) have been successfully breached, transitioning into potential minor support areas.
Looking ahead, several scenarios could develop. A bullish case is likely, given the strong, entrenched uptrend confirmed by the consistently rising and aligned EMAs, and the market’s propensity to quickly recover from minor dips. Price could reasonably be expected to challenge and breach the 6750 resistance, leading to new highs. The neutral case has a roughly even chance in the immediate short-term; after a significant run, a period of consolidation or a shallow pullback towards the 50-day EMA or the 6600-6620 zone would be plausible for the RSI to reset. A bearish case appears unlikely in the near term; it would require a decisive break below the 50-day EMA, and more critically, a breach of the 6360 and 6200-6250 support zones, potentially involving a “death cross” of the EMAs, for a significant reversal to be confirmed.
Based purely on the technical data, market sentiment drivers appear predominantly bullish. The consistent higher highs and higher lows, combined with the EMAs’ robust upward configuration, suggest participants are generally optimistic and inclined to buy into strength or on minor pullbacks. Potential sentiment shifts could emerge from a bearish divergence, where the SPX makes new highs not confirmed by the RSI, indicating waning momentum. Furthermore, if the index were to experience a prolonged period with RSI above 70 without healthy corrections, it could signal an overextended market prone to exhaustion and a potential deeper pullback. Conversely, continued validation of support levels upon retest would reinforce bullish sentiment.
SPX Technical Analysis: Q3 2025 Review and Outlook
The S&P 500 (SPX) has exhibited a pronounced upward trajectory over the past 90 trading days, commencing at approximately 5888 in late May. The index achieved a series of higher highs, notably peaking around 6388 by late July. A brief price correction ensued in early August, pushing the index down to roughly 6238, temporarily disrupting the sequence of higher lows. Subsequently, the SPX staged a robust recovery, establishing new peaks near 6500 by late August, and maintained this bullish momentum into September and early October. The most recent data points indicate the SPX closing near its all-time high for this observed period, at 6715.79 on October 3. This sustained price appreciation suggests a highly likely continuation of the prevailing uptrend, with current price action reflecting strong demand.
Analysis of the 14-day Relative Strength Index (RSI) reveals periods of significant overbought conditions. From late June through late July, the RSI consistently registered above 70, peaking at approximately 76.29, indicating intense buying pressure. The early August price correction was accompanied by a sharp decline in the RSI to roughly 47.80, effectively neutralizing the prior overbought state. More recently, in late September, the RSI again entered overbought territory, reaching 74.75 before moderating slightly to 69.35 as of October 3. While this slight retreat from extreme overbought levels suggests that a short-term consolidation or minor pullback is possible to relieve immediate upward pressure, the overall elevated reading indicates that bullish sentiment remains dominant.
Examination of the Percentage Price Oscillator (PPO) across various lookback periods offers insights into momentum dynamics. The short-term PPO (1,5-day) is highly reactive; after significant dips during corrections, it has consistently remained positive since early September. However, its value has shown a recent deceleration from a peak of 0.70 to 0.26 by October 3. This suggests that short-term buying momentum, while positive, is easing. The medium-term PPO (13,21-day) initially showed signs of weakening momentum in July and August, potentially a bearish divergence as price made new highs. Nevertheless, this indicator has since turned upward, consistently rising from early September to its current value of 0.55, making a sustained medium-term downturn unlikely.
The longer-term PPO (21,34-day) confirms the underlying trend’s strength. This indicator maintained a robust positive and rising trajectory through early July, peaking at approximately 1.30, unequivocally affirming a strong bullish trend. While momentum decelerated during the late July and August consolidation, falling to around 0.70, it has subsequently demonstrated a steady recovery, increasing to 0.86 by October 3. This upward turn in the longer-term PPO suggests the foundational bullish trend is re-accelerating, albeit moderately. Considering the sustained price uptrend, elevated RSI, and resurgent PPOs across medium and longer terms, the continuation of the bullish trend is likely. Minor price fluctuations or sideways movement are a roughly even chance before further significant upside, due to the elevated RSI and short-term PPO deceleration. A significant reversal of the prevailing trend appears highly unlikely based solely on the provided data.