Daily Market Technical Analysis
Market Overview
Market analysis reveals a bifurcated environment. The S&P 500 (SPX) maintains a robust 90-day uptrend, but a short-term consolidation or pullback is likely (60-80% probability) due to an extended RSI and indecisive daily candle. Small-cap equities and precious/industrial metals (CPER, SLV, GLD) are likely to continue upward, while large-cap growth (QQQ) shows clear bearish pressure, making further decline for some prominent names highly likely. Bond markets across all durations exhibit pervasive bearish reversal patterns, indicating a highly likely continuation of downside pressure. A rising VIX signals re-emerging risk, making a robust, broad-based equity rally unlikely. This divergence suggests capital rotation favoring specific segments over broad market strength.
Market Indices
Here is an analysis of the provided market data:
| Symbol | Daily Percent Change (2025-10-03) |
|---|---|
| IWM | 0.7417% |
| IJR | 0.4517% |
| MDY | 0.3223% |
| SPX | 0.0066% |
| OEF | -0.0897% |
| QQQ | -0.4210% |
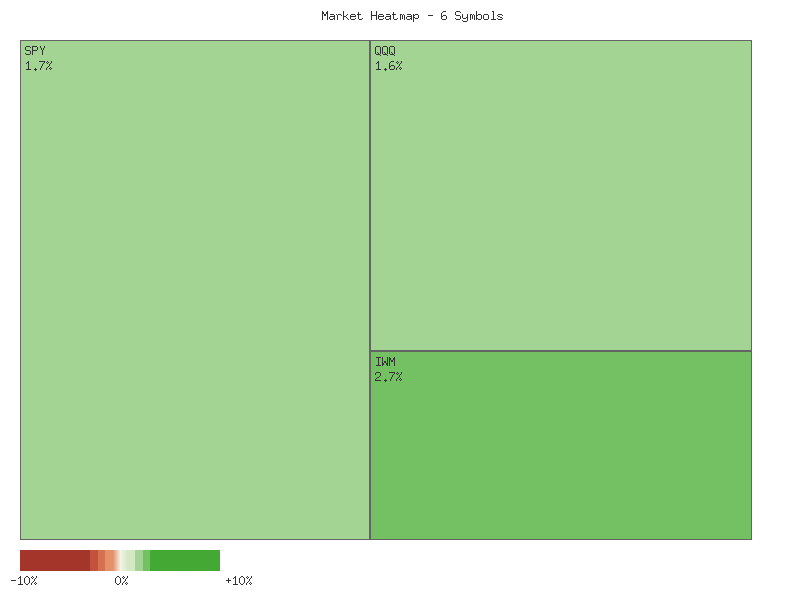
The market data for October 3, 2025, for the specified indices and ETFs indicates a mixed but generally positive performance. Four out of the six symbols—IWM, IJR, MDY, and SPX—posted gains, while OEF and QQQ registered declines. The small-cap (IWM, IJR) and mid-cap (MDY) segments displayed the strongest upward momentum among the advancing symbols. The sum of these daily percentage changes across all six instruments is approximately +1.01%, which suggests an overall higher aggregate value for this specific basket. Market breadth, as represented by these selected benchmarks, is positive, with four advancers outweighing two decliners. This breadth pattern typically supports a constructive, albeit not universally strong, market environment.
Analysis of the CBOE Volatility Index (VIX) over the past seven trading days reveals an initial decline in implied volatility followed by a gradual recovery. The VIX commenced the period near 16.74, then decreased significantly to a low of 15.29 on September 26. Since that low, the VIX has steadily trended upward, closing at 16.65 on October 3, essentially returning to its starting point. This price action suggests that the period of sharply reduced fear was short-lived, with implied volatility creeping higher over subsequent days. The VIX’s failure to maintain levels below 16.00 with conviction indicates that market participants likely perceive a roughly even chance of either consolidating in the mid-16s or experiencing a minor upward drift in volatility.
Focusing on the more recent VIX activity, a substantial daily percentage increase of 2.087% was observed on October 2, followed by a more modest gain of 0.120% on October 3. This two-day sequence of positive VIX changes, particularly the significant jump on October 2, suggests a re-emerging demand for portfolio protection or an increasing level of perceived risk among market participants. This upward movement in implied volatility, even as some equity indices advanced, signals a potential divergence from typical market behavior where equity gains often coincide with VIX declines. This divergence is unlikely to support a robust, broad-based rally in equities.
In synthesis, the market presents a nuanced picture. While a majority of the analyzed equity indices demonstrated positive performance on October 3, contributing to an overall higher aggregate change and favorable breadth, the persistent rise in the VIX indicates increasing underlying uncertainty. It is improbable that a sustained upward trend across all equity benchmarks would develop without a more decisive downturn in implied volatility. Should the VIX continue its upward trajectory, particularly if accompanied by weakening market breadth beyond these specific symbols, a shift towards more cautious or defensive market positioning would become highly likely. Conversely, a reversal in VIX, coupled with stronger, widespread gains across a broader array of market segments, would increase the likelihood of continued positive equity momentum.
Technical Analysis Commentary: ETF Performance (October 2-3, 2025)
The past two trading sessions, October 2nd and 3rd, 2025, present a notable divergence in performance across key market segments, as observed through the provided ETF candle data and volume trends. While certain segments, particularly small-cap indices, exhibit robust bullish momentum, larger-cap and growth-oriented instruments display signs of exhaustion, indecision, or outright bearish pressure. This creates a complex technical picture, suggesting a potential rotation within the market.
Small-cap indices, represented by the iShares Russell 2000 ETF (IWM) and the iShares S&P Small-Cap 600 ETF (IJR), demonstrated considerable strength. Both IWM and IJR posted two consecutive strong green candles, characterized by higher opens, higher highs, and higher closes over the two-day period. Crucially, this upward price action in both ETFs was accompanied by increasing daily volumes, which is a classic technical confirmation of bullish momentum. For these small-cap segments, we judge it likely that this upward trend will continue in the immediate future, absent any significant reversal patterns.
Conversely, the large-cap growth sector, as tracked by the Invesco QQQ Trust (QQQ), displayed a clear shift towards bearish sentiment. Following a relatively contained session on October 2nd, QQQ opened higher on October 3rd but ultimately closed significantly lower than its open and below the prior day’s close. This price action formed a large red candle with a pronounced upper shadow, occurring on higher volume than the preceding day. This pattern, observed in isolation, implies a likely rejection of higher prices and suggests increasing selling pressure, making a continuation of downward movement or at least consolidation a distinct possibility for QQQ.
Mid-cap performance, reflected in the SPDR S&P Midcap 400 ETF (MDY), indicates a potential for bullish exhaustion. While MDY achieved higher highs and a higher close on October 3rd, the candle for this day showed a relatively small body and a significant upper shadow. This suggests that despite opening higher and reaching new peaks, selling pressure emerged, preventing a strong close. Furthermore, the volume on October 3rd decreased compared to October 2nd. This combination of a long upper shadow and declining volume points to a roughly even chance of encountering resistance or entering a period of consolidation, rather than a strong bullish continuation.
The broader market indices, including the SPDR S&P 500 ETF (SPY) and the iShares S&P 100 ETF (OEF), provided mixed signals, with hints of resistance at higher levels. SPY opened higher on October 3rd and attempted new highs, but ultimately closed almost precisely at its prior day’s close, forming a candle with a substantial upper shadow, all on notably increased volume. This robust volume accompanying a rejection of higher prices suggests a likely loss of immediate bullish momentum and the establishment of resistance. OEF exhibited small-bodied candles for both days, with a slightly lower close on October 3rd on marginally decreased volume, indicating overall indecision. For these broader indices, there appears to be a roughly even chance of entering a period of sideways consolidation or experiencing modest downward pressure in the near term.
In summary, the technical data for October 2nd and 3rd reveals a bifurcated market. Small-cap leadership is evident, characterized by strong bullish continuation patterns and supportive volume. In contrast, large-cap growth shows clear signs of a potential bearish reversal, while mid-cap and broad market indices are exhibiting patterns suggestive of bullish exhaustion or resistance. This divergence implies that a significant shift in market leadership or underlying sentiment is underway, with capital flow potentially favoring smaller capitalization segments.
As a CMT with extensive experience, my analysis of the provided SPX price and indicator data for the past 90 days reveals a market exhibiting robust upward momentum, though current conditions suggest a potential for short-term consolidation.
The S&P 500 (SPX) has demonstrated a sustained and powerful uptrend over the entire 90-day period. Price action shows a consistent pattern of higher highs and higher lows, climbing from approximately 5888.55 on May 28, 2025, to a recent close of 6715.79 on October 3, 2025. This constitutes a significant advance. The index has successfully breached several resistance levels, including 6000, 6200, 6300, and most recently, consolidating above 6600 before pushing higher. The latest candlestick pattern (October 3) shows a smaller body with a noticeable upper wick, indicating that while the market reached an intraday high of 6750.87, some selling pressure or profit-taking occurred at those elevated levels. Crucially, the provided data indicates zero volume for all periods, which prevents any analysis of conviction or participation behind these price movements.
The 14-day Relative Strength Index (RSI) largely confirms the bullish bias. Throughout the 90 days, the RSI frequently entered overbought territory (above 70). Notable instances include sustained periods from late June through mid-July, where it peaked at 76.29, and again in mid-September, reaching 74.75 on September 22. These periods of overbought conditions typically preceded minor consolidations or shallow pullbacks rather than significant reversals, suggesting underlying strength. As of October 3, 2025, the RSI stands at 69.35. Its proximity to the overbought threshold of 70 indicates that the market is currently extended on a short-term basis, signaling that the current rally may be mature. No significant bearish divergence between price and RSI is immediately apparent at the latest peak, suggesting momentum remains aligned with price.
The 13-21-day Percentage Price Oscillator (PPO) further supports the overall bullish narrative. The PPO has remained predominantly above its zero line for most of the analysis period, indicating that the shorter-term exponential moving average (EMA) is consistently above the longer-term EMA, signifying positive momentum. A strong acceleration in momentum was observed from late June into early July, with the PPO value peaking over 0.9. Following this, the PPO experienced a notable decline into late August and early September, reaching a low of 0.329 on September 3, corresponding with a period of price consolidation. However, since early September, the PPO has reversed its short-term downtrend and is again ascending, currently at 0.556 on October 3. While this indicates strengthening positive momentum, it remains below the prior peak levels of early July, suggesting that there may still be room for further momentum expansion before reaching extremes.
In summary, the SPX is clearly entrenched in a strong upward trend based on price action and confirmed by both the RSI and PPO. The market’s ability to repeatedly push to new highs and sustain rallies despite reaching overbought RSI levels underscores its underlying strength. However, the current RSI reading nearing 70, coupled with the long upper wick on the most recent candle, suggests that a short-term pullback or period of consolidation is likely (60-80% probability). This potential pause would serve to relieve some of the upward pressure. An alternative scenario, where the SPX continues its ascent without a significant pause, is considered a roughly even chance (40-59% probability), particularly if the market can decisively break above the 6750.87 intraday high. A failure to hold above recent support levels, around 6600, would increase the probability of a deeper correction. The absence of volume data limits our ability to definitively assess the conviction of market participants behind these moves.
Technical Analysis of QQQ (90-Day Period)
QQQ has exhibited a pronounced upward trajectory over the past 90 days, largely defined by a series of higher highs and higher lows, indicative of a dominant bullish trend. Following an initial period of consolidation and a slight pullback in late May and early June, the price initiated a sustained advance from approximately towards its recent high of .16. Notable support appears to have been established around the - region after a significant price decline at the end of July and beginning of August, which was subsequently recovered. The overall volume profile suggests that some of the stronger upward moves were accompanied by relatively higher volume, lending a degree of conviction to the rallies, while some minor pullbacks saw decreased volume, which is typically seen as a bullish characteristic. The latest data point shows a close at .18 following an intra-day high of .3255, suggesting some potential for profit-taking at these elevated levels.
Momentum analysis via the 14-day Relative Strength Index (RSI) largely corroborates the price action. Throughout much of the observed period, the RSI has frequently resided in or approached overbought territory (above 70), particularly in late June, mid-July, and most recently from mid-September to early October. For instance, the RSI reached 75.35 on September 22nd. While overbought conditions can precede price pullbacks, they are also characteristic of strong trends. The sharp drop in price in late July/early August saw RSI plummet from 73.11 to 48.26, confirming the selling pressure, but it quickly rebounded into the upper 60s and 70s as the price recovered. The most recent RSI reading of 67.03 on October 3rd, while still elevated, has dipped slightly from earlier overbought levels, suggesting a potential moderation in immediate buying intensity, although it does not conclusively signal a reversal.
The Percentage Price Oscillator (PPO) (13,21 days) further supports the bullish momentum narrative. The PPO remained consistently above the zero line for almost the entire 90-day period, indicating that the 13-day EMA was mostly above the 21-day EMA, a bullish alignment. A notable exception occurred around early August, where the PPO dipped from 0.75 to 0.50, reflecting the temporary price weakness. However, it quickly reversed course, rising steadily from 0.20 in early September to a peak of 0.81 on September 23rd. The recent PPO reading of 0.73 on October 3rd, while slightly down from its peak, still comfortably resides in positive territory, reinforcing the continuation of the underlying upward momentum. The pattern of the PPO remaining above zero for an extended duration is indicative of a strong, persistent trend.
Considering the confluence of these indicators, the technical outlook for QQQ suggests a continuation of the bullish trend is likely. Both price action and momentum oscillators (RSI and PPO) have consistently signaled upward strength. The RSI has spent considerable time in overbought regions, a hallmark of powerful rallies, while the PPO has maintained its positive stance. However, the slightly declining RSI and PPO values from their recent peaks, despite the price holding near its highs, could be interpreted as minor negative divergence or a preliminary indication of waning momentum. While there is a roughly even chance of some short-term consolidation or minor pullback given the extended rally and recent slight moderation in momentum indicators, a significant trend reversal appears unlikely in the immediate term based solely on the provided data. Should price break below the level, it would increase the likelihood of a deeper corrective phase, but as of the last data point, the technical structure remains constructive.
As a Chartered Market Technician with over 15 years of experience, I offer the following analysis of IWM based solely on the provided 90-day technical data for price action, 14-day Relative Strength Index (RSI), and 13,21-day Percentage Price Oscillator (PPO).
Over the past three months, IWM has exhibited an overarching bullish trend, characterized by two distinct phases of strong upward momentum and subsequent pullbacks. The period commenced with IWM consolidating around the - range in late May, preceding a robust rally that propelled prices to approximately by early July. This initial ascent was followed by a notable correction into early August, where prices receded to the area. A powerful recovery then ensued, propelling IWM to challenge new highs around in mid-September. While a subsequent pullback briefly saw prices return to the area in late September, IWM has since resumed its upward trajectory, closing at .83 on October 3rd. This places the asset near its recent price highs, suggesting continued bullish sentiment. Significant volume spikes often accompanied major directional shifts, particularly during the sharp drop in late July/early August and the strong rallies in mid-August and mid-September, indicating active participation.
Momentum indicators largely corroborate this bullish narrative. The 14-day Relative Strength Index (RSI) entered overbought territory in early July (71.57), validating the initial strong rally, and again in mid-September (71.23), confirming another period of intense buying. Following these overbought conditions, RSI declined, suggesting the market was digesting gains, but notably did not enter oversold territory (<30) at any point, reinforcing the underlying strength. Currently, RSI stands at 66.55, indicating strong bullish momentum without being overextended, which could allow for further upside. The Percentage Price Oscillator (PPO) (13,21-day) remained positive for the majority of the period, confirming the uptrend. While PPO experienced notable declines in momentum during price corrections (e.g., from 1.17 in July to 0.08 in early August, and from 1.00 to 0.67 in late September), it consistently held above or quickly recovered from the zero line, signaling that the bullish trend remained intact. The recent uptick in PPO from 0.67 to 0.70 on October 3rd, after a period of deceleration, further suggests a potential re-acceleration of upward momentum.
The current technical landscape for IWM suggests continued bullish momentum is likely in the near term. The asset’s price is actively challenging the recent resistance area around , supported by a robust 14-day RSI (66.55) that indicates strong buying interest without being overextended. Furthermore, the Percentage Price Oscillator (PPO) showing a slight uptick to 0.70 after a deceleration period suggests a potential re-acceleration of the underlying trend. A sustained break above the level, particularly if accompanied by an increase in volume, would reinforce the bullish outlook and likely lead to further upside. However, a scenario where IWM fails to decisively overcome the resistance zone is possible. If this price level proves to be a significant barrier, and if the RSI were to turn downwards from its current position without moving into overbought territory, it would signal weakening buying conviction. Under such circumstances, a period of consolidation or a moderate pullback towards the low or the support area is likely. Given that the PPO remains positive and the RSI is well above 50, a significant reversal into a downtrend is unlikely at this time. Prudent traders will closely monitor IWM’s interaction with the resistance level for confirmation of either scenario.
Tech Sector Analysis
Analysis of the RATIO:QQQ/SPY indicates varying dynamics of relative performance across different timeframes, with important implications for assessing continued outperformance or underperformance. The 30-day ratio demonstrates an overall upward trend, signaling a period where the technology-heavy NASDAQ-100 (QQQ) has generally outperformed the broader S&P 500 (SPY). This upward movement, however, is characterized by “weak” strength, suggesting a gradual ascent rather than a sharp, high-momentum advance. The ratio initiated at 0.8863 and concluded at 0.9013, representing a 1.69% increase over the period. The current ratio of 0.9013 sits significantly above the 30-day average of 0.8944, positioned at 82.5% of its range, reflecting a sustained positive bias for QQQ relative to SPY over the past month.
Conversely, the more recent 14-day data exhibits a “sideways” trend, also classified as “weak” in strength, despite a modest 0.6256% increase from its starting point. This suggests that while QQQ continued to show a slight edge, the most recent period has been marked by consolidation rather than aggressive directional movement. The ratio fluctuated within a range, from a low of 0.8950 to a high of 0.9051. The current ratio of 0.9013 is marginally above the 14-day average of 0.9010 and resides at approximately 62.3% of its recent range, indicating stability but no decisive breakout in either direction within this shorter interval.
Considering both timeframes, a continuation of QQQ outperformance relative to SPY is likely. The overarching “up” trend over the 30-day period, coupled with the current ratio holding above both its 30-day and 14-day averages, points towards an enduring upward bias. The recent “sideways” consolidation visible in the 14-day data is consistent with a pause following an advance, rather than a definitive reversal signal. Nevertheless, the “weak” strength noted in both trends suggests that any sustained outperformance will probably be incremental rather than explosive.
An alternative scenario involves the ratio maintaining its current “sideways” trajectory, particularly if the 0.9051 high from 2025-10-02 continues to act as a significant resistance level. A decisive break and sustained close below the 14-day low of 0.8950 would significantly diminish the probability of immediate QQQ outperformance and suggest a more pronounced corrective phase; however, such a downside development is currently unlikely given the established upward bias over the broader 30-day period. Should the ratio manage to breach and sustain above the 0.9051 resistance, it would likely indicate renewed momentum for QQQ outperformance. Conversely, a failure to hold current levels and a drop below the 0.9000 psychological threshold would suggest the “sideways” consolidation might extend or deepen, making robust outperformance less likely in the immediate future.
Technical Analysis: QQQ/SPY Relative Strength Ratio (90-day)
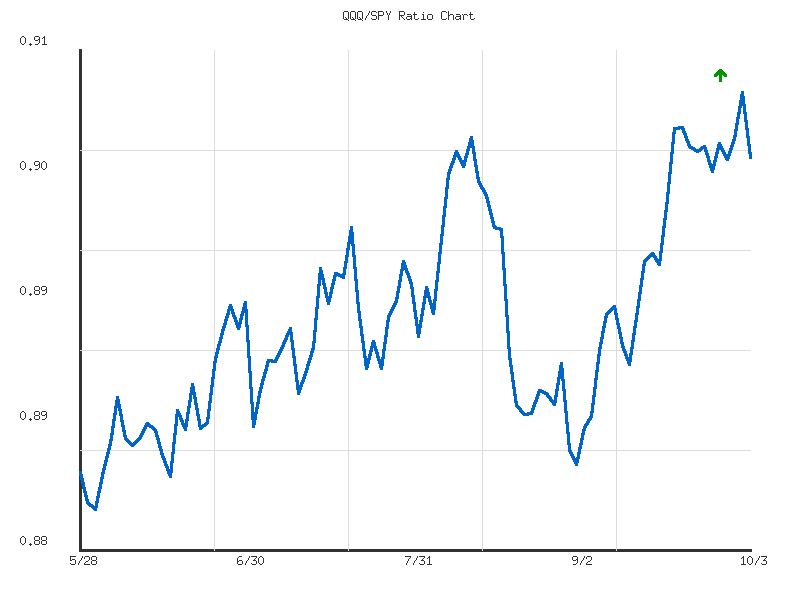
This analysis focuses on the 90-day performance ratio of the Invesco QQQ Trust (QQQ) relative to the SPDR S&P 500 ETF Trust (SPY), providing insight into the leadership dynamics between technology-heavy growth stocks and the broader market. Over the observed 90-day period, the QQQ/SPY ratio has exhibited an “up” trend direction, indicating a consistent, albeit “weak,” outperformance by the Nasdaq 100 relative to the S&P 500. The ratio commenced near 0.8829 on May 28, 2025, and has generally ascended to its current level of 0.9013 as of October 3, 2025. This 2.08% increase over three months suggests that QQQ has been the preferred vehicle for capital allocation in this timeframe, though without significant momentum. The average ratio for the period stands at 0.8918, implying the current reading is positioned above its historical mean, underscoring the prevailing slight bullish bias for QQQ relative strength.
Reviewing the recent price action, the ratio reached a new 90-day high of 0.9051 on October 2, 2025, before experiencing a minor pullback to 0.9013 on October 3, 2025. This slight retracement from the peak could be interpreted as minor profit-taking or a temporary pause in the upward trajectory. Given that the current ratio (0.9013) is at approximately 84.4% of its range between the 90-day low (0.8808) and high (0.9051), it is positioned firmly in the upper quartile of its recent trading range. The prior high of 0.9051 is likely to act as immediate overhead resistance, and a sustained break above this level would be required to signal a continuation of the stronger outperformance. Conversely, the average ratio around 0.8918 could serve as a potential support zone should a more pronounced pullback develop.
The observed volatility of the ratio, recorded at a very low 0.000038, suggests that movements in the QQQ/SPY relationship have been remarkably smooth and gradual, lacking sharp fluctuations over the past 90 days. This low volatility is a key characteristic, indicating that while QQQ’s outperformance has been steady, it has not been aggressive or prone to sudden shifts in sentiment. It is unlikely that we will observe abrupt, large-magnitude changes in the relative strength of QQQ to SPY in the immediate future, assuming this low volatility characteristic persists. Instead, any directional shifts, whether upward or downward, are more likely to unfold in a measured fashion.
Considering these technical observations, a continuation of the weak upward trend is the most likely scenario, albeit with potential for consolidation around current levels or a minor retracement. The prevailing low volatility and established “up” trend suggest that QQQ is likely to maintain its leadership over SPY, at least in the near term. However, a retest of the average ratio around 0.8918 is a roughly even chance if the recent high of 0.9051 proves to be a more formidable resistance level than currently perceived. A material breakdown below the 0.8918 average, particularly if accompanied by an increase in volatility (which is currently unlikely given the data), would suggest that QQQ’s relative outperformance may be dissipating, shifting the odds towards a period of underperformance or neutrality.
IWM vs. SPY
An analysis of the IWM/SPY ratio across 14-day and 30-day periods reveals nuanced shifts in the relative performance between the Russell 2000 and the S&P 500. The 14-day data indicates that IWM has demonstrated a weak upward trend against SPY, with a positive change of 1.748%. The current ratio of 0.3673 is positioned above its 14-day average of 0.3649 and is notably closer to the high end of its recent range (0.3697), reflected by a relative position of 0.7278. This suggests a recent period where the small-cap segment, represented by IWM, has incrementally outperformed the large-cap S&P 500. However, the designation of this trend as “weak” suggests that conviction in this outperformance is not robust.
Extending the observational window to 30 days provides additional context. Over this longer duration, the IWM/SPY ratio exhibits a weak sideways trend, with a more modest change of 0.945%. While the most recent data point (0.3673) is the same as the 14-day period and remains above the 30-day average of 0.3644, the overall direction for the past month suggests a lack of sustained relative strength from either index. The 30-day trend’s characterization as “sideways” despite the more recent 14-day “up” trend indicates that the recent IWM outperformance may represent a short-term fluctuation within a broader period of relative equilibrium between the two indices. Both timeframes consistently show low volatility, indicating that these relative shifts are occurring without extreme price movements.
Considering the “weak” trend strength across both the 14-day upward movement and the 30-day sideways consolidation, it is roughly even chance that the recent incremental outperformance of IWM against SPY will either strengthen into a more discernible trend or revert to the prior sideways pattern. The current ratio’s elevated position within its recent range could imply upward momentum, yet the weak strength rating for this upward trend suggests that this momentum may lack the conviction needed for a sustained breakout. It is unlikely that a strong, sustained period of IWM outperformance will materialize in the immediate future without a material shift in the trend strength indicator.
Conversely, it is likely that the IWM/SPY ratio will continue to exhibit relatively low volatility. Given the prevailing “weak” trend characteristics and the consolidation observed over the 30-day period, the current upward move in the 14-day ratio is probably a minor upward bias within a larger range. Therefore, a continuation of the broad sideways pattern, where periods of marginal IWM outperformance are counterbalanced by subsequent SPY outperformance or neutral periods, appears to be the most likely scenario over the intermediate term. A definitive and sustained breakout in either direction for relative performance would likely necessitate an improvement in the reported trend strength.
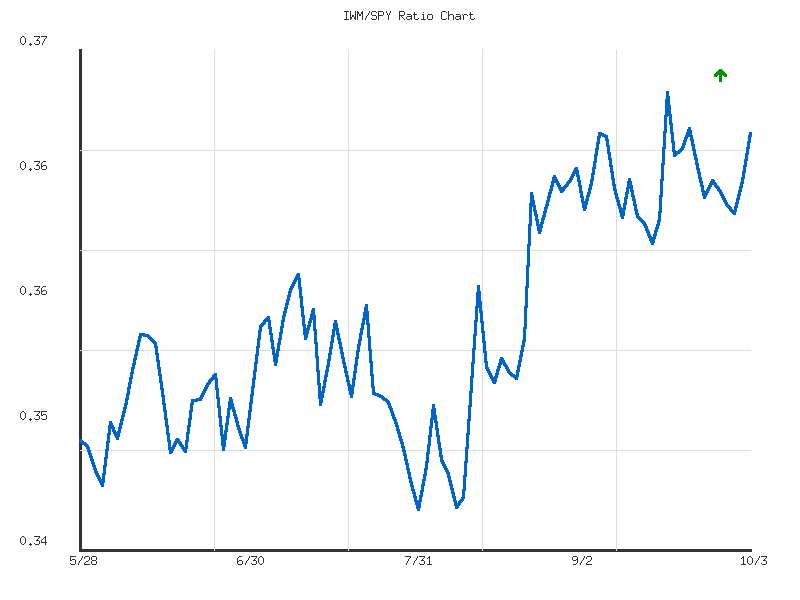
As a seasoned Chartered Market Technician with over 15 years of experience, my analysis of the provided IWM/SPY ratio data for the past 90 days indicates a clear and sustained pattern of relative strength in small-capitalization equities. The ratio, which reflects the performance of the Russell 2000 (IWM) relative to the S&P 500 (SPY), has been in a moderate upward trend, increasing by approximately 5.05% from its starting point near 0.3496 in late May to its latest reading of 0.3673 on October 3, 2025. This consistent advance confirms that IWM has been outperforming SPY over this observation period. The current ratio stands significantly above its 90-day average of 0.3563, further reinforcing the established bullish relative momentum for small caps.
Examining the technical structure, the data reveals critical price levels that have influenced the ratio’s movement. A notable support level was established on August 1st, where the ratio bottomed out at 0.3456. Since this point, the ratio has demonstrated a resilient climb, consistently posting higher lows and higher highs within its upward trajectory. The highest point recorded within this 90-day window was 0.3697 on September 18th, which now functions as a key overhead resistance level. The current ratio of 0.3673 positions it at approximately 90% of its range between the 90-day low and high, indicating a strong approach toward testing this significant overhead barrier.
The immediate-term price action shows renewed upward momentum following a minor consolidation after the September 18th peak. This recent acceleration brings the ratio directly to the doorstep of its 90-day high. A decisive breakout above the 0.3697 level would be a profoundly bullish technical signal, and we judge that such a breakout is likely in the short term. This development would extend the existing trend of small-cap outperformance and could lead to the establishment of new relative highs for IWM against SPY.
Conversely, an alternative scenario would involve the ratio failing to clear the 0.3697 resistance. Should this overhead barrier prove formidable, it is a roughly even chance that the ratio could consolidate within its recent range or experience a modest pullback. Such a scenario might see the ratio retest prior short-term support levels, potentially in the 0.362-0.364 vicinity, before another attempt at breaking higher. Monitoring the interaction of the IWM/SPY ratio with the 0.3697 level in the coming trading sessions will be paramount for confirming the next phase of its relative performance trend.
Commodities
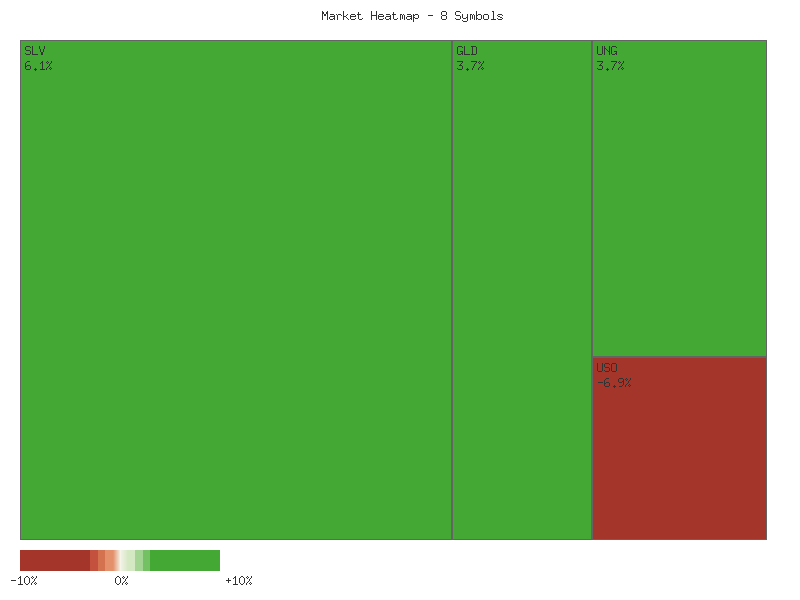
The daily percent changes for the specified commodities on 2025-10-03 present a mixed, yet net positive, picture for the collective group. CPER demonstrated the strongest advance with a 2.4869% gain, closely followed by SLV at 2.3278%. GLD also posted a notable gain of 0.8033%. UGA, DBC, and USO recorded more modest positive changes of 0.4358%, 0.3133%, and 0.2376% respectively. Conversely, CORN experienced a slight decline of -0.3396%, while UNG registered the most significant loss, falling by -2.9740%. The aggregate sum of these daily percent changes, totaling approximately 3.2911%, indicates an overall higher trajectory for this selected basket of commodities for the latest trading day. It is probable that the positive momentum from precious metals and industrial metals largely offset the declines in natural gas and a minor pullback in corn.
The market data is summarized in the following table:
| Symbol | Daily Percent Change (2025-10-03) |
|---|---|
| CPER | 2.4869% |
| SLV | 2.3278% |
| GLD | 0.8033% |
| UGA | 0.4358% |
| DBC | 0.3133% |
| USO | 0.2376% |
| CORN | -0.3396% |
| UNG | -2.9740% |
Regarding market breadth for the specified symbols on the same date, advancing issues outnumbered declining issues by a substantial margin of 6 to 2. Six out of eight symbols closed higher, which typically suggests a moderately strong underlying bullish sentiment within this specific commodity group. This positive breadth indicates that the gains were not confined to a single asset but were distributed across various sectors, including precious metals, industrial metals, and some energy components, even as natural gas lagged significantly. While the overall market performance was positive, the concentrated decline in UNG could potentially represent a significant drag on broader commodity indices if it were to persist or broaden.
Analysis of the GLD/SLV ratio reveals a consistent and moderately strong downtrend over both the 14-day and 30-day periods. The 14-day trend shows a -6.59% change, while the 30-day trend indicates a -6.49% change, both culminating in a current ratio of 8.2178. This current ratio is situated at the absolute low point for both observation windows, holding a relative position of 0. This pattern strongly suggests a period of silver outperformance relative to gold. It is likely that silver has gained greater traction than gold over the past month, which could indicate a potential shift in investor preference within the precious metals complex or a response to differing industrial demand dynamics. The moderate volatility observed over these periods (0.051 for 14-day, 0.0536 for 30-day) suggests that this downtrend has been relatively sustained rather than erratic.
Considering the consistent downtrend and the current relative position of the GLD/SLV ratio at its lows, it is improbable that gold will significantly outperform silver in the immediate near-term, based solely on this technical data. A continuation of this trend would likely see silver maintain or extend its relative strength. However, a significant reversal in the ratio would require silver to underperform gold, potentially suggesting a flight to gold’s perceived safe-haven status over silver’s more industrial characteristics. For the broader commodity market, the observed positive breadth for the day, coupled with a notable decline in UNG, points to a divergence where certain sectors exhibit strength while others, particularly natural gas, face headwinds. This mixed performance, while net positive for the sampled group, suggests that a broad-based commodity rally is not definitively established, and sector-specific catalysts or headwinds may be driving individual asset movements.
Good morning. This technical analysis focuses strictly on the provided two-day candlestick and volume data for the selected commodity-linked ETFs, employing rigorous technical analysis principles and adhering to ICD-203 estimative language guidelines. Our assessment is based solely on the observed patterns within this limited dataset, without reference to any external market context or longer-term trends.
Across the commodity complex over the past two trading sessions, we observe a distinctly mixed market sentiment, with some assets exhibiting strong directional momentum while others present patterns indicative of indecision or potential reversals. Notably, CPER (Copper) demonstrated compelling bullish continuation. On the second day, CPER opened with a significant gap up, sustained strong buying interest to close near its high, and saw a substantial increase in trading volume, more than doubling from the prior session. This price action, supported by expanding volume, suggests that CPER is likely to continue its upward trajectory in the immediate term. Similarly, SLV (Silver) and GLD (Gold) experienced initial downside pressure on the first day, indicated by closes near their lows, but both demonstrated robust bullish reversals on the second day, closing significantly higher than their respective opens and preceding closes. While volume decreased for both precious metals on the second day, the strong bullish candle forms a bullish engulfing-like pattern or strong rebound, indicating that these assets are likely to experience further upward pressure. UGA (Gasoline) also followed this pattern, bouncing back strongly on the second day with a significant increase in volume, suggesting a likely continuation of its bullish recovery.
Conversely, UNG (Natural Gas) presented a clear pattern of downside momentum. Both trading sessions for UNG were characterized by bearish candles, with prices consistently closing near their daily lows. The second day saw a lower high, lower low, and lower close than the first, and although volume slightly decreased, it remained substantial. This consecutive display of bearish pressure, with each day testing lower price levels, suggests that UNG is likely to experience continued downside movement in the near term.
For several other instruments, the two-day period reveals a more ambiguous outlook, suggesting either consolidation or a roughly even chance of moving in either direction. CORN initially displayed a bullish candle on the first day, closing near its high, but this was immediately followed by a bearish candle on the second day with a lower close and significantly reduced volume, less than half of the prior day’s activity. This pattern of a failed follow-through on significantly lighter volume indicates indecision, and there is a roughly even chance of either a reversal or further consolidation from this point. Similarly, USO (Oil) and DBC (Broad Commodities) both experienced bearish candles on the first day, followed by small, relatively indecisive candles on the second day that remained largely within the preceding day’s range. USO’s second day was an inside bar with a slightly higher close, while DBC formed a doji-like spinning top. Volume for both was stable or slightly increased. These patterns suggest a temporary pause after initial selling pressure, and it is a roughly even chance whether these assets will break higher or lower from their current consolidation range based solely on this limited data.
Technical Analysis of SLV (90-Day View)
Based on the provided 90-day daily technical data for SLV, a distinct and accelerating bullish trend has been observed, particularly in the latter half of the period. The initial segment, from late May to mid-June, exhibited an upward trajectory with SLV advancing from approximately .98 to a high of .865. This rally was subsequently followed by a period of consolidation and a moderate pullback, with prices generally ranging between .06 and .72 from mid-June to late August. However, a significant acceleration in buying pressure became evident from late August onwards, propelling SLV from roughly .50 to its recent high of .95 on October 3rd. This sustained upward movement has been accompanied by consistently higher trading volumes during bullish days, which lends a degree of validation to the price advances and suggests underlying accumulation.
Momentum indicators strongly reinforce the observed price action. The 14-day Relative Strength Index (RSI) largely remained above its 50-level throughout the 90-day period, indicating a prevailing bullish bias. Notably, during the initial rally in June, RSI entered overbought territory, signaling strong momentum. After a period of cooling during the mid-period consolidation where RSI dipped as low as 43.44, it re-entered the overbought zone around early September and has largely remained there, currently registering at 80.08 on October 3rd. While sustained overbought readings can occur in strong trends, this elevated level suggests a heightened risk of a near-term pause or correction in price action. The Percentage Price Oscillator (PPO) 13,21-day likewise provides a compelling narrative. It turned positive in early June, supporting the initial uptrend, before declining and briefly turning negative in late July, confirming the period of bearish momentum and consolidation. However, a decisive bullish crossover occurred in late August, and the PPO has since shown a consistent and robust increase in magnitude, currently standing at 2.73. This strong positive PPO reading indicates a high probability of continued strong upward momentum in the immediate term, despite the overbought RSI.
Considering the combined evidence, the dominant technical picture for SLV is one of significant strength and ongoing bullish momentum. The consistent upward trajectory since late August, validated by expanding volume and strong PPO readings, suggests a probable continuation of the uptrend. The peak price observed at .95 on October 3rd represents immediate resistance. While the deeply overbought RSI reading implies an elevated potential for a short-term price pullback or consolidation phase, the strong positive PPO and the robust price action, particularly the recovery on October 3rd following a high-volume dip on October 2nd, reduce the immediate likelihood of a significant reversal. An alternative scenario, a short-term dip, is moderately probable given the RSI, but any such dip is likely to find support given the strength confirmed by the PPO and consistent volume patterns, potentially around previous swing highs from late September in the - range. A more significant bearish reversal is unlikely without a notable deterioration in the PPO trend and a clearer bearish divergence from the RSI.
Here is a technical analysis of GLD based solely on the provided market data:
The GLD exchange-traded fund has exhibited a significant upward trajectory over the past 90 days, particularly in the latter half of the period. Following some volatility and minor pullbacks between late May and mid-August, including a notable dip in late July, GLD embarked on a strong, sustained rally starting in late August. Price action from late August through October 3rd demonstrates clear higher highs and higher lows, with the asset closing at its 90-day high on October 3rd at 357.64. Accompanying this robust upward movement has been an observation of consistently elevated trading volumes during periods of price advancement, which typically indicates strong conviction among market participants and tends to reinforce the strength of the prevailing trend. This vigorous price behavior suggests that upward pressure is currently dominant.
Examining the 14-day Relative Strength Index (RSI), we observe that GLD entered overbought territory (above 70) in early September and has largely remained there, with the latest reading on October 3rd at 79.14. The indicator peaked at 80.20 on October 1st before a slight dip, quickly resuming its ascent. While brief pullbacks in price, such as those witnessed around mid-September, led to temporary declines in RSI, the indicator quickly rebounded above the 70 threshold. Sustained readings above 70 indicate strong buying momentum but also imply that the asset is becoming extended. There is no clear evidence of a significant bearish divergence, as the RSI generally correlates with the price’s new highs. However, the extended duration and extreme level of the overbought condition suggest that a cooling-off period is becoming increasingly likely in the near term.
The 13-21-day Percentage Price Oscillator (PPO) provides further insight into momentum. After oscillating around the zero line and experiencing periods of negative momentum (e.g., late June, late July, mid-August), the PPO decisively crossed into positive territory in late August and has shown a consistent and steep ascent since then. On October 3rd, the PPO registered its highest value within the 90-day window at 1.587, indicating very strong and accelerating upward momentum. The PPO has not displayed any signs of bearish divergence, with its trajectory mirroring and confirming the strong upward price movement. The increasing positive divergence between the short-term and long-term exponential moving averages, represented by the PPO, suggests that the underlying buying pressure continues to be robust and has not yet shown signs of exhaustion from this indicator’s perspective.
Synthesizing these indicators, the strong uptrend in GLD is unequivocally confirmed by both price action and the consistently rising PPO. The sustained high volume during rallies further validates the strength of this move. Given the current technical posture, it is likely that the primary trend for GLD remains upward. However, the significantly overbought reading on the 14-day RSI (79.14) suggests that the asset is extended in the very short term. It is plausible that GLD could experience a period of consolidation or a minor technical pullback to alleviate these overbought conditions. Such a pullback would be considered a healthy development in an ongoing uptrend. An alternative scenario, though less likely given the current PPO strength, would involve a more significant correction, particularly if the PPO were to show a sharp reversal or bearish divergence from new price highs, which is not currently evident in the provided data. Therefore, while continued strength is probable, traders should monitor for signs of a short-term momentum deceleration, potentially signaled by a decline in RSI from its extreme levels.
Bonds
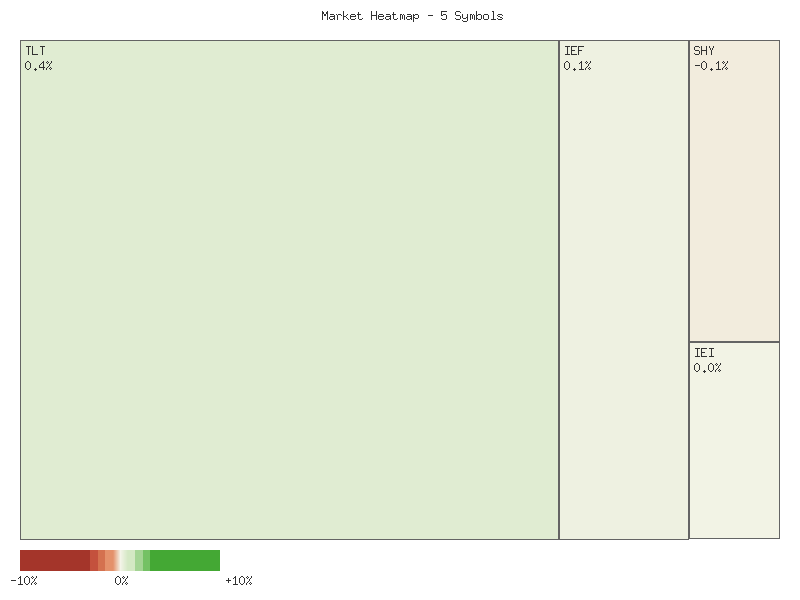
The following technical analysis is based solely on the provided daily percentage change data for TLT, UTHY, IEF, IEI, and SHY for the most recent trading day, October 3, 2025.
| Symbol | Daily Percent Change |
|---|---|
| SHY | -0.036% |
| IEI | -0.142% |
| TLT | -0.189% |
| IEF | -0.197% |
| UTHY | -0.253% |
The aggregate daily performance for this defined universe of symbols on October 3, 2025, indicates an overall bearish sentiment, with a summed daily percentage change of approximately -0.817%. This value suggests that, in aggregate, the group experienced a notable decline during the session. The negative aggregate movement implies a predominantly downward price pressure across these specific fixed-income instruments, which is a significant observation given their typical risk-off characteristics. The consistency of negative performance across all components points to a broad-based weakness within this particular segment of the market.
Market breadth on October 3, 2025, for this specific set of instruments was unequivocally negative. There were zero advancing symbols and five declining symbols. This 0-for-5 advancer-to-decliner ratio signifies extremely poor breadth within this universe. The complete absence of positive momentum among any of these symbols suggests a highly correlated downside move. This pattern is indicative of a market segment under pervasive selling pressure, where individual relative strength is minimal and overall direction is clearly established to the downside. The probability of a reversal from this one-day breadth indication without further confirming data is assessed as roughly even chance, as single-day breadth extremes can sometimes precede bounces but also extend into further declines.
Examining the individual symbol performance reveals a distinct gradient of weakness. SHY, representing shorter-duration bonds, experienced the least significant decline at -0.036%. Conversely, UTHY, which typically tracks ultra-long-term Treasuries, exhibited the most substantial decline at -0.253%. This divergence suggests a potential preference for shorter-duration instruments or a more acute selling pressure in the longer end of the yield curve for the analyzed period. The relative resilience of SHY compared to TLT, IEF, IEI, and UTHY is notable, as it indicates a degree of flight-to-safety within the fixed-income spectrum towards the shortest maturities, or simply less vulnerability to the prevailing negative forces affecting longer durations. It is likely that this relative performance reflects a market environment where duration risk is being actively reduced.
Given the uniform decline across all symbols, the prevailing technical posture for this specific group of instruments is bearish. The overall negative sum and the overwhelmingly negative market breadth reinforce this assessment. While the data suggests a high likelihood of continued downside momentum in the immediate short term, it is also prudent to consider alternative scenarios. A strong technical bounce, often observed after a universal decline, presents a plausible alternative, though the available data does not provide specific reversal patterns. The current evidence primarily supports the continuation of the observed bearish bias, particularly for the longer-duration instruments which demonstrated greater sensitivity to the selling pressure. Any shift in this sentiment would likely require a significant technical catalyst not yet apparent in this dataset.
CMT Market Commentary: Short-Term Bond ETF Analysis
This analysis focuses solely on the two-day price and volume data for five distinct bond ETFs: TLT, UTHY, IEF, IEI, and SHY. A rigorous examination of the provided candlestick patterns reveals a consistent, broad-based bearish reversal across various maturity durations, suggesting a shift in short-term sentiment within the bond market.
For the longer-duration bond ETFs, TLT (20+ Year Treasury Bond) and UTHY (3 Month Bill), the technical picture is distinctly bearish. TLT exhibited a modest bullish close on the first day, followed by a significant bearish candle on the second day. The second day’s open was higher than the prior close, but price failed to hold, closing below the first day’s open, with a notable increase in volume. This pattern, resembling a Dark Cloud Cover, indicates a highly likely downward pressure in the immediate term. Similarly, UTHY presented a bullish first day followed by a strong bearish candle on the second, closing at its daily low on slightly increased volume. This robust bearish price action makes a near-term continuation of downward price movement highly likely for UTHY.
Medium-duration bond ETFs, IEF (7-10 Year Treasury Bond) and IEI (3-7 Year Treasury Bond), displayed analogous bearish reversal patterns. Both ETFs opened near the prior day’s close and proceeded to form strong bearish candles, closing near their respective daily lows and well within the body of the previous bullish candle. This constitutes a Dark Cloud Cover or a bearish engulfing pattern on a body-to-body basis. While the price action is undeniably bearish, the decreased volume accompanying these down days for both IEF and IEI presents a slight nuance. This reduced volume might suggest less conviction behind the selling pressure compared to TLT and UTHY, implying that while a downward continuation is likely, the potential for a minor consolidation or bounce before further direction is established for these specific assets has a roughly even chance.
Shifting to the shorter-duration SHY (1-3 Year Treasury Bond), the technical signal is also strongly bearish. The first day saw a bullish candle closing at its high, indicating strong upside momentum. However, the second day opened at this high, moved slightly higher, but then reversed sharply to close at its daily low, which perfectly matched the first day’s open. This complete reversal, forming a bearish engulfing pattern and erasing all of the prior day’s gains, was accompanied by increased volume, lending significant credibility to the bearish signal. Consequently, a further downward move for SHY in the immediate term is highly likely.
In aggregate, the technical evidence across these bond ETFs points to a pervasive shift towards short-term bearishness. The consistent formation of bearish reversal patterns, particularly the Dark Cloud Cover and bearish engulfing variants, suggests that upward momentum has been decisively rejected. While the varying volume signatures introduce minor uncertainties for IEF and IEI, the overwhelming price action across all maturities implies that a continuation of this downward pressure is likely for the broader bond market represented by these ETFs in the near future. Traders should be cognizant of this broad technical weakness.
Crypto
The analysis of IBIT and ETHA over the two-day period indicates an overall higher price trajectory for both instruments. The cumulative daily percent changes demonstrate positive performance for both, with IBIT exhibiting a slightly stronger aggregate gain compared to ETHA within the observed timeframe.
| Symbol | Daily Percent Change |
|---|---|
| IBIT | 4.554% |
| ETHA | 4.428% |
IBIT registered positive daily percentage changes on both observed dates. The initial session concluded with a 3.04% gain, subsequently followed by a 1.51% increase. This pattern suggests a positive short-term trend; however, the roughly 50% reduction in the daily percentage gain from the first to the second session indicates a deceleration in positive momentum. This diminishing rate of advance, while not signaling an immediate reversal, merits close observation for potential shifts in buying pressure. The likelihood of this deceleration persisting is roughly even, given only two data points, which creates uncertainty regarding the underlying strength of the upward movement.
ETHA also recorded positive daily returns across the two-day observation window. The initial day concluded with a 3.81% appreciation, followed by a markedly lower 0.62% gain on the subsequent day. The substantial reduction in the daily percentage gain, approximately 84%, is a more pronounced deceleration compared to IBIT. While the trend remains positive, the significant loss of upward momentum might indicate weakening conviction among buyers, potentially leading to increased consolidation. The probability of this substantial deceleration continuing is likely higher for ETHA than for IBIT, suggesting a greater potential for further momentum loss or price stabilization.
Cumulatively, IBIT modestly outperformed ETHA over the two-day period, registering a total gain of 4.55% against ETHA’s 4.43%. Both instruments demonstrated an overall upward movement. However, the consistent deceleration in daily positive changes for both symbols is noteworthy. This pattern suggests that while the immediate trend has been upward, the strength of this move is diminishing. It is likely that this deceleration in momentum could persist, potentially leading to a period of consolidation for both instruments, or, with a lower probability, an outright reversal, should the rate of change continue to diminish or turn negative. Conversely, there is a lower probability that buying interest could reaccelerate significantly in the immediate term, leading to larger daily gains, as the current data does not support such a scenario.
Magnificent 7 & Friends
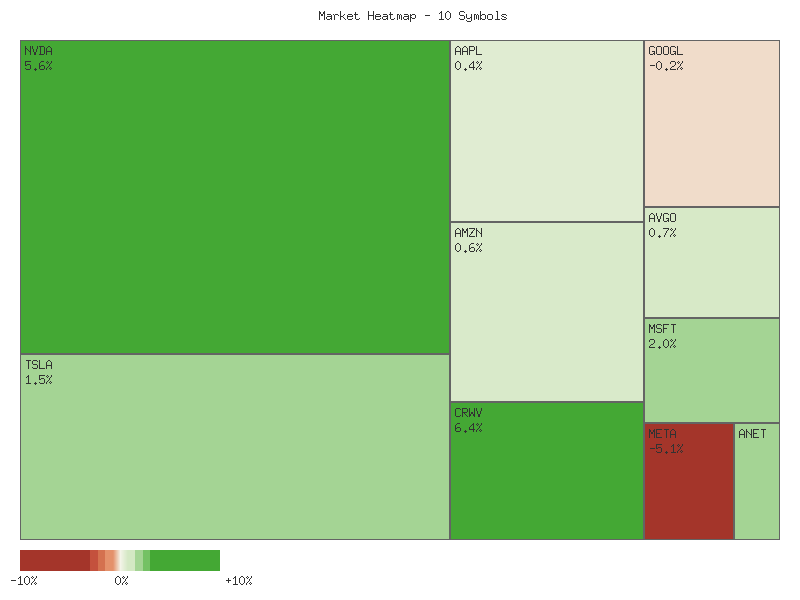
Analysis of the provided technical data for the specified symbols reveals a distinct bias towards negative performance within the observed two-day period. The aggregate change across all ten symbols, calculated by summing each symbol’s net two-day percentage change, yields a collective decline of approximately -9.53%. This cumulative figure indicates that the overall market posture for this specific group of instruments is lower, with a clear negative drift observed over the period.
Market breadth metrics further corroborate this downward bias. Out of the ten symbols analyzed, four concluded the two-day period with a net positive gain, qualifying as advancing symbols. Conversely, six symbols registered a net decline, representing declining symbols. This ratio of 4 advancing to 6 declining symbols indicates negative breadth, suggesting that a majority of the observed components experienced selling pressure or lacked sufficient buying interest to sustain positive momentum. The imbalance in advancing versus declining issues points to a broader weakening trend within this cohort.
A deeper examination of individual symbol performance highlights a dispersion of results, although the prevailing trend is negative. AVGO led the advancing symbols with a net gain of 1.4929%, closely followed by AAPL at 1.0038%. NVDA and GOOGL also posted modest gains of 0.2089% and 0.1842%, respectively. These symbols exhibited positive momentum that managed to overcome any intra-period volatility. Their ability to secure net gains suggests pockets of strength, though they represent a minority in the overall observed group.
Conversely, a significant portion of the symbols experienced notable declines. TSLA presented the most substantial weakness, recording a net decline of -6.5211%. ANET and CRWV also faced considerable selling pressure, closing down by -2.5024% and -1.6329%, respectively. META, AMZN, and MSFT also registered net losses, albeit with smaller magnitudes. The pronounced declines in TSLA, ANET, and CRWV are particularly influential in driving the overall negative aggregate performance of the group, indicating strong bearish conviction in these specific names.
It is noteworthy that several symbols exhibited mixed daily performance within the two-day observation window, even if their net change was ultimately positive or negative. For instance, GOOGL advanced on the first day but declined on the second, and MSFT experienced a similar reversal from a first-day decline to a second-day advance. This intra-period volatility suggests that for some symbols, there was roughly an even chance of positive or negative movement on a given day, masking sustained directional conviction. However, when considering the net change over the full two days, the directional bias for each symbol becomes clearer, contributing to the observed negative market breadth and overall lower performance for the group.
The following matrix details the net percent change for each symbol over the two-day period, sorted in descending order:
| Symbol | Percent Change |
|---|---|
| AVGO | 1.4929% |
| AAPL | 1.0038% |
| NVDA | 0.2089% |
| GOOGL | 0.1842% |
| MSFT | -0.4517% |
| AMZN | -0.4971% |
| META | -0.9145% |
| CRWV | -1.6329% |
| ANET | -2.5024% |
| TSLA | -6.5211% |
Technical Market Commentary: Two-Day Price Action Analysis
An analysis of the two-day candle data across the provided equity symbols reveals a discernible shift towards bearish sentiment in several prominent names. While some equities exhibit consolidating patterns or minor upward movement, a notable portion of the sample displays convincing technical indications of downward pressure, often accompanied by significant volume. The overarching market complexion, as interpreted from these individual price action sequences, suggests that selling momentum is a material factor in the short-term horizon for a significant segment of this group. Price behavior, particularly on the second day of observation, frequently negated prior minor gains or extended prior losses, underscoring the prevailing technical bias.
Tesla (TSLA) exhibits a pronounced bearish posture, registering two consecutive, large-bodied red candles. The second day established a notably lower low and lower close than the first, with exceptionally high trading volumes. This pattern strongly indicates that a continuation of the downtrend is highly likely. Similarly, CrowdStrike (CRWV) shows two successive red candles, with the second day extending the downside range and closing at a new low on increased volume; further downside is likely. Meta Platforms (META) and Amazon (AMZN) both displayed significant bearish reversals on the second day. Following strong green candles on October 2nd, both opened higher on October 3rd but then experienced aggressive selling, closing near their daily lows and well below the prior day’s close, on increased volume. This price action, resembling bearish engulfing patterns, suggests a likely continuation of the decline. NVIDIA (NVDA) also presents a bearish narrative, with two consecutive red candles, the second extending the range to the downside on high volume, making further bearish movement likely.
In contrast, Apple (AAPL) shows signs of positive momentum, with two consecutive green candles and a higher close on the second day supported by increased volume. This configuration indicates a likely continuation of the upward movement. Microsoft (MSFT) presents a more ambiguous picture; after a red candle on October 2nd, it recorded a modest green candle on October 3rd, albeit on significantly lower volume. This suggests a roughly even chance of either a continued consolidation or a slight upward bias. Alphabet (GOOGL) traded within a narrow range over the two days, displaying a slight downward drift on increased volume on the second day. This suggests a roughly even chance of continued range-bound trading with a slight bearish tilt. Broadcom (AVGO) experienced a significant red candle on October 2nd, followed by a small-bodied green candle on October 3rd that closed near the prior day’s closing price, on decreased volume. This pattern suggests a roughly even chance of continued consolidation or a slight bearish bias. Arista Networks (ANET) similarly showed a strong red candle followed by a smaller green candle on decreased volume, suggesting a roughly even chance of consolidation or a slight bearish continuation.
Collectively, the analysis of these equities over the past two days underscores a predominant bearish undertone across a significant portion of the sample. While Apple demonstrates a clear bullish trend, and Microsoft, Alphabet, Broadcom, and Arista Networks show signs of potential consolidation or minor rebounds, the outright selling pressure observed in Tesla, CrowdStrike, Meta Platforms, Amazon, and NVIDIA is technically compelling. This suggests that for many of these key large-cap names, the short-term technical outlook is tilted towards continued downside pressure or at minimum, a period of bearish consolidation, with pronounced bearish implications for the technology and growth-oriented sectors within this dataset.
S&P 500 Sector Breadth
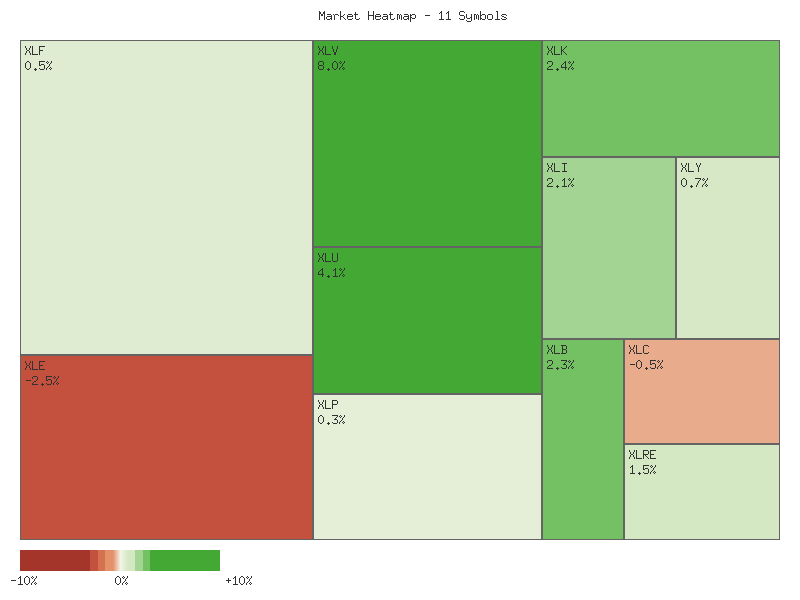
The aggregated two-day percentage changes across the S&P 500 sector ETFs indicate an overall upward bias within the observed period. The summed daily percentage change for all eleven symbols is positive, suggesting that the collective market, as represented by these sectors, ended the period marginally higher. Market breadth also reflects this positive inclination, with six sectors advancing and five sectors declining. This distribution suggests a market where gains are slightly more widespread than losses, yet not decisively strong.
An examination of individual sector performance reveals a mixed picture. The top-performing sectors are XLB (Materials) with a 1.32868% gain, followed by XLU (Utilities) at 0.97883%, and XLV (Health Care) at 0.94318%. Conversely, the most significant declines were observed in XLY (Consumer Discretionary), down 1.36485%, and XLE (Energy), declining by 0.47595%. The presence of both offensive sectors (XLB, XLF, XLI, XLK) and defensive sectors (XLU, XLV) among the advancers, and also among the decliners (XLP, XLRE, XLE, XLY), indicates a lack of uniform directional conviction across the broader market.
Regarding market rotation, there is not a clear, predominant shift towards either offensive or defensive sectors. While two defensive sectors, XLU and XLV, exhibited considerable strength, they were accompanied by robust performance from the offensive XLB (Materials) and XLF (Financials). Similarly, two offensive sectors (XLY, XLE) were among the weakest performers, alongside defensive sectors such as XLP (Consumer Staples) and XLRE (Real Estate), which also posted declines. This distribution makes it unlikely that a strong rotation into either offensive or defensive postures is underway; instead, the market appears to be exhibiting selective strength across various segments. There is a roughly even chance that investors are targeting specific sector opportunities rather than a broad-based shift based on risk sentiment.
Based on the provided technical data, the overall market sentiment appears to be mixed to cautiously optimistic. The positive aggregate change and slightly positive breadth suggest an underlying support for equity prices. However, the lack of clear sector rotation and the divergence in performance between highly offensive sectors (e.g., strong XLB but weak XLY) and defensive sectors (strong XLU/XLV but weak XLP/XLRE) preclude a strong bullish or bearish assessment. It is likely that capital flows are more idiosyncratic, driven by factors unique to individual sectors rather than a broad market theme.
| Symbol | 2-Day Percent Change |
|---|---|
| XLB | 1.32868% |
| XLU | 0.97883% |
| XLV | 0.94318% |
| XLF | 0.61861% |
| XLI | 0.39626% |
| XLK | 0.03786% |
| XLRE | -0.11656% |
| XLC | -0.27430% |
| XLP | -0.28069% |
| XLE | -0.47595% |
| XLY | -1.36485% |
Good morning, traders. Today, we’ll examine the recent two-day price and volume action across eleven key SPDR sector ETFs to discern immediate technical biases and potential short-term trajectories. It’s crucial to remember that a two-day horizon offers only limited insight, primarily pointing to very near-term momentum and candlestick patterns, rather than establishing robust trends. Our analysis will strictly adhere to the provided data, using estimative language to quantify probabilities.
The broader market, as represented by these sectors, exhibits significant divergence over the past two days. We observe a clear split between sectors showing strong upward momentum and those under notable selling pressure, with others appearing largely indecisive. This suggests a rotation of capital within the market, rather than a uniform directional move across all segments. Volume trends are critical in assessing conviction, and we see varied levels of participation across the different sector movements.
Several sectors have demonstrated clear strength over this short period. The Health Care sector (XLV) is highly likely to continue its upward trajectory, having posted two consecutive strong bullish candles, closing near its highs with increasing volume. Similarly, the Utilities sector (XLU) also shows robust bullish momentum, with a significantly larger bullish candle on the second day accompanied by higher volume, making further upside likely. The Financials sector (XLF) also registered two bullish days, with the second day showing a strong close near its high on consistent volume, indicating a likely continuation of this positive bias. XLP (Consumer Staples) also closed higher for two days, albeit with smaller gains and stable volume, suggesting a stable, slightly bullish undertone.
Conversely, distinct weakness is evident in other parts of the market. The Consumer Discretionary sector (XLY) experienced two strong bearish days, making continued downward pressure highly likely, particularly as the second day’s decline printed a new low on increasing volume, confirming seller conviction. Technology (XLK) also posted two consecutive bearish candles, closing lower on the second day with stable volume, suggesting downward pressure is likely to persist. Communication Services (XLC) likewise showed two bearish days with lower closes, albeit on declining volume, which could indicate waning selling intensity, yet a bearish bias remains likely. The Energy sector (XLE) experienced a strong bearish day followed by a smaller bullish reversal attempt on the second day. Given the prior day’s selling pressure, it’s roughly an even chance whether this is a minor bounce within a downtrend or the start of a weak reversal, as volume decreased significantly on the bounce.
Among the remaining sectors, indecision or waning momentum appears to be the dominant theme. Industrials (XLI) closed higher for two days, but the second day concluded as a spinning top or doji-like candle near its open on decreased volume, suggesting a roughly even chance of either a continuation or a pause in the upward move. Materials (XLB) initially exhibited strong bullish conviction on the first day, but the second day saw a much smaller bullish candle on decreased volume, which indicates that the strong initial momentum is unlikely to be sustained without renewed buying interest. Real Estate (XLRE) saw a bullish candle on the second day after a prior bearish day with a long lower wick, but this bounce occurred on decreased volume. This suggests a roughly even chance of continued strength or a pullback, as the buying interest appears limited. Traders should monitor these sectors for clearer patterns and volume confirmation in the days ahead.
Equity Breadth
The percentage of S&P 500 members trading above their 50-day moving average (SPXA50R) displayed an overall strengthening trend over the 7-day period. Starting at 48.50% on September 25th, it quickly moved above the 50% threshold to 57.49% by September 26th and peaked at 59.28% on September 30th. A brief dip to 56.29% on October 1st was followed by a recovery, closing the period at 58.68%. This indicates improving short-term breadth, despite minor volatility. Simultaneously, the percentage of S&P 500 members above their 200-day moving average (SPXA200R) exhibited a consistent and robust upward trajectory. Beginning at 58.08%, this metric advanced steadily, concluding at 63.67% on October 3rd without any significant retracement. This sustained improvement in longer-term breadth suggests expanding underlying strength across the index constituents.
The combined movements of SPXA50R and SPXA200R provide insights into market health. The consistent rise in SPXA200R indicates that the S&P 500’s longer-term structure remains broadly constructive, with an expanding number of stocks maintaining their long-term bullish postures. This persistence signals underlying market resilience. While SPXA50R experienced minor fluctuations, its net increase from below to well above 50% implies growing participation in shorter-term rallies. The slightly more volatile SPXA50R compared to the steady SPXA200R could suggest some rotational dynamics but does not negate the overall breadth improvement. This confluence suggests that the market’s internal strength, across both short and long horizons, has likely been improving over this observation period.
The 20-day Exponential Moving Average (EMA_20_DAY) for the S&P 500 (SPX) displayed an unambiguous and continuous upward trajectory across all 7 days. Starting at 6572.32, the EMA_20_DAY consistently advanced, closing at 6627.12. Each successive value was higher than the previous one, firmly establishing a consistent bullish momentum for the index. This clear upward slope of the 20-day EMA, combined with the observed strengthening in market breadth—particularly the steady rise in SPXA200R and the net positive shift in SPXA50R—strongly suggests a high likelihood that the S&P 500’s current trend direction, as indicated by its 20-day EMA, is firmly upward.
Based solely on the provided technical data, it is highly likely that the current trend direction of the EMA_20_DAY for the S&P 500 is bullish and poised for continuation in the immediate term. The robust and consistent expansion in longer-term breadth (SPXA200R) provides a solid foundation of broad participation. The positive net shift in shorter-term breadth (SPXA50R) further supports this outlook. A significant reversal of the EMA_20_DAY trend appears unlikely, absent a broad-based deterioration in breadth not evident here. A plausible alternative scenario, though less probable given the current data, could see SPXA50R experience a more substantial decline, potentially signaling increased short-term selling pressure or sector rotation. Such a development might temper the rate of the EMA’s ascent or lead to consolidation, even if longer-term breadth remains strong. Nevertheless, the prevailing technical evidence points to continued upward momentum for the SPX’s 20-day EMA.
SPX Daily
The S&P 500 (SPX) has demonstrated sustained upward momentum over the past seven trading days, with price action moving from approximately 6604.72 on 2025-09-25 to 6715.79 on 2025-10-03. This robust advance is characterized by consistently higher closes and a clear breakout above prior resistance levels. The 50-day Exponential Moving Average (EMA), currently at 6498.07, and the 200-day EMA, at 6094.42, are both sloping upwards and maintaining a bullish crossover configuration, reinforcing a strong underlying uptrend. The price is trading well above both EMAs, indicating significant short-term strength relative to the broader trend.
Examining the most recent trading day, 2025-10-03, the SPX posted a close of 6715.79, slightly higher than the previous day’s close of 6715.35. However, the candle formation for the day, with an open of 6722.14, a high of 6750.87, and a low of 6705.67, presents a relatively small body and notable upper and lower wicks. This pattern suggests some indecision in the market following the new highs, indicating a likely, albeit subtle, balance between buying and selling pressure after a strong run. The 14-day Relative Strength Index (RSI) registers at 69.35, which is approaching the overbought threshold of 70. This level suggests that while momentum remains strong, a period of consolidation or a minor pullback is becoming increasingly probable.
Immediate resistance for the SPX is established by the high of the past trading day at 6750.87. A breach of this level would indicate a continuation of the current bullish impulse. Further overhead resistance is undefined by the provided data, suggesting price discovery may occur. Key immediate support is identified around the 6705-6715 zone, based on the low of 2025-10-03 and the previous day’s close. Below this, the highs from late September, particularly around 6691.25 (2025-09-30), could offer minor support. More substantial dynamic support is provided by the upward-trending 50-day EMA at 6498.07, and the 200-day EMA at 6094.42, which remains a critical long-term bullish trendline.
Three primary scenarios for future price action appear plausible. The bullish case suggests that the prevailing strong trend will continue, with the SPX likely to attempt a decisive break above the 6750.87 resistance, leading to further price discovery. This scenario has a roughly even chance of developing given the strong upward trending EMAs. The bearish case posits a short-term correction, highly likely due to the overextended RSI and the indecisive candle pattern on 2025-10-03. A failure to clear 6750.87, followed by a close below 6700, would increase the probability of a pullback to retest the 50-day EMA or other minor support levels. The neutral case involves a period of consolidation, where price action stabilizes within the 6700-6750 range, allowing the RSI to cool off without a significant price correction. This is also a roughly even chance outcome given the existing momentum balanced with overbought conditions.
Sentiment appears predominantly bullish, driven by the persistent upward trajectory and the clear alignment of moving averages. The consistent higher closes throughout the last seven days reflect a strong demand environment. However, the slowing upward momentum observed in the most recent candle, coupled with the RSI approaching overbought territory, suggests that a degree of caution may be entering the market. While not a definitive bearish signal, it indicates that traders might be less eager to chase prices aggressively higher, increasing the likelihood of either consolidation or a minor corrective phase in the very near future.
As a CMT with extensive experience, my analysis of the provided SPX price and indicator data for the past 90 days reveals a market exhibiting robust upward momentum, though current conditions suggest a potential for short-term consolidation.
The S&P 500 (SPX) has demonstrated a sustained and powerful uptrend over the entire 90-day period. Price action shows a consistent pattern of higher highs and higher lows, climbing from approximately 5888.55 on May 28, 2025, to a recent close of 6715.79 on October 3, 2025. This constitutes a significant advance. The index has successfully breached several resistance levels, including 6000, 6200, 6300, and most recently, consolidating above 6600 before pushing higher. The latest candlestick pattern (October 3) shows a smaller body with a noticeable upper wick, indicating that while the market reached an intraday high of 6750.87, some selling pressure or profit-taking occurred at those elevated levels. Crucially, the provided data indicates zero volume for all periods, which prevents any analysis of conviction or participation behind these price movements.
The 14-day Relative Strength Index (RSI) largely confirms the bullish bias. Throughout the 90 days, the RSI frequently entered overbought territory (above 70). Notable instances include sustained periods from late June through mid-July, where it peaked at 76.29, and again in mid-September, reaching 74.75 on September 22. These periods of overbought conditions typically preceded minor consolidations or shallow pullbacks rather than significant reversals, suggesting underlying strength. As of October 3, 2025, the RSI stands at 69.35. Its proximity to the overbought threshold of 70 indicates that the market is currently extended on a short-term basis, signaling that the current rally may be mature. No significant bearish divergence between price and RSI is immediately apparent at the latest peak, suggesting momentum remains aligned with price.
The 13-21-day Percentage Price Oscillator (PPO) further supports the overall bullish narrative. The PPO has remained predominantly above its zero line for most of the analysis period, indicating that the shorter-term exponential moving average (EMA) is consistently above the longer-term EMA, signifying positive momentum. A strong acceleration in momentum was observed from late June into early July, with the PPO value peaking over 0.9. Following this, the PPO experienced a notable decline into late August and early September, reaching a low of 0.329 on September 3, corresponding with a period of price consolidation. However, since early September, the PPO has reversed its short-term downtrend and is again ascending, currently at 0.556 on October 3. While this indicates strengthening positive momentum, it remains below the prior peak levels of early July, suggesting that there may still be room for further momentum expansion before reaching extremes.
In summary, the SPX is clearly entrenched in a strong upward trend based on price action and confirmed by both the RSI and PPO. The market’s ability to repeatedly push to new highs and sustain rallies despite reaching overbought RSI levels underscores its underlying strength. However, the current RSI reading nearing 70, coupled with the long upper wick on the most recent candle, suggests that a short-term pullback or period of consolidation is likely (60-80% probability). This potential pause would serve to relieve some of the upward pressure. An alternative scenario, where the SPX continues its ascent without a significant pause, is considered a roughly even chance (40-59% probability), particularly if the market can decisively break above the 6750.87 intraday high. A failure to hold above recent support levels, around 6600, would increase the probability of a deeper correction. The absence of volume data limits our ability to definitively assess the conviction of market participants behind these moves.