Daily Market Technical Analysis
Market Overview
Equity markets exhibit diverging short-term momentum. Small and mid-cap indices (IWM, IJR, MDY) demonstrate likely sustained upward momentum, contrasting with waning conviction in large-caps (SPY, QQQ) and a probable bearish reversal signal from OEF. The S&P 500 maintains a highly likely intermediate-term bullish trend, though a near-term consolidation or minor pullback is likely due to approaching overbought conditions. Commodities show a mixed technical landscape: CPER and CORN are likely to advance, while precious metals (GLD, SLV) and several energy components face very likely downside. Bond ETFs indicate a short-term positive bias, with UTHY highly likely to continue bullishly. However, the “Magnificent 7” cohort faces a likely shift towards caution, marked by bearish reversals and declining volume in key names, suggesting internal market rotation.
Market Indices
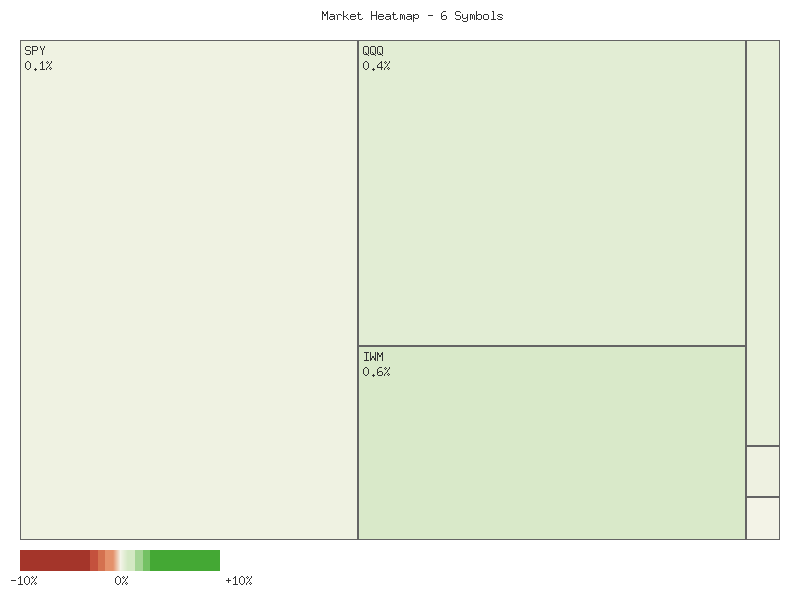
Analysis of the daily percent changes for the specified equity indices on October 2nd, 2025, reveals a broadly positive performance across the observed segments. The following matrix details the individual daily percent changes, sorted in descending order:
| Symbol | Daily Percent Change |
|---|---|
| IWM | 0.631% |
| QQQ | 0.411% |
| IJR | 0.302% |
| MDY | 0.130% |
| SPX | 0.062% |
| OEF | 0.006% |
The aggregated performance for these indices on October 2nd totaled approximately 1.54% of positive change. This sum indicates an overall higher market movement for the day across these bellwether segments, albeit with relatively modest individual gains. The small-cap Russell 2000 proxy (IWM) and the technology-heavy Nasdaq 100 proxy (QQQ) exhibited the strongest daily performance within this group.
Market breadth for the equity indices on October 2nd was uniformly positive, with all six symbols recording an advance. Specifically, there were six advancing symbols and zero declining symbols. This broad participation across various market capitalization segments—including small-cap (IJR, IWM), mid-cap (MDY), and large-cap/mega-cap (SPX, OEF, QQQ)—suggests a robust underlying buying interest for the day. Such widespread positive performance is generally indicative of a healthy market environment, though the magnitude of the advances remains relatively contained.
Examination of the VIX over the past seven trading days indicates fluctuating but ultimately rising volatility expectations. The VIX initially climbed to a high close of 16.74 on September 25th, followed by a notable decline to a close of 15.29 on September 26th, establishing a probable near-term support level. Subsequently, the VIX recovered from this low, exhibiting a general pattern of higher lows and higher closes. By October 1st, it had reached 16.29, and on October 2nd, it closed at 16.63, nearing its prior high close from September 25th.
The VIX daily percent changes reinforce this trend, particularly on October 2nd, with a significant 2.087% increase following a modest 0.061% rise on October 1st. This recent upward movement in the VIX, occurring concurrently with modest positive returns in the broader equity indices, suggests a likely increase in hedging activity or a heightened perception of near-term market risk among participants. While equities show an immediate positive reaction, the rising VIX indicates that market participants are probably anticipating increased volatility in the near future. This divergence between mildly advancing equities and a rising volatility index presents a roughly even chance of either continued modest equity gains met with increasing caution or a potential shift towards more volatile price action in subsequent sessions.
As a Chartered Market Technician with over 15 years of experience, my analysis focuses solely on the provided two-day candlestick and volume data for SPY, QQQ, IWM, IJR, MDY, and OEF. The market data, while limited to a brief period, offers initial insights into short-term momentum and potential divergences.
For the initial day (October 1st), all six instruments demonstrated clear bullish sentiment, evidenced by strong daily candles closing near their respective highs on notable volume. This broad-based strength established an immediate upward bias heading into the subsequent session. The subsequent day (October 2nd) generally maintained this bullish close across the board, with all instruments registering a higher close than their previous day.
However, a closer examination reveals emerging nuances in momentum. SPY and QQQ, representing large-cap and technology-heavy indices, both exhibited smaller candle bodies on October 2nd compared to October 1st, despite opening with a bullish gap. For SPY, the close was marginally higher than the open for the day, while QQQ’s close was below its open. Both experienced a reduction in volume on the second day. This pattern, characterized by a higher close but with diminishing conviction (smaller range, lower volume, or intraday selling from the high), suggests that buying pressure is likely encountering increased resistance, and the immediate upward momentum for these specific instruments may be losing intensity. It is likely that SPY and QQQ may enter a period of consolidation or face a minor pullback in the immediate future.
Conversely, the small and mid-cap segments, as represented by IWM, IJR, and MDY, displayed more robust continuation. IWM closed strongly near its high on October 2nd, with volume only marginally declining. More significantly, IJR and MDY both concluded October 2nd with higher closes near their highs, accompanied by increasing volume compared to October 1st. This pattern of sustained price appreciation supported by increasing volume is a strong indicator of continued buying conviction. It is likely that IWM, IJR, and MDY will exhibit relatively greater resilience and sustained upward momentum in the very near term compared to their larger-cap counterparts.
OEF, representing the S&P 100, presents the most notable technical divergence and a potential warning signal. While it closed marginally higher than October 1st, the candle for October 2nd gapped up significantly at the open but failed to maintain that strength. It formed a distinct upper shadow, with the day’s high almost immediately after the open, and ultimately closed below its open. This ‘shooting star’ like formation, following a gap-up, suggests that significant selling pressure emerged at higher price levels, effectively rejecting the initial bullish surge. This pattern implies potential exhaustion of the immediate buying interest for OEF. It is likely that OEF will experience near-term weakness or consolidation, and there is a roughly even chance that this exhaustion in large-cap leadership could influence the broader market sentiment, potentially leading to increased volatility or a pause in the general rally.
In summary, while the overall technical picture across these indices shows a two-day upward bias, the underlying momentum characteristics are diverging. An immediate broad market bearish reversal is unlikely given the sustained strength in IWM, IJR, and MDY. However, the waning momentum in SPY and QQQ, combined with the distinct bearish reversal signal from OEF, makes it likely that a period of sector rotation or consolidation will occur. The small and mid-cap segments appear poised for continued relative strength, while the large-cap leadership may experience pressure in the immediate term. Alternatively, sustained strength in IWM, IJR, and MDY could potentially provide a floor for SPY and QQQ, but the current data indicates growing internal market divergences.
Technical Analysis of SPX: A 90-Day Momentum Review
The S&P 500 (SPX) has exhibited a discernible bullish trend over the past 90 days, advancing from approximately 5854 in late May to closing at 6715.35 on October 2nd. The price action demonstrates a pattern of higher highs and higher lows, interspersed with corrective phases that have typically found support before the trend reasserted itself. Notably, the SPX experienced a significant rally through June and early July, culminating in a peak near 6279 on July 3rd, followed by a more extended period of consolidation and a sharp decline into early August, reaching a low around 6212.69 on August 1st. Subsequent rallies in August and September have pushed the index to new highs within this 90-day window, indicating sustained buying interest following each period of weakness. The most recent daily closing prices show the SPX maintaining strong upward momentum, with the last data point on October 2nd marking the highest close observed at 6715.35.
Analysis of the 14-day Relative Strength Index (RSI) reveals periods of strong bullish sentiment and subsequent cooling. The RSI moved into overbought territory (above 70) multiple times, particularly during the late June-early July rally, reaching values as high as 75.57 on July 3rd. Similarly, late July saw the RSI climb to a peak of 76.29 on July 28th, immediately preceding a notable price decline and a sharp drop in RSI to 47.80 by August 1st. This pattern suggests that extended periods in overbought RSI territory increased the likelihood of a near-term price correction. The RSI also briefly entered overbought conditions in mid-September, peaking at 74.75 on September 22nd, before a short-lived pullback. As of October 2nd, the RSI stands at 69.31, indicating strong bullish momentum that is approaching overbought levels, which makes a short-term consolidation or minor pullback a roughly even chance in the immediate future, absent further significant upward impetus.
The Price Percentage Oscillator (PPO) provides additional insight into momentum dynamics. The PPO remained positive throughout the 90-day period, confirming the underlying bullish trend. However, its trajectory offered key signals regarding momentum shifts. A noticeable decline in PPO from 0.93 on July 3rd to 0.42 by August 5th, while the SPX was attempting to consolidate at higher levels or experiencing a correction, signals a significant weakening of bullish momentum. This divergence between price (which remained elevated initially) and momentum (PPO decline) made a subsequent, more pronounced price correction highly likely, as observed with the August 1st price low. Similarly, minor PPO declines in late August and late September correlated with short-term price pullbacks. Conversely, strong upward movements in the PPO, such as from 0.57 in late June to 0.93 in early July, and from 0.32 in early September to 0.63 by September 22nd, consistently aligned with robust price rallies.
Considering the interplay of price action, RSI, and PPO, the SPX appears to be in a strong overall uptrend, characterized by resilient recoveries from pullbacks. The frequent excursions into overbought RSI territory (above 70) in conjunction with subsequent PPO declines have consistently preceded short-term price corrections, suggesting a tendency for the market to relieve overextension. The current RSI reading of 69.31, coupled with a PPO value of 0.55 and a recent upward trajectory from a minor September pullback, indicates that bullish momentum remains dominant. It is likely that the SPX will attempt to challenge higher price levels in the near term, continuing its established uptrend. However, an alternative scenario where the RSI crosses above 70 and then swiftly reverses, or if the PPO begins a sustained decline from its current level, would increase the probability of a fresh short-term consolidation or correction. Given the historical patterns within this data, further upward movement is probable, but market participants should monitor for momentum exhaustion indicated by RSI peaking above 70 and a subsequent PPO decline, which historically has presented a window of increased likelihood for a market pause or reversal.
QQQ Technical Analysis: Early October 2025
Over the past 90 days, the QQQ has exhibited a discernible uptrend, advancing from approximately in late May to over by early October. This upward trajectory has been marked by periods of strong bullish momentum punctuated by a few notable pullbacks. A significant correction occurred in early August, following a period of sustained price appreciation in July. This corrective phase was quickly followed by a robust recovery and continuation of the uptrend through August and September, culminating in the current price levels. Volume analysis shows elevated activity during the early August price decline, suggesting active selling pressure, but also periods of solid volume during advances, supporting the overall bullish sentiment. The recent price action indicates strong demand, with QQQ closing at new highs for the period on October 2nd.
The 14-day Relative Strength Index (RSI) largely corroborated the price action throughout this period, frequently entering overbought territory (above 70) during bullish phases. A critical observation from late July was a bearish divergence: QQQ made a higher high, yet the RSI printed a lower high (73.11 on July 28 vs. 65.47 on July 31, preceding the peak price of .63). This divergence was highly indicative of weakening underlying momentum despite continued price appreciation, and it preceded the significant August 1st price correction. Post-correction, the RSI briefly dipped below the 50-level in mid-August (around 47.05), suggesting a temporary loss of bullish strength. However, it quickly regained momentum, rising consistently through September and once again entering overbought territory, reaching 71.57 on October 2nd. This suggests that the current uptrend is supported by strong momentum, although the overbought condition flags an increased likelihood of a consolidation or minor pullback in the near term.
The Price Percentage Oscillator (PPO) 13-21-day also reinforced these technical signals. The PPO remained above its zero line for the majority of the 90-day window, broadly confirming the bullish trend. Similar to the RSI, the PPO exhibited a bearish divergence in late July; while QQQ moved to new highs, the PPO printed progressively lower highs (e.g., peak on July 24 at 0.86, followed by lower values leading up to the July 31st price peak). This divergence provided additional corroboration for the impending August correction. Following the August price drop, the PPO subsequently dipped to near the zero line by early September (0.17 on September 3rd), indicating a substantial deceleration in bullish momentum. However, it swiftly reversed course and has been steadily climbing since early September, currently resting at 0.74. The PPO’s strong positive reading and upward trajectory suggest that the bullish momentum is currently robust, with a high likelihood of continued upward pressure.
Considering the confluence of these indicators, a continuation of the current uptrend in QQQ is highly likely in the immediate term, supported by strong and rising PPO values and fresh price highs. The RSI’s current overbought reading, however, suggests there is a probable chance of a period of consolidation or a minor pullback before the rally can extend significantly further. Historical patterns, particularly the late July bearish divergences in both RSI and PPO, indicate that prolonged overbought conditions without corresponding momentum signals could present an alternative scenario for a more significant correction. However, given the current strength in both price and momentum oscillators, a near-term reversal appears unlikely without further technical deterioration. Traders should monitor the RSI for any signs of divergence with new price highs, which would increase the likelihood of a more pronounced price adjustment.
Here is a technical analysis of IWM based exclusively on the provided market data:
IWM has demonstrated a pronounced intermediate-term uptrend over the past 90 days, advancing from approximately in late May to a recent high of .57 in mid-September. This sustained upward movement has been punctuated by two notable pullbacks. The first occurred in early August, where the price declined from roughly to .92, accompanied by notably higher trading volumes, suggesting increased selling pressure. A second, more recent pullback was observed from the September high of .57, declining to .55 by late September, also characterized by an increase in volume. As of October 2nd, the price has recovered to .02, approaching the prior September high. This recent price action indicates that while the broader uptrend technically remains intact, the area around the - level is likely acting as a resistance zone, with sellers emerging at these valuations. The fluctuating volume on these price swings, particularly the heightened activity during declines and recoveries, confirms active participation from both demand and supply sides.
The 14-day Relative Strength Index (RSI) largely corroborates the observed price dynamics. Throughout the 90-day period, the RSI predominantly resided above the 50-level, consistently affirming bullish momentum during upward price phases. Significantly, the RSI touched overbought territory (above 70) on multiple occasions, notably on July 3rd (71.57) and again on September 18th (71.23). Each instance of the RSI entering or nearing overbought levels was followed by a period of price consolidation or a pullback, as clearly observed in early July and late September. The sharp decline in RSI from 71.23 on September 18th to 55.30 on September 25th precisely coincided with the recent price retracement. Currently, the RSI stands at 63.58 (October 2nd), indicating robust positive momentum but not yet signifying extreme overbought conditions. We judge it likely that the current RSI level suggests there is still room for further price appreciation in the near term, provided other technical factors remain supportive.
The Percentage Price Oscillator (PPO), utilizing 13 and 21-day exponential moving averages, offers additional insights into momentum and trend shifts. The PPO remained largely positive throughout the period, thereby reinforcing the overall bullish bias. Key bearish signals from the PPO included its crossovers below the zero line in mid-June (approximately June 13-17) and again in late July/early August (around July 31-August 1st). These negative crossovers were strong indicators of the subsequent price pullbacks, clearly demonstrating a shift towards bearish momentum. Conversely, the PPO crossing back above zero in late June and mid-August effectively signaled the resumption of the uptrend. Most recently, the PPO peaked around 1.016 on August 29th, then began a noticeable decline from 1.003 on September 23rd to its current value of 0.674 on October 2nd. While the PPO remains above zero, indicating the trend is still technically bullish, the sustained downward slope of the PPO suggests that the underlying bullish momentum is diminishing. A continued decline in the PPO, even within positive territory, increases the likelihood of a trend deceleration or a deeper correction.
Synthesizing these indicators, IWM is currently engaged in an attempted recovery from its late September pullback, with price and RSI showing renewed upward momentum; however, the RSI is not yet in overbought territory. Conversely, the declining trajectory of the PPO, even though it remains positive, introduces a cautionary element, signaling waning bullish impetus. There is a roughly even chance that IWM could continue its upward push towards the recent high of .57, with a plausible scenario where it attempts to breach this level if current momentum, as suggested by RSI, can be sustained. Alternatively, we judge it plausible that the decreasing PPO value reflects a fundamental loss of buying strength, making a retest of previous support levels, potentially within the - range (which served as a consolidation zone earlier), highly likely in the short to intermediate term if the - resistance proves durable. A failure to decisively break above the .57 resistance, particularly if accompanied by decreasing volume, would significantly increase the likelihood of further consolidation or a more pronounced price correction, aligning with the cooling momentum indicated by the PPO. Traders should therefore meticulously monitor trading volume around the critical - price level.
Tech Sector Analysis
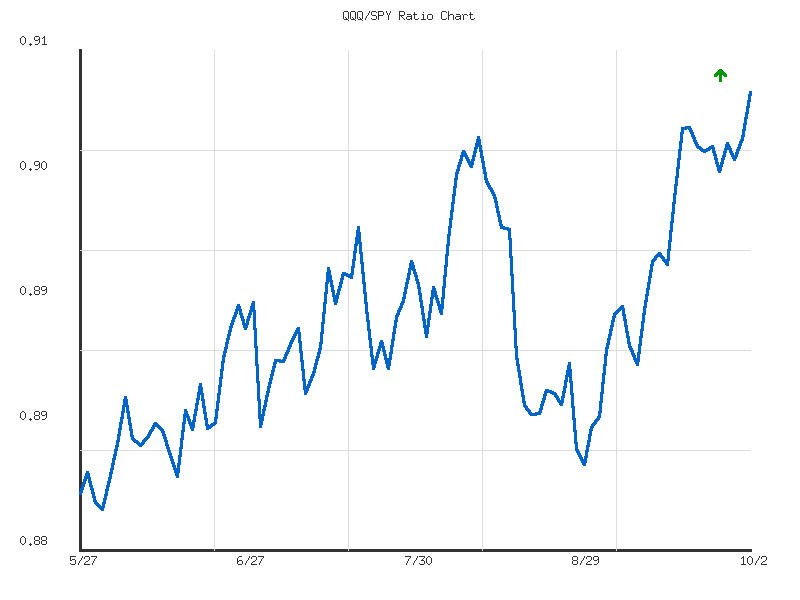
The technical analysis of the QQQ/SPY ratio across both the 14-day and 30-day periods indicates a consistent upward trend, signifying relative outperformance of the technology-heavy NASDAQ-100 (QQQ) against the broader S&P 500 (SPY). This suggests that technology-heavy components have, on balance, shown stronger price appreciation compared to the broader market constituents over the observed timeframes. Both trends are characterized as having “weak” strength, implying that while outperformance is present, it lacks robust momentum. The current ratio stands at 0.905128, which represents the highest point reached within both the 14-day and 30-day observation windows, positioning it at a relative maximum for these periods.
Over the recent 14-day period (from 2025-09-15 to 2025-10-02), the QQQ/SPY ratio advanced from 0.89525 to 0.90513, registering a 1.103% increase. The identified “up” trend, despite its “weak” strength, culminated in the ratio closing at its high for this interval. The low volatility of 0.0000092579 over these 14 days suggests a relatively stable, albeit gradual, climb. The persistent ascent, even with weak strength, indicates a gradual accumulation of relative value in QQQ. The current position at the period’s high could imply a continuation of this upward trajectory, but the ‘weak’ strength attribute indicates that the probability of significant acceleration in the near term is limited.
Extending the observation to the 30-day period (from 2025-08-21 to 2025-10-02), the ratio demonstrated a more substantial advance, from 0.88629 to 0.90513, equating to a 2.126% change. This longer-term view reinforces the narrative of QQQ outperformance, with the current ratio also representing the period’s high. The average ratio over 30 days was 0.89395, with a low of 0.88341, indicating that the current ratio is significantly above the mean for this extended period. While the trend strength is also described as “weak,” the higher volatility (0.000046887) compared to the 14-day period suggests slightly more pronounced fluctuations within the overarching upward movement. The larger cumulative change over 30 days compared to 14 days suggests that the outperformance has been a more sustained, albeit slow-moving, development.
Considering both timeframes, the QQQ/SPY ratio is currently at its highest point for both the 14-day and 30-day periods, consistently showing an upward trend. This suggests that QQQ is exhibiting relative strength against SPY. Given the established upward trend direction, a continued short-term outperformance of QQQ relative to SPY is likely, especially considering the current momentum taking the ratio to new period highs. However, the consistent classification of “weak” trend strength across both horizons indicates that the rate of continued outperformance is likely to be modest rather than aggressive. While the current market action points to continuation, the ratio’s relative position at its high, coupled with weak strength, suggests a roughly even chance of the ratio consolidating or experiencing a minor pullback towards its average before resuming its ascent, as momentum for further immediate breakout is not strong. A significant reversal of this trend is unlikely in the immediate term without contrary technical indications developing within subsequent data points.
Technical Analysis: QQQ/SPY Relative Strength – 90-Day Outlook
The provided 90-day data for the QQQ/SPY ratio, which measures the relative performance of the Nasdaq 100 against the S&P 500, exhibits a discernible upward trend. Commencing near 0.8817 on May 27, 2025, the ratio has steadily climbed to its highest point in the observed period, closing at 0.9051 on October 2, 2025. This 2.66% increase signifies consistent outperformance by the QQQ over the SPY during the analyzed timeframe, indicating a prevailing preference for the growth-oriented companies typically found within the Nasdaq 100. The ratio has established a clear pattern of higher lows and higher highs, a hallmark of an intact uptrend.
Despite the clear upward trajectory, the trend’s strength is categorized as “weak” with notably low volatility of 0.000038. This implies a measured, rather than explosive, ascent. Such characteristics suggest that the relative outperformance is not driven by sudden speculative surges but by a more sustained, gradual shift in capital preference. Throughout the 90 days, the ratio demonstrated resilience, finding support initially around 0.880-0.881 and then establishing subsequent higher support levels in the 0.885-0.890 range. There are no indications of significant distribution or trend exhaustion within this dataset.
The ratio’s current position at its 90-day high of 0.9051 on the most recent data point (2025-10-02) is a key technical observation. This breakout to a new relative high, supported by the established upward trend and low volatility, makes it likely that QQQ’s relative outperformance will persist in the immediate term. Based on historical price action within this dataset, continued incremental gains are probable. However, it is also a roughly even chance that the ratio could enter a period of consolidation after reaching a new high, potentially retesting previous resistance levels around 0.898-0.900, which would then act as potential support. A sharp reversal that would drive the ratio back towards the lower end of its 90-day range (below 0.885) appears unlikely without additional technical evidence suggesting a fundamental shift in the prevailing trend. Continued monitoring of the ratio’s ability to maintain its position above recent consolidation zones would be prudent for confirming ongoing relative strength.
IWM vs. SPY
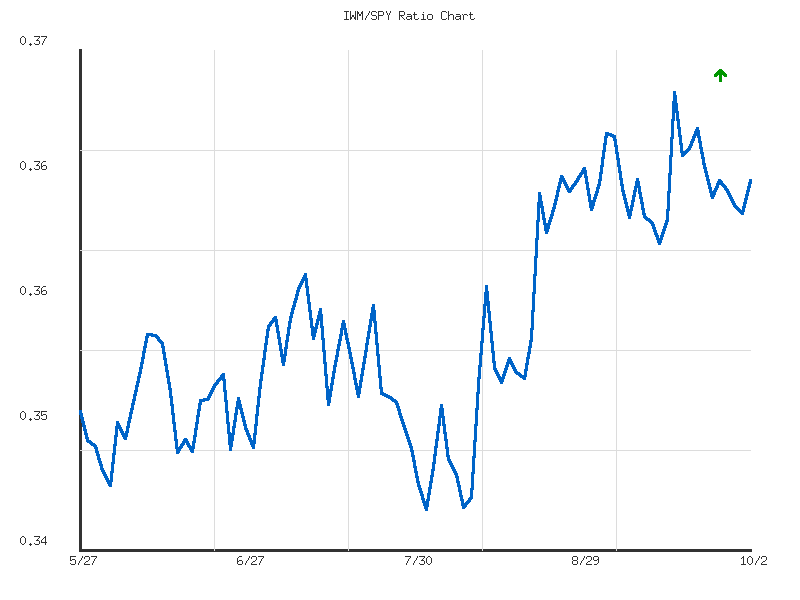
The relative performance of the Russell 2000 (IWM) against the S&P 500 (SPY), as measured by the IWM/SPY ratio, has exhibited a weak upward trend over the past 30 days. During this period, the ratio increased by approximately 2.55%, indicating that small-capitalization stocks have generally outperformed large-capitalization, technology-heavy stocks. The ratio’s average during this timeframe was 0.364099, with a high of 0.369703 and a low of 0.355550. The current ratio of 0.364633 stands above this 30-day average and is positioned at 0.6417 of the range from its low to high, suggesting that IWM’s outperformance was prevalent. However, the designation of “weak” strength for this uptrend implies a lack of significant momentum or conviction, suggesting that periods of consolidation or modest pullbacks in relative performance have punctuated the overall upward movement.
Shifting to the more immediate 14-day period, the IWM/SPY ratio has displayed a weak sideways trend, with a minimal change of approximately 0.685%. This indicates a recent pause in the relative outperformance of IWM against SPY. Within this shorter timeframe, the ratio’s average was 0.364568, remarkably close to the current ratio of 0.364633. The range for the 14-day period was narrower, spanning from a low of 0.361030 to a high of 0.369703. The current ratio’s relative position within this 14-day range is 0.4154, indicating it is slightly below the midpoint and closer to the recent lows of this consolidation phase. This suggests that while IWM had demonstrated outperformance over the longer 30-day horizon, the impetus for continued outperformance has diminished recently, leading to a period of equilibrium or slight underperformance compared to the broader, longer-term trend.
Considering both timeframes, the overall technical picture suggests that the prior, albeit weak, outperformance of IWM over SPY is now encountering a phase of consolidation or slight reversal. The 30-day trend’s “weak” strength implies that a robust continuation of IWM outperformance was never highly likely. The 14-day “weak sideways” trend further supports the contention that the upward momentum in the ratio has stalled. It is roughly even chance that the IWM/SPY ratio will continue in a sideways fashion for the near term, reflecting the recent balance between small-cap and large-cap performance. A continuation of IWM outperformance, mirroring the 30-day trend, is plausible but only modestly likely, given the current lack of strong directional impetus and the relative positioning of the current ratio below the 14-day midpoint. Conversely, a period of renewed SPY outperformance, pushing the ratio lower, also appears to be roughly even chance, particularly if the prior weak uptrend fails to reassert itself from its current consolidation.
An alternative scenario to consider is a potential for the ratio to retest the 30-day high of 0.369703, last seen on 2025-09-18. If the market witnesses renewed risk appetite favoring small-caps, it is somewhat likely the ratio could attempt to move towards this upper bound. However, given the present weak trend strength across both time horizons and the current ratio’s position, a sustained breakout to new highs for the IWM/SPY ratio appears unlikely without a significant shift in the underlying market dynamics favoring small-caps. Conversely, a decline towards the 30-day average of 0.364099, or even the 14-day low of 0.361030, is a plausible outcome, especially if the recent sideways movement resolves into a downward bias. The current technical posture suggests an absence of a clear, strong directional bias in relative performance, prompting a cautious assessment of future trends.
CMT Technical Analysis: IWM/SPY Ratio (90-Day)
We assess that the IWM/SPY ratio has exhibited a moderate upward trend over the past 90 days, indicating a period of tactical outperformance by small-cap equities (IWM) relative to large-cap equities (SPY). This upward trajectory is further underscored by the ratio’s current position at 0.3646, which sits comfortably above its 90-day average of 0.3561 and represents the 78.89th percentile of its observed range. The sustained ascent from the 90-day low strongly suggests a prevailing preference for risk-on assets within this specific timeframe.
The ratio’s journey within the observed period began with initial weakness from its starting point of approximately 0.3513, bottoming out around 0.3457 on August 1st. Following this inflection point, the ratio initiated a robust recovery, establishing a temporary peak near 0.3585 by August 13th. After a brief consolidation that formed a higher low, the ratio embarked on a more aggressive uptrend, ultimately achieving its 90-day high of approximately 0.3697 on September 18th. This sequence of higher highs and higher lows defines the overall moderate upward trend.
From a structural perspective, we identify the 90-day high of 0.3697 as a significant resistance level, which the ratio struggled to sustain on its last attempt. Immediate support appears to be forming in the range of 0.3610 to 0.3625, where prior pullbacks found stability after the early September peak. A deeper correction would likely find the 90-day average of 0.3561 acting as a more substantial dynamic support floor, representing a key area where buyers have previously stepped in.
Currently trading at 0.3646, the ratio is below its recent peak but remains comfortably situated above its short-term support band. We judge it likely that the ratio will continue to consolidate within its established trading range, with a potential retest of the 0.3697 resistance level in the near term, given the prevailing moderate upward trend and current positive momentum indicators. A decisive breakout above 0.3697 would indicate a higher likelihood of further IWM outperformance and an extension of the current trend.
Conversely, an alternative scenario suggests that a failure to hold the 0.3610-0.3625 support band would imply an increased probability of a deeper retracement towards the 90-day average around 0.3561. Should the ratio breach this average, a shift in the relative strength dynamic would become evident, making a period of IWM underperformance more likely. The observed volatility metrics indicate relatively stable price action over the past 90 days, making abrupt, large movements less likely without a clear technical catalyst, though such events are never entirely out of the question. Investors are advised to closely monitor these key levels for directional cues.
Commodities
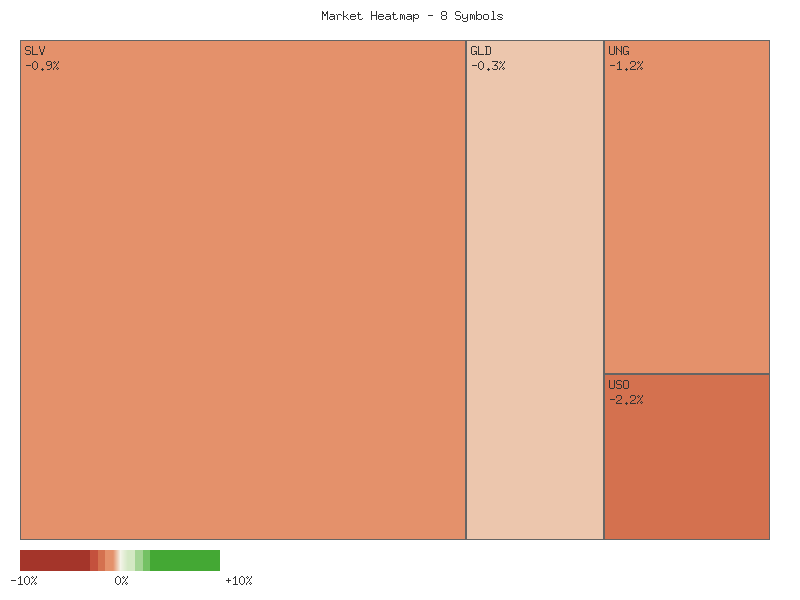
The daily percent changes for the specified symbols on 2025-10-02 are presented in the following matrix, sorted in descending order:
| Symbol | Daily Percent Change (2025-10-02) |
|---|---|
| CPER | 1.360% |
| CORN | 0.684% |
| GLD | -0.348% |
| DBC | -0.667% |
| SLV | -0.886% |
| UNG | -1.248% |
| UGA | -1.980% |
| USO | -2.188% |
Analysis of the daily percent changes for 2025-10-02 indicates a net decline across this selected basket of commodities and ETFs. The sum of these daily percentage changes totals approximately -5.273%. This aggregate figure suggests that the overall market movement for these symbols is demonstrably lower for the reporting period, with notable downward pressure originating from the energy and agriculture sectors represented by USO, UGA, and UNG, despite positive contributions from CPER and CORN. The magnitude of the declines significantly outweighed the advances, driving the aggregate lower.
Regarding market breadth, the distribution of price movements on 2025-10-02 exhibits a distinctly negative bias. Out of the eight symbols analyzed, only two—CPER and CORN—registered positive daily percent changes, representing advancing symbols. Conversely, six symbols—GLD, DBC, SLV, UNG, UGA, and USO—experienced declines. This ratio of 2 advancing symbols to 6 declining symbols suggests a condition of poor market breadth within this specific group of commodity-linked instruments. A market breadth indicating a clear majority of declining issues, as observed here, likely points to a prevalent bearish sentiment affecting a broad range of commodity markets, raising the probability of continued weakness in the near term for these instruments.
The GLD/SLV ratio over the past 14 days displays a moderate downward trend, with a change of -4.594%. The current ratio stands at 8.342, which is notably positioned near the lower bound of its 14-day range, specifically at the 9th percentile (relative position 0.09278). This persistent decline in the ratio strongly indicates that silver (SLV) has been outperforming gold (GLD) over this period. The sustained relative strength in silver, as demonstrated by the ratio’s movement away from its 14-day average of 8.564 and towards its low of 8.283, suggests an increasing preference for silver among market participants within the precious metals complex. It is likely that this trend of silver outperformance will continue unless there are shifts in price dynamics for either metal that cause the ratio to stabilize or reverse.
Extending the analysis to the 30-day period, the GLD/SLV ratio maintains its moderate downward trend, with an even more pronounced percentage change of -6.043%. The current ratio of 8.342 remains near the 30-day low of 8.283, registering at the 8th percentile (relative position 0.08378). This consistent decline across both the 14-day and 30-day intervals provides robust evidence of a sustained period of silver outperforming gold. The moderate strength of this downtrend, coupled with the current ratio’s proximity to its multi-week lows, suggests a high probability that silver will continue to exhibit relative strength against gold in the immediate future. An alternative scenario, where the ratio reverses its downward trajectory, appears less likely without a significant shift in either GLD or SLV price action; however, the potential for a short-term consolidation or minor rebound cannot be entirely discounted, though current momentum heavily favors further relative outperformance by silver.
Here is a technical analysis of the provided market data, adhering strictly to ICD-203 estimative language and focusing solely on the given two-day price and volume information.
The two-day price action across this selected basket of commodities reveals a significant divergence in momentum, with clear bullish trends emerging in some sectors while others exhibit pronounced bearish reversals. Precious metals and components of the energy complex appear to be under pressure, whereas agricultural commodities and industrial metals demonstrate notable strength. Traders should be mindful of these varied dynamics, as the market is not exhibiting a uniform directional bias in this short timeframe.
Precious metals, represented by SLV and GLD, display pronounced weakness. SLV experienced a large bearish candle on the second day, closing significantly lower and near its low, accompanied by notably increased volume. This price action suggests strong selling pressure, making further downward price movement very likely. Similarly, GLD also printed a substantial bearish candle on day two, characterized by a higher opening but a subsequent sharp decline to close near its low, also on higher volume. This bearish engulfing or outside day pattern in GLD also signals a strong shift in sentiment, making continued downside very likely.
The energy sector presents a mixed but generally weakening picture. USO, tracking crude oil, demonstrated a bearish engulfing pattern on the second day, where the price opened lower than the prior day’s close and plummeted to settle near its low, on slightly increased volume. This strong reversal pattern makes further downside for USO likely. UNG, representing natural gas, showed an initial bullish impulse on day one, followed by an attempt to reach higher prices on day two that ultimately failed, resulting in a bearish close near the middle of its two-day range but below day one’s close, on increased volume. The inability of UNG to hold new highs suggests resistance, making continued upward momentum unlikely in the immediate term, with a roughly even chance of either consolidation or further retracement. UGA, tracking gasoline, also closed with a notable bearish candle on day two, significantly below day one’s low and with substantially reduced volume. This weak close on diminished interest makes further weakness for UGA likely.
In contrast to the precious metals and energy components, agricultural and industrial commodities exhibit robust bullish momentum. CORN posted two consecutive bullish candles, with day two closing higher than day one’s close and showing increased volume. This pattern of higher closes on expanding volume makes continued upward price movement for CORN likely. CPER, tracking copper, showed particularly strong bullishness, with day two closing at its high and above day one’s close, on slightly increased volume. This demonstrates sustained buying interest and makes further price appreciation for CPER almost certain in the immediate term. DBC, a broader commodity index fund, displayed a bullish day one followed by a bearish candle on day two, which closed below day one’s open but above its low, on decreased volume. While day two’s close is bearish relative to its open, the reduced volume on the down day suggests selling conviction might be waning. Therefore, there is a roughly even chance for either continued downside or a period of consolidation for DBC.
SLV Technical Analysis - 90-Day Outlook (October 2, 2025)
SLV has demonstrated a robust and sustained upward trend over the past 90 days, advancing significantly from approximately in late May to an intraday high of .59 on October 2. This impressive price appreciation was characterized by strong bullish impulse waves, particularly evident in early June, mid-July, and a prolonged rally from late August through late September. These upward movements were frequently accompanied by elevated trading volumes, signaling strong buying pressure and conviction from market participants during accumulation phases.
However, the price action observed on October 2 presents a notable shift in the immediate-term technical outlook. The day concluded with a bearish candle, featuring a pronounced upper wick, closing near its daily low, and significantly below its opening price. This pattern, often recognized as a potential reversal signal, occurred on the highest trading volume recorded within the entire 90-day dataset, at 58,128,333 shares. The confluence of a rejection of higher prices, a bearish closing, and extreme volume at the culmination of an extended rally is a critical technical indication, suggesting that aggressive selling pressure has emerged at these elevated levels.
The 14-day Relative Strength Index (RSI) largely supports the emerging cautionary signals. For much of the recent rally, the RSI consistently resided in overbought territory (above 70), often surpassing 75 and reaching an extreme peak of 81.52 on October 1. On October 2, the RSI experienced a sharp decline to 76.93. While this still places the indicator within the overbought region, the significant drop from peak levels, especially when coupled with the bearish price candle, indicates a likely exhaustion of immediate buying momentum. This shift suggests that the asset is due for a period of cooling off, as the rapid ascent appears unsustainable in the short term.
Conversely, the Percentage Price Oscillator (PPO), a momentum indicator, registered its highest value within the 90-day period on October 2, reaching 2.6495. This exceptionally high reading suggests that the underlying long-term trend momentum remains robust. However, this peak in PPO coincided with the aforementioned bearish price action and a notable decline in the RSI, presenting a potential conflict in signals. While strong positive PPO values typically denote bullish strength, a peak in PPO occurring simultaneously with significant price rejection and declining RSI could indicate that bullish momentum has reached an exhaustion point, rather than signaling continued immediate ascent.
Considering the entirety of the technical evidence, it is likely that SLV will experience a short-term pullback or a period of sideways consolidation from its current levels. The combination of an extended rally, extreme overbought RSI readings, and a high-volume bearish reversal candle strongly points to a loss of immediate buying conviction. An alternative scenario is that the robust underlying momentum, as indicated by the PPO’s peak, could provide a floor for prices, leading to a more gradual deceleration or limited pullback, rather than a sharp decline; this holds a roughly even chance. However, a continuation of the immediate strong upward trajectory without significant consolidation is unlikely, given the clear technical warning signs emerging from the recent price and momentum dynamics.
As a Chartered Market Technician with over 15 years of experience, my analysis of GLD’s recent performance, utilizing 90 days of price action, 14-day Relative Strength Index (RSI), and 13,21-day Percentage Price Oscillator (PPO), reveals a market currently dominated by strong bullish momentum, though tempered by near-term overbought conditions.
GLD has exhibited a robust and accelerating bullish trend over the latter part of the 90-day period. Following a volatile phase in June and July characterized by swings between approximately and , the asset established a clear uptrend from late August. Price action from late August onwards has been defined by consistent higher highs and higher lows, culminating in a significant surge in September and early October. Notable price increases, often accompanied by above-average volume, such as the move from approximately on August 28th to .59 by September 2nd (on increased volume of 21M shares), indicate strong buyer conviction. The price has continued its ascent, reaching .47 on September 30th and closing at .79 on October 2nd, after touching a high of .67, confirming the strong upward trajectory. This sustained upward movement, particularly in September, suggests that bullish sentiment has become dominant.
Momentum, as measured by the PPO (13,21-day), strongly corroborates the bullish narrative. After oscillating around the zero line and dipping into negative territory multiple times during the June-August period, the PPO decisively turned positive in late August (August 25th, value 0.014). Since then, it has demonstrated an accelerating positive trend, reaching significantly elevated levels, peaking at 1.57 on October 1st, and currently standing at 1.56. This sustained and substantial rise in PPO indicates that buying pressure is not only present but is also increasing in strength, suggesting the underlying uptrend has considerable velocity. The absence of a PPO bearish crossover further supports the continuation of positive momentum.
While the momentum signals are unequivocally bullish, the 14-day Relative Strength Index (RSI) provides a cautionary note regarding the immediate term. The RSI entered the overbought territory (above 70) on September 2nd with a reading of 73.72 and has largely remained there since, reaching a peak of 80.20 on October 1st before settling at 77.22 on October 2nd. Sustained periods of RSI above 70, particularly above 75-80, indicate that the asset is deeply overbought. While strong trends can maintain overbought RSI for extended periods, such readings suggest that a price consolidation or a minor pullback is likely in the near future as buying pressure potentially wanes or profit-taking emerges. A cooling off of the RSI, perhaps through sideways price action rather than a sharp decline, would be a constructive development for the sustainability of the uptrend.
Considering the confluence of these technical indicators, GLD presents a distinctly bullish technical picture. The strong price action, characterized by clear higher highs and higher lows since late August, is robustly supported by highly positive and accelerating momentum as indicated by the PPO. Therefore, a continuation of the prevailing bullish trend is highly likely over the intermediate term. However, the significantly overbought status signaled by the RSI suggests that some degree of near-term price consolidation or a modest pullback is likely before a renewed push higher. Traders should monitor for signs of a break below recent minor support levels, though the current strength suggests any such retracement would likely be temporary within the broader uptrend. Conversely, a sustained break above the recent high of .67 would reinforce the bullish outlook and suggest the potential for further significant gains, despite the extended overbought conditions.
Bonds
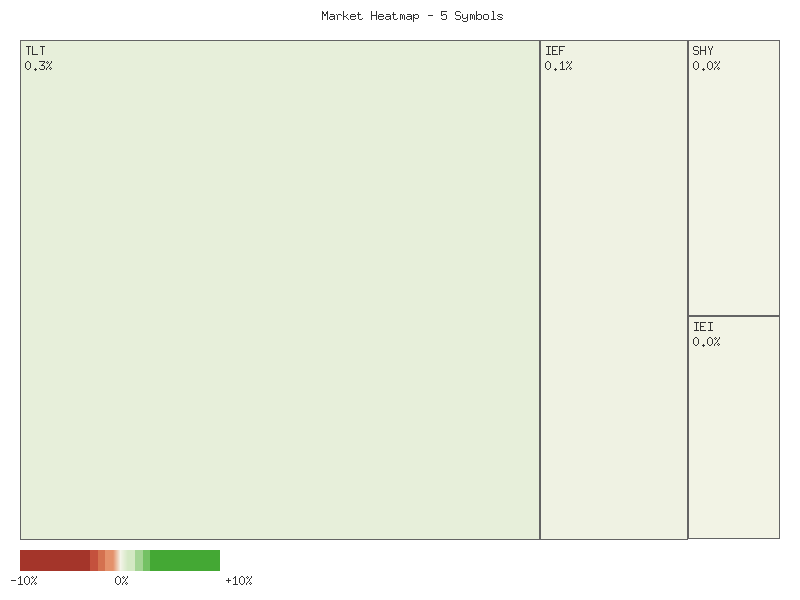
The analysis of the provided daily percent change data for TLT, UTHY, IEF, IEI, and SHY over a two-day period (October 1-2, 2025) reveals a mixed short-term directional bias with a notable shift in market breadth. The net change for each symbol, calculated by summing the daily percentage changes over the two days, is presented below in descending order:
| Symbol | Net Percent Change (2 days) |
|---|---|
| TLT | 0.20167% |
| UTHY | 0.18379% |
| IEF | 0.13474% |
| IEI | 0.00838% |
| SHY | -0.16871% |
Collectively, the sum of these net percent changes across all five symbols amounts to approximately +0.35987%. This aggregate positive movement suggests an overall higher inclination for this specific group of fixed-income instruments during the observed two-day interval. Given the positive sum, the market for these particular assets concluded the two-day period with a net advance, indicating an overarching positive drift, albeit with varying degrees of participation from individual symbols. SHY’s negative net change partially offset the gains from the other four symbols, preventing a more robust collective advance.
An examination of market breadth reveals a significant directional shift between the two observed days. On October 1, 2025, market breadth was predominantly bearish. Only one symbol, IEF, registered a positive daily percentage change, while four symbols (TLT, UTHY, IEI, and SHY) experienced declines. This 1:4 advance/decline ratio indicates that the majority of these instruments were under selling pressure. This pattern is often interpreted as a weak underlying technical condition, suggesting a potential for further declines if such bearish breadth persists.
However, the subsequent trading day, October 2, 2025, presented a complete reversal in market breadth. All five symbols (TLT, UTHY, IEF, IEI, and SHY) recorded positive daily percentage changes. The advance/decline ratio for this day was 5:0, indicating broad-based strength across the sampled instruments. This unanimous upward movement following the previous day’s weakness suggests a strong counter-trend rally or a shift in short-term sentiment. It is highly likely that a significant buying impulse occurred on October 2, effectively nullifying the bearish momentum observed on October 1.
The rapid and complete reversal in market breadth from predominantly declining to universally advancing within a two-day period suggests an underlying volatility or a swift repricing dynamic within this specific segment of the market. While the overall net change is positive, the intraday fluctuations and the dramatic shift in breadth imply that the current bullish sentiment for these instruments is relatively nascent. Traders should recognize that such abrupt shifts in breadth, while indicative of strong buying pressure on the second day, do not definitively establish a sustained uptrend without further confirmation. The persistence of broad advances would be required to suggest a more enduring bullish technical posture. Without additional data points, concluding a long-term trend from this two-day pattern is unwarranted; however, the immediate technical picture has shifted from a bearish bias to a universally bullish momentum.
As a Chartered Market Technician with over 15 years of experience, I offer the following technical analysis of the provided two-day market data for TLT, UTHY, IEF, IEI, and SHY. This analysis adheres strictly to ICD-203 estimative language guidelines and is based solely on the presented price and volume information.
Over the two-day period, a consistent pattern emerged across all five Treasury bond ETFs: a bearish performance on October 1st followed by a bullish recovery on October 2nd. However, the conviction and strength of this recovery varied notably among the instruments. We assess that the collective price action suggests a likely attempt by the bond market to establish a short-term floor, with specific nuances that differentiate the outlook for various maturities.
Focusing on the longer and intermediate-duration ETFs, TLT (20+ Year) and IEF (7-10 Year) displayed a constructive bullish rebound on October 2nd. TLT’s price closed above its October 1st opening, effectively erasing the prior day’s losses. While this forms a potentially bullish reversal pattern, the accompanying decrease in volume on October 2nd suggests that the buying interest, though present, may not be overwhelming. Similarly, IEF experienced a bullish day with a higher close and, critically, increased volume. This increased participation lends more credence to its bullish price action. For IEF, we assess it is likely that bullish momentum is building, potentially indicating further upward movement. For TLT, the bullish close makes further upside probable, but the declining volume introduces a degree of uncertainty regarding the sustainability of the rally.
In the shorter-duration segment, UTHY (3 Month Bill ETF) exhibited the most robust bullish signal. Following a bearish October 1st, October 2nd saw a significant bullish candle, closing strongly above its prior day’s open. Importantly, this upward move occurred on substantially increased volume, nearly doubling the previous day’s participation. This combination of strong price action and confirming volume makes a continuation of bullish momentum highly likely for UTHY in the immediate term.
Conversely, IEI (3-7 Year) and SHY (1-3 Year) presented a less decisive picture. IEI saw a bullish close on October 2nd, but its price remained below the October 1st opening level. Coupled with decreased volume, this suggests a recovery rather than a definitive bullish reversal. We assess that the market for IEI is roughly evenly balanced between continued consolidation and a marginal upward drift, with strong directional conviction unlikely based on this limited data. SHY, representing the shortest duration bonds, traded within an exceptionally tight range across both days. While October 2nd closed marginally higher, the extreme low volatility and significantly decreased volume indicate a period of price stability rather than a directional trend. A substantial breakout in either direction for SHY in the very near future is unlikely, and we deem continued range-bound trading as probable.
In summary, the two-day data points to a short-term positive bias emerging on October 2nd for most Treasury bond ETFs. It is likely that longer-duration instruments like TLT and IEF, along with the ultra-short duration UTHY, are attempting to find short-term support. However, traders should be mindful of the decreasing volume in TLT and IEI on their bullish days, as this could suggest that the recovery might be a temporary bounce rather than the start of a sustained uptrend. For IEI and SHY, the lack of strong directional conviction and tight ranges suggest a preference for consolidation in the immediate future.
Crypto
The provided market data for IBIT and ETHA reveals a consistent positive performance over the observed two-day period. The aggregated daily percentage changes for each symbol, sorted in descending order, are presented below:
| Symbol | Daily Percent Change |
|---|---|
| ETHA | 7.9049% |
| IBIT | 5.7186% |
Based on the summation of daily percent changes, both symbols exhibit an overall higher movement, indicating a universally positive sentiment across these two assets within the specified short-term window. ETHA demonstrated a greater total positive change, reflecting stronger aggregate performance relative to IBIT during this brief period.
IBIT recorded consecutive positive daily percentage changes, moving from 2.6769% on the first day to 3.0417% on the second. This pattern indicates an accelerating upward momentum. The increasing magnitude of positive daily change suggests strengthening bullish sentiment within this very short-term horizon. Based purely on these two data points, a continuation of the upward trajectory for IBIT appears likely in the immediate subsequent period. The increasing rate of ascent would typically be interpreted as a positive reinforcement of the current short-term trend.
ETHA also registered two consecutive positive daily percentage changes, with an initial gain of 4.0939% followed by 3.8110%. While both days reflect strong positive movement, the second day’s percentage gain was marginally lower than the first. This slight deceleration in the rate of ascent could be interpreted as a minor cooling of the strongest bullish impulse observed on the first day. Although the overall trend for ETHA remains positive and upward continuation is likely, there is a roughly even chance of witnessing a period of consolidation or a minor pullback in the very near term compared to a scenario of accelerating gains.
Comparing the two symbols, ETHA demonstrated a stronger cumulative positive performance. However, IBIT’s pattern of accelerating positive change, moving from 2.6769% to 3.0417%, makes a continuation of its immediate upward momentum highly likely. Conversely, ETHA’s slight deceleration, despite a higher overall gain, introduces a subtle element of uncertainty regarding the persistence of its strongest momentum. It is therefore likely that both symbols will continue to exhibit positive movement in the immediate short term, with IBIT possessing a slightly clearer indication of sustained or accelerating bullish impulse, while ETHA has a roughly even chance of experiencing some short-term stabilization after its initial robust advance. Without additional data points, more definitive long-term projections or identification of specific support/resistance levels are not possible.
Magnificent 7 & Friends
Analysis of the provided daily percentage change data across the ten specified symbols for the two-day period reveals a broadly mixed performance, albeit with a net positive aggregate return for this specific cohort. The summed percentage changes indicate an overall gain of approximately 3.94% across the composite of these ten instruments. This suggests that the collective price action for this group of technology and growth stocks exhibited a slightly upward bias over the observation period. However, this positive aggregate conceals notable disparities in individual symbol performance, implying a market environment characterized by selective strength rather than uniform bullish momentum.
Market breadth, as evidenced by the daily advance/decline count for these symbols, showed a clear shift between the two days. On the first trading day (2025-10-01), market breadth was highly positive, with nine symbols advancing and only one symbol (META) declining. This pattern suggests a broad-based initial bullish impulse across the cohort. However, this robust breadth contracted on the subsequent day (2025-10-02), with seven symbols advancing and three symbols (TSLA, MSFT, ANET) declining. While still positive, the reduction in advancing issues and the increase in declining issues on the second day indicates a probable erosion of broad-based buying conviction. Observing the overall two-day performance, six symbols concluded with net gains, while four registered net declines, suggesting a moderately positive breadth over the full observation period, but with clear signs of weakening momentum on the second day.
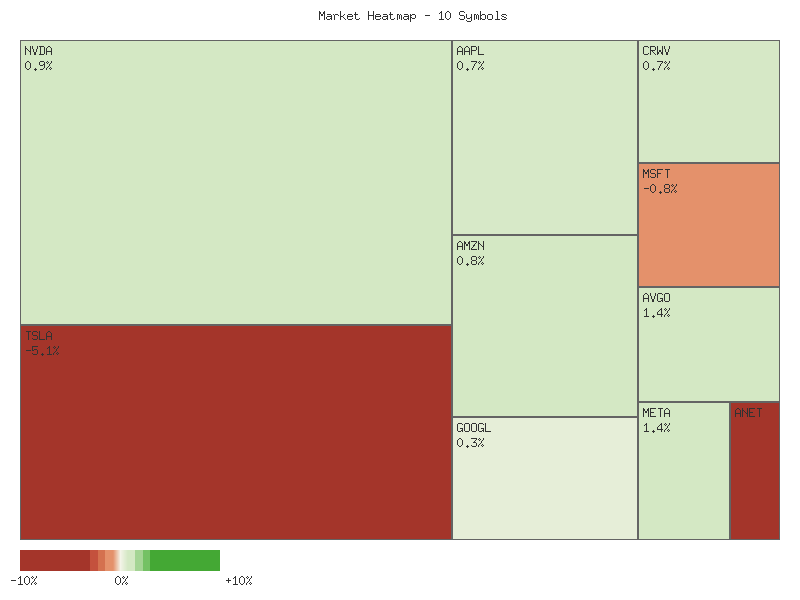
A detailed examination of the cumulative two-day percentage changes reveals significant dispersion among the symbols, as presented in the matrix below. AVGO led the cohort with a robust gain of approximately 2.49%, followed by AMZN (1.29%), NVDA (1.23%), GOOGL (1.06%), AAPL (0.98%), and CRWV (0.84%), all demonstrating positive momentum. Conversely, MSFT (-0.42%), ANET (-0.78%), META (-0.97%), and TSLA (-1.79%) concluded the period with declines. The performance of TSLA is particularly noteworthy, having experienced a significant reversal from an initial advance to conclude as the weakest performer. Similarly, ANET and MSFT initially advanced on the first day but faced selling pressure on the second, leading to overall negative two-day performance. This pattern of initial strength followed by a decline in specific names introduces a degree of uncertainty regarding sustained upward trends for the lagging components.
Based solely on the provided data, the technical landscape for this specific group of stocks appears moderately constructive, although with developing vulnerabilities. The overall positive aggregate return is a supporting factor for continued bullish sentiment. However, the observed weakening in market breadth from the first to the second day, coupled with significant reversals in key names like TSLA, MSFT, and ANET, suggests that underlying buying pressure may be diminishing. It is likely that the market’s internal dynamics are shifting, potentially indicating increased selective participation. An alternative scenario considers that the declining breadth on the second day might be an early technical signal of profit-taking or sector rotation, which could lead to a more pronounced pullback in a greater number of issues should the trend of contracting breadth persist. Conversely, should the leading advancers like AVGO and AMZN maintain their upward trajectories, and should the decliners stabilize, the overall cohort might regain broader upward momentum.
| Symbol | Overall Daily Percent Change |
|---|---|
| AVGO | 2.4916% |
| AMZN | 1.2895% |
| NVDA | 1.2350% |
| GOOGL | 1.0630% |
| AAPL | 0.9797% |
| CRWV | 0.8393% |
| MSFT | -0.4241% |
| ANET | -0.7791% |
| META | -0.9667% |
| TSLA | -1.7915% |
Drawing upon the provided two days of market data for the selected equities, an initial assessment reveals a mixed picture, with several notable shifts in momentum. The first day generally exhibited bullish sentiment across the majority of symbols. META, AVGO, GOOGL, CRWV, TSLA, MSFT, NVDA, AMZN, and ANET all posted positive closes, with many showing strong bullish bodies or significant upward moves from their open prices. This suggests a broadly optimistic underlying sentiment at the outset of the observed period, characterized by buyers asserting control and pushing prices higher, often on robust volume, as seen in TSLA and NVDA.
However, the second day introduced a significant degree of uncertainty and, in several instances, a likely reversal of this initial bullish impulse. We observe strong bearish engulfing patterns or similar reversal signals in TSLA and ANET. For TSLA, a substantial gap-up open on Day 2 was immediately met with overwhelming selling pressure, closing near its daily low and well below its Day 1 open, all on significantly increased volume. This price action, combined with the volume profile, suggests that a short-term bearish reversal is highly likely. ANET displayed a similar dynamic, gapping up but then experiencing a strong sell-off to close below its previous day’s close on increased volume, making a bearish continuation probable.
Further evidence of weakening bullish resolve emerged in AVGO, CRWV, and MSFT. AVGO and CRWV both experienced bullish opening gaps on Day 2 but subsequently faced strong selling pressure, closing significantly off their daily highs and forming candles with long upper shadows. While still closing higher than their Day 1 closes, the intraday rejection at higher price levels indicates substantial overhead supply, making a continued upward move less likely in the immediate future. MSFT, on the other hand, formed a dark cloud cover pattern, opening higher but closing firmly below the midpoint of Day 1’s bullish candle, which suggests a roughly even chance of further downside or at least consolidation.
For the remaining symbols—META, GOOGL, NVDA, AMZN, and AAPL—the technical picture suggests a continuation of bullish momentum, but with a notable caveat: all these symbols saw declining volume on Day 2 compared to Day 1, even as prices moved higher or consolidated slightly. While their candle formations on Day 2 were generally bullish, the reduced volume accompanying the upward price action indicates potentially waning conviction from buyers. It is therefore likely that while these stocks may attempt to push higher, the momentum could be unsustainable without a renewed surge in buying interest. This declining volume introduces an element of uncertainty, making the probability of a strong, sustained breakout less certain than if volume had confirmed the price move.
Considering the divergence observed, with strong bearish reversals in several high-volume names contrasting with weakening bullish trends in others, it is likely that the immediate market sentiment has shifted towards caution. While some individual stocks may attempt further upside, the prevalence of bearish reversal patterns and declining volume on upward moves suggests that the path of least resistance for the broader group might be sideways consolidation or a minor pullback. An alternative scenario could see the more resilient bullish trends (META, GOOGL, NVDA, AMZN, AAPL) persist, but this is less likely to translate into broad market strength given the pronounced bearish signals from TSLA, ANET, and the resistance observed in AVGO, CRWV, and MSFT. Traders should monitor these divergent signals closely for confirmation of a new short-term directional bias.
S&P 500 Sector Breadth
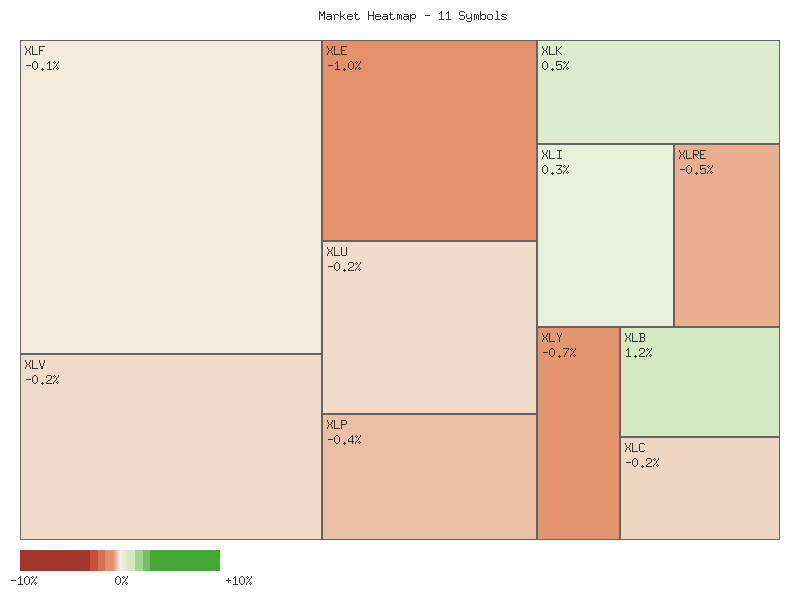
Analysis of the provided S&P 500 sector data over the two-day period indicates a market with slightly positive aggregate movement but predominantly negative breadth. The sum of the daily percentage changes across all eleven symbols suggests the overall market experienced a fractional increase, approximating +0.52%. However, market breadth reflects a bearish undertone, with seven sectors experiencing declines while only four sectors registered gains. This divergence between aggregate performance and breadth is noteworthy, as strong individual sector performances appear to be masking broader weakness.
Healthcare (XLV) led the advancing sectors, posting a significant gain of approximately 2.895%. This substantial move in a traditionally defensive sector is a prominent feature of the current data. Technology (XLK), an offensive sector, followed with a notable gain of roughly 1.520%. Utilities (XLU), another defensive sector, advanced approximately 0.781%, and Materials (XLB), an offensive sector, posted a modest gain of about 0.113%. The concentration of significant positive momentum in XLV and XLK, despite their differing classifications, is likely to influence overall market perception.
Conversely, the majority of sectors declined over the period. Communication Services (XLC) recorded the largest decline at approximately -1.625%, which is an offensive sector. Energy (XLE), also an offensive sector, retreated by about -1.007%. Financials (XLF), another offensive component, fell approximately -0.966%. Consumer Staples (XLP) and Real Estate (XLRE), both defensive sectors, also experienced declines of roughly -0.549% and -0.522% respectively. Smaller declines were observed in Consumer Discretionary (XLY) and Industrials (XLI), offensive sectors, at approximately -0.096% and -0.019% respectively. The breadth of these declines, predominantly affecting offensive sectors, signals a potential shift in market posture.
Considering the performance of offensive versus defensive sectors, the current data offers mixed indications regarding market sentiment and rotation. While two defensive sectors (XLV, XLU) and two offensive sectors (XLK, XLB) advanced, a clear majority of offensive sectors (XLI, XLY, XLF, XLE, XLC) declined, alongside two defensive sectors (XLP, XLRE). The strong performance of the defensive XLV, combined with the underperformance across most offensive sectors, suggests a likely rotation towards defensive plays. However, the robust gain in the offensive XLK complicates this assessment, indicating that while a defensive bias may be forming, selective strength in growth-oriented sectors remains. It is roughly an even chance that the market is navigating between a defensive stance and opportunistic positioning in specific growth areas.
| Symbol | Daily Percent Change |
|---|---|
| XLV | 2.895% |
| XLK | 1.520% |
| XLU | 0.781% |
| XLB | 0.113% |
| XLI | -0.019% |
| XLY | -0.096% |
| XLRE | -0.522% |
| XLP | -0.549% |
| XLF | -0.966% |
| XLE | -1.007% |
| XLC | -1.625% |
Here is a technical analysis of the provided market data:
The two-day market activity reveals a mixed, yet predominantly corrective, technical landscape across the eleven SPDR Sector ETFs. While the initial trading day often exhibited bullish price action with elevated volumes, the subsequent day introduced significant divergence among sectors. Technology (XLK) and Industrials (XLI) demonstrate a likely continuation of their short-term uptrends; XLK saw a strong bullish Day 1, followed by a gap-up open and higher close on Day 2 with slightly increased volume. XLI posted two bullish candles, though with moderately decreasing volume, still pointing to a likely upward trajectory. Furthermore, Materials (XLB) registered a highly likely short-term bullish reversal, with a powerful bullish candle on Day 2 largely erasing Day 1’s losses, signaling a probable sentiment shift despite decreased volume on the reversal day.
Conversely, several sectors exhibited highly likely short-term bearish reversals or continued weakness. Consumer Discretionary (XLY) formed a bearish engulfing pattern on Day 2, closing significantly lower with increased volume, strongly suggesting a downside reversal. Energy (XLE) similarly printed a clear bearish engulfing candle on Day 2, with expanding volume, indicating a highly likely shift to short-term bearish momentum. These patterns represent strong indications of a turn in sentiment and price direction, with concurrent volume confirming conviction in the selling pressure for XLY and XLE.
Financials (XLF) continued its short-term downtrend with sustained high volume, reinforcing a likely continuation of weakness. Consumer Staples (XLP), Real Estate (XLRE), and Communication Services (XLC) also displayed bearish follow-through on Day 2, albeit with declining volume. This indicates ongoing weakness, though reduced volume suggests selling conviction may be moderating compared to XLE and XLY. Health Care (XLV) and Utilities (XLU) present a more ambiguous technical outlook, suggesting a roughly even chance of either continuation or reversal. Both experienced a strong bullish Day 1 but followed with an indecisive second day, accompanied by notable drops in volume, making near-term direction uncertain for these two sectors.
In conclusion, the past two days highlight a market undergoing internal rotation. Robust bearish signals in XLY and XLE, coupled with continued weakness in XLF, XLP, XLRE, and XLC, suggest downside pressure is likely to prevail in these sectors short-term. Conversely, XLK, XLI, and XLB are likely to maintain upward momentum or continue their bullish reversals. The technical landscape for XLV and XLU remains balanced, indicating roughly even probabilities for near-term price direction. Prudent traders should closely observe volume and subsequent price action to confirm the sustainability of these emerging trends and reversals.
Equity Breadth
Analysis of the provided market data indicates a developing technical posture for the S&P 500. The percentage of S&P 500 members trading above their 50-day moving average (SPXA50R) experienced notable volatility over the observed seven-day period. Initially, the metric stood at 57.09% on 2025-09-24, subsequently declining sharply to 48.50% on 2025-09-25. This downturn suggested a temporary weakening in the short-term momentum of a significant portion of the index components. However, SPXA50R swiftly rebounded to 57.49% on 2025-09-26 and continued to climb, peaking at 59.28% on 2025-09-30, before experiencing a minor pullback to 56.29% and a slight recovery to 56.89% by 2025-10-02. This overall trajectory, despite the intermediate fluctuations, implies that a majority of S&P 500 constituents are maintaining their short-term uptrends.
Concurrently, the percentage of S&P 500 members trading above their 200-day moving average (SPXA200R) demonstrated a broadly similar, though more stable, pattern. Beginning at 61.28% on 2025-09-24, it too registered a dip to 58.08% on 2025-09-25. Nevertheless, SPXA200R exhibited a robust recovery, reaching 62.08% by 2025-09-26. From this point, the indicator largely consolidated above the 62% mark, concluding the period at an elevated 63.27% on 2025-10-02. The consistently higher readings in SPXA200R compared to SPXA50R, particularly towards the end of the period, suggest a more entrenched long-term positive trend participation among S&P 500 companies. The sustained level above 60% is generally interpreted as a favorable sign for the market’s underlying strength.
The observed trends in both breadth indicators, SPXA50R and SPXA200R, provide valuable context for the broader market’s momentum. The initial dip in both metrics on 2025-09-25, followed by a strong rebound, suggests that the market successfully absorbed a period of weakness and swiftly re-established broader participation. The fact that both indicators have largely remained above 50%, with SPXA200R holding consistently above 60% for most of the period, indicates a generally healthy market where a majority of components are contributing to the upward trend. A market with expanding participation above key moving averages is typically considered more resilient than one relying on a narrow selection of stocks.
Against this backdrop, the 20-day Exponential Moving Average (EMA_20_DAY) for the S&P 500 (SPX) displayed an unambiguous and continuous upward trajectory throughout the entire seven-day interval. Starting at 6568.91 on 2025-09-24, the EMA advanced steadily, closing at 6617.79 on 2025-10-02. Each day registered a higher value than the preceding one, confirming a persistent short-to-medium term uptrend for the index itself. This consistent ascent in the EMA_20_DAY is a primary technical signal of positive momentum for the S&P 500.
The confluence of these data points suggests that the current trend direction for EMA_20_DAY:SPX is highly likely to remain positive in the immediate future. The consistently rising EMA_20_DAY, combined with the recovery and sustained strength in the SPXA50R and SPXA200R breadth indicators, points to increasing broad-based support for the market’s uptrend. While the initial dip in breadth could have foreshadowed a deceleration of the EMA, its rapid recovery and subsequent improvement diminish that probability. Absent any significant deterioration in the breadth metrics, it is likely that the upward momentum reflected in the EMA_20_DAY will persist, indicating a generally constructive outlook for the S&P 500’s short-term trend. An alternative scenario of a reversal would require a significant and sustained decline in the percentage of stocks above their moving averages, which is not currently observed in the provided data.
SPX Daily
The S&P 500 (SPX) has demonstrated a sustained uptrend over the past 90 days, a narrative underscored by the consistent upward trajectory of both the 50-day and 200-day Exponential Moving Averages (EMAs). Price action has remained consistently above both EMAs throughout this period, confirming robust bullish momentum in the short, medium, and long term. The 50-day EMA (currently at 6489.18) maintains a significant bullish crossover above the 200-day EMA (currently at 6088.18), reinforcing the strength of the underlying trend.
Examining the price action over the last seven trading days (September 25 to October 2), the SPX exhibited a strong upward push. Following a minor indecisive candle on September 25, successive bullish candles on September 26, September 30, and October 1 propelled the index to new highs within the provided data set, peaking at an intraday high of 6731.94 on October 2. The Relative Strength Index (RSI) for this period climbed from 58.73 to 69.31, indicating increasing buying pressure and strong momentum approaching overbought conditions. The most recent day’s candle (October 2) closed at 6715.35, notably lower than its open of 6731.31, forming a bearish candle with a long upper shadow, which suggests some rejection of higher prices near the 6731.94 level.
Key technical levels present themselves for consideration. Immediate resistance is likely to be encountered around the recent intraday high of 6731.94. A clear breakthrough above this level would signal a continuation of the rally. Conversely, immediate support is observed near the low of the most recent candle at 6693.23 and the prior day’s close at 6711.20. Further dynamic support is provided by the 50-day EMA, currently positioned at 6489.18. A more significant support zone appears to be around the 6440-6460 region, corresponding to multiple highs and lows observed in mid-August and late August, and the 200-day EMA around 6088.18 offering strong long-term structural support.
Considering alternative scenarios, the bullish case suggests that the prevailing uptrend is likely to continue. The overall trend remains unequivocally positive, and the recent bearish candle on October 2 might represent merely a minor pause or profit-taking prior to further gains. A decisive close above 6731.94 would likely invalidate the immediate bearish indication and project further upside. Conversely, the bearish case would involve the market failing to overcome the 6731.94 resistance, potentially initiating a deeper correction. A sustained move below the 6693.23 support, and subsequently the 50-day EMA, would increase the probability of a more pronounced pullback. The neutral case posits that the SPX could consolidate in the near term, trading within a range between the 6693.23 support and 6731.94 resistance, allowing the elevated RSI to cool down without significant price deterioration.
Sentiment drivers appear primarily bullish given the sustained upward momentum across all observed timeframes. The consistent higher highs and higher lows, with prices trading well above key moving averages, reflect a confident buying environment. However, the RSI’s proximity to the overbought threshold (69.31) suggests that buying enthusiasm may be reaching a point where caution is warranted, and some market participants may be inclined to secure profits. The upper shadow on the most recent candle might indicate an emerging hesitancy among buyers or increased selling pressure at higher valuations. Therefore, while the overarching sentiment remains bullish, there is roughly an even chance of a near-term consolidation or minor pullback as the market attempts to digest recent gains before potentially extending its rally.
Technical Analysis of SPX: A 90-Day Momentum Review
The S&P 500 (SPX) has exhibited a discernible bullish trend over the past 90 days, advancing from approximately 5854 in late May to closing at 6715.35 on October 2nd. The price action demonstrates a pattern of higher highs and higher lows, interspersed with corrective phases that have typically found support before the trend reasserted itself. Notably, the SPX experienced a significant rally through June and early July, culminating in a peak near 6279 on July 3rd, followed by a more extended period of consolidation and a sharp decline into early August, reaching a low around 6212.69 on August 1st. Subsequent rallies in August and September have pushed the index to new highs within this 90-day window, indicating sustained buying interest following each period of weakness. The most recent daily closing prices show the SPX maintaining strong upward momentum, with the last data point on October 2nd marking the highest close observed at 6715.35.
Analysis of the 14-day Relative Strength Index (RSI) reveals periods of strong bullish sentiment and subsequent cooling. The RSI moved into overbought territory (above 70) multiple times, particularly during the late June-early July rally, reaching values as high as 75.57 on July 3rd. Similarly, late July saw the RSI climb to a peak of 76.29 on July 28th, immediately preceding a notable price decline and a sharp drop in RSI to 47.80 by August 1st. This pattern suggests that extended periods in overbought RSI territory increased the likelihood of a near-term price correction. The RSI also briefly entered overbought conditions in mid-September, peaking at 74.75 on September 22nd, before a short-lived pullback. As of October 2nd, the RSI stands at 69.31, indicating strong bullish momentum that is approaching overbought levels, which makes a short-term consolidation or minor pullback a roughly even chance in the immediate future, absent further significant upward impetus.
The Price Percentage Oscillator (PPO) provides additional insight into momentum dynamics. The PPO remained positive throughout the 90-day period, confirming the underlying bullish trend. However, its trajectory offered key signals regarding momentum shifts. A noticeable decline in PPO from 0.93 on July 3rd to 0.42 by August 5th, while the SPX was attempting to consolidate at higher levels or experiencing a correction, signals a significant weakening of bullish momentum. This divergence between price (which remained elevated initially) and momentum (PPO decline) made a subsequent, more pronounced price correction highly likely, as observed with the August 1st price low. Similarly, minor PPO declines in late August and late September correlated with short-term price pullbacks. Conversely, strong upward movements in the PPO, such as from 0.57 in late June to 0.93 in early July, and from 0.32 in early September to 0.63 by September 22nd, consistently aligned with robust price rallies.
Considering the interplay of price action, RSI, and PPO, the SPX appears to be in a strong overall uptrend, characterized by resilient recoveries from pullbacks. The frequent excursions into overbought RSI territory (above 70) in conjunction with subsequent PPO declines have consistently preceded short-term price corrections, suggesting a tendency for the market to relieve overextension. The current RSI reading of 69.31, coupled with a PPO value of 0.55 and a recent upward trajectory from a minor September pullback, indicates that bullish momentum remains dominant. It is likely that the SPX will attempt to challenge higher price levels in the near term, continuing its established uptrend. However, an alternative scenario where the RSI crosses above 70 and then swiftly reverses, or if the PPO begins a sustained decline from its current level, would increase the probability of a fresh short-term consolidation or correction. Given the historical patterns within this data, further upward movement is probable, but market participants should monitor for momentum exhaustion indicated by RSI peaking above 70 and a subsequent PPO decline, which historically has presented a window of increased likelihood for a market pause or reversal.