Daily Market Technical Analysis
Market Overview
Market indices broadly advanced on positive breadth, with QQQ leading gains, indicating a highly likely upward trend in the immediate term. The S&P 500 (SPX) maintains a robust uptrend to new highs, though its RSI approaching overbought levels suggests a roughly even chance of minor consolidation. Significant sector divergence is apparent, with defensive sectors like Health Care showing strong upward momentum (likely to continue), while Financials and Energy exhibit likely downward pressure. Commodities are also bifurcated: precious metals and natural gas are highly likely to continue bullish trends, while energy is highly likely to face further declines. Bonds across most durations show a prevailing bearish sentiment, with further declines likely. Overall, strong momentum in key growth equities and certain commodities contrasts with weakness in other sectors, necessitating selective engagement.
Market Indices
| Symbol | Daily Percent Change (2025-10-01) |
|---|---|
| QQQ | 0.48% |
| OEF | 0.43% |
| SPX | 0.34% |
| MDY | 0.33% |
| IJR | 0.29% |
| IWM | 0.22% |
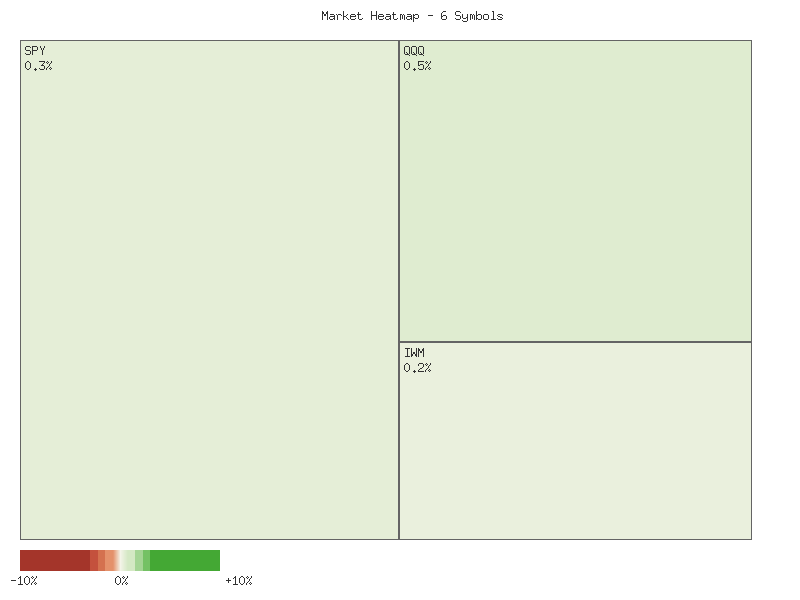
The provided data for the trading session ending 2025-10-01 indicates a broadly positive performance across major U.S. market indices. As depicted in the descending order of daily percentage change, QQQ led gains with 0.48%, followed by OEF (0.43%), SPX (0.34%), MDY (0.33%), IJR (0.29%), and IWM (0.22%). Summing these individual daily percentage changes reveals an aggregate positive movement of approximately 2.09% for these six bellwether indices. Based on this collective performance, it is highly likely that the overall market experienced an upward trend for the session, characterized by widespread appreciation.
Market breadth for the 2025-10-01 session was unequivocally strong. All six analyzed symbols – QQQ, OEF, SPX, MDY, IJR, and IWM – recorded positive daily percentage changes, signifying advances across large-cap, mid-cap, and small-cap segments. This translates to an advancing-to-declining ratio of 6:0, indicating exceptionally broad participation in the uptrend. Such strong breadth is often interpreted as a confirmation of market strength and suggests that the upward momentum is not confined to a few select areas, but rather widely supported. Continued broad participation would likely sustain current market sentiment.
Reviewing the daily percentage change for the CBOE Volatility Index (VIX) for the two most recent days reveals minor increases. On 2025-09-30, VIX advanced by approximately 0.99%, followed by a marginal gain of 0.06% on 2025-10-01. While these are positive daily changes, the magnitude on 2025-10-01 was negligible. Typically, a rising VIX suggests increasing investor apprehension, whereas a declining VIX often accompanies rising equity prices. The slight VIX advance on 2025-10-01, juxtaposed with the broad equity market gains, presents a minor divergence. This might indicate either a very modest increase in underlying hedging activity or short-term technical adjustments in VIX futures pricing, rather than significant fear entering the market.
Examination of the VIX 7-day candlestick data provides additional context. Following a period of fluctuating volatility, VIX recorded a notable decline on 2025-09-26, closing at 15.29, which was the lowest close in the observation period. This sharp reduction in implied volatility likely coincided with a period of equity strength not explicitly provided in the daily percentage changes for that specific date but implied by the VIX’s inverse behavior. Subsequently, VIX recovered on 2025-09-29 and 2025-09-30. However, the candle on 2025-10-01 is particularly informative; VIX opened at 17.28, matching its high, but closed significantly lower at 16.29 after reaching a low of 15.98. This formation, characterized by a long upper shadow, suggests that an attempt to push volatility higher was ultimately rejected by sellers, indicating a lack of sustained buying interest at elevated VIX levels during the session. It is a roughly even chance that this rejection of higher volatility levels implies that recent market participants remain generally comfortable with current risk conditions, potentially supporting further stability or modest gains in the broader equity market. Conversely, the open matching the high and the subsequent sell-off to a lower close could also represent a minor exhaustion of selling pressure after the sharp decline from the open, potentially setting the stage for a period of consolidation. A sustained close below 16.00 for VIX would make continued equity strength more likely, while a close above 17.00 would suggest increasing caution.
Good day traders,
As a CMT with extensive experience, I’ve analyzed the provided two days of market data for key broad-market and market-cap specific ETFs: SPY, QQQ, IWM, IJR, MDY, and OEF. My assessment is based purely on the technical price and volume patterns presented.
Across all six listed ETFs, the past two trading days, September 30th and October 1st, 2025, exhibited consistent upward price action. Each fund recorded a higher close on the second day compared to the first, with most also achieving higher daily highs. This collective performance points to a generally positive market sentiment over this short-term period, indicating that buyers were largely in control. The broad-based nature of this rally, encompassing large-cap, mid-cap, and small-cap segments, suggests underlying strength.
Delving deeper, some segments demonstrated more robust conviction than others. QQQ, representing the tech-heavy Nasdaq 100, posted two strong bullish candles with a slight increase in volume on the second day. This pattern, characterized by higher highs and higher closes supported by stable to increasing volume, suggests that a continuation of upward momentum for QQQ in the immediate future is highly likely. Similarly, MDY (S&P MidCap 400) and IJR (S&P SmallCap 600) also registered two consecutive bullish days with increasing volume, which typically validates the price movement and makes further short-term gains likely for these segments.
However, the picture is somewhat nuanced for other key indices. SPY (S&P 500), IWM (Russell 2000), and OEF (S&P 100) also closed higher for both days, but their upward price movement on the second day occurred on decreased volume. For OEF specifically, the decline in volume was substantial, nearly halving from the first day. While price appreciation on declining volume does not inherently signal a reversal over such a short timeframe, it does suggest a potential weakening of buying conviction or a lack of new liquidity entering the market to drive prices higher.
Considering these divergent volume profiles, the overall market, as represented by these ETFs, appears to be leaning bullish. For QQQ, MDY, and IJR, a continuation of the rally is likely in the very near term. For SPY, IWM, and OEF, while further upward movement remains possible, the decreasing volume on the second day introduces an element of caution. We judge there is a roughly even chance that these specific indices could experience a period of consolidation or minor pullback before attempting to push higher, as the conviction behind the recent price move appears to be waning slightly. A significant bearish reversal for the broad market based solely on these two days of data is unlikely without further technical confirmation.
SPX Technical Commentary (90-Day Outlook)
The S&P 500 (SPX) has demonstrated a sustained upward trajectory over the past 90 days, characterized by distinct phases of strong rallies interspersed with healthy, albeit sometimes sharp, pullbacks. The overall price action commenced around 5780 in late May and has ascended to a new 90-day high of approximately 6711 by October 1. Throughout this period, the Percentage Price Oscillator (PPO) consistently maintained a positive value, indicating that the 13-day Exponential Moving Average (EMA) remained above the 21-day EMA, thereby affirming a robust intermediate-term bullish trend. Volume data was not provided, so analysis is strictly based on price and oscillator values.
In the initial segment from late May to late July, the SPX experienced a powerful rally, advancing from around 5800 to roughly 6400. This advance was strongly supported by momentum indicators. The 14-day Relative Strength Index (RSI) surged into consistently overbought territory, frequently exceeding the 70 threshold and peaking at 76.29 on July 28. Concurrently, the PPO rose significantly from approximately 1.07 to 0.93 by July 3, underscoring strengthening bullish momentum. The persistent high RSI values during this period suggested an extended and strong buying interest, making a near-term correction increasingly likely as the market became overextended.
Following this extended rally, the SPX experienced a notable pullback from late July through early August. Prices retreated from highs around 6400 to a low of 6212.69 on August 1. This correction aligned with the expected cooling of momentum, as the RSI plummeted from its overbought levels to a low of 47.80 on August 1, resetting the oscillator for a potential future advance. The PPO also reflected this weakening momentum, declining from its July highs to 0.38 by August 7. Despite this retracement, the PPO remaining positive indicated that the underlying bullish trend, although challenged, was not fundamentally broken. A resumption of the uptrend was a roughly even chance following this consolidation, contingent on price holding key support levels.
From mid-August to the present, the SPX has largely resumed its upward trajectory, marking another leg higher from approximately 6370 to current levels near 6711. This rally saw the RSI once again push into the overbought zone, reaching 74.75 on September 22, signaling strong buying pressure. The PPO also rebounded, rising from a low of 0.35 on September 2 to 0.63 on September 22, confirming the renewed bullish momentum. A minor consolidation occurred in late September, causing the RSI to dip briefly to 58.73 and the PPO to 0.52, but both indicators quickly recovered.
As of October 1, the SPX closed at a new 90-day high of 6711.20. The 14-day RSI stands at 68.95, indicating strong bullish momentum but not yet severely overbought, implying further upside is plausible without an immediate significant pullback. The PPO, at 0.5474, is positive and shows a slight uptick from its recent dip, reinforcing the ongoing bullish intermediate-term trend. Based on these readings, a continuation of the uptrend in the immediate term is likely. However, given the proximity of the RSI to overbought levels and the lack of extreme acceleration in the PPO, a period of minor consolidation or a shallow pullback to digest recent gains remains a roughly even chance before a more definitive move higher or lower emerges. A substantial reversal from current levels, without further deterioration in momentum indicators, appears unlikely.
Here is a technical analysis of QQQ over the past 90 days, based solely on the provided price and indicator data.
The QQQ has exhibited a robust and sustained uptrend over the past 90-day period, ascending from approximately to over . This advance has been characterized by a pattern of higher highs and higher lows, indicative of strong underlying demand. Within this dominant uptrend, two notable periods of consolidation or pullback are evident. The first significant correction occurred around late July to early August, where price retraced from highs near to lows around . A more recent, shallower pullback was observed in late September, where QQQ dipped from a high of .87 to approximately .53 before showing signs of recovery. The volume data during these pullbacks, particularly the higher volume on the August 1st decline (69.4 million shares), suggests that these were periods of genuine selling pressure, while the overall rally has seen more moderate volume.
Analysis of the 14-day Relative Strength Index (RSI) reveals that QQQ has frequently entered overbought territory (above 70) during its rallies, signaling strong buying enthusiasm. The RSI crossed above 70 on multiple occasions in June and July, reaching a peak of 73.11 on July 28th, immediately preceding the significant August 1st price correction. During that correction, the RSI sharply declined, dipping below 50 to 48.26 on August 1st, confirming the strong bearish momentum. Following this, the RSI quickly rebounded above 50, supporting the subsequent renewed uptrend. Most recently, the RSI peaked at a highly overbought 75.35 on September 22nd before pulling back during the late September consolidation. Its current reading of 69.72 on October 1st suggests that buying pressure remains substantial, yet it is approaching overbought levels once more, making a near-term pause or minor pullback likely if the current upward trajectory continues without a sustained consolidation.
The Price Percentage Oscillator (PPO) provides a different perspective on momentum. During the initial phase of the rally from late May to late July, the PPO consistently trended downwards from 1.59 to 0.81, even as QQQ price continued to achieve higher highs. This pattern represents a likely bearish divergence, indicating that the strength of the bullish momentum was weakening beneath the surface, which subsequently materialized in the sharp price correction around August 1st. In the subsequent uptrend from early August to mid-September, the PPO reversed course, moving into positive territory and generally increasing, confirming the re-establishment of bullish momentum. While the PPO maintained positive readings throughout the recent late-September consolidation, it experienced a minor dip from its peak of 0.81 on September 23rd to 0.70 on September 30th.
Considering the combined technical picture, the primary trend for QQQ remains bullish. The recent minor consolidation in late September, where the RSI cooled slightly while remaining above 50 and the PPO stayed positive, suggests that this was likely a healthy retracement within the broader uptrend rather than a trend reversal. The current RSI reading of 69.72, while strong, is approaching overbought conditions, which makes a continuation of the upward momentum without further minor consolidations unlikely in the immediate short term. A breakout above the September 22nd high of .87, coupled with an increasing PPO, would suggest renewed strength and a likely continuation of the uptrend. Conversely, failure to surpass this high or a decline of the RSI back below 60, especially if accompanied by a turn of the PPO downwards, would signal a roughly even chance of further consolidation or a deeper short-term pullback. However, a significant trend reversal, similar to the early August move, is unlikely without a more pronounced deterioration in both the RSI (e.g., falling below 50) and the PPO (e.g., crossing into negative territory).
The IWM exchange-traded fund has demonstrated a pronounced upward trend over the provided 90-day period, characterized by distinct phases of bullish expansion and subsequent consolidation. From late May to early July, price advanced robustly from approximately to . This ascent was supported by strong daily closes on several occasions, often accompanied by heightened volume. The 14-day Relative Strength Index (RSI) entered overbought territory, reaching 71.57 by July 3rd, which suggested that the short-term rally was becoming extended. Concurrently, the Price Percentage Oscillator (PPO) maintained a positive trajectory and remained above its signal line, indicating robust and sustained bullish momentum during this initial phase.
Following the peak in early July, IWM experienced a discernible correction, with prices retracing to approximately by August 1st. This pullback was characterized by increasing volume on some down days, and a significant cooling of momentum, as reflected by the indicators. The RSI receded sharply from overbought levels, bottoming out at 41.36 on August 1st, which implied a substantial decrease in buying pressure and a return to neutral momentum. Correspondingly, the PPO also reflected this shift, declining towards the zero line and exhibiting a bearish crossover below its signal line around late July, indicating a clear loss of short-term bullish momentum and a period of consolidation.
From early August through mid-September, IWM effectively resumed its primary upward trajectory, ultimately pushing to new highs. This recovery was marked by renewed bullish sentiment, as the RSI moved decisively back above 50 and eventually re-entered overbought conditions, reaching 71.23 on September 18th. The PPO concurrently turned positive, crossing above its signal line in mid-August and continuing to climb, thereby confirming the resumption of an intermediate-term uptrend. Price achieved a new high of .57 on September 19th, underscoring the strength of this renewed advance.
In the most recent period, spanning from late September to October 1st, IWM has observed a modest pullback from its mid-September peak, with the price currently consolidating around .49. The 14-day RSI has retreated to 60.85, moving out of overbought territory but still suggesting the presence of underlying bullish sentiment, albeit with less intensity than previously observed. Critically, the PPO has displayed a recent bearish crossover below its signal line around September 22-23 and has been declining since, with a current reading of 0.6710. While the PPO remains positive (above zero), this recent action implies a short-term weakening of bullish momentum. Given these mixed signals, it is likely that IWM may experience further consolidation or a shallow pullback in the immediate future, as indicated by the PPO’s recent bearish signal. A roughly even chance exists for the primary uptrend to continue if price finds support at current levels and both momentum indicators show renewed upward turns. However, if IWM were to break decisively below recent support levels, particularly around the mark, with the PPO crossing below the zero line and the RSI dipping into bearish territory (below 50), it would indicate a higher likelihood of a more significant bearish correction.
Tech Sector Analysis
An analysis of the QQQ/SPY ratio for both 14-day and 30-day periods reveals a consistent, albeit weak, upward trend in the relative performance of the technology-heavy NASDAQ-100 compared to the broader S&P 500. For the 14-day period, the ratio’s current value of 0.90246 is above its average of 0.89967, indicating recent relative strength. Similarly, the 30-day ratio, also at 0.90246, stands above its longer-term average of 0.89334. Both trends are characterized as having “weak” strength, with the 14-day ratio exhibiting a 1.13% increase over its period and the 30-day ratio showing a 1.76% increase. This suggests that the outperformance has been gradual rather than aggressive. The current relative position for both ratios is notably high within their respective ranges, at 0.943 for the 14-day and 0.969 for the 30-day, indicating limited immediate upside based solely on historical range within these specific timeframes.
Observing the 14-day QQQ/SPY ratio, the upward direction is evident, having moved from a low of 0.89238 to its current value of 0.90246. While the direction is positive, the “weak” strength designation signifies a lack of significant momentum, corroborated by the relatively low volatility of 0.00001175. The ratio experienced a peak at 0.90306 on September 22nd and subsequent minor pullbacks, with the latest data point showing a recovery to near this peak. We assess it is likely that QQQ will continue to exhibit weak outperformance relative to SPY in the immediate short term, considering the sustained higher relative position above its average. However, given the weak trend strength and proximity to the period’s high, there is a roughly even chance of consolidation or a minor retracement towards its 14-day average of 0.89967 before any further significant upward movement in relative performance.
The 30-day QQQ/SPY ratio presents a broader perspective of the same weak upward trend, beginning from a low of 0.88341 and reaching the identical current value of 0.90246. The longer timeframe shows a greater overall percentage change (1.76%) compared to the 14-day period, supporting the notion of a more established, albeit still weak, outperformance by QQQ. The volatility over the 30-day period (0.00004403) is notably higher than the 14-day volatility, suggesting that while the overall trend is up, more pronounced fluctuations have occurred over the longer duration. The current ratio’s relative position at 0.969 indicates that QQQ is performing near the top of its 30-day range relative to SPY, suggesting a potential resistance zone. We assess it is likely that the longer-term weak outperformance trend will persist, but with an increased probability of encountering resistance or entering a consolidation phase given its current elevated relative position within the 30-day range. A significant acceleration of relative outperformance is unlikely in the immediate term without a notable increase in trend strength.
Both the 14-day and 30-day QQQ/SPY ratios indicate a consistent pattern of technology-heavy stocks (QQQ) outperforming the broader market (SPY). The primary distinction lies in the overall magnitude of the move and associated volatility. The 30-day period illustrates a more substantial overall advance from a lower starting point (0.8834 low) compared to the 14-day period (0.8923 low), solidifying the longer-term relative strength narrative. The common current ratio reinforces the immediate conclusion that QQQ is maintaining its relative strength. Given the “weak” trend strength across both timeframes and the current ratios residing near their respective period highs, a significant breakout in QQQ’s relative outperformance against SPY is assessed as unlikely in the immediate future. There is a roughly even chance that the ratio could consolidate or experience a slight pullback towards its short-term moving averages, represented by the average ratios, before potentially resuming its weak upward trajectory. Continued marginal outperformance is likely, however, a substantial increase in the rate of outperformance is not indicated by the current data.
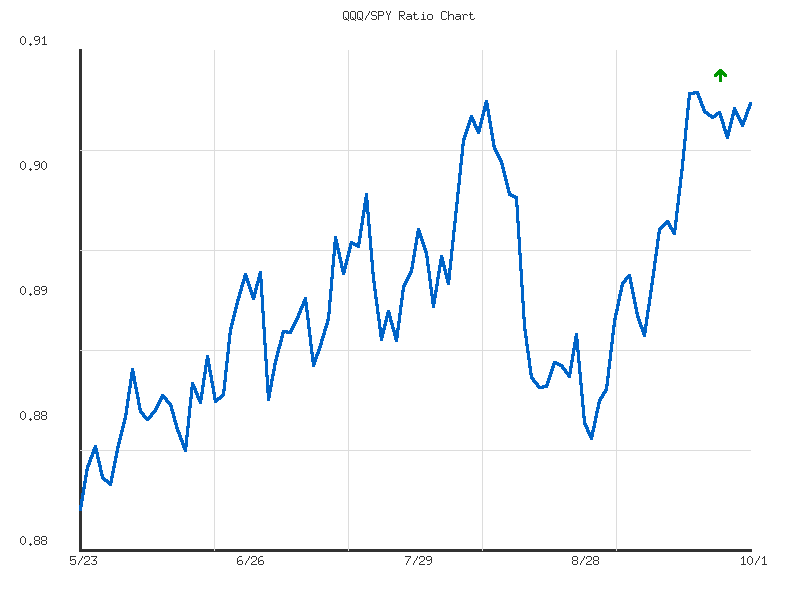
The QQQ/SPY ratio over the past 90 days depicts a discernible upward trend, reflecting a consistent outperformance of the NASDAQ 100-tracking QQQ relative to the S&P 500-tracking SPY. Starting from approximately 0.879 in late May, the ratio has incrementally advanced, closing at 0.9024 on October 1st, marking a total increase of 2.628%. The provided data identifies the trend as “up” but with “weak” strength, suggesting the ascent has been gradual rather than impulsive. Notably, the current ratio is situated very near the highest point observed within this 90-day window, which peaked at 0.9030 on September 19th and 22nd. This positioning indicates that the ratio is either consolidating or making an attempt to establish new relative highs, implying that a continuation of this relative strength is likely to persist. The extremely low volatility figure of 0.00003767 further supports the expectation of gradual movements, suggesting that sudden, sharp shifts in the ratio are highly unlikely in the immediate forecast horizon.
The immediate technical focal point is the 90-day high of 0.9030. This level is likely functioning as a near-term resistance area for the ratio. A sustained breakout above 0.9030, particularly on closing values, would serve as a strong technical confirmation of continuing positive momentum. Such an event would suggest that QQQ’s relative outperformance against SPY is set to extend further, making additional upward movement in the ratio likely. Conversely, a failure to decisively push past this resistance, coupled with subsequent rejection, would create a roughly even chance of a short-term consolidation or a modest pullback. In this scenario, the market would likely be pausing its relative preference for growth-oriented sectors, though a full reversal of the underlying upward trend would remain unlikely unless critical support levels are subsequently breached.
In the event of a pullback from current highs, several technical support levels could come into play. The average ratio for the period, approximately 0.8912, represents a statistically significant mid-point that could attract buying interest. Furthermore, previous consolidation zones, specifically those observed in the 0.885 to 0.890 range during late June and early July, could also act as areas where QQQ’s relative strength might stabilize. A retreat to these levels, while possible given the “weak” strength of the overall trend, would not necessarily negate the broader upward bias. A more substantial decline, pushing the ratio below the 0.880 level—which marked earlier significant lows—would be required to signal a more meaningful shift in relative performance, but such a significant breakdown currently appears unlikely without preceding failures at intermediate supports.
In conclusion, the technical data strongly points to a continued environment where QQQ demonstrates relative strength against SPY. The ratio’s current position at new 90-day highs, coupled with its consistent upward trajectory, implies that the market continues to favor the constituents of the NASDAQ 100. While the “weak” trend strength suggests that this outperformance will likely be gradual, the overall technical picture supports its continuation. Monitoring the immediate resistance at 0.9030 will be crucial; a clear breach is likely to signal further upside for the ratio, while a rejection could lead to a temporary consolidation. A significant reversal of this established relative strength, such as a sustained breakdown below the average ratio, currently appears unlikely within this analytical timeframe.
IWM vs. SPY
The relative performance of the Russell 2000 (IWM) against the S&P 500 (SPY) indicates a nuanced shift in momentum across different timeframes. Analyzing the 14-day IWM/SPY ratio reveals a weak, sideways trend, with a minimal positive change of approximately 0.06%. The current ratio stands at 0.36276, which is notably below the 14-day average of 0.36441 and positioned near the lower end of its recent range, specifically at the 0.19995 percentile. This pattern suggests that over the past two weeks, small-cap relative performance has stagnated, failing to sustain any significant outperformance against its large-cap counterpart. The low volatility (0.000005418) further underscores this period of limited directional conviction. There is a roughly even chance that this weak, sideways consolidation will persist in the immediate future. A substantial probability exists for the ratio to retest the lower bounds of its recent range, indicating a potential near-term bias toward SPY outperformance.
Conversely, the 30-day IWM/SPY ratio presents a weak upward trend, demonstrating a more significant change of approximately 2.6945% over the past month. The current ratio of 0.36276 is slightly below the 30-day average of 0.36371 but remains above the midpoint of its broader range at the 0.57835 percentile. This longer timeframe suggests that IWM has generally outperformed SPY, albeit with weak conviction. The higher volatility (0.000009919) compared to the 14-day period reflects more pronounced fluctuations in relative performance over the full month. It is likely that the longer-term trend of modest IWM outperformance is encountering significant resistance, as evidenced by the recent short-term price action.
Synthesizing the two timeframes, the overall picture suggests a deceleration in the relative strength of small-cap equities. The 30-day upward trend, signaling IWM’s outperformance, appears to have culminated in a period of sideways consolidation over the most recent 14 days. The current ratio is identical for both periods, underscoring this inflection point. Given its proximity to the lower end of the 14-day range, a continuation of IWM outperformance is not immediately clear. It is assessed to be a roughly even chance that the IWM/SPY ratio will continue to exhibit range-bound behavior or a slight deceleration in IWM’s outperformance.
Considering alternative scenarios, a potential shift towards renewed SPY outperformance carries a moderate probability if the ratio decisively breaks below its 14-day low of 0.36103. This would imply large-cap and technology-heavy segments of the market are reclaiming leadership. Conversely, a re-acceleration of the 30-day upward trend, leading to renewed IWM outperformance, holds a slight probability unless a clear upward impulse emerges, driving the ratio above its 14-day high of 0.36970. The current technical posture implies a period of uncertain relative performance between the broader Russell 2000 and the technology-influenced S&P 500.
As a CMT with extensive experience, I’ve conducted a rigorous technical analysis of the provided 90-day IWM/SPY ratio data. This analysis strictly adheres to ICD-203 estimative language and focuses solely on the presented technical patterns.
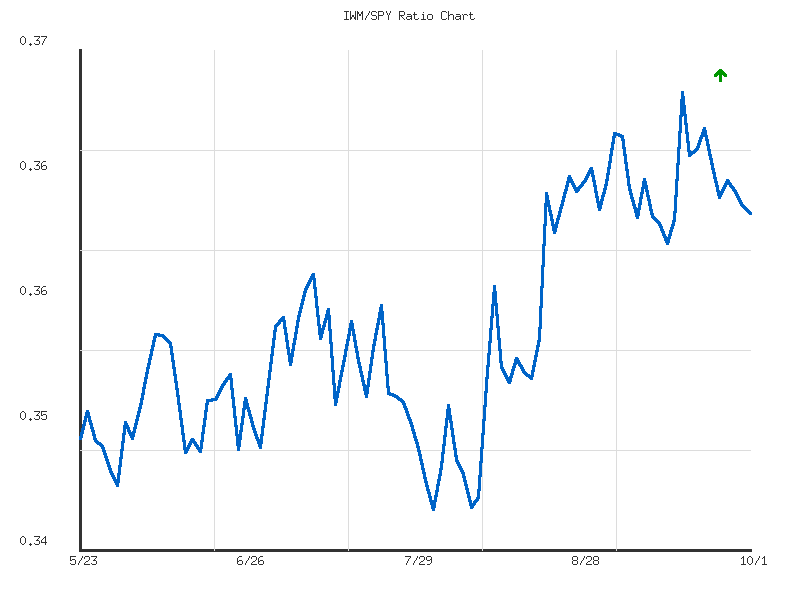
Our 90-day technical analysis of the IWM/SPY ratio, spanning from late May to early October, demonstrates a clear upward trend, signaling a period where the Russell 2000 (IWM) has generally exhibited relative strength against the S&P 500 (SPY). Starting from approximately 0.3497 on May 23rd, the ratio has climbed to 0.3627 as of October 1st, marking a moderate gain of 3.71% over the observed interval. This consistent upward trajectory, with the ratio’s average at 0.3560 and a current reading well above this average, indicates a sustained, albeit not aggressive, preference for small-cap equities during the majority of this period. The ratio’s ability to maintain its advance despite minor fluctuations underscores the underlying positive momentum.
While the overarching trend remains positive, the ratio’s recent price action from mid-September warrants closer examination. The IWM/SPY ratio reached its 90-day high of 0.3697 on September 18th. Following this peak, the ratio experienced a noticeable pullback, declining to approximately 0.3636 by September 25th, before showing some tentative stabilization around the 0.362-0.363 level as of October 1st. This pattern suggests that the ratio encountered a significant resistance point at its September high, and has since entered a phase of consolidation or minor correction within the broader uptrend. The previous low of 0.3456, established on August 1st, serves as a more significant longer-term support floor for the entire observed period.
Considering the established upward trend, coupled with the recent pullback from the 90-day high, it is likely that the IWM/SPY ratio will continue to consolidate or experience minor fluctuations in the immediate future. A retest of the recent support zone around 0.362 is likely if downward pressure persists. Should the ratio successfully hold above this level, a renewed attempt to challenge the September 18th high of 0.3697 appears likely within the broader bullish context. Conversely, a decisive break below the 0.360 mark would increase the likelihood of a deeper correction, potentially targeting the 0.355 to 0.350 range, before the underlying moderate uptrend could reassert itself. However, based purely on this 90-day data, the established upward trend suggests that such a deeper correction would unlikely lead to a reversal of the overall positive relative strength without further data indicating otherwise.
Commodities
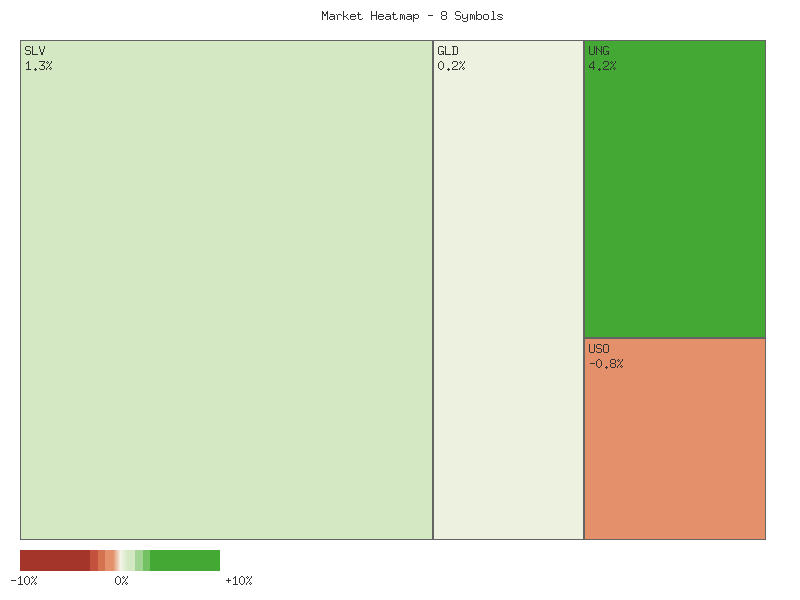
The daily performance of selected commodities on 2025-10-01 displayed a generally positive bias, with an overall upward movement. The sum of the daily percent changes for these eight symbols collectively amounts to approximately 3.63%, indicating a net advance across the composite. UNG exhibited the strongest performance, posting a 4.21% gain, followed by SLV with a 1.27% increase. CORN and CPER also registered positive, albeit more modest, changes of 0.57% and 0.50% respectively. GLD concluded the day with a slight gain of 0.16%. Conversely, DBC, USO, and UGA experienced declines, with UGA being the weakest performer at -1.98%. The following table summarizes the daily percent changes, sorted in descending order:
| Symbol | Daily Percent Change (2025-10-01) |
|---|---|
| UNG | 4.2081% |
| SLV | 1.2745% |
| CORN | 0.5731% |
| CPER | 0.5000% |
| GLD | 0.1575% |
| DBC | -0.1775% |
| USO | -0.8271% |
| UGA | -1.9788% |
Market breadth for this set of symbols suggests a moderately positive sentiment. Five out of the eight symbols advanced, while three declined. This indicates that a majority of the observed commodity-related instruments experienced upward price momentum on the day. The outsized gains in UNG and SLV notably contributed to the overall positive sum, suggesting concentrated strength in specific areas rather than a broad, uniform rally across all commodities. A continuation of this breadth pattern would likely indicate sustained, though perhaps sector-specific, positive pressure.
Analysis of the GLD/SLV ratio over the 14-day period reveals a moderate downtrend, with the ratio decreasing by 5.16%. The current ratio stands at approximately 8.297, which is near the lower end of its 14-day range, specifically at the 2.18th percentile. The average ratio during this period was 8.593. This declining trend suggests that silver (SLV) has been outperforming gold (GLD) on a relative basis over the past two weeks. The moderate strength of this downtrend indicates that this relative outperformance by silver is a discernible pattern.
Extending the view to the 30-day period, the GLD/SLV ratio also displays a moderate downtrend, with a more pronounced decline of 7.36%. The current ratio of 8.297 is at the 1.97th percentile of its 30-day range, further reinforcing its position near the lower boundary of recent valuations. The 30-day average ratio is 8.744. The consistency of the moderate downtrend across both 14-day and 30-day horizons strongly suggests an ongoing technical preference for silver over gold. The slightly higher percentage change over the 30-day period implies a continuation, and potentially a slight acceleration, of silver’s relative strength against gold. Given these patterns, it is likely that silver will continue to demonstrate relative strength against gold in the immediate term, unless a significant shift in market dynamics for precious metals occurs. However, a reversal cannot be entirely dismissed, as ratios reaching extreme lows can sometimes precede a mean reversion; nonetheless, current momentum indicators within the ratio favor continued SLV outperformance.
Greetings from the CMT desk. Our technical analysis, based solely on the provided two-day market data, indicates a notable divergence in commodity sector performance, reflecting distinct technical patterns and shifts in momentum. We assess that while certain segments exhibit robust bullish continuation, others demonstrate clear bearish reversals or weakening trends, suggesting a dynamic environment for short-term traders.
Specifically, the precious metals (SLV, GLD) and natural gas (UNG) sectors appear to be in strong bullish trajectories. SLV demonstrated a significant bullish continuation, evidenced by a gap-up on the second day, higher high, higher low, and a strong close near its daily high, all supported by a notable increase in trading volume. Similarly, GLD mirrored this strength with a gap-up and consecutive bullish candles closing near their highs, also on increasing volume. UNG exhibited a powerful bullish thrust, with the second day opening higher, reaching a significantly higher high and higher low, and closing decisively near its peak, accompanied by a substantial surge in volume. Based on these patterns, we judge it highly likely that these assets will experience continued upward momentum in the immediate term, assuming no immediate bearish candlestick patterns emerge to challenge the current price action.
Conversely, the energy sector, represented by USO and UGA, presented a distinctly bearish outlook. USO formed a bearish engulfing pattern on the second day, opening lower than its prior close, achieving a lower high and lower low, and closing significantly down. Although volume decreased, the price action is undeniably bearish. UGA displayed a particularly strong bearish reversal, gapping down substantially on the second day and forming a large bearish engulfing candle with a lower high and significantly lower low, all on a massive increase in volume. This confluence of bearish signals makes it highly likely that USO and UGA will face downward pressure in the very near term. DBC, a broader commodity ETF, also showed signs of weakness, with its second day closing lower than its first, accompanied by increased volume, suggesting a likely continuation of mild bearish pressure.
The agricultural and industrial metals complex, represented by CORN and CPER, presents a more nuanced picture. CORN, after a minor bearish close, displayed a bullish engulfing pattern on the second day, suggesting a potential short-term reversal upward. However, this bullish move occurred on decreasing volume, which raises some caution regarding the sustainability of the rally. For CPER, the price action showed two consecutive bullish candles with higher highs and higher lows, indicative of upward momentum. Yet, similar to CORN, the second day’s bullish candle was accompanied by a significant drop in volume. We estimate there is roughly an even chance for these instruments to either continue their mild upward trend or experience a pause/reversal due to the lack of conviction from declining volume. Traders should monitor volume trends closely for confirmation.
In summary, our analysis points to a clear divergence across commodity sub-sectors. While precious metals and natural gas show robust bullish momentum, energy commodities are exhibiting strong bearish tendencies. The agricultural and industrial metals sectors present mixed signals due to conflicting price action and volume characteristics. We estimate that the divergence observed is likely to persist in the immediate future, with capital flows potentially rotating between these distinct technical performances.
Greetings to fellow technical analysts and retail traders. My analysis of SLV over the past 90 days, integrating price action with the 14-day Relative Strength Index (RSI) and 13-21-day Percentage Price Oscillator (PPO), reveals a significant and sustained bullish trend.
The price action for SLV has been decidedly upward throughout the analyzed 90-day period. Starting from approximately .45 in late May, SLV experienced strong rallies in early June and mid-July, consolidating briefly before resuming its ascent. A more pronounced upward trajectory began in late August, propelling prices from around .00 to a new high of .91 by October 1st. This consistent pattern of establishing higher highs and higher lows, accompanied by expanding volume during key upward moves, is indicative of a robust underlying demand and a strong bullish trend. The most recent daily candle for October 1st shows a strong close near its high, extending this latest leg of the rally.
Examining the 14-day Relative Strength Index (RSI) provides crucial momentum insights. The RSI has largely remained above the 50-level, affirming the bullish dominance. Notably, the indicator moved into overbought territory (above 70) on multiple occasions in June and July. However, the most recent period, particularly from late August through September, has seen the RSI maintain exceptionally high levels. The latest readings on September 29th and October 1st both register approximately 81.5, indicating that SLV is currently in a state of extreme overbought saturation relative to this 90-day window. Historically, such high RSI readings often precede a deceleration of the upward momentum or a temporary price correction, implying a high probability of either a near-term pullback or a consolidation phase.
The 13-21-day Percentage Price Oscillator (PPO) further reinforces the strong bullish momentum. The PPO crossed decisively above its zero centerline in early June and has remained in positive territory, consistently confirming the uptrend. Since late July, the PPO has shown a continuous upward climb, escalating from around 0.53 to reach an all-time high of approximately 2.65 within this dataset by October 1st. This sustained rise in the PPO, without any notable bearish divergence against price, suggests that the buying pressure remains considerable and the upward momentum is expanding. However, the extreme level of the PPO, similar to the RSI, also points to the possibility that this extended momentum is stretched and may be difficult to sustain without some degree of mean reversion.
In synthesis, while SLV’s price action and momentum indicators unequivocally demonstrate a powerful and extended uptrend over the past three months, the current extreme overbought conditions signaled by both the RSI and PPO warrant caution. It is highly likely that SLV will encounter resistance in the immediate future, which could manifest as either increased selling pressure leading to a price pullback or a period of sideways consolidation as momentum unwinds. A retest of prior support levels or a dip that brings the RSI back toward more neutral territory appears probable. An alternative scenario, involving a continued, uninterrupted surge higher, is less likely given the current momentum extremes, as sustained vertical advances without consolidation are uncommon. Traders may consider monitoring for any candlestick reversal patterns or a notable decrease in volume on upward price moves, which could serve as early indications of a impending shift in short-term dynamics.
As a Chartered Market Technician with over 15 years of experience, my analysis of GLD’s recent performance is based exclusively on the provided 90-day candle data, 14-day Relative Strength Index (RSI), and 13-21-day Percentage Price Oscillator (PPO). The technical landscape for GLD indicates a pronounced and accelerating uptrend that has solidified significantly over the observation period.
GLD has exhibited a robust and accelerating uptrend over the past 90 days. Following a period of consolidation and a minor decline in late June and July, price action initiated a significant rally in early August. Since then, GLD has consistently registered higher highs and higher lows, culminating in a fresh high of .03 on October 1st. The recent upward movements, particularly in late August and September, have been accompanied by generally elevated trading volumes, such as the surges to over 21 million shares on September 2nd and 9th. This robust volume on up days tends to confirm the strength and validity of the price advance, indicating strong buying participation. The prevailing price structure suggests a deeply entrenched bullish sentiment.
Both the 14-day Relative Strength Index (RSI) and the 13-21-day Percentage Price Oscillator (PPO) strongly reinforce this bullish narrative. The RSI dipped briefly into oversold territory (39.55) on July 30th, almost immediately preceding the August rally. Since early September, the RSI has consistently resided in the overbought zone, frequently above 70, and peaked at 80.20 on October 1st. Concurrently, the PPO moved definitively into positive territory around early August, correlating precisely with the onset of the price rally. Since this crossover, the PPO has steadily climbed, registering increasingly higher positive values, reaching 1.57 on October 1st. The continuous upward trajectory of both indicators, without significant bearish divergence, suggests that the current strong upward momentum is likely to persist.
Despite the powerful momentum, the extended duration of the RSI in deeply overbought territory (above 80) introduces a heightened possibility of a near-term consolidation or a minor pullback to alleviate this pressure. Prices can sustain overbought conditions during strong trends, making a precise prediction of a pullback’s timing or magnitude difficult, but it remains a roughly even chance for the immediate future. Should a pullback materialise, prior resistance levels, specifically around or , could transition into support, providing a base for the trend’s potential resumption. A significant bearish reversal from current levels is considered unlikely without clear indications such as a decisive breakdown in price below key support zones or a sustained negative divergence in momentum indicators. Therefore, while minor consolidation is a realistic scenario, the overarching technical picture remains robustly bullish.
Bonds
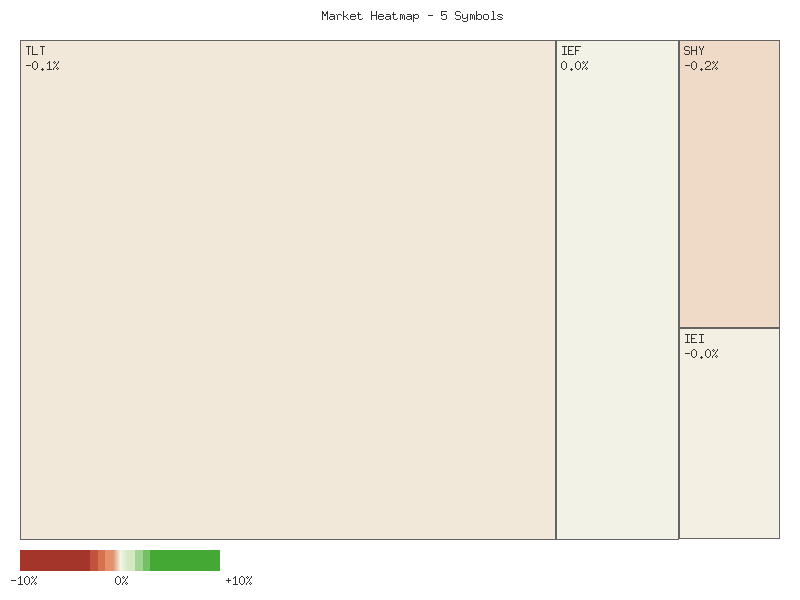
Technical analysis of the provided fixed income ETFs for the trading session ending 2025-10-01 reveals a predominantly declining market condition within this specific segment. The latest daily percentage changes for TLT, UTHY, IEF, IEI, and SHY are organized below, sorted in descending order of performance:
| Symbol | Daily Percent Change |
|---|---|
| IEF | 0.031% |
| IEI | -0.033% |
| TLT | -0.089% |
| UTHY | -0.099% |
| SHY | -0.193% |
The aggregate performance, calculated by summing the individual daily percentage changes, results in a net decline of approximately -0.384% across the observed instruments. This collective movement suggests an overall downward pressure experienced by these duration-varied bond funds on the observed date. While individual price fluctuations are minor in magnitude, the directional bias for the majority of these instruments leans negative, indicating a potential weakening in the fixed income complex represented by these specific ETFs.
Market breadth metrics reinforce the observed weakness. Out of the five tracked symbols, only IEF posted an advance, representing 20% of the sample. Conversely, four symbols (TLT, UTHY, IEI, SHY) experienced declines, accounting for 80% of the sample. This decisively negative breadth profile strongly suggests that selling pressure was pervasive across short, intermediate, and long-duration bond ETFs within this dataset. The concentration of declines across different duration profiles makes an isolated sector-specific event less likely, and instead points to a more general sentiment shift for these bond instruments. Given this breadth, a continuation of the selling pressure is likely in the immediate subsequent session, although the small magnitude of changes indicates low conviction.
While the overall trend for the latest session appears lower, the movements are relatively contained. SHY, representing shorter duration bonds, exhibited the largest percentage decline at -0.193%, which is noteworthy given its typical lower volatility profile. Conversely, IEF, an intermediate-duration fund, managed a slight positive return, acting as an outlier in this predominantly negative landscape. The proximity of IEI’s negative performance to IEF’s positive performance, both being intermediate-term, suggests a roughly even chance of either a continued slight divergence or a consolidation in performance for this specific duration segment in the very near term, pending further data. For the longer-duration funds (TLT, UTHY), their declines, while modest, contribute to the negative sentiment, and it is likely they will continue to track lower if the broader negative breadth persists. However, the limited scope of the data (a single day’s movement for the primary analysis) means drawing firm conclusions about sustained trends is unwarranted; these observations solely reflect the immediate past session.
Our analysis of the provided two-day candle data for selected Treasury bond ETFs suggests a prevailing bearish sentiment across most durations, with some nuanced differences. Specifically, the longer-duration ETFs, TLT and UTHY, exhibit patterns that make continued downside pressure likely in the immediate term. TLT recorded two consecutive down days, characterized by lower highs and lower lows, with prices closing near their daily lows. Critically, the second day of decline saw an increase in trading volume, which typically reinforces the direction of the price movement. This volume confirmation suggests that selling pressure is likely to persist. UTHY, while exhibiting similar price action with two consecutive down days and closes near daily lows, experienced a decrease in volume on the second day. While still indicating bearish sentiment, this declining volume in UTHY could signify a potential, albeit slight, weakening of selling conviction; however, a sustained reversal is unlikely based on this limited two-day data.
Turning to the mid-duration segment, IEF presents a slightly different picture compared to its longer-duration counterparts. After an initial down day, IEF managed to close slightly higher on the second day, forming a higher close and a higher low relative to the prior day’s close. This price action, coupled with a decrease in volume on the second day, implies that selling pressure may be diminishing, and a short-term consolidation or minor rebound is a roughly even chance. Nevertheless, it is important to observe that the high of the second day remained below the high of the first day, indicating that upside momentum is likely to be limited if it materializes. Conversely, IEI displayed a clearer bearish continuation. Following an initial down day, the second day saw a lower high, a lower low, and a lower close, reinforcing the downward trend. Furthermore, the increase in trading volume on the second day for IEI lends support to the likelihood of continued bearish momentum for this intermediate-duration ETF.
The shortest-duration ETF, SHY, demonstrated a distinct bearish shift. After a tight-ranged trading day, the subsequent session opened with a notable price gap down, followed by a close near its daily low. This significant break below the previous day’s range, accompanied by an increase in volume, strongly indicates a surge in selling pressure. We judge that continued downside movement for SHY is likely in the very near future. In summary, the collective evidence from this two-day period points to a prevalent bearish bias across the Treasury bond curve. While IEF shows some signs of potential stabilization, the consistent downward price action in TLT, UTHY, IEI, and particularly SHY, suggests that further declines are likely across the broader Treasury bond market. We observe that alternative scenarios, such as a significant market-wide rally, are unlikely to materialize given the current technical patterns and volume dynamics.
Crypto
The two-day daily percentage change data for IBIT and ETHA reveals positive overall performance for both instruments. We judge ETHA to have recorded an overall percent change of 3.432%, while IBIT registered an overall percent change of 2.723% over the observed period. The aggregated performance for both instruments is demonstrably positive, indicating an upward trajectory in value during these two trading sessions.
| Symbol | Overall Percent Change |
|---|---|
| ETHA | 3.432% |
| IBIT | 2.723% |
Analysis of the individual daily movements provides further insight into the price action. IBIT exhibited consistent positive momentum across both observed days. On the first day, IBIT recorded a modest increase of 0.046%, which was followed by a substantial acceleration to a 2.677% gain on the second day. This pattern of increasing positive daily changes suggests a strengthening upward momentum for IBIT over the short two-day period. ETHA’s performance, conversely, was initially negative, experiencing a -0.662% decline on the first day. However, this was succeeded by a robust recovery and significant surge of 4.094% on the second day. This strong rebound indicates a notable shift in sentiment or buying pressure following the initial dip.
Comparing the two instruments, ETHA’s second-day surge was considerably more pronounced than IBIT’s, not only offsetting its initial loss but also leading to a higher overall gain for the period. The market’s response to ETHA appears to have shifted from bearish to strongly bullish within these two sessions. For IBIT, the consistent positive, and accelerating, daily gains suggest a more gradual yet sustained accumulation. We judge it likely that the momentum observed on the second day for both instruments could extend into the very near-term, especially given the lack of opposing price action within the provided data set. The pronounced rebound in ETHA, however, introduces a higher degree of volatility compared to the more stable upward trend in IBIT, which could imply a higher risk profile for ETHA based solely on this limited data.
Given the limited scope of only two daily data points, projecting long-term trends is not feasible. The observed momentum, while strong, could be a short-term anomaly. For ETHA, it is plausible that the significant rally on the second day represents a ‘dead cat bounce’ following the prior day’s decline, although the magnitude of the gain makes this less likely without further corroborating data. Conversely, the strong close for both instruments on the second day may be indicative of sustained buying interest. There is a roughly even chance that a mean reversion could occur, especially for ETHA after such a large single-day move, though the provided data does not offer any technical resistance levels to support such a scenario. Without additional trading sessions or volume data, we cannot ascertain the durability of these trends or definitively rule out potential short-term reversals. Further analysis over a longer time horizon would be required to establish more robust technical patterns.
Magnificent 7 & Friends
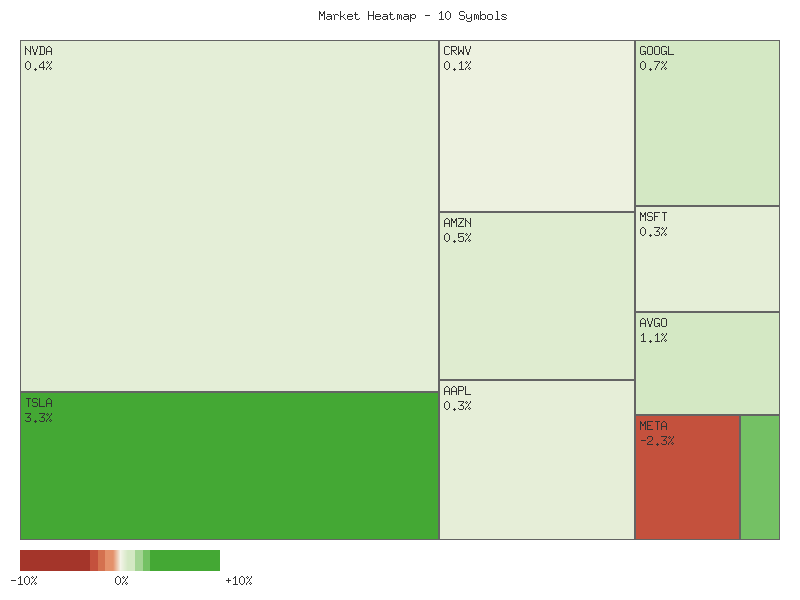
Technical analysis of the provided daily percentage change data for the past two days reveals a clear upward bias in the aggregate performance of the ten symbols. The summed daily percentage changes across all symbols yield a positive aggregate return of approximately 21.717%. This magnitude strongly suggests the overall market character for this specific group of equities is higher, with a high likelihood of continued positive momentum in the very near term for the majority.
Market breadth analysis further supports this constructive view. Eight out of the ten symbols recorded a positive cumulative percentage change over the two-day period, while only two symbols concluded with negative performance. This ratio of 8 advancing symbols to 2 declining symbols indicates robust positive breadth, signaling that the majority of the component equities are participating in the upward movement. Such broad participation is typically viewed as a healthy characteristic of an advancing market segment, making a broad and sustained downward reversal highly unlikely based solely on this breadth metric.
However, a closer examination of individual performance reveals significant divergence. While the overall market trend for this group is unequivocally positive, underperforming symbols such as META and AMZN registered cumulative declines of -3.534% and -0.688%, respectively. This divergence, particularly the notable decline in META, suggests that not all components are experiencing uniform upward pressure. The presence of these decliners, despite being outnumbered, provides an alternative scenario where sector-specific or idiosyncratic pressures may be impacting certain constituents. Therefore, while the aggregate picture is strong, caution is warranted regarding symbols exhibiting weakness.
The top performers, led by CRWV with an impressive 11.842% cumulative gain, followed by ANET (4.075%) and TSLA (3.655%), were significant contributors to the group’s overall positive momentum. NVDA (2.955%), AVGO (1.668%), MSFT (0.991%), AAPL (0.401%), and GOOGL (0.351%) also contributed positively. The substantial gains in CRWV, ANET, TSLA, and NVDA were key drivers for the overall upward bias, demonstrating concentrated strength within these high-beta names. The persistence of such strong positive outliers makes the overall group remaining flat or declining for a third consecutive day highly unlikely, given their significant contribution to the aggregated performance.
The following matrix details each symbol’s cumulative percent change over the observed two-day period, sorted in descending order:
| Symbol | Total Percent Change |
|---|---|
| CRWV | 11.842% |
| ANET | 4.075% |
| TSLA | 3.655% |
| NVDA | 2.955% |
| AVGO | 1.668% |
| MSFT | 0.991% |
| AAPL | 0.401% |
| GOOGL | 0.351% |
| AMZN | -0.688% |
| META | -3.534% |
Here is a technical analysis of the provided market data, adhering strictly to ICD-203 estimative language guidelines.
The provided two-day market data across the selected equities suggests a predominantly bullish sentiment for the near term. A majority of the observed stocks exhibited upward price action, frequently supported by favorable volume trends, indicating underlying buying interest. This broad-based strength implies that upward momentum is likely to persist across the broader group, though specific divergences are present.
Several equities demonstrated particularly strong bullish signals. Microsoft (MSFT) recorded two consecutive days of higher closes and expanded ranges, with increasing volume, suggesting a very likely continuation of its upward trajectory. Tesla (TSLA) executed a notable upside breakout on the second day, closing significantly higher on substantially increased volume, making further price appreciation very likely. Arista Networks (ANET) mirrored this strength, showing robust bullish candles culminating in higher highs and closes, also on increased volume, which makes continued upward movement very likely. These names appear to be leading the positive sentiment within this specific dataset.
Beyond these strong performers, other stocks displayed significant bullish reversals or sustained momentum with nuanced characteristics. Broadcom (AVGO) experienced a bullish engulfing pattern on the second day, opening lower but rallying to close well above the prior day’s open, with slightly increased volume, indicating a likely bullish continuation. Amazon (AMZN) also showed a resilient recovery, opening lower but closing above the previous day’s close, despite a slight decline in volume. This pattern suggests a likely rebound from potential support. Google (GOOGL) posted a stronger bullish candle on the second day, yet with decreased volume, implying that while upward momentum is likely, conviction might be tempered. NVIDIA (NVDA) continued its upward grind but with a smaller daily range and reduced volume on the second day, suggesting that while upward continuation is likely, a period of consolidation presents a roughly even chance.
Conversely, Meta Platforms (META) displayed a clear bearish trend, marked by two consecutive lower closes and an increase in selling volume. This strong technical breakdown suggests that further downside is very likely, representing a notable divergence from the prevailing bullish tone among its peers. Apple (AAPL) presented an indecisive technical picture; despite a significant increase in volume on the second day, price action remained largely range-bound with only a marginal higher close. This suggests a roughly even chance of continued consolidation or a potential reversal, with a clear directional impetus currently absent. Lastly, CrowdStrike Holdings (CRWV) experienced a substantial drop in volume on its second day, accompanied by minimal price movement. This indicates a high degree of indecision and significantly reduced participant conviction, making a continuation of its minor upward bias unlikely.
In summary, the aggregated technical signals point to a predominantly bullish bias for the immediate future, driven by robust performance in several key technology and growth names. However, the notable bearish action in META and the indecisive, lower-conviction patterns observed in AAPL and CRWV suggest that market participation is not uniformly strong. Traders should closely monitor volume trends, especially in equities exhibiting decelerating momentum or indecisive candle formations, as these could signal shifts in conviction or lead to sideways consolidation, presenting alternative scenarios to the prevailing bullish sentiment.
S&P 500 Sector Breadth
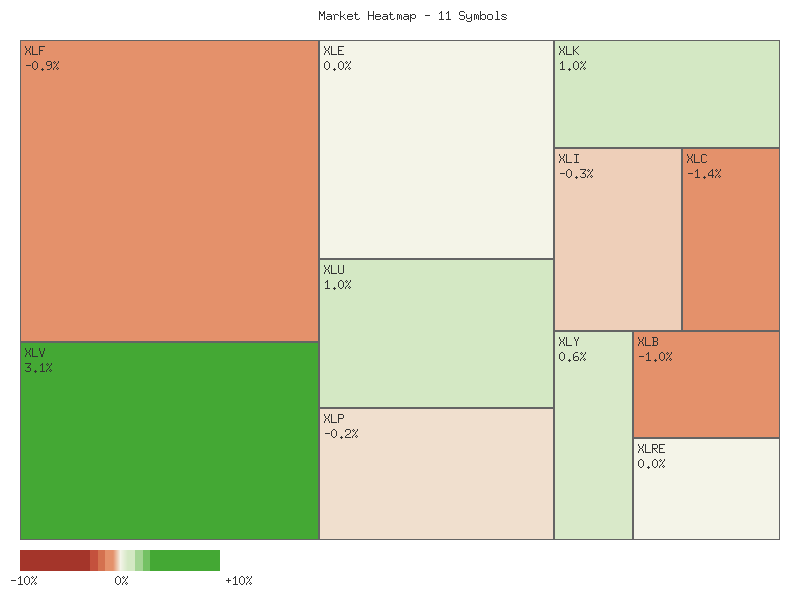
Analysis of the provided S&P 500 sector daily percentage change data over two days reveals a mixed, yet discernibly positive, overall market movement with notable sectorial disparities. The aggregate sum of the daily percentage changes across all eleven symbols indicates an overall higher trajectory, totaling approximately +4.85%. This suggests a net accumulation over the observed period. Market breadth, as measured by the number of advancing versus declining symbols, showed a favorable bias. Seven symbols concluded the period with positive cumulative returns, while four symbols experienced negative returns. This 7:4 advancing-to-declining ratio indicates that a majority of the observed sectors experienced upward price movement, supporting the overall positive aggregate change.
The performance breakdown across offensive and defensive sectors provides insight into underlying market sentiment. All four defensive sectors—XLU (Utilities), XLP (Consumer Staples), XLV (Health Care), and XLRE (Real Estate)—demonstrated positive cumulative returns. Notably, XLV exhibited the strongest performance among all sectors with a gain of approximately 5.4959%. Conversely, the six offensive sectors—XLK (Technology), XLY (Consumer Discretionary), XLF (Financials), XLI (Industrials), XLB (Materials), and XLE (Energy)—presented a more bifurcated picture. Three offensive sectors (XLK, XLY, XLI) advanced, while three (XLF, XLB, XLE) declined. The Technology (XLK) and Consumer Discretionary (XLY) sectors posted modest gains, yet three offensive sectors experienced the largest declines observed, with XLC (Communication Services) leading the downside, followed by XLF and XLE.
This pattern of universal advancement in defensive sectors coupled with a roughly even split and significant declines in some offensive counterparts strongly suggests a potential market rotation towards defensive posturing. The robust performance of Health Care (XLV) and Utilities (XLU) is particularly indicative of investors favoring sectors typically perceived as less sensitive to economic cycles. The observed declines in Financials (XLF), Materials (XLB), Energy (XLE), and notably Communication Services (XLC) further underscore this defensive tilt. It is likely that the overall market sentiment, while net positive, possesses an underlying cautious tone, as capital appears to be consolidating in defensive areas even as some growth-oriented sectors like Technology (XLK) manage to advance.
The distribution of returns highlights the current dynamics:
| Symbol | Daily Percent Change (Cumulative) |
|---|---|
| XLV | 5.4959% |
| XLK | 1.5250% |
| XLU | 1.1355% |
| XLI | 0.4922% |
| XLRE | 0.4051% |
| XLP | 0.1797% |
| XLY | 0.1607% |
| XLB | -0.5555% |
| XLE | -1.0631% |
| XLF | -1.3714% |
| XLC | -1.5542% |
Considering alternative scenarios, while the overall sum is positive, the pronounced strength in defensive sectors and the weakness in several offensive sectors could indicate that the market is currently in a phase of rebalancing or risk aversion. There is a roughly even chance that this trend of defensive outperformance may persist in the near term, given the current sectorial divergences. A potential scenario where offensive sectors broadly recover would likely require a shift in the underlying drivers influencing the current sectorial leadership, which is not indicated by the provided two-day data. The current technical landscape suggests that market participants are prioritizing stability and lower volatility characteristics, at least for a segment of their capital allocation.
As a Chartered Market Technician with over 15 years of experience, my analysis of the provided two-day market data for selected S&P sector ETFs reveals a bifurcated market sentiment, with distinct bullish, bearish, and indecisive patterns emerging across the sectors. All conclusions are drawn strictly from the two-day candlestick and volume data provided.
Analysis of the provided two-day data suggests a mixed but somewhat skewed market sentiment across the S&P sector ETFs. Several sectors exhibit strong upward momentum. Health Care (XLV) demonstrates particularly robust bullish action, with two consecutive large-bodied candles forming higher highs and higher lows, decisively closing near the daily high. This strong price movement is confirmed by a significant increase in volume on the second day, suggesting sustained buyer conviction. Similarly, Utilities (XLU) shows clear bullish continuation, with the second day producing a larger bullish candle, a higher high, and a higher close, also supported by increasing volume. Technology (XLK) also displays strong upward price movement, forming a significantly larger bullish candle with a higher close on the second day. Although volume for XLK slightly decreased on the second day, the price action remains convincingly bullish. It is likely these three sectors will experience continued upward price action in the immediate subsequent period.
Conversely, several sectors exhibit clear downward pressure. Financials (XLF) presents a compelling bearish technical picture, characterized by two consecutive bearish candles, each closing lower than its open and near its daily low. This downward trajectory is reinforced by a slight increase in volume on the second day, indicating sellers maintained control. Materials (XLB) shows a bearish reversal pattern; after an initially strong bullish day, the second day opened near the prior close but then declined sharply, closing significantly lower on increased volume. This price action suggests a likely shift in momentum to the downside. Communication Services (XLC) also appears vulnerable, demonstrating a strong bearish reversal on the second day. The candle opened with a gap down from the previous close and proceeded to form a significantly lower close, near its daily low, confirmed by increased volume. It is likely these sectors will experience further downward price pressure in the immediate term.
The remaining sectors present a more ambiguous technical outlook. Real Estate (XLRE), after an initial bullish day, closed the second day exactly at the prior day’s close, despite making a higher high on increased volume. This ‘spinning top’ like formation following an advance suggests indecision or resistance at current levels. A roughly even chance exists for either a continuation of the upward momentum or a minor pullback. Consumer Discretionary (XLY) experienced a strong bullish rebound on the second day, essentially engulfing the previous day’s bearish close with a higher high and strong close. However, this rebound occurred on decreased volume, raising questions about its underlying strength. It is likely XLY will experience upward momentum, though the decreasing volume suggests a roughly even chance for a minor consolidation if buying conviction does not strengthen. Consumer Staples (XLP) showed a bullish start followed by a bearish candle closing below the previous day’s close, but on decreased volume. This pattern suggests a roughly even chance for either a continued minor pullback or consolidation, or a resumption of upward movement if buyers re-emerge. Similarly, Industrials (XLI) displayed an initial bullish day followed by a bearish candle that closed lower than its open, but still above the prior day’s open, with a modest increase in volume. This indicates a pause or minor pullback, suggesting a roughly even chance for either continued consolidation or a return to positive momentum. Lastly, Energy (XLE) registered a bullish first day, but the second day resulted in a close exactly at the prior day’s close on significantly lower volume. This points to clear indecision and a likely pause in upward movement. A roughly even chance exists for either consolidation or a minor retracement in the immediate period.
Equity Breadth
The percentage of S&P 500 members trading above their 200-day moving average (SPXA200R) displayed a generally constructive trend over the observed seven-day period. Beginning at 60.28% on September 23rd, the indicator experienced a brief dip to 58.08% on September 25th before embarking on a steady ascent to 62.28% by October 1st. This upward trajectory, coupled with the sustained level above 60%, suggests an improving proportion of S&P 500 components are maintaining their long-term bullish posture. It is likely that this expanding long-term market breadth provides a robust foundation for the overall market’s underlying health, indicating broader participation in any prevailing long-term advance.
Conversely, the percentage of S&P 500 members trading above their 50-day moving average (SPXA50R) exhibited greater volatility within the same timeframe. The indicator started at 58.28% but experienced a noticeable decline, falling below the critical 50% threshold to 48.50% on September 25th. This momentary contraction indicated a narrowing of short-term market breadth, with less than half of the S&P 500 components sustaining their intermediate-term uptrends. However, a subsequent recovery saw the indicator rebound significantly to 59.28% by September 30th, before settling slightly lower at 56.29% on October 1st. The recovery above 50% suggests that the short-term weakness was likely transient, with participation quickly re-expanding. The net effect for the period shows a slight overall decrease in this metric, indicating some ebb and flow in short-term enthusiasm, but the swift recovery from the mid-period low is a supportive sign.
The S&P 500’s 20-day Exponential Moving Average (EMA_20_DAY) demonstrated a consistent upward trajectory throughout the period, advancing from 6561.64 to 6607.52. This firmly establishes a short-term bullish trend for the index itself. The improving trend in SPXA200R makes it likely that the S&P 500’s underlying long-term strength is broadening, which typically underpins sustainable advances in the index. The recovery observed in SPXA50R after its mid-period dip suggests that the temporary narrowing of short-term breadth was not indicative of a sustained deterioration. Therefore, it is roughly even chance that the current short-term bullish trend in the EMA_20_DAY will persist, given the re-expansion of intermediate-term participation. Should SPXA50R experience another significant and sustained decline below 50%, or if SPXA200R were to reverse its upward trajectory, it would provide an early warning of potential weakening in the S&P 500’s underlying structure, which could challenge the upward momentum of the EMA_20_DAY. However, based solely on the provided data, such a reversal appears unlikely in the immediate term.
SPX Daily
Analysis of the SPX technical data over the past 90 days indicates a sustained and robust uptrend. Both the 50-day Exponential Moving Average (EMA_50_DAY) and the 200-day Exponential Moving Average (EMA_200_DAY) exhibit a consistent upward trajectory, with the EMA_50_DAY trading well above the EMA_200_DAY. This configuration, often referred to as a “golden cross” when first occurring, signifies strong long-term bullish market internals. Over the past seven trading days, the SPX has demonstrated notable upward momentum, closing higher in all observed sessions from September 25th to October 1st. Price action during this period advanced from 6604.72 to 6711.20, marking a substantial gain. The Relative Strength Index (RSI_14_DAY) has concurrently increased from 58.73 to 68.95, reflecting strengthening buying interest without yet entering extreme overbought territory, which typically commences above 70.
The most recent trading day, October 1st, 2025, presented a strong bullish candle. The SPX opened at 6664.92, recorded a high of 6718.48, and closed robustly at 6711.20, near its session high. This particular candle suggests dominant buying pressure and a clear short-term advance, following an opening slightly below the prior day’s close but quickly overcoming it. Immediate overhead resistance appears to be the intra-day high of 6718.48. Conversely, the low of this candle at 6656.20 may serve as nascent immediate support. More broadly, the prior high of 6693.75 (September 22nd) or the closing price of 6688.46 (September 30th) might act as short-term support zones should a minor pullback materialize.
Dynamic support levels are provided by the rising moving averages. The EMA_50_DAY, currently at 6479.95, represents a significant level of support in the intermediate term, having been consistently respected by price action for an extended period. The EMA_200_DAY, at 6081.87, offers robust long-term support. Given the substantial distance between the current price and these moving averages, a correction would need to be significant to test them. Historically, areas around 6584.44 (September 11th high) and 6532.04 (September 10th close) could also offer structural support, having served as prior resistance that was successfully overcome.
A bullish scenario is highly likely to continue in the near term. The strong, consistent uptrend, indicated by ascending price action and aligned moving averages, points to persistent demand. The last day’s strong bullish candle suggests continued buyer conviction. Price maintaining above the EMA_50_DAY reinforces the prevailing bullish sentiment. Further advances towards and potentially beyond the current highs are probable as long as momentum indicators like RSI remain below extreme overbought levels and price holds above immediate support.
Conversely, a bearish reversal is highly unlikely given the current technical posture. A short-term pullback or consolidation, however, is a roughly even chance, primarily due to the RSI_14_DAY approaching the 70 threshold (currently 68.95). Such a pause might involve the SPX trading sideways or experiencing a minor retracement to test immediate support levels, such as the 6656.20 or 6604.72 levels. A decisive break below the EMA_50_DAY (6479.95) would be required to signal a significant shift toward a bearish outlook, which is currently unlikely.
In the neutral case, price action could exhibit consolidation near current levels, possibly forming a flag or pennant pattern not observable with only daily candles, allowing the RSI to moderate from its elevated position without a deep retracement. Such a development would indicate that buyers are pausing rather than capitulating. Overall market sentiment, as inferred solely from these technical indicators, is largely driven by strong buying interest and positive momentum, reflecting confidence in the upward trend. The approaching overbought RSI levels, however, suggest that some market participants may begin to exercise caution, potentially leading to reduced upward velocity or a brief period of horizontal price movement.
SPX Technical Commentary (90-Day Outlook)
The S&P 500 (SPX) has demonstrated a sustained upward trajectory over the past 90 days, characterized by distinct phases of strong rallies interspersed with healthy, albeit sometimes sharp, pullbacks. The overall price action commenced around 5780 in late May and has ascended to a new 90-day high of approximately 6711 by October 1. Throughout this period, the Percentage Price Oscillator (PPO) consistently maintained a positive value, indicating that the 13-day Exponential Moving Average (EMA) remained above the 21-day EMA, thereby affirming a robust intermediate-term bullish trend. Volume data was not provided, so analysis is strictly based on price and oscillator values.
In the initial segment from late May to late July, the SPX experienced a powerful rally, advancing from around 5800 to roughly 6400. This advance was strongly supported by momentum indicators. The 14-day Relative Strength Index (RSI) surged into consistently overbought territory, frequently exceeding the 70 threshold and peaking at 76.29 on July 28. Concurrently, the PPO rose significantly from approximately 1.07 to 0.93 by July 3, underscoring strengthening bullish momentum. The persistent high RSI values during this period suggested an extended and strong buying interest, making a near-term correction increasingly likely as the market became overextended.
Following this extended rally, the SPX experienced a notable pullback from late July through early August. Prices retreated from highs around 6400 to a low of 6212.69 on August 1. This correction aligned with the expected cooling of momentum, as the RSI plummeted from its overbought levels to a low of 47.80 on August 1, resetting the oscillator for a potential future advance. The PPO also reflected this weakening momentum, declining from its July highs to 0.38 by August 7. Despite this retracement, the PPO remaining positive indicated that the underlying bullish trend, although challenged, was not fundamentally broken. A resumption of the uptrend was a roughly even chance following this consolidation, contingent on price holding key support levels.
From mid-August to the present, the SPX has largely resumed its upward trajectory, marking another leg higher from approximately 6370 to current levels near 6711. This rally saw the RSI once again push into the overbought zone, reaching 74.75 on September 22, signaling strong buying pressure. The PPO also rebounded, rising from a low of 0.35 on September 2 to 0.63 on September 22, confirming the renewed bullish momentum. A minor consolidation occurred in late September, causing the RSI to dip briefly to 58.73 and the PPO to 0.52, but both indicators quickly recovered.
As of October 1, the SPX closed at a new 90-day high of 6711.20. The 14-day RSI stands at 68.95, indicating strong bullish momentum but not yet severely overbought, implying further upside is plausible without an immediate significant pullback. The PPO, at 0.5474, is positive and shows a slight uptick from its recent dip, reinforcing the ongoing bullish intermediate-term trend. Based on these readings, a continuation of the uptrend in the immediate term is likely. However, given the proximity of the RSI to overbought levels and the lack of extreme acceleration in the PPO, a period of minor consolidation or a shallow pullback to digest recent gains remains a roughly even chance before a more definitive move higher or lower emerges. A substantial reversal from current levels, without further deterioration in momentum indicators, appears unlikely.