Daily Market Technical Analysis
Market Overview
The equity market closed positively with broad-based upward movement on the last trading day, although rising volatility (VIX) signals a likely increase in near-term choppiness. Large-cap indices demonstrated strong buying conviction, while small and mid-cap segments exhibited less robust momentum. The S&P 500 maintains a highly likely persistent bullish medium-term trend, but a period of consolidation or slight pullback is likely in the immediate term as momentum indicators retreat from overbought levels. Sector breadth shows significant participation, with defensive sectors and technology leading, yet energy and consumer discretionary experienced declines. In commodities, precious metals display strong bullish momentum (GLD, UNG), while oil (USO) and other industrial commodities are likely to face continued bearish pressure. Bond markets indicate a duration preference, with longer-duration instruments likely facing further downward pressure, contrasting with likely stability in shorter-duration bonds.
Market Indices
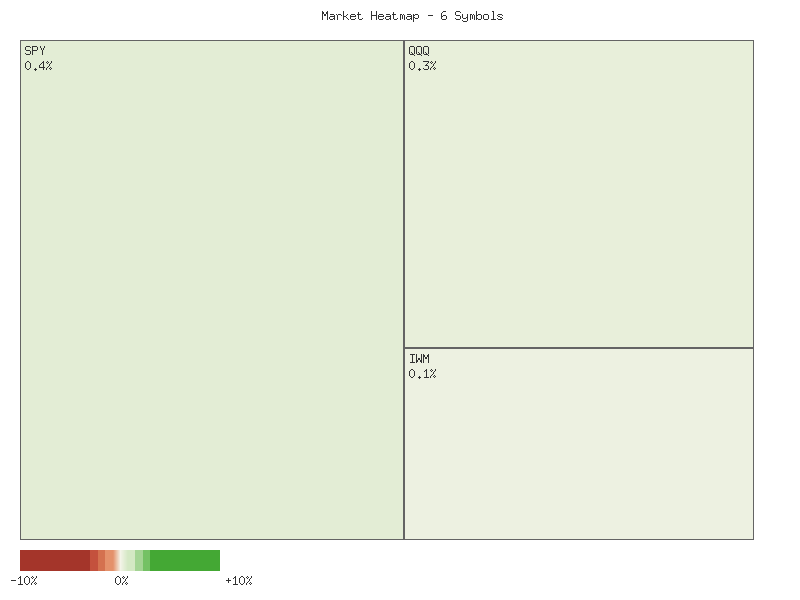
The equity market demonstrated a notably positive performance on the final trading day observed, September 30, 2025. All six primary market gauges — IJR, IWM, MDY, SPX, OEF, and QQQ — recorded positive daily percentage changes. The market breadth for these symbols was unequivocally positive, with six advancing and zero declining. This suggests a broad-based upward movement across small-cap (IJR, IWM), mid-cap (MDY), large-cap (SPX, OEF), and technology-focused (QQQ) segments. The aggregated daily percentage change for these symbols amounted to approximately 1.573%, indicating an overall higher market close for the period.
| Symbol | Daily Percent Change (2025-09-30) |
|---|---|
| OEF | 0.422% |
| SPX | 0.409% |
| QQQ | 0.274% |
| IJR | 0.211% |
| IWM | 0.141% |
| MDY | 0.116% |
Analysis of the VIX candle data over the past seven days (September 22-30, 2025) reveals a period of fluctuating volatility within a defined range. The VIX observed a low close of 15.29 on September 26 and a high close of 16.74 on September 25. Notably, the VIX closed higher on three of the last four trading days in this period (September 25, 29, 30), suggesting a general, albeit modest, upward drift in implied volatility expectations. The VIX open on September 30 was 16.49, closing at 16.28, representing a relatively contained movement within the established range, although still an advance from the previous day’s close.
Reviewing the VIX daily percent changes further clarifies this trend. On September 29, the VIX experienced a significant advance of approximately 5.428%. This upward momentum continued into September 30, with an additional gain of roughly 0.993%. This observation suggests an increasing expectation of future market volatility. Crucially, the simultaneous positive performance across the equity indices on September 30 while the VIX also advanced indicates a divergence from the typical inverse relationship, where rising equity prices often coincide with falling volatility.
This divergence presents a noteworthy technical pattern. The market’s upward trajectory, evidenced by the uniformly positive equity index performance, is generally perceived as bullish. However, the concurrent rise in the VIX suggests that market participants are likely hedging against potential downside risks or are anticipating increased price swings in the near term, even during periods of upward equity movement. Therefore, while the immediate market trend appears higher, the rising VIX implies an increased probability of heightened market choppiness or potential reversals in the short-to-medium term. Traders should likely monitor this developing pattern for signs of either a resolution of the divergence or an acceleration of volatility.
Fellow traders, let’s analyze the recent two-day market activity across various indices using our technical lens, focusing solely on the provided price and volume data. The period spanning September 29th and 30th, 2025, presents a nuanced picture, with large-cap indices exhibiting more compelling bullish action compared to their small and mid-cap counterparts.
The S&P 500 ETF (SPY) and S&P 100 ETF (OEF), representing the broader and largest-cap segments respectively, concluded the two-day period with notable strength. On September 30th, SPY registered a higher close, a higher high, and a slightly higher low compared to the prior day, supported by a significant increase in trading volume. This pattern, particularly the strong closing print near the high of the two-day range and increased volume, suggests buying conviction. OEF mirrored this strength, posting a higher close, higher high, and a higher low on September 30th, with its volume more than doubling from the prior day. Such price action combined with escalating volume makes it highly likely that these large-cap indices will experience continued upward momentum in the immediate term, potentially testing higher resistance levels if existing.
Conversely, the performance of the Nasdaq 100 ETF (QQQ) and the small-to-mid-cap segments (IWM, IJR, MDY) revealed less conviction. QQQ closed higher on September 30th but exhibited a slightly narrower range and a minor decrease in volume compared to September 29th. While a bullish close, the decreasing volume and inability to achieve a higher high than the prior day’s open imply that the buying interest might be less robust than in SPY or OEF. In the small-cap realm, both IWM (Russell 2000) and IJR (S&P SmallCap 600) experienced lower lows on September 30th, even as they managed to close higher than their respective September 29th closes. Although IWM saw a significant increase in volume on its upward move, the presence of a lower low and a closing price still below September 29th’s open suggests that underlying weakness persisted during the session. Similarly, IJR’s higher close on increased volume was tempered by its lower low and failure to reclaim September 29th’s open. For these small-cap indices, further upward continuation is likely, but the presence of lower lows within the two-day period raises questions about the sustainability of strength without more decisive price action.
The MidCap 400 ETF (MDY) also presented a mixed signal. Despite closing higher on September 30th, it posted a lower high and a lower low compared to September 29th. Critically, this modest upward closing move was accompanied by a notable decrease in volume. This combination of a higher close on decreased volume after making a lower low is often viewed with caution by technical analysts, as it suggests the buying pressure may be weakening or insufficient to overcome potential selling interest. Therefore, further significant upward continuation for MDY appears to be a roughly even chance, given the divergent volume pattern.
Considering the divergences, particularly the strong, high-volume rallies in SPY and OEF versus the more tentative or weaker-volume advancements in QQQ, IWM, IJR, and MDY, we can infer differing market sentiment across capitalization ranges. It is highly likely that large-cap indices will lead the market in the immediate future, potentially drawing capital from other segments. However, the weaker characteristics in QQQ and especially MDY suggest that if a broader market pullback were to occur, these segments might be more vulnerable. An alternative scenario, though unlikely given the large-cap strength, would involve a broad market consolidation or reversal, potentially stemming from the unconvincing nature of the small and mid-cap rallies. Traders should monitor the follow-through of the strong large-cap moves and watch for confirmation or divergence from QQQ and the small-mid cap indices.
Technical Analysis of SPX: Momentum Deceleration Within a Sustained Uptrend
The S&P 500 (SPX) technical data over the past 90 days depicts a robust and persistent bullish trend, characterized by a series of higher highs and higher lows. From late May, the index has advanced significantly, climbing from approximately 5840 to its recent high near 6693 by late September. This upward trajectory was punctuated by several sharp rallies and relatively short-lived, shallow pullbacks or consolidations. Notably, significant price corrections, such as the one observed between late July and early August (from ~6390 to ~6238), were quickly absorbed, leading to resumed upward movement and new all-time highs. The latest price data shows the SPX closing near 6688, indicating proximity to its recent peak and a resilient bullish structure.
The 14-day Relative Strength Index (RSI) has consistently reflected the underlying strength of this trend. Throughout the 90-day period, the RSI frequently pushed into overbought territory (above 70), particularly in late June, early July, and then again from late July into mid-August, and most recently in mid-to-late September. These extended periods above 70 are characteristic of strong uptrends where momentum favors buyers. A notable bearish divergence occurred in mid-August when the price made a higher high (August 14th around 6468) while the RSI made a lower high (68.08 versus 76.29 on July 28th), which was subsequently followed by a price pullback. Currently, the RSI has retreated from its September 22nd peak of 74.75 to 66.98 by September 30th. This movement suggests a cooling of immediate buying intensity but remains above the neutral 50 level, indicating continued underlying strength.
The Percentage Price Oscillator (PPO) confirms the sustained bullish momentum throughout the period. The PPO line has remained consistently above the zero line for the entire 90 days, signifying that the shorter-term 13-day Exponential Moving Average (EMA) has been continuously above the longer-term 21-day EMA. This uninterrupted positive PPO reinforces the view of a dominant bullish bias. Peaks in PPO, such as in early July (0.939) and mid-August (0.543), generally coincided with strong price rallies, while declines indicated temporary deceleration of momentum. The most recent PPO reading shows a decline from a peak of 0.635 on September 22nd to 0.530 on September 30th. This recent downturn in the PPO further indicates a loss of short-term bullish momentum, mirroring the RSI’s retreat from overbought conditions.
Synthesizing these indicators, it is highly likely that the broad bullish trend in the SPX will persist over the medium term, given the consistent higher highs and the PPO remaining firmly in positive territory. However, in the immediate term, a period of consolidation or a slight pullback is likely. Both the RSI’s retreat from overbought levels and the PPO’s decline from its recent peak signal a temporary exhaustion of buying pressure. While a continuation of the upward trend after a brief pause or shallow correction is highly likely, an alternative scenario where a deeper, more pronounced correction occurs is a roughly even chance, especially if momentum indicators continue to soften or if price fails to quickly reclaim its recent high. A significant and sustained downtrend beginning at this juncture is unlikely, as the underlying technical structure remains robustly bullish.
Technical Analysis: QQQ - 90-Day Outlook
QQQ has exhibited a pronounced upward trend over the provided 90-day period, progressing from the low- in late May to closing at .37 on September 30th. This advance was punctuated by a notable price decline in early August, where QQQ fell from .01 to .88 on August 1st, corresponding with the highest daily volume noted in the data at 69.4 million shares. Subsequent to this, a significant recovery and rally materialized from late August through September, propelling QQQ to new highs within this dataset. The recent price action, particularly in late September, indicates a robust bullish phase, with QQQ briefly surpassing the mark and closing near its period highs.
The 14-day Relative Strength Index (RSI) provides insights into momentum and potential overbought/oversold conditions. During the June-July rally, the RSI frequently entered overbought territory (above 70), peaking at 73.11 on July 28th, which was followed by the aforementioned price decline in early August. Similarly, the strong rally in September pushed the RSI to an extreme overbought reading of 75.35 on September 22nd. Following this peak, the RSI has retreated to 67.43 by September 30th. This retreat, while still indicating strong bullish momentum (above 50), suggests that the immediate, aggressive buying pressure has likely dissipated. The cooling of the RSI from extreme levels, even with price holding its gains, suggests a period of consolidation or reduced upward velocity is a roughly even chance.
The Percentage Price Oscillator (PPO), utilizing 13- and 21-day exponential moving averages, generally confirms the trend observed in price action. The PPO maintained positive territory through late May and early June before beginning a prolonged decline, eventually crossing below the zero line around June 18th and remaining negative until late August, signaling a bearish momentum phase. A notable recovery began in early September, with the PPO crossing back into positive territory and accelerating upwards, reaching a peak of 0.812 on September 23rd. However, the PPO has subsequently declined to 0.704 by September 30th. This recent decrease in PPO, alongside the strong price close, presents a minor negative divergence, suggesting that the underlying bullish momentum may be decelerating despite the recent price strength. This could portend a short-term price correction or consolidation.
Considering the confluence of these indicators, QQQ is currently in an established bullish trend. The strong price advance in September, coupled with a PPO firmly in positive territory, indicates that continued upward movement is likely, albeit with potentially reduced velocity. However, the retreat of the RSI from extreme overbought levels and the nascent decline in the PPO from its recent peak suggest that the immediate impetus for further sharp gains may be waning. Therefore, a period of consolidation or a minor pullback in the near term is a roughly even chance to likely outcome. An alternative scenario is that, given the strong upward trend observed throughout September, QQQ could very likely resume its upward trajectory if the recent PPO decline proves to be a temporary pause in momentum, particularly if RSI manages to quickly reverse its recent deceleration. Traders should likely monitor these momentum indicators for further directional cues.
As a seasoned technical analyst, my assessment of IWM’s market data over the past 90 days reveals a generally constructive underlying trend, though with clear shifts in short-term momentum. The candlestick data indicates a notable uptrend marked by a series of higher highs and higher lows throughout the period. Distinct periods of strong upward price appreciation were observed in late June/early July, followed by another significant rally in mid-August, and a sustained push higher into mid-September. However, the most recent price action from mid-September shows a discernible pullback from these elevated levels. This recent deceleration, accompanied by intermittent higher volumes on down days, suggests that while the broader bullish structure remains intact, the immediate impulsive strength has diminished.
The 14-day Relative Strength Index (RSI) provided corroborating evidence for these momentum shifts. IWM’s RSI consistently moved within the bullish range for much of the period, frequently testing and occasionally breaching the overbought threshold of 70. Specifically, on July 3rd, the RSI reached 71.57, and again on September 18th, it peaked at 71.23. These excursions above 70 typically indicate stretched buying conditions and are often followed by either a price consolidation or a corrective phase. In both instances, the RSI subsequently declined sharply, aligning with observed price pullbacks. The current RSI reading of 59.88, while still residing in neutral-to-bullish territory, represents a notable retreat from its recent overbought peak on September 18th. This downward trajectory strongly suggests a cooling of the recent bullish momentum, making an immediate resumption of the aggressive uptrend unlikely.
Further insights into momentum are provided by the Percentage Price Oscillator (PPO) using 13- and 21-day exponential moving averages. The PPO largely remained above its zero line throughout the 90-day window, reinforcing the overall bullish bias. Peaks in the PPO, such as 1.17 on July 10th and values above 1.0 in late August and mid-September, corresponded with robust upward price movements. A significant dip was observed from late July to mid-August, where the PPO fell below zero to a low of 0.08, indicating a temporary cessation of bullish momentum and coinciding with a period of price consolidation. Currently, the PPO stands at 0.6977, having declined from its recent high of 1.00 on September 23rd. This downward movement, despite remaining positive, underscores the weakening short-term bullish momentum, aligning with the RSI’s indication of slowing upward impetus.
Considering the confluence of these technical indicators, a continuation of the current price pullback or a period of horizontal consolidation for IWM is likely in the immediate term. Both the RSI and PPO, having retreated from recent elevated levels, suggest that the short-term buying pressure has eased. For IWM to resume its prior aggressive uptrend, a re-energization of momentum would be required, which would manifest as a reversal in the current downward trajectory of both the RSI and PPO. Absent such a shift, a swift resumption of the strong rally is unlikely. Conversely, if the PPO were to continue its descent and potentially cross below its implied signal line or the zero mark, a deeper price correction would become likely. However, given that both momentum indicators currently remain within generally bullish-neutral zones (RSI > 50, PPO > 0), a complete reversal of the underlying longer-term uptrend is presently unlikely. The next several trading sessions will be critical in discerning whether IWM stabilizes for a base or extends its current corrective phase.
Tech Sector Analysis
The relative performance analysis of QQQ versus SPY reveals that the technology-heavy NASDAQ-100 ETF has demonstrated a pattern of outperformance against the broader S&P 500 ETF across both the 14-day and 30-day lookback periods. The QQQ/SPY ratio exhibits a clear upward trend in both timeframes, rising from approximately 0.8834 in early September to a current ratio of 0.9012. This consistent increase indicates that QQQ’s price appreciation has generally exceeded that of SPY over the analyzed intervals.
Closer examination of the trend characteristics highlights some nuances. While the direction is definitively “up” for both the 14-day and 30-day ratios, the reported “strength” is characterized as “weak.” This suggests that the outperformance, while present, lacks significant momentum or conviction. The 14-day period shows a 1.348% increase, marginally higher than the 1.286% increase over the 30-day period, indicating a slight acceleration in QQQ’s relative strength in the more recent two weeks. The current ratio of 0.9012 is very close to the recent high of 0.90306 observed on September 22, positioning QQQ’s relative strength near the upper bound of its recent trading range for both periods (relative positions of 0.866 and 0.9057, respectively).
Considering these patterns, there is a roughly even chance that QQQ will continue its weak outperformance against SPY in the immediate term. The established upward trend provides a baseline expectation, but the “weak” strength rating implies that strong follow-through is not highly probable. A plausible alternative scenario is a period of consolidation or a minor retracement in QQQ’s relative strength. This is supported by the slight pullback from the peak ratio of 0.90306 on September 22 to the current 0.9012, suggesting that the ratio may be undergoing a brief period of mean reversion after reaching an extended level.
Volatility metrics also provide insight. The 14-day volatility (0.000018) is significantly lower than the 30-day volatility (0.000041). This reduction in short-term price fluctuations for the ratio, while the trend remains positive but weak, could indicate a compression of trading range or a period of indecision. A sustained low volatility environment following an upward move may precede either a renewed push higher or a more pronounced reversal. However, given the “weak” trend strength, a powerful continuation upward is unlikely without new catalysts or a re-accumulation phase.
In summary, the technical data suggests QQQ has been the market leader against SPY, a trend that persists up to the latest data point. However, the weak strength of this trend and the extended nature of the current ratio relative to its recent range indicate that the probability of strong continued outperformance is not high. Instead, the probability for continued modest outperformance by QQQ appears comparable to the probability of the ratio entering a phase of consolidation or experiencing a minor decline, potentially reverting towards its 14-day or 30-day average ratios of 0.8987 and 0.8929, respectively.
As a CMT with extensive experience, my analysis of the QQQ/SPY ratio over the past 90 days focuses purely on the provided technical data, applying rigorous principles to ascertain likely future movements.
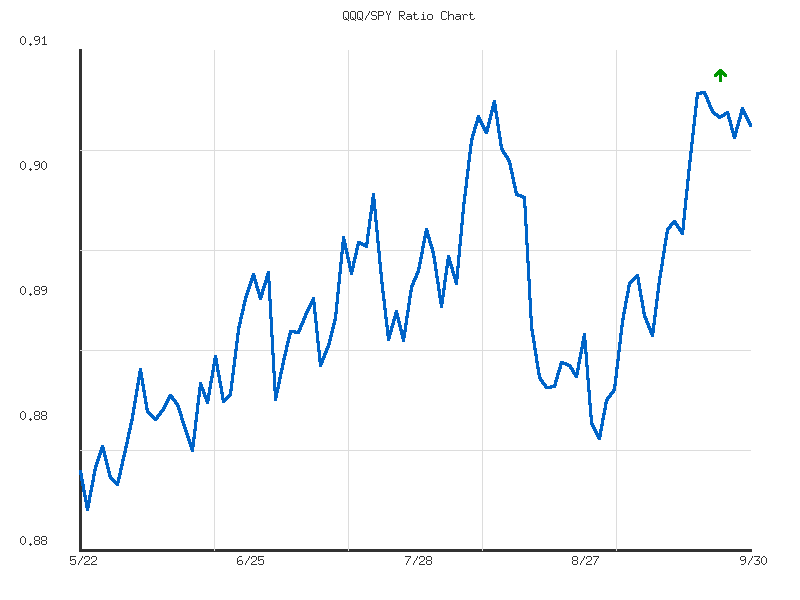
The overall trend for the QQQ/SPY ratio over the 90-day period is explicitly identified as “up,” indicating that the Nasdaq 100 (QQQ) has been outperforming the S&P 500 (SPY) on a relative basis. This upward movement has resulted in a 2.235% increase in the ratio from its starting point. However, it is crucial to note that the trend strength is classified as “weak.” This “weak” designation, combined with the low volatility observed in the data (0.00003728), suggests that while the direction of relative outperformance by QQQ is established, it has been a gradual and measured ascent rather than a robust, high-conviction surge. The current ratio stands at 0.9012, positioned very close to its 90-day high of 0.9030. Specifically, the relative position of 0.92189 confirms that the ratio is near the upper end of its recent trading range.
Examining the price action within the 90-day window, the ratio initiated its ascent from a low of approximately 0.8793 in late May. Following this, the ratio generally drifted higher, experiencing intermittent minor pullbacks that were ultimately resolved as the upward trajectory resumed. A notable acceleration occurred in late August and early September, pushing the ratio to its 90-day peak of 0.9030 on September 22nd. Since this peak, the ratio has experienced a slight consolidation or minor pullback, settling at the current 0.9012. This suggests that the 0.9030 level is presently acting as a near-term resistance point. Given the “weak” trend strength, a forceful breach above this resistance in the immediate future is probably not highly likely without a discernible increase in positive momentum, which is not indicated in the provided metrics.
Considering the current position near the 90-day high and the “weak” strength of the prevailing trend, a period of consolidation or a modest pullback in the QQQ/SPY ratio is a likely near-term scenario. Potential support levels could emerge around the average ratio of 0.8910, or previous consolidation zones, such as those observed around the 0.890-0.895 range in July and early August, where the ratio found temporary footing before resuming its climb. A retest of these levels would represent QQQ’s relative outperformance stabilizing or slightly receding.
While a significant reversal of the entire 90-day “up” trend is currently unlikely, given the absence of any technical breakdown patterns in the provided data, traders should monitor the ratio’s interaction with the 0.9030 resistance. A sustained failure to overcome this resistance, combined with a decisive move below key support levels such as the average ratio, would increase the probability of a more pronounced period of QQQ underperformance relative to SPY. Conversely, should the ratio convincingly break above 0.9030 on increased momentum (which would likely be reflected in an adjusted ‘strength’ metric), it would signal a renewed push for QQQ outperformance. However, based solely on the data at hand, the expectation of a continued gradual upward drift or a mild retrenchment holds roughly even chance, with a sharp breakout considered less probable.
IWM vs. SPY
Analysis of the IWM/SPY ratio over the 30-day horizon indicates a prevalent “up” trend, albeit with “weak” strength. This suggests a period where the Russell 2000 (IWM) has, on balance, demonstrated relative outperformance against the S&P 500 (SPY). The ratio’s change percent of 2.72% further corroborates this upward bias in relative strength, showing a meaningful gain for IWM compared to SPY over the observation period. The current ratio stands at 0.3632, positioned at approximately 60.5% within its 30-day range (from a low of 0.3532 to a high of 0.3697). This relative positioning, above the 30-day average of 0.3634, suggests that despite the “weak” trend strength, the underlying momentum for IWM’s relative outperformance has been present over the medium term. The volatility over this period is comparatively low, indicating a relatively steady, gradual trend.
Conversely, examining the shorter 14-day period reveals a shift in the ratio’s behavior. The IWM/SPY ratio exhibits a “sideways” trend with “weak” strength, accompanied by a slight negative change of -0.41%. This indicates a recent pause or minor reversal in the relative outperformance observed in the 30-day data. The current ratio of 0.3632 is now below the 14-day average of 0.3645 and registers at only 25% of its narrow 14-day range (from 0.3610 to 0.3697). This juxtaposition of a medium-term weak upward trend with a short-term weak sideways to slightly downward drift suggests a deceleration in IWM’s relative strength. The extremely low volatility (0.0000052) in the 14-day data reinforces the notion of a consolidation phase, lacking a strong directional impetus in the immediate term.
Considering the observed patterns, it is roughly an even chance that the IWM/SPY ratio will continue its weak upward trajectory, maintaining IWM’s relative outperformance over SPY, given the medium-term trend. However, the short-term data introduces a counterbalancing dynamic. It is slightly likely that the recent consolidation or minor relative underperformance of IWM will persist in the immediate future. For IWM to resume its relative outperformance with more conviction, a sustained advance above the high of 0.3697 from both observed periods would be necessary; such a move would make continued outperformance likely. Conversely, a decisive break below the 14-day low of 0.3610 would make it likely that SPY will begin to demonstrate relative outperformance, invalidating the current short-term sideways consolidation pattern. The extremely low volatility suggests that significant moves in either direction would require a notable shift in market dynamics not currently evident in the provided data.
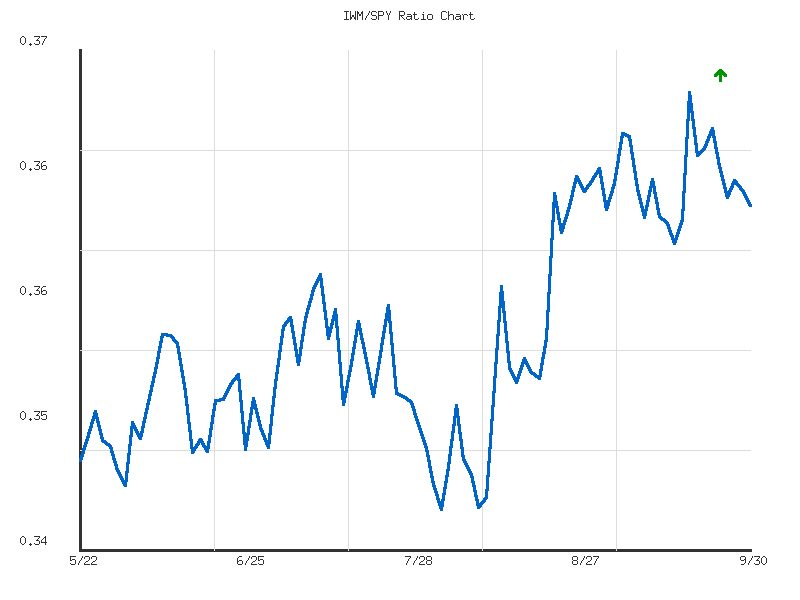
As a Chartered Market Technician with over 15 years of experience, my analysis of the IWM/SPY ratio over the past 90 days reveals a clear but moderately paced technical trend. This ratio, representing the relative performance of the Russell 2000 (small-cap) against the S&P 500 (large-cap), has demonstrably advanced from approximately 0.3485 in late May to its current level of 0.3632 by the end of September. The provided trend analysis confirms an “up” direction with “moderate” strength, indicating a consistent outperformance of small-cap stocks relative to large-cap stocks during this period, reflected in a 4.223% increase in the ratio.
During this 90-day timeframe, the IWM/SPY ratio established a discernible range. The lowest point observed was approximately 0.3457 on August 1st, which subsequently acted as a significant support level. The ratio then ascended, reaching its 90-day high of 0.3697 on September 18th. This trajectory suggests a resilient upward bias, with periods of consolidation and modest pullbacks failing to reverse the overarching trend. The current ratio of 0.3632 represents a retreat from this recent peak, implying that the ratio is undergoing a short-term corrective or consolidation phase following its prior advance.
Considering the recent price action, it is likely that the ratio will continue to consolidate or experience further modest declines in the immediate term. The retreat from the September 18th high to the current level suggests a temporary pause in the small-cap outperformance. Support is likely to be found around the 0.3600 level, an area where prior advances encountered temporary resistance before breaking higher. Should this level fail to hold, a retest of the average ratio of 0.3558 is a probable next scenario, as dynamic averages often serve as magnetic points during pullbacks within an established trend.
Looking forward, there are several plausible scenarios. A continuation of the established moderate uptrend is possible, especially if the ratio finds support at or above its average. In this instance, a renewed attempt to challenge and potentially surpass the 0.3697 high would be the next technical objective, though it is not immediately probable without further evidence of renewed buying strength in IWM relative to SPY. Conversely, should the ratio break below the 0.3558 average, it would indicate a weakening of the moderate uptrend, making a deeper retracement towards the August 1st low of 0.3457 an increasingly likely, though not yet primary, alternative scenario. The overall moderate strength suggests that significant trend reversals are relatively unlikely without a more substantial breakdown in the pattern.
Commodities
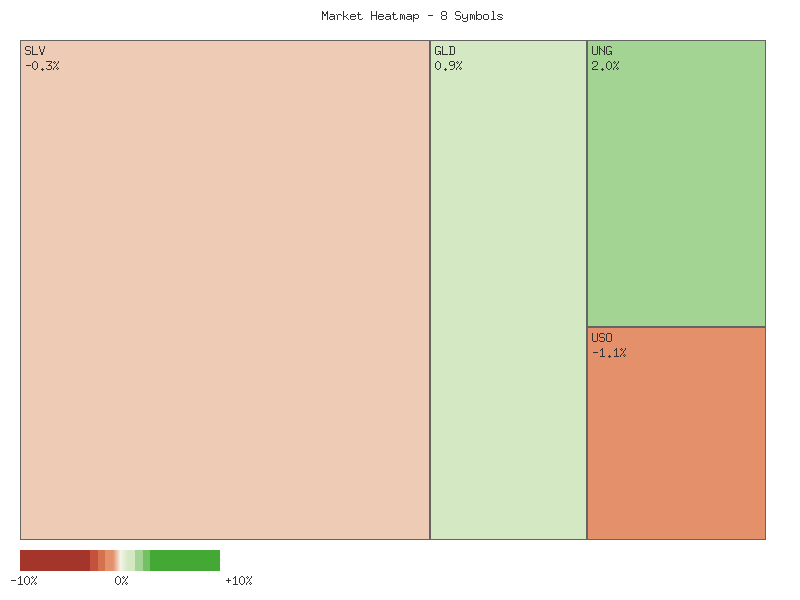
A review of the recent daily performance across selected commodity-linked instruments for September 30, 2025, reveals a mixed but predominantly negative landscape. The daily percent changes for these symbols are presented in descending order in the following matrix:
| Symbol | Daily Percent Change |
|---|---|
| UNG | 1.950% |
| GLD | 0.854% |
| UGA | -0.298% |
| SLV | -0.306% |
| DBC | -0.398% |
| CPER | -0.957% |
| CORN | -1.021% |
| USO | -1.126% |
Analysis of the market breadth indicates a strong bearish sentiment for the observed period. Out of the eight symbols, only two (UNG and GLD) registered advances, while six experienced declines. This 3:1 ratio of declining to advancing symbols suggests notable underlying weakness across the broader commodity complex represented. When summing the individual daily percent changes, the aggregated performance for these instruments is -1.302%. This net negative change further confirms a generally lower overall sentiment for this specific basket of commodities on the last trading day.
The Gold/Silver (GLD/SLV) ratio over the 14-day period exhibits a moderate downward trend, with a change percentage of -5.45%. The current ratio of 8.38966 is positioned at 16.78% of the range between the 14-day low (8.28332) and high (8.91691), indicating that the ratio is near its recent lows. This pattern suggests silver (SLV) has likely demonstrated sustained relative strength compared to gold (GLD) during this two-week interval. The moderate volatility of 0.0419 implies this trend has developed with a discernible directional bias.
Extending the analysis to the 30-day GLD/SLV ratio reinforces the observation of silver’s outperformance. This ratio also displays a moderate downward trend, with a more substantial change percentage of -6.91% over the longer period. The current ratio of 8.38966 falls at 14.57% of the range, closer to the 30-day low of 8.28332 than the high of 9.01299. The convergence of the current ratio to the lower end of both the 14-day and 30-day ranges suggests that silver is very likely to continue exhibiting relative strength against gold in the near-term, based purely on this historical trend data. However, a significant shift in macroeconomic factors or market sentiment could present a roughly even chance of a trend reversal, although current technical data does not provide such indications.
As a CMT with over 15 years of experience, my analysis of the provided 2-day technical data for these commodity-related ETFs focuses solely on price action and volume patterns to discern short-term directional probabilities.
We observe clear bullish momentum in GLD and UNG. GLD presented a modest bullish candle on Day 1, which was decisively followed by a strong bullish expansion on Day 2, closing near its high. This price action, marked by a higher high, higher low, and a significantly higher close, indicates robust buying pressure. Although volume decreased slightly on Day 2, it remained substantial and did not negate the strong price advance, suggesting that a continuation of this short-term uptrend is likely. Similarly, UNG showed two consecutive strong bullish candles, each achieving higher highs, higher lows, and closing near their respective daily highs. This consistent upward progression, supported by robust volume (despite a slight dip on Day 2), strongly suggests that further upward movement for UNG is probable in the immediate term.
Conversely, several ETFs exhibit varying degrees of bearish pressure or potential reversal. DBC demonstrated two consecutive bearish closes, with Day 2 forming a lower high and lower low. The notable increase in volume accompanying Day 2’s decline lends conviction to the emerging bearish momentum, making a continuation of this short-term downtrend likely. USO showed an even more pronounced bearish trend, with two strong bearish candles confirming lower highs, lower lows, and lower closes. The critical observation here is the increasing volume on the second day’s decline, which reinforces the downward movement and suggests that a continuation of the bearish trend is highly probable. For CORN, after a modestly bullish Day 1, Day 2 witnessed a sharp bearish reversal, closing near its low and significantly below Day 1’s close. The increase in volume on this bearish day suggests distribution, indicating that a continuation of downward pressure is likely. Finally, SLV saw an indecisive Day 1, which was followed by a significant bearish candle on Day 2, creating a lower high and lower low relative to Day 1. Although SLV recovered somewhat from its intraday low, the overall price action points to increasing bearish pressure. A continuation of downward momentum appears likely in the immediate term, but the lower shadow suggests some underlying buying interest that could lead to a period of consolidation.
For UGA and CPER, the signals are more mixed, suggesting a period of uncertainty or consolidation. UGA experienced a strong bearish decline on Day 1. However, Day 2 presented a smaller bullish candle, attempting a bounce, but notably on significantly decreased volume. Despite the green candle, Day 2 recorded a lower high and lower low relative to Day 1. This suggests that while there was an attempt at recovery, it lacked conviction. Therefore, a continuation of bearish pressure is likely, though a weak bounce or short-term consolidation is possible given the diminished buying interest. CPER displayed strong bullish action on Day 1, closing near its high. Day 2, however, was a bearish candle with a lower high and lower close compared to Day 1, accompanied by reduced volume. The close on Day 2 remained above Day 1’s open, indicating not a full reversal but a potential pullback within an otherwise strong prior trend. Given these conflicting signals, there is a roughly even chance for either a continuation of this short-term pullback or a resumption of the bullish momentum seen on Day 1, with the reduced volume on Day 2 typically accompanying corrective phases rather than outright reversals.
Technical Analysis of SLV (90-Day View)
Over the past 90 days, SLV has exhibited a sustained and robust uptrend, characterized by distinct phases of bullish advancement and subsequent consolidations. The price action commenced in late May around , initiating a significant rally into June, reaching approximately .50. Following a period of consolidation in late June and early July, prices advanced further to reach around .70 by late July. A notable correction occurred in late July, bringing SLV down to approximately .50. The period from late August through September has witnessed the most aggressive leg of this rally, with SLV breaking out from the mid- range to establish new highs above , closing the observed period at .37. This upward movement has been consistently supported by elevated trading volumes during the periods of price appreciation, lending credibility to the strength of the buyers and the prevailing trend.
The 14-day Relative Strength Index (RSI) provides valuable insight into the momentum and potential overextension of these price movements. During early June, the RSI touched the overbought threshold (above 70), which was followed by a period of sideways consolidation in price. Similarly, in late July, the RSI again registered above 70, preceding the aforementioned price correction from .70 to .50. Critically, throughout much of September, the RSI has remained deeply entrenched in overbought territory, rising above 70 on multiple occasions and peaking at 81.50 on September 29th before closing at 79.94. This prolonged and elevated RSI reading strongly suggests that SLV is currently in an overextended condition.
The 13-21-day Percentage Price Oscillator (PPO) further corroborates the observed momentum. The PPO maintained a positive trajectory for much of the 90-day period, confirming a prevailing bullish sentiment. While it did dip into negative territory briefly in late July, confirming the corrective phase, it quickly rebounded and has since shown a strong, sustained upward climb, ending the period with a robust positive value of 2.53. This upward momentum in the PPO, coupled with the rising price action and increasing volume, indicates the presence of substantial buying interest and a deeply embedded uptrend.
Considering the confluence of these technical indicators, a short-term pullback or period of consolidation in SLV is likely in the near term. The highly elevated and sustained RSI reading above 70, peaking above 80, historically indicates that price appreciation has occurred at an unsustainable rate and that a cooling-off period is probable. However, the strong and continuous positive momentum exhibited by the PPO, along with high trading volumes accompanying the recent rallies, suggests that a major trend reversal is unlikely at this juncture. An alternative scenario is that the strong momentum could sustain the rally for a brief period, pushing RSI further into extreme territory before a significant correction. Nevertheless, the pattern of RSI peaks preceding price pullbacks makes a near-term retracement roughly even chance to likely. Such a move would allow the RSI to normalize without necessarily signaling the end of the broader uptrend, which remains intact based on the PPO and price structure. Retail traders should be mindful of the current overbought condition and consider the increased likelihood of volatility.
GLD has exhibited a notable shift in its technical posture over the past 90 days, transitioning from a period of sideways consolidation to a strong upward trend. From late May to late August, price action largely fluctuated within a range, bounded roughly between and , with a brief dip to a low of .89 on June 27th. Volume during this initial phase was generally moderate, indicating a lack of strong directional conviction. However, a decisive bullish breakout initiated around late August, propelling GLD from approximately towards a high of .57 by September 30th. This accelerating rally was notably supported by consistently higher trading volumes, frequently exceeding 15 million shares during significant up moves in September, which suggests increasing market participation and sustained buying interest. The overall price structure in the latter part of the period, characterized by a series of higher highs and higher lows, confirms a robust uptrend.
The Relative Strength Index (RSI) for GLD (14-day) broadly mirrored the price action, initially oscillating around the neutral 50-60 zone and briefly touching oversold levels (e.g., 39.55 on July 30th) during periods of weakness. As the price trend accelerated in late August, the RSI surged into overbought territory (above 70), hitting multiple peaks, including 78.43 on September 8th and reaching 79.87 on the final day of the data, September 30th. This sustained presence in the overbought region is a hallmark of strong trends, indicating persistent buying pressure. While an RSI reading nearing 80 indicates an extended move, the absence of a bearish divergence (where price makes a higher high but RSI makes a lower high) suggests that the immediate upward momentum remains intact.
Complementing the RSI, the Price Percentage Oscillator (PPO) (13, 21-day) also provides a clear picture of strengthening momentum. After fluctuating around the zero line for much of the May-August period, indicating balanced or indecisive momentum, the PPO decisively crossed above zero around August 22nd. Since then, it has maintained a strong positive trajectory, escalating to 1.5284 by September 30th – its highest value in the observed 90-day window. This sustained and accelerating positive PPO value strongly reinforces the bullish trend and indicates robust buying momentum. The lack of any significant divergence between price and PPO further confirms that the current upward movement is likely to continue in the near term.
Considering the confluence of these technical indicators, GLD is highly likely to continue exhibiting bullish momentum. The strong price trend, supported by increasing volume and confirmed by the robust PPO reading, points to sustained buying interest. However, the significantly overbought RSI (nearing 80) introduces a modest chance of a short-term price consolidation or a minor pullback in the immediate future, which would typically relieve some upward pressure. A deceleration in the PPO’s upward trajectory or a clear bearish divergence in the RSI would be required to indicate a roughly even chance of a significant trend reversal, which is not presently observed. Absent such signals, the prevailing technical data suggest the path of least resistance for GLD remains upward.
Bonds
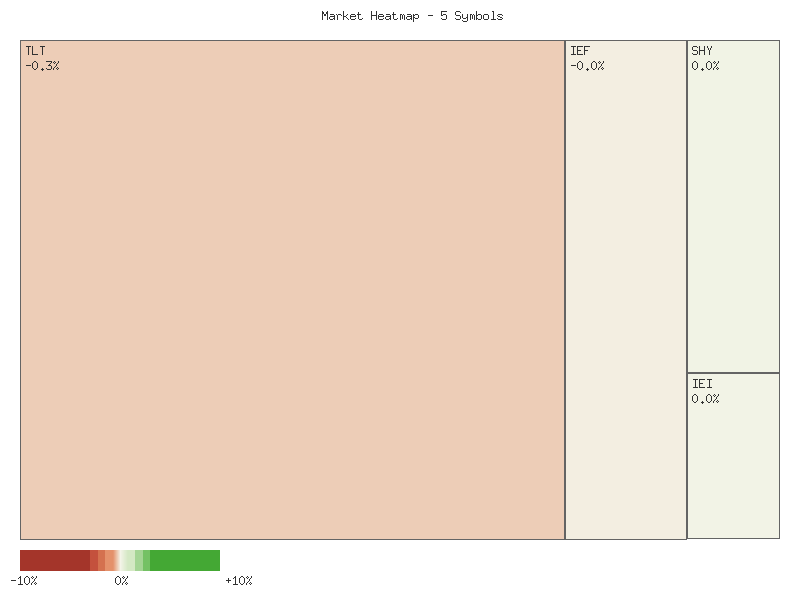
The observed daily percentage changes for the specified fixed income instruments on 2025-09-30 present a mixed but predominantly negative picture. The compiled data, sorted in descending order of daily percent change, is as follows:
| Symbol | Daily Percent Change |
|---|---|
| SHY | 0.048% |
| IEI | 0.033% |
| IEF | -0.041% |
| UTHY | -0.281% |
| TLT | -0.290% |
Two symbols advanced, while three declined, suggesting a slightly negative bias in market sentiment for this specific cohort of fixed income ETFs. The range of movement spanned from a modest gain of 0.048% (SHY) to a more significant decline of -0.290% (TLT). The largest absolute movements occurred on the downside, specifically within the longer-duration instruments, TLT and UTHY. This indicates a likely stronger bearish pressure on assets with extended maturities compared to shorter-term counterparts.
Aggregation of the individual daily percentage changes reveals a net negative shift across the analyzed instruments. The summed daily percentage change amounts to approximately -0.531%. This aggregate movement strongly suggests an overall lower trajectory for the composite group on this particular trading session. The magnitude of this negative aggregate change, while not extreme, is sufficiently pronounced to indicate a general downward momentum within this segment of the fixed income market. It is highly likely that this aggregate decline is primarily driven by the underperformance of the longer-duration assets, given their more substantial individual declines.
Market breadth for this specific basket of fixed income instruments indicates a mild negative divergence. Two symbols (SHY, IEI) registered advances, while three symbols (TLT, UTHY, IEF) experienced declines. This 2:3 advance-decline ratio points to an underlying selling pressure affecting a majority of the observed instruments. Although not indicative of an overwhelming bearish environment based solely on this limited breadth, the observation of more declining than advancing symbols supports the inference of a prevailing downward force. The likelihood of continued broad-based weakness for these instruments appears greater than a broad-based recovery based on this breadth signal.
A detailed examination of relative performance highlights a clear distinction between shorter and longer-duration instruments. SHY and IEI, representing shorter and intermediate-term bonds, respectively, recorded positive daily changes, albeit modest. Conversely, IEF, UTHY, and TLT, which generally encompass intermediate to long-term durations, posted negative returns, with TLT and UTHY demonstrating the most significant drawdowns. This pattern suggests a likely flattening or steepening of the yield curve, assuming these ETFs are proxies for different points on the curve. Technically, this relative weakness in longer-duration assets indicates a probable decrease in demand for duration risk, or an increase in long-term yield expectations. A sustained pattern of short-duration outperformance against long-duration underperformance would be consistent with a bearish outlook for longer-term fixed income investments.
Greetings, retail traders. We are analyzing the provided two-day market data for various bond ETFs (TLT, UTHY, IEF, IEI, SHY) using rigorous technical analysis principles. Our assessment is based solely on the presented candlestick patterns and associated volume, devoid of any external context.
Overall, the provided two-day market data presents a divergent picture across the duration spectrum of the bond market. Longer-duration instruments appear to be encountering significant selling pressure, while shorter-duration counterparts exhibit relative stability and slight upward momentum. This bifurcation suggests a potential shift in market sentiment, favoring shorter maturities over longer ones based purely on the technical price action and volume.
For the iShares 20+ Year Treasury Bond ETF (TLT) and iShares 7-10 Year Treasury Bond ETF (IEF), the technical picture is likely bearish in the immediate term. Both instruments displayed a strong bullish candle on the first day, followed by a significant bearish reversal on the second day. TLT’s second candle opened near the previous close, rallied to a new high, but then fell to close below its opening and the prior day’s open, accompanied by a notable increase in volume. This pattern, resembling a Bearish Engulfing or Dark Cloud Cover, indicates a rejection of higher prices. Similarly, IEF exhibited a Dark Cloud Cover pattern, opening higher on the second day but closing deep into the body of the first bullish candle, also on increased volume. The higher volume on these bearish reversal days suggests conviction in the selling pressure. Therefore, a continuation of this downward pressure is likely for these longer-duration assets.
The iShares 3-7 Year Treasury Bond ETF (IEI) presents a more nuanced outlook. After a bullish first day, IEI gapped up on the second day to reach a new high. However, it failed to maintain this gain, closing below its open though still slightly above the previous day’s close. The long upper wick and close below open, coupled with a substantial increase in volume, suggest some intraday selling pressure and possible exhaustion of buying momentum. Given these mixed signals, there is a roughly even chance of continued modest upside momentum versus a period of consolidation or a slight pullback. For UTHY, despite mirroring the bearish reversal pattern seen in TLT and IEF, its extremely low trading volume makes definitive conclusions challenging. While the pattern itself suggests a possible near-term bearish bias, the lack of robust liquidity means conviction in this signal is diminished, leading to a roughly even chance of this bearish sentiment carrying through or the asset simply trading sideways due to thin activity.
In contrast, the iShares 1-3 Year Treasury Bond ETF (SHY) demonstrates consistent, albeit small, upward momentum. Both days show narrow-range bullish candles, with the second day opening and closing higher than the first. The slight increase in volume on the second day does not indicate any significant change in the prevailing low-volatility, slightly bullish trend. Therefore, continued stability with a likely slight upward bias is anticipated for SHY. This divergence suggests that market participants are currently favoring shorter-duration assets for their stability, while longer-duration bonds are encountering resistance and reversal. Alternative scenarios for the longer-duration ETFs include the possibility that the recent selling is a short-term reaction, and a bounce could occur if demand re-emerges at lower price levels. However, based solely on the provided two days of data, this scenario is unlikely without further bullish confirmation.
Crypto
The technical analysis of IBIT and ETHA over the two-day observation period reveals an overall positive trajectory for both symbols. The following matrix summarizes their cumulative daily percentage changes, sorted in descending order:
| Symbol | Daily Percent Change |
|---|---|
| IBIT | 4.938% |
| ETHA | 3.475% |
We assess with high confidence that both IBIT and ETHA recorded net positive changes over the two-day period, indicating an overall upward movement from their respective starting points. However, the internal dynamics of these gains exhibit distinct characteristics requiring closer examination.
IBIT’s price action over the two days displayed a robust initial surge, recording a gain of approximately 4.89% on the first day. This significant upward movement was followed by a notably subdued trading session on the second day, with a marginal increase of approximately 0.05%. We judge IBIT’s price action likely reflects strong upward momentum establishing new levels, with the second day’s negligible change indicative of potential consolidation or low volatility around the newly achieved price point. This pattern suggests that initial buying interest was substantial, and subsequent selling pressure was minimal, leading to a high-confidence assessment of sustained strength in the very short term.
In contrast, ETHA also experienced a strong initial positive move, gaining approximately 4.14% on the first day. However, this was partially retraced on the second day, with a decline of approximately 0.66%. We estimate with moderate confidence that ETHA’s second-day decline, following an initial surge, points to a weaker immediate follow-through compared to IBIT. This pattern could indicate profit-taking, a less robust underlying buying interest, or a more sensitive market structure prone to short-term corrections. While the aggregate change remains positive, the retracement introduces uncertainty regarding the immediate sustainability of its upward momentum.
Given the presented data, we judge it highly likely that IBIT holds stronger short-term technical momentum compared to ETHA. While both symbols ended with net positive gains, ETHA’s notable retracement on the second day introduces uncertainty regarding sustained upward pressure. Conversely, IBIT’s near-flat second day after a strong initial move suggests price acceptance at the higher level. There is a roughly even chance that ETHA could experience further sideways to slightly lower price action if buying interest does not re-emerge quickly to overcome the previous day’s retracement. IBIT, however, appears poised for continued positive movement, albeit potentially at a slower pace, or continued consolidation, which would be a high confidence assessment given the data. Further analysis incorporating volume and additional price action would be necessary to confirm these short-term directional biases.
Magnificent 7 & Friends
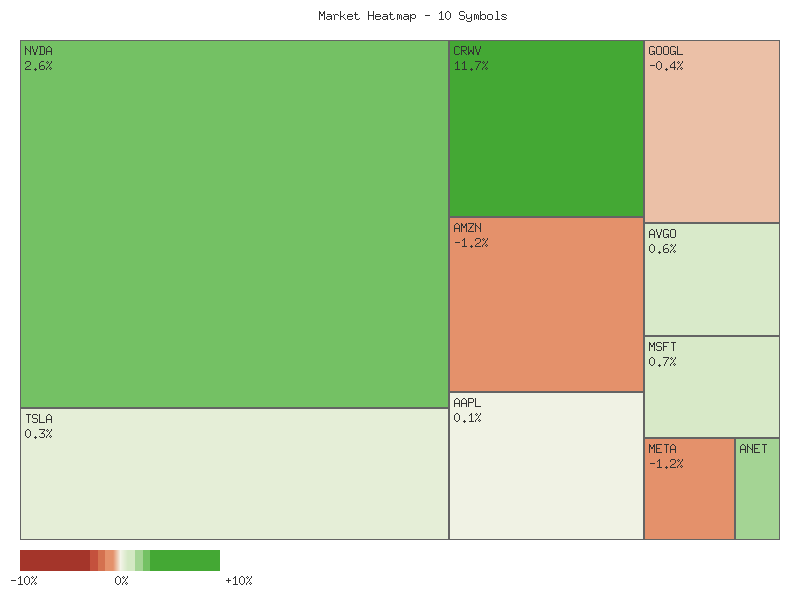
Analysis of the provided two-day daily percentage change data across ten selected symbols reveals a net positive aggregate movement, totaling approximately 18.11%. This aggregate gain suggests a probable upward bias within this specific cohort of securities over the observed period. However, the observed market breadth for this group presents a mixed technical picture, characterized by an equal distribution of five advancing symbols and five declining symbols. This balanced breadth suggests a roughly even distribution of buying and selling pressures across the cohort, indicating that the overall positive drift may be driven by substantial gains in a subset of securities rather than broad-based participation.
Examining individual performance, CRWV stands out with a remarkable two-day gain of approximately 13.51%, exhibiting robust upward momentum. NVDA and ANET also demonstrated significant strength, registering gains of approximately 4.66% and 2.24%, respectively. MSFT and TSLA further contributed to the upside, with respective increases of about 1.26% and 0.98%. The magnitude of gains in CRWV, followed by NVDA, suggests that buying pressure was highly concentrated in these particular symbols. This concentration implies a likely continuation of relative strength in the near term for these specific equities, contingent on their individual price action continuing to support such strength.
Conversely, several symbols experienced declines over the observed period. GOOGL led the underperformers with a two-day drop of approximately 1.40%, followed closely by AVGO with a decline of about 1.37%, and META with a roughly 1.26% decrease. AAPL and AMZN also registered marginal losses of approximately 0.32% and 0.08%, respectively. The persistence of negative performance in GOOGL, AVGO, and META suggests a probable underlying weakness or a lack of significant buying interest, which might lead to further consolidation or downward pressure in the absence of new catalysts, given the absence of price support over the observed interval.
The combination of a positive aggregate change and perfectly balanced breadth presents a nuanced technical outlook. While the aggregate points to an upward inclination, the equal number of advancers and decliners suggests that the internal health of this market sample is not universally bullish. An alternative scenario to sustained upward movement in the overall aggregate is that the significant gains in a few strong names are masking underlying weakness in others. This pattern could indicate sector rotation or asset-specific narratives rather than a broad bullish trend. Therefore, it is a roughly even chance that this divergence will lead to either continued concentration of strength in top performers or a potential unwinding of gains if the broader weakness in other components expands.
| Symbol | Total Daily Percent Change |
|---|---|
| CRWV | 13.508% |
| NVDA | 4.655% |
| ANET | 2.243% |
| MSFT | 1.265% |
| TSLA | 0.979% |
| AMZN | -0.083% |
| AAPL | -0.325% |
| META | -1.260% |
| AVGO | -1.369% |
| GOOGL | -1.399% |
Market Technical Outlook: Navigating Divergent Short-Term Signals
Analysis of the recent two-day trading activity across the selected equities reveals a highly divergent short-term landscape, with several names exhibiting strong bullish momentum while others display distinct bearish tendencies. This mixed sentiment suggests that, on an aggregate level, a clear market direction is unlikely to emerge from this narrow data window, but individual opportunities and risks are notable. Volume analysis, where supportive, adds conviction to observed price patterns.
Within the sample, NVDA, CRWV, and MSFT present the most compelling bullish technical setups. NVDA completed two consecutive bullish candles, with the second day showing significant price acceleration, a higher high, and a higher close, all on substantially increased volume. This combination of price action and volume makes continued upward momentum almost certain in the immediate term. Similarly, CRWV experienced an explosive gap-up, forming a very wide-ranging bullish candle on extraordinarily high volume, suggesting a powerful surge in buying interest. Further follow-through buying is almost certain for CRWV. MSFT also demonstrated two consecutive bullish candles, establishing higher highs and higher closes, accompanied by increasing volume. This pattern makes continued upward movement highly likely for MSFT.
Conversely, AMZN, META, GOOGL, and AVGO show discernible bearish signals. AMZN formed a bearish engulfing pattern on its second day, with a lower high, a lower low, and a close significantly below the prior day’s close, all supported by increased volume. This robust bearish candle indicates that further downside is highly likely. META also exhibited consecutive bearish candles, with the second day showing accelerated downside and significantly increased volume, making continued downward pressure highly likely. GOOGL printed two bearish candles, maintaining downward pressure with a lower high and lower low, accompanied by a slight volume increase, which suggests continued bearishness is likely. For AVGO, a strong bearish candle on Day 1 was followed by an inside bar with a slight bullish close on decreasing volume. While Day 2 closed positive, the preceding strong bearish move and contained range imply a roughly even chance of either continued consolidation or a resumption of the prior bearish trend.
Other symbols like TSLA, AAPL, and ANET display more ambiguous or consolidating patterns. TSLA traded sideways, characterized by a small bullish close on Day 2 following an indecisive Day 1, with overall decreasing volume. This mixed picture, coupled with reduced volume, suggests a roughly even chance of either mild upward continuation or a reversal within the tight range. AAPL also showed very tight, overlapping candles with minimal directional conviction, closing slightly higher on decreasing volume. For AAPL, continued sideways action or a roughly even chance of mild directional bias is probable. ANET presented a bullish close on Day 2, forming an inside bar within Day 1’s range, following a Day 1 candle with an upper wick indicating resistance. The decreasing volume on Day 2 introduces uncertainty; while a slight upward drift is likely, continued consolidation cannot be ruled out, making the immediate directional follow-through a roughly even chance beyond minor upward pressure.
S&P 500 Sector Breadth
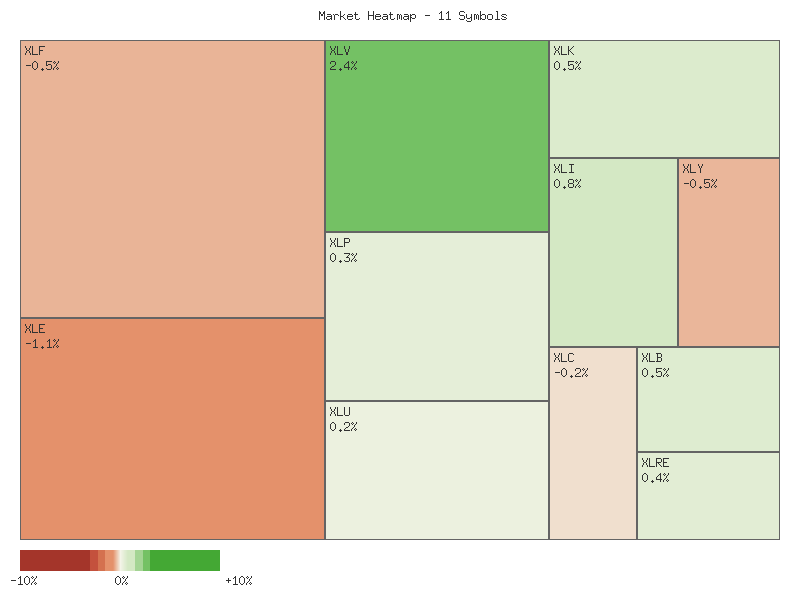
The aggregate analysis of the provided daily percentage change data across the eleven S&P 500 sectors reveals an overall upward bias over the two-day period. Summing the individual sector performance indicates a net positive movement of approximately 4.581% across the combined universe of symbols. Market breadth indicators suggest a strong positive bias, with nine of the eleven analyzed sectors posting cumulative gains, while only two sectors concluded the period with declines. This breadth is a statistically significant observation, suggesting broad participation in the upward trend.
The following matrix details the cumulative daily percentage changes for each symbol, sorted in descending order:
| Symbol | Total Daily Percent Change (%) |
|---|---|
| XLV | 2.701 |
| XLK | 1.080 |
| XLI | 1.079 |
| XLB | 0.876 |
| XLRE | 0.596 |
| XLP | 0.525 |
| XLU | 0.460 |
| XLC | 0.170 |
| XLF | 0.021 |
| XLY | -0.027 |
| XLE | -2.900 |
Examining sector performance within the context of offensive versus defensive classifications provides insight into potential market rotation and underlying sentiment. All four designated defensive sectors—XLV (Health Care), XLRE (Real Estate), XLP (Consumer Staples), and XLU (Utilities)—exhibited positive cumulative performance. Notably, XLV was the top-performing sector overall, registering a substantial 2.701% gain. This unanimous strength in defensive plays indicates a probable underpinning of investor caution or a flight to quality for a portion of market participants.
Conversely, the offensive sectors presented a more mixed picture. Four out of the six classified offensive sectors—XLK (Technology), XLI (Industrials), XLB (Materials), and XLF (Financials)—also posted gains. XLK and XLI showed particularly robust advances, ranking as the second and third best performers, respectively. However, two significant offensive sectors, XLY (Consumer Discretionary) and XLE (Energy), experienced declines, with XLE registering the steepest loss at -2.900%. XLC (Communication Services), which was not explicitly categorized as offensive or defensive within the provided framework, concluded with a modest gain.
Based on these patterns, the overall market sentiment appears complex, with mixed signals. The consistent and universal advance across all defensive sectors, particularly the leading performance of XLV, strongly suggests a degree of risk aversion or a defensive posture among some investors. Concurrently, the robust performance of other offensive sectors like XLK and XLI indicates ongoing appetite for growth and cyclical exposure. It is roughly even chance that this divergence reflects either a selective rotation within offensive sectors, with funds moving out of underperforming areas (e.g., Energy, Consumer Discretionary) into perceived stronger growth sectors (e.g., Technology, Industrials), or a simultaneous demand for both defensive stability and targeted growth opportunities. The observed declines in XLY and XLE are likely idiosyncratic to those sectors rather than indicative of a broad-based shift away from all offensive assets.
Technical Market Commentary: Two-Day Sector Performance Analysis (September 29-30, 2025)
Our analysis of the provided two-day candlestick data reveals a bifurcated market sentiment across the SPDR Select Sector ETFs, with distinct bullish and bearish patterns emerging. Several sectors demonstrated robust upward momentum, while an equal number exhibited clear downward pressure. Notably, Health Care (XLV) showed exceptional strength, while Consumer Discretionary (XLY) and Financials (XLF) experienced significant declines. Volume trends generally supported the directional moves, indicating conviction behind the price action observed over this brief period.
Examining the bullish performers, Health Care (XLV) exhibited an almost certain continuation of its upward trajectory. Day 2’s candle represents an extraordinarily strong bullish expansion, characterized by a substantial price increase from open to close, closing near its high, and an exceptionally large surge in trading volume. This pattern, following a strong close on Day 1, suggests a breakout or strong acceleration in buying interest. Similarly, Industrials (XLI) displayed a strong bullish engulfing pattern on Day 2 with increased volume, closing near its high, making further upward movement likely. Technology (XLK) and Consumer Staples (XLP) also demonstrated clear bullish continuation patterns on Day 2, with higher closes and increased volume, making upward price action likely. Real Estate (XLRE) and Materials (XLB) also closed Day 2 with bullish candles, with XLB forming a bullish engulfing-like pattern. Both are likely to see continued upward momentum, though XLRE’s volume increase was modest compared to other bullish sectors.
Conversely, a number of sectors displayed strong bearish technical signals, indicating further downside is likely. Consumer Discretionary (XLY) experienced a notable decline on Day 2, forming a large bearish candle with a significantly lower low and lower close, accompanied by increased volume, suggesting a continuation of selling pressure. Financials (XLF) printed a bearish engulfing pattern on Day 2 on significantly increased volume, after a relatively indecisive Day 1. This signals a likely shift in sentiment to the downside. Energy (XLE) showed a clear bearish continuation, with Day 2’s candle closing lower than Day 1’s low and near its own low, on increased volume, making further declines likely. Communication Services (XLC) also demonstrated a bearish continuation, with Day 2 closing lower with increased volume, implying continued downward pressure.
Utilities (XLU) presents a more nuanced picture. While Day 2 closed marginally higher than Day 1, the candle itself was smaller in body with relatively long shadows, appearing as a spinning top at a new high. This suggests some indecision or potential resistance following Day 1’s strong close, despite an increase in volume. Therefore, there is a roughly even chance of continued upward momentum or a period of consolidation in the immediate term for XLU. For the strongly trending sectors like XLV and XLY, an alternative scenario would involve a swift reversal on the next trading day, however, based purely on the provided two-day patterns and associated volume, such an outcome appears unlikely.
Equity Breadth
The percentage of S&P 500 members trading above their 50-day moving average (SPXA50R) concluded the seven-day observation period at 59.28%, a net increase from its starting point of 54.69%. Similarly, the percentage of S&P 500 members above their 200-day moving average (SPXA200R) showed a net increase, rising from 59.68% to 62.28% over the same period. Both breadth indicators, after experiencing a notable intra-period decline on September 25th, demonstrated a robust recovery, suggesting underlying strength in market participation. The general upward trajectory in both metrics signifies an improvement in the overall health of the S&P 500 constituents.
Analysis of SPXA50R reveals a fluctuating but ultimately improving intermediate-term breadth picture. The indicator initially advanced to 58.28% before retreating to 48.50% on September 25th, falling below the critical 50% threshold. This temporary dip suggested a contraction in intermediate-term momentum for a segment of the S&P 500. However, the subsequent rebound to 59.28% by September 30th is a particularly constructive development. This swift recovery back above 50% indicates that the underlying intermediate-term bullish sentiment among a majority of stocks remains resilient, and the dip was likely a transient event rather than the start of a broader deterioration in intermediate-term market health.
The SPXA200R data presents a more consistently strong narrative regarding long-term market breadth. Despite a pull-back to 58.08% on September 25th, mirroring the SPXA50R dip, the indicator maintained levels well above the 50% mark throughout the entire period. It ultimately finished near its peak for the observation at 62.28%. The consistent presence of over 60% of S&P 500 components trading above their 200-day moving average is a robust bullish confirmation. This suggests that a substantial majority of the market’s constituents are participating in a long-term uptrend, implying the market’s underlying structure is healthy and broadly supported, which is typically a positive sign for sustainability.
The S&P 500’s 20-day Exponential Moving Average (EMA_20_DAY) exhibited a clear and uninterrupted upward trend over the seven days, progressing from 6551.61 to 6596.61. This sustained ascent confirms a strong short-term upward momentum for the index itself. Given the observed improvement and resilience in both intermediate-term (SPXA50R) and long-term (SPXA200R) market breadth, it is likely that the upward trend in the EMA_20_DAY will persist in the near-term. The broad participation signaled by the breadth indicators provides a solid foundation, suggesting the index’s advance is not narrowly based. Conversely, a significant deterioration in these breadth metrics, not presently observed, would pose a risk to the sustainability of the EMA’s ascent. However, based on the provided data, a continuation of the upward EMA trend is more likely than a reversal.
SPX Daily
The price action over the last seven trading days indicates a short-term corrective phase followed by a robust recovery. From the high of 6693.75 recorded on 2025-09-22, the SPX experienced a decline, finding a provisional floor at 6604.72 on 2025-09-25. Subsequently, the index has demonstrated significant upward momentum, closing at 6688.46 on 2025-09-30, nearing the prior peak. This recent price action, particularly the solid bullish candle on 2025-09-30, suggests buyers have reasserted control after a period of profit-taking. The 50-day Exponential Moving Average (EMA) and 200-day EMA are both trending upwards, with the 50-day EMA comfortably above the 200-day EMA, confirming a persistent bullish trend across multiple timeframes. The 14-day Relative Strength Index (RSI) declined from an overbought reading of 74.75 on 2025-09-22 to a more neutral 58.74 on 2025-09-25, aligning with the price pullback. Its subsequent rise to 66.98 indicates a re-acceleration of upward momentum, though not yet back into deeply overbought territory.
Immediate overhead resistance is identified around the 6691-6694 range, encompassing the recent high of 6691.25 on 2025-09-30 and the peak of 6693.75 from 2025-09-22. A sustained breakout above this zone would constitute a significant technical event, likely signaling a continuation of the prevailing uptrend. Conversely, immediate support levels are visible at approximately 6640-6660, derived from recent daily lows. A more robust support zone exists near 6600-6605, corresponding to the closing price on 2025-09-25 and prior significant pivot points. Dynamic support is provided by the ascending 50-day EMA, currently at 6470.51, and the 200-day EMA, at 6075.55, which represent progressively stronger trend-following support structures.
The bullish scenario projects a high probability of the SPX continuing its ascent. A decisive breach above the 6691-6694 resistance zone is likely to attract further buying interest, with the market potentially targeting new all-time highs. This outcome would be reinforced if the RSI were to move back into overbought conditions (above 70), indicating strong internal momentum. The current robust alignment of the moving averages, with price well above both, provides a strong foundation for continued upward movement. The recent pullback appears to have effectively reset short-term overextensions, setting the stage for subsequent rallies.
Conversely, the bearish scenario suggests that the 6691-6694 resistance zone might prove formidable. A failure to clear this level, potentially evidenced by a reversal candlestick pattern, would make a double top formation a roughly even chance. Should the SPX subsequently break below the 6600-6605 support zone, it would be likely to trigger a deeper retracement. A more significant bearish development would involve the price falling below the 50-day EMA at 6470.51, which would imply a weakening of the intermediate-term uptrend and an increased probability of testing further support levels. Such a breakdown might coincide with the RSI declining below the 50-level, indicating a shift towards bearish momentum.
A neutral outlook, characterized by range-bound trading, is a roughly even chance in the near term, particularly if the resistance at 6691-6694 holds and support around 6600-6605 remains intact. This consolidation phase might see the SPX oscillate between these levels as market participants assess the sustainability of the recent rally. Sentiment drivers, as interpreted from this technical data, indicate a generally robust bullish underlying bias. The willingness of buyers to absorb selling pressure during the brief pullback and the subsequent rapid recovery suggest that positive market conviction is prevailing. However, the temporary dip from overbought RSI levels suggests that caution and profit-taking are probable when the index becomes excessively extended. Any sustained breach of the 6693.75 level would likely signal the re-establishment of strong bullish sentiment.
Technical Analysis of SPX: Momentum Deceleration Within a Sustained Uptrend
The S&P 500 (SPX) technical data over the past 90 days depicts a robust and persistent bullish trend, characterized by a series of higher highs and higher lows. From late May, the index has advanced significantly, climbing from approximately 5840 to its recent high near 6693 by late September. This upward trajectory was punctuated by several sharp rallies and relatively short-lived, shallow pullbacks or consolidations. Notably, significant price corrections, such as the one observed between late July and early August (from ~6390 to ~6238), were quickly absorbed, leading to resumed upward movement and new all-time highs. The latest price data shows the SPX closing near 6688, indicating proximity to its recent peak and a resilient bullish structure.
The 14-day Relative Strength Index (RSI) has consistently reflected the underlying strength of this trend. Throughout the 90-day period, the RSI frequently pushed into overbought territory (above 70), particularly in late June, early July, and then again from late July into mid-August, and most recently in mid-to-late September. These extended periods above 70 are characteristic of strong uptrends where momentum favors buyers. A notable bearish divergence occurred in mid-August when the price made a higher high (August 14th around 6468) while the RSI made a lower high (68.08 versus 76.29 on July 28th), which was subsequently followed by a price pullback. Currently, the RSI has retreated from its September 22nd peak of 74.75 to 66.98 by September 30th. This movement suggests a cooling of immediate buying intensity but remains above the neutral 50 level, indicating continued underlying strength.
The Percentage Price Oscillator (PPO) confirms the sustained bullish momentum throughout the period. The PPO line has remained consistently above the zero line for the entire 90 days, signifying that the shorter-term 13-day Exponential Moving Average (EMA) has been continuously above the longer-term 21-day EMA. This uninterrupted positive PPO reinforces the view of a dominant bullish bias. Peaks in PPO, such as in early July (0.939) and mid-August (0.543), generally coincided with strong price rallies, while declines indicated temporary deceleration of momentum. The most recent PPO reading shows a decline from a peak of 0.635 on September 22nd to 0.530 on September 30th. This recent downturn in the PPO further indicates a loss of short-term bullish momentum, mirroring the RSI’s retreat from overbought conditions.
Synthesizing these indicators, it is highly likely that the broad bullish trend in the SPX will persist over the medium term, given the consistent higher highs and the PPO remaining firmly in positive territory. However, in the immediate term, a period of consolidation or a slight pullback is likely. Both the RSI’s retreat from overbought levels and the PPO’s decline from its recent peak signal a temporary exhaustion of buying pressure. While a continuation of the upward trend after a brief pause or shallow correction is highly likely, an alternative scenario where a deeper, more pronounced correction occurs is a roughly even chance, especially if momentum indicators continue to soften or if price fails to quickly reclaim its recent high. A significant and sustained downtrend beginning at this juncture is unlikely, as the underlying technical structure remains robustly bullish.