Daily Market Technical Analysis
Market Overview
Market technicals exhibit a divergent yet broadly bullish picture. Large-cap equities and select commodities show strong uptrends, with SPX and QQQ facing a likely significant consolidation due to PPO divergences. In contrast, mid-caps and small-caps are highly likely to experience continued downward pressure. Precious metals and natural gas are likely to see sustained upside, while bond markets signal likely further short-term strength. The VIX’s rebound and overbought RSIs in some leading assets imply a roughly even chance of broader market consolidation. Investors should monitor intermarket rotations and underlying momentum shifts for evolving opportunities and risks.
Market Indices
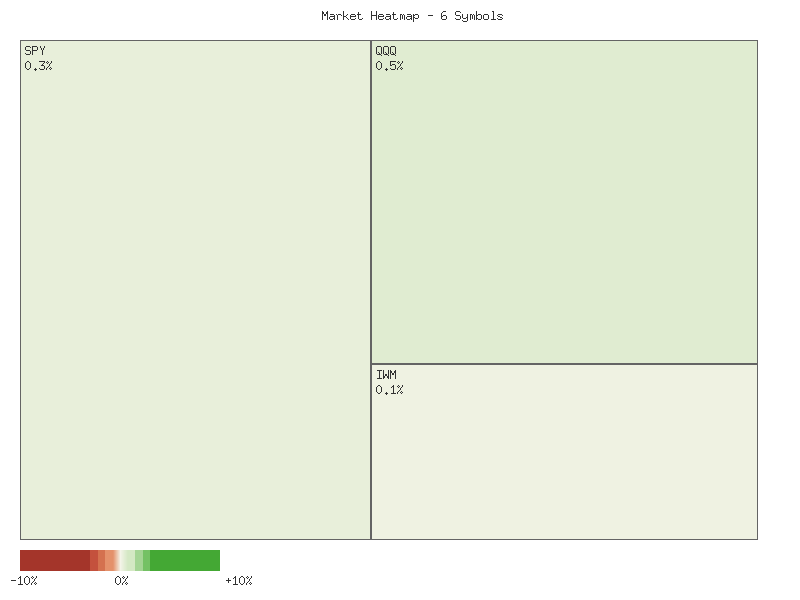
Analysis of the latest trading session (September 29, 2025) for key equity indices reveals a predominantly positive, yet somewhat divergent, market performance. The following matrix summarizes the daily percent changes for the observed symbols, sorted in descending order:
| Symbol | Daily Percent Change (2025-09-29) |
|---|---|
| QQQ | 0.463% |
| SPX | 0.264% |
| OEF | 0.142% |
| IWM | 0.116% |
| IJR | 0.093% |
| MDY | -0.225% |
The aggregate daily percent change for these six indices on September 29 is approximately +0.853%, indicating an overall higher market day for the observed instruments. Market breadth for this session was strongly positive, with five out of six symbols advancing and only one declining. This breadth suggests underlying buying interest across a majority of the market segments represented by these indices.
Further examination of individual index performance reveals nuanced dynamics. The technology-heavy QQQ led the gains, indicating potential strength in growth-oriented sectors. Broad-market large-cap indices like SPX and OEF also posted solid advances, reinforcing a positive sentiment for larger capitalization stocks. However, mid-cap index MDY was the sole decliner, registering a modest loss. Small-cap indices IWM and IJR posted positive, but relatively subdued, gains compared to their large-cap counterparts. This divergence, with large-cap growth leading and mid-caps lagging, suggests a possible preference for higher-quality or larger-tier equities, which could reflect cautious optimism rather than broad-based speculative buying.
The Volatility Index (VIX) displayed notable movements in the recent trading period. Over the seven-day candlestick data, VIX exhibited increased volatility during the week, with an intra-week high of 17.74 on September 25, followed by a significant decline. The VIX closed at 15.29 on September 26, representing an 8.66% single-day drop, likely correlating with the generally positive equity performance observed on that day across the indices (as all observed indices showed positive daily changes on September 26). However, on September 29, VIX subsequently rebounded by 5.43% to close at 16.12, even as the majority of equity indices advanced.
This VIX rebound on September 29, despite predominantly positive equity market returns, presents a potential area of concern. Typically, VIX moves inversely to equity markets; therefore, a VIX increase alongside advancing equities could be indicative of increased hedging activity or growing uncertainty among market participants. This divergence suggests that while the market’s price action appears favorable, there may be underlying apprehension. Therefore, the probability of sustained market strength without increased volatility is roughly even, given the mixed signal from the VIX. Should the VIX continue to firm, it could likely challenge further equity gains; conversely, a renewed decline in VIX would probably support continued upward momentum in equities.
As a seasoned CMT with over 15 years of experience, a rigorous technical examination of the provided two-day candlestick data reveals a nuanced and divergent market picture across various capitalization segments. The broad market, as represented by the S&P 500 (SPY) and S&P 100 (OEF), exhibited robust bullish momentum over the two-day period. SPY recorded two consecutive bullish candles with increasing volume, demonstrating strong upward price action, including a gap-up on the second day. Similarly, OEF showed consistent bullish closes with increasing volume. Based on this consistent price and volume action, a continuation of this positive momentum in the immediate term is likely for these large-cap indices, though minor upper wicks on the second day’s candles suggest potential, albeit limited, overhead resistance.
However, the picture begins to shift when analyzing the QQQ (Nasdaq 100) and IWM (Russell 2000). Both ETFs registered higher closes over the two days but displayed noticeable signs of buying exhaustion. QQQ, despite a gap-up on the second day, formed a prominent upper wick and saw a decrease in trading volume, indicating that buyers struggled to maintain control at higher price levels. IWM mirrored this pattern, also gapping up but failing to hold its gains effectively, closing with a significant upper wick and on reduced volume. These patterns suggest that while momentum was positive, buying pressure at the highs faced considerable resistance. Consequently, a short-term consolidation or minor pullback is a roughly even chance against a continued strong upward trajectory for QQQ and IWM.
The most concerning signals emanate from the mid and small-cap segments, specifically MDY (S&P MidCap 400) and IJR (S&P SmallCap 600). MDY presented a classic bearish reversal pattern, with the second day’s candle gapping up but then reversing sharply to close below the previous day’s close, effectively nullifying the prior day’s bullish advance. This is a strong indication of a shift in sentiment. For IJR, the second day opened with a gap-up that failed almost immediately, with the open becoming the high for the session. The candle closed as a doji-like pattern, signifying strong indecision, but critically, on increased volume. The inability to sustain the gap-up amid higher volume points to significant selling pressure. Thus, a bearish continuation or significant retracement in MDY is highly likely, and a short-term pullback or further consolidation in IJR is likely.
In summary, the market demonstrates a clear divergence in short-term technical strength. While large-cap indices (SPY, OEF) appear poised for further upside momentum, the signs of exhaustion in QQQ and IWM, combined with outright bearish reversal patterns in MDY and indecision in IJR, suggest a weakening undercurrent. This divergence implies that the broad market’s momentum, despite the strength in its largest components, could face headwinds from the struggling mid and small-cap sectors. While a continued ascent in large-cap equities remains likely, the potential for weakness in these smaller segments to influence and potentially temper the broader market’s advance, leading to a wider market pause or pullback, is a roughly even chance. Traders should monitor these intermarket relationships closely.
As a CMT with extensive experience, I will provide a rigorous technical analysis of the SPX based solely on the provided 90-day candlestick data, 14-day Relative Strength Index (RSI), and 13/21-day Percentage Price Oscillator (PPO).
The S&P 500 (SPX) has exhibited a robust and persistent uptrend over the past 90 trading days, marked by a clear sequence of higher highs and higher lows. From late May, when the index traded around 5844, it has ascended consistently to reach levels near 6661 by late September. This long-term price action indicates a dominant bullish sentiment within the observed period. However, analyzing the internal dynamics through momentum oscillators like RSI and PPO reveals nuanced shifts in buying pressure and potential exhaustion points that warrant careful consideration.
During periods of strong bullish impetus, such as the late June to early July rally, the 14-day RSI consistently surged into overbought territory, exceeding the 70 threshold and peaking at approximately 75.57 on July 3rd. Concurrently, the 13/21-day PPO registered significant positive momentum, reaching a peak around 0.94. These readings typically signal an extended buying spree, often preceding a consolidation or minor pullback as momentum normalizes. Indeed, subsequent to these extended overbought conditions, the SPX experienced minor corrections, allowing the RSI to cool down from elevated levels. A more noticeable, albeit brief, price correction occurred in early August following another RSI peak above 76 in late July. During this early August decline, the RSI receded significantly to 47.80, and the PPO dropped from 0.76 to 0.38, indicating a temporary but substantial loss of upward momentum. These periods of price weakness appear to have been absorbed by the underlying demand, allowing the uptrend to resume.
More recently, the SPX pushed to fresh all-time highs in mid-September, with price reaching 6698.88 on September 22nd. This price action again propelled the 14-day RSI into overbought territory, registering 74.75. However, a notable technical observation emerges from the PPO: while the SPX posted a higher high on September 22nd, the PPO peaked at 0.635, which is substantially lower than its previous peak of 0.7647 observed on July 28th, even though the price level on July 28th was significantly lower (6401.07). This discernible negative divergence between price and the PPO suggests that the underlying bullish momentum is likely weakening, even as the index makes nominal new highs. Following this, the SPX experienced a mild pullback, with RSI receding from overbought levels to 64.47 and PPO declining to 0.52 by September 29th.
Given the current technical landscape, there is a roughly even chance of the SPX maintaining its immediate upward bias in the short term, supported by the overarching bullish trend and RSI having retreated from extreme overbought conditions. However, the identified negative divergence in the PPO increases the likelihood of a more significant price consolidation or corrective phase emerging in the near future. Should the SPX fail to achieve significantly higher price levels or if the PPO continues to trend lower as price attempts new highs, the probability of a deeper correction would increase to likely. Conversely, a sustained breakout to new all-time highs accompanied by a renewed, strong upward thrust in both RSI and PPO would likely negate the bearish implications of the current PPO divergence, signaling a potential continuation of robust bullish momentum. A breach of recent support levels, particularly around the 6400 area observed during early September’s consolidation, would confirm a short-term bearish shift and would suggest a higher probability of further downside.
The QQQ has demonstrated a robust upward trajectory over the 90-day period, characterized by a series of higher highs and higher lows, starting from the low 510s in late May and culminating near the 600 level by late September. This sustained ascent signals a prevailing bullish trend. Notable, albeit brief, pullbacks occurred in early and mid-August, showing intermittent profit-taking or minor consolidation phases. The most recent leg of this rally initiated in early September, pushing the price to a peak around 602.87 on September 22, before a slight retreat to 598.73 at the period’s close. This consistent bullish price action implies that upside momentum has generally controlled market direction.
The 14-day Relative Strength Index (RSI) broadly corroborates the bullish market behavior, consistently remaining above the 50 threshold for most of the period, and frequently ascending into the 60s, indicating strong buying interest. Several instances saw the RSI push into overbought territory above 70, specifically in late June (72.4), mid-July (72.9), late July (73.1), and most recently peaking at 75.3 on September 22. These periods of excessive momentum were typically followed by short price consolidations or minor pullbacks, consistent with a temporary exhaustion of buying pressure rather than a trend reversal. Significantly, the RSI did not enter oversold territory (below 30) at any point, which strongly reinforces the underlying strength of the uptrend. The most recent RSI reading of 66.08 suggests that while bullish momentum is substantial, it is currently receding from its peak overbought levels, making a short-term consolidation or minor correction a roughly even chance.
Examination of the 13,21-day Percentage Price Oscillator (PPO) provides a more nuanced view of the trend’s underlying strength. The PPO remained positive throughout the entire 90-day observation window, confirming the overall bullish bias. However, the indicator’s magnitude suggests a deceleration in the rate of price appreciation over the medium term. The PPO reached a peak of 1.81 in late May and subsequently exhibited a declining trend, reaching a low of 0.17 by early September. This decline occurred even as QQQ price continued to record higher highs, forming a noticeable bearish divergence. Such a pattern, where price advances but momentum wanes, increases the likelihood that the underlying bullish conviction is weakening, despite the superficial price strength. More recently, the PPO has shown signs of a rebound from its early September low, climbing to 0.70 by the end of the period, which indicates renewed, albeit moderate, short-term bullish momentum.
Synthesizing these technical indicators, the immediate outlook for QQQ appears predominantly bullish but warrants caution. The clear uptrend in price action and generally strong RSI readings suggest that further upside is likely in the near term, possibly following a brief period of consolidation. However, the sustained bearish divergence in the PPO from May to early September presents a significant caveat. This divergence, which indicates a diminishing rate of price increase despite nominal gains, increases the likelihood of a more substantial price correction or trend reversal emerging in the medium term, particularly if the market fails to demonstrate a decisive resurgence in momentum. An alternative scenario would involve the recent PPO uptick marking the end of the momentum slowdown, leading to renewed acceleration and negating the bearish divergence; however, a convincing move higher in both price and PPO above prior peaks would be required to raise the probability of this more bullish outcome. Conversely, a failure to maintain the current PPO uptrend, coupled with a breach of recent price support levels, would considerably increase the likelihood of the bearish divergence manifesting in a notable price decline.
IWM Technical Outlook: Momentum Shifts Following Extended Rally
IWM has exhibited a sustained upward trend throughout the 90-day period under review, marked by a series of higher highs and higher lows. The price trajectory moved from approximately in late May to a recent peak near .57 on September 19th. This robust price appreciation was supported by generally rising volume during significant upward legs, such as the rallies in early June and mid-August, which adds credibility to the established bullish trend. However, the most recent price action, particularly over the last two weeks, indicates a discernible shift in short-term market dynamics, with IWM forming lower highs and lower lows since the September 19th peak, closing at .62 on September 29th. This suggests the onset of a short-term consolidation or corrective phase.
Analysis of the 14-day Relative Strength Index (RSI) corroborates this shift in momentum. The RSI ascended into overbought territory (>70) on at least two occasions during the observed period, notably reaching 71.57 on July 3rd and peaking at 71.23 on September 18th. Following the September 18th high, while price attempted to hold near its peak on September 19th and September 22nd, the RSI notably printed lower highs (68.09 on September 22nd and 66.59 on September 23rd). This bearish divergence between price (which made a higher high on Sept 19th compared to Sept 18th, yet RSI was lower on subsequent days while price was still near its peak) and RSI suggests weakening underlying bullish conviction at those higher price levels. Currently, the RSI has fallen to 59.28, indicating that buying pressure has substantially abated from its previous elevated state and is approaching the neutral zone. A continued move below 50 would further underscore a bearish short-term outlook.
The 13-21 day Percentage Price Oscillator (PPO) provides additional evidence of decelerating bullish momentum. The PPO remained mostly positive for the latter half of the 90-day period, crossing above its zero line in mid-June and then again in mid-August, signaling a bullish trend. However, after achieving a significant peak around 1.00 in late August and early September, the PPO has consistently declined, now resting at 0.73 as of September 29th. This sustained downtick in the PPO indicates a clear weakening of the trend’s strength. There is a high probability that the PPO will continue its descent, and a cross below its signal line (implied by the current rate of decline) or subsequently below the zero line, would be a robust confirmation of expanding selling pressure and a potential shift to a bearish short-term trend.
Considering the confluence of a recent bearish price structure (lower highs and lower lows), the RSI’s descent from overbought territory coupled with a bearish divergence, and the PPO’s consistent decline, it is highly likely that IWM will experience continued downward pressure in the immediate future. The potential for a deeper retracement to seek support at prior consolidation levels or longer-term moving averages is elevated. An alternative, though less likely, scenario would involve IWM finding immediate support at current levels, possibly around the area, leading to a period of sideways consolidation before any renewed attempt at higher prices. However, such a bullish reversal would necessitate a significant resurgence in buying volume and a subsequent turn in both the RSI and PPO indicators, neither of which is presently evident in the provided data.
Tech Sector Analysis
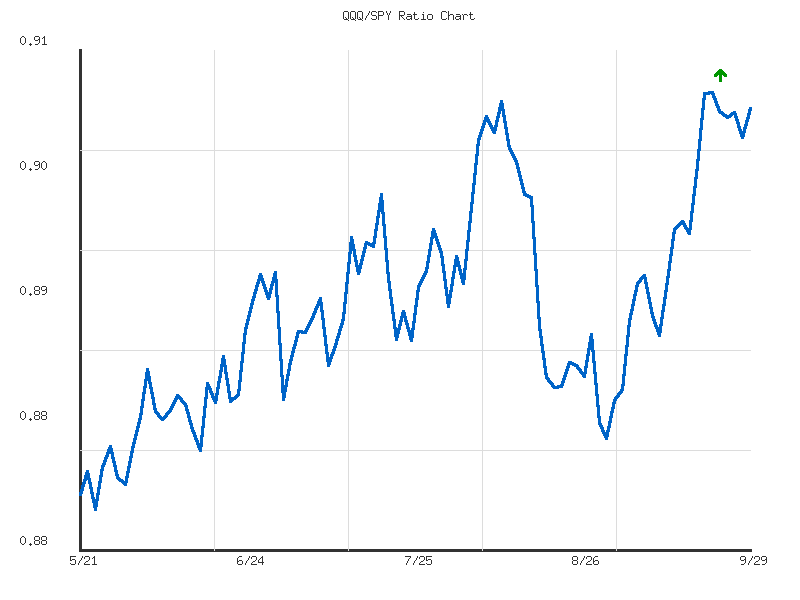
Analysis of the RATIO:QQQ/SPY indicates a nuanced but generally positive shift in the relative performance of the NASDAQ-100 (QQQ) against the S&P 500 (SPY). Over the 14-day observation period, the ratio exhibits an upward trend, albeit with weak strength, as evidenced by a 1.32% increase. The current ratio stands at 0.9021, positioned significantly above its 14-day average of 0.8979 and at 93.29% of its relative range. The prevailing upward trajectory suggests QQQ has been outperforming SPY in the short term. The very low volatility (0.000022) within this period indicates that this shift has been relatively stable, lacking sharp, erratic movements.
Expanding the perspective to the 30-day timeframe, the RATIO:QQQ/SPY presents a sideways trend, also characterized by weak strength. Despite this “sideways” classification, the ratio has experienced a 0.56% increase over the period. Critically, the current ratio of 0.9021 is positioned at 95.27% of its 30-day range, meaning it is very near the highest point observed over the past month (0.9030). While the average ratio for the 30-day period is 0.8927, the current value’s proximity to the high, coupled with the upward momentum of the last 14 days, indicates that recent QQQ outperformance has likely driven the ratio higher within its broader sideways consolidation. The slightly higher volatility (0.000039) for the 30-day period compared to 14-days suggests marginal, but still low, price fluctuations across the longer horizon.
Considering both timeframes, the current ratio of 0.9021 is notably close to the highest recorded ratios in both the 14-day (0.9030) and 30-day (0.9030) windows. This technical confluence suggests a potential resistance level has been approached. Given the current weak upward trend on the 14-day view and the high relative position on both, there is a probable chance of continued QQQ outperformance in the very near term as the ratio attempts to push past these recent highs. However, the consistent “weak” strength in both trend indicators implies that any breakout would likely require a fresh catalyst to gain significant momentum, and a strong, sustained acceleration of outperformance appears less probable without such developments.
Alternative scenarios must be considered due to the weak trend strength and the ratio testing its recent high. It is roughly an even chance that the ratio could consolidate at or slightly below the current level, reverting towards the average of the 14-day or 30-day ranges if the current weak upward pressure dissipates. A sustained rejection from the 0.9030 level is possible, which could lead to a minor pullback and a resumption of broader sideways movement, particularly if underlying relative demand for technology stocks wanes. However, a significant reversal leading to substantial QQQ underperformance (i.e., the ratio falling significantly below its 30-day average of 0.8927) appears unlikely without a notable shift in market dynamics or a breach of established support levels, which are not explicitly evident in the current data.
CMT Technical Analysis: QQQ/SPY Relative Performance
The QQQ/SPY ratio, representing the relative strength of the Nasdaq 100 (QQQ) against the S&P 500 (SPY), has displayed a discernable upward trend over the provided 90-day period. This indicates a general outperformance of growth-oriented and technology stocks, predominantly found within the Nasdaq 100, compared to the broader market. The total change in the ratio over this timeframe is approximately 2.49%, moving from a low of 0.8793 to a current value of 0.9021. While the direction is definitively positive, the overall trend strength is characterized as “weak.” This suggests a persistent, gradual ascent rather than an aggressive, high-momentum surge. The remarkably low volatility figure (0.000037) supports this interpretation, indicating that the ratio’s movements have been exceptionally stable and consistent throughout the observed period, without sharp deviations.
Analyzing the more recent data, particularly through September, reveals that the QQQ/SPY ratio has entered a phase of consolidation near its 90-day high. Following a steady climb, the ratio reached its peak at 0.90306 on September 22nd and has since traded within a narrow range between roughly 0.900 and 0.903. This horizontal price action, observed as the ratio tests and retests the upper boundary of its recent range, suggests that immediate upward momentum is encountering resistance. The current ratio of 0.9021 is very close to this short-term ceiling, implying that the persistent, albeit “weak,” upward pressure has brought the ratio to a pivotal juncture where a clear directional resolution is imminent.
From a support perspective, early data points in late May and early June, where the ratio fluctuated around 0.880-0.885 but consistently maintained levels above this zone, suggest the establishment of a foundational support area. Should the current resistance near 0.903 prove resilient, a short-term pullback toward the 0.895-0.900 region is a plausible alternative scenario, representing a natural consolidation within the broader uptrend. A more significant retracement to re-test the 0.880 initial support appears highly unlikely within the near term, as the ratio has maintained a consistent upward trajectory since those early points and has not shown any technical signs of such a pronounced reversal.
Considering the established upward trend and the current proximity to the 90-day high, a continuation of QQQ’s relative outperformance, resulting in a modest breach above the 0.903 resistance, is likely in the immediate future. The “weak” trend strength implies that any such breakout would probably be gradual rather than explosive, characteristic of a slow grind higher. However, there is a roughly even chance that the ratio could experience further horizontal consolidation or a minor corrective pullback towards the 0.895-0.900 zone before attempting a more decisive move higher. A substantial reversal indicating a material shift to SPY outperforming QQQ to the degree of revisiting the 0.880 levels in the very near future remains unlikely, given the consistent upward bias embedded within the past 90 days of technical data.
IWM vs. SPY
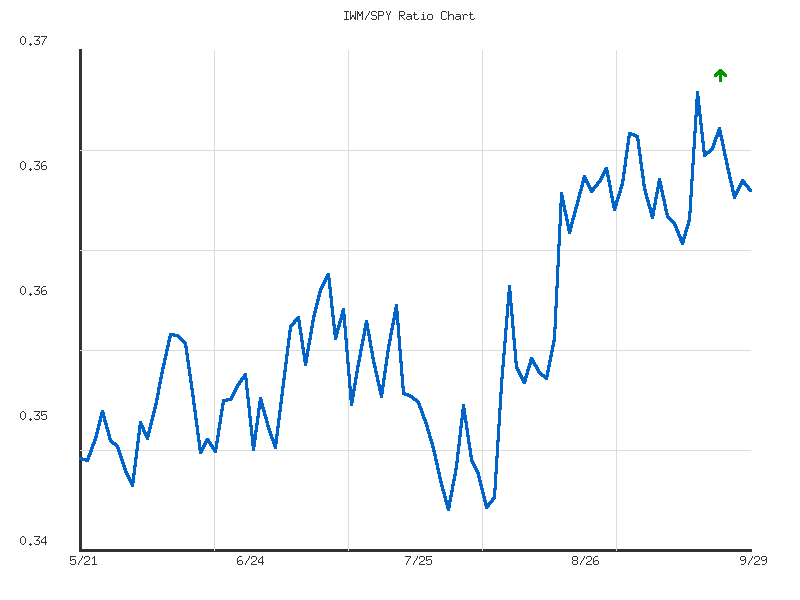
The IWM/SPY ratio, a measure of Russell 2000 (small-cap) relative performance against the S&P 500 (large-cap), presents a mixed technical picture across different timeframes. Over the preceding 30 days, the ratio exhibited a weak uptrend, indicating a general tendency for small-cap equities to outperform large-cap counterparts during this period. The ratio appreciated by approximately 2.74% from its initial point to the latest closing value of 0.36406. This longer-term perspective suggests a prevailing sentiment favoring broader market participation beyond the dominant large-cap segments. The current ratio maintains a position nearer to its 30-day high, specifically at 0.657 of its range, implying that the longer-term relative strength has not fully dissipated.
In contrast, the more recent 14-day analysis reveals a weak, sideways trend for the IWM/SPY ratio, with a negligible change of approximately 0.43%. This short-term consolidation suggests a pause in the relative outperformance of IWM observed over the 30-day period. The ratio has been oscillating within a tighter range, defined by a high of 0.36970 and a low of 0.36103, with notably low volatility. The current ratio of 0.36406 is positioned at approximately 0.349 of its 14-day range, closer to the lower boundary of this recent sideways channel. This short-term weakness, indicated by the ratio’s relative position within its recent range, suggests a potential loss of immediate upward momentum.
Given the preceding technical observations, continued relative outperformance by IWM over SPY in the immediate future appears to have a roughly even chance. The longer-term weak uptrend provides a foundational bullish bias for the ratio, suggesting that the underlying impulse for small-cap outperformance remains present. However, the short-term sideways movement, combined with the current ratio trading in the lower half of its 14-day range, signals a current state of indecision. A sustained resumption of the 30-day uptrend would likely require a decisive break above the 14-day high ratio of 0.36970.
Alternatively, a decline below the 14-day low of 0.36103 would increase the likelihood of IWM underperforming SPY. Such a breakdown would suggest a reversal of the weak 30-day uptrend, with large-cap stocks resuming leadership. Without additional data confirming a clear breakout from the short-term consolidation, the most probable outcome in the immediate term is continued choppy, range-bound trading for the IWM/SPY ratio. A breakout from this established 14-day range, either above 0.36970 or below 0.36103, would provide a more reliable technical signal for future relative performance.
Here is a technical analysis of the IWM/SPY ratio over the past 90 days, based strictly on the provided market data:
The IWM/SPY ratio, representing the relative performance of small-cap stocks (Russell 2000, IWM) against large-cap stocks (S&P 500, SPY), exhibits a clear and moderate upward trend over the 90-day period. This indicates that small-capitalization equities have generally outperformed their large-cap counterparts during this timeframe, with the ratio experiencing a 4.42% increase from its starting point. The current ratio stands at 0.36406, positioning it above the 90-day average ratio of 0.35570 and relatively high within its observed range, as indicated by a relative position of 0.76505 (meaning it is 76.5% of the way from its lowest to its highest point over the period). This sustained upward trajectory strongly suggests a continued preference for small-cap exposure relative to large-cap exposure in the market as of the analysis end date.
A closer examination of the ratio’s movement reveals distinct phases. The ratio reached its 90-day low of approximately 0.34568 on August 1st, which has subsequently established a robust support level. Following this low, the ratio embarked on a notable rally, peaking at its 90-day high of approximately 0.36970 on September 18th. This ascent from early August to mid-September demonstrates significant technical strength and buying pressure for small-cap stocks relative to large-caps. The rally was characterized by relatively consistent upward progress, reflected in the low volatility metric (0.00004 for the ratio itself), which implies that daily fluctuations within the trend were generally contained, rather than exhibiting erratic or sharp swings.
In the most recent trading days following the September 18th peak, the IWM/SPY ratio has experienced a minor pullback, currently resting at 0.36406. This retracement from the recent high is a common pattern after a sustained rally and could represent either a consolidation phase or short-term profit-taking. Given the established moderate upward trend and the current ratio remaining significantly above its 90-day average, a continuation of the upward momentum and a retest of the 0.36970 resistance level is likely in the near term. However, should this resistance hold, a further pullback towards the average ratio of 0.35570 or potentially the mid-August support around 0.35290 has a roughly even chance of occurring before the primary upward trend reasserts itself. A significant breakdown below the August 1st support level of 0.34568 is unlikely in the immediate future based solely on the provided technical data, as there are no clear patterns indicating such weakness.
Traders should monitor the interaction of the ratio with the 0.36970 resistance level. A decisive break above this point would likely confirm the continuation of the stronger relative performance by small-caps. Conversely, sustained trading below this level for several sessions could indicate a temporary pause in outperformance, potentially leading to a period of consolidation or slight underperformance until new technical catalysts emerge. The overall technical posture, however, remains tilted towards further relative strength in IWM.
Commodities
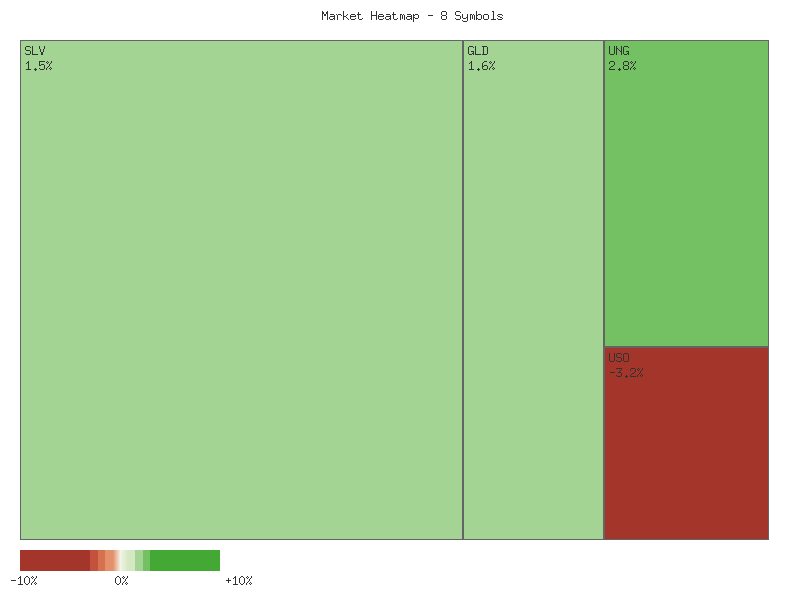
The recent daily performance of selected commodity-related symbols, as of September 29, 2025, reveals a mixed yet slightly positive overall sentiment. The aggregated daily percentage change for the eight symbols totals approximately 1.579%, indicating a marginally higher collective movement. Market breadth shows 5 advancing symbols against 3 declining symbols, suggesting a moderately positive underlying tone for the day. Precious metals, specifically GLD and SLV, posted strong gains, with SLV leading, while industrial metals also saw a notable advance in CPER. Conversely, energy-related instruments, USO and UGA, experienced significant declines, likely contributing to the mixed market behavior despite the positive sum of changes.
| Symbol | Daily Percent Change (2025-09-29) |
|---|---|
| CPER | 3.132% |
| UNG | 2.807% |
| GLD | 1.650% |
| SLV | 1.529% |
| CORN | 0.057% |
| DBC | -0.833% |
| UGA | -2.310% |
| USO | -3.155% |
A review of the GLD/SLV ratio over the 14-day period ending September 29, 2025, indicates a moderate downtrend, characterized by a -7.46% change in the ratio. The current ratio of 8.293 is positioned near the low end of the 14-day range (8.283 low, 8.962 high), with a relative position of 0.0145. This pattern suggests a sustained period of silver (SLV) outperforming gold (GLD). The moderate strength of this downtrend implies that this relative performance shift is more than a fleeting event and is likely indicative of developing momentum in silver.
The intermediate-term perspective provided by the 30-day GLD/SLV ratio corroborates the shorter-term observations. This ratio also shows a moderate downtrend, with a -6.65% change over the period. The current ratio of 8.293 registers very close to its 30-day low of 8.283, with a relative position of 0.0135. The consistent downward trend across both the 14-day and 30-day analyses suggests that silver’s relative strength against gold is a more enduring technical characteristic. While both GLD and SLV advanced on the latest day, SLV’s greater percentage gain (1.529% vs. 1.650%) further reinforces this trend, making continued silver outperformance a likely scenario in the near term.
Considering the market breadth and the GLD/SLV ratio, the overall commodity complex appears bifurcated. The strong performance in precious metals and UNG suggests targeted strength in certain areas, while significant declines in USO and UGA point to weakness in others. The moderate downtrend in the GLD/SLV ratio over both timeframes implies that a continuation of silver’s leadership within the precious metals complex is more likely than a reversal in the immediate future. A reversal would require a material shift in the GLD/SLV ratio’s direction, which is not currently indicated by the provided data. Therefore, the observed outperformance of SLV relative to GLD is expected to persist, though the overall mixed performance of the broader commodity basket suggests a roughly even chance of continued market-wide directionality in subsequent sessions.
As a CMT with extensive experience, my analysis of the provided two-day market data reveals a landscape of notable divergence across various commodity-linked assets, indicating distinct underlying technical pressures rather than a uniform market sentiment. The short-term price action, primarily from September 26th to September 29th, 2025, presents clear directional biases for most instruments, although some exhibit patterns suggestive of indecision.
Precious metals, specifically GLD (Gold) and SLV (Silver), have demonstrated strong upward momentum. GLD experienced a significant bullish surge on the second day, characterized by a substantial gap-up open and a close near the daily high, accompanied by a notable increase in volume. This pattern is highly likely to suggest a continuation of the bullish trend. SLV exhibited a similar, albeit slightly less pronounced, bullish candlestick on the second day, also with a gap-up open and a strong close, though on slightly decreased volume. While the volume decrease in SLV could suggest a marginal weakening of buying conviction, the strong price action nevertheless indicates that further upside is probable. Additionally, CPER (Copper) displayed a robust bullish engulfing-like pattern on the second day, marked by a higher open, higher high, and significantly higher close, supported by a substantial increase in volume. This combination of strong price appreciation and surging volume strongly suggests continued upward price discovery for copper.
Conversely, the energy complex shows a pronounced bifurcation. USO (Crude Oil) and UGA (Gasoline) both experienced significant bearish price action. USO recorded a considerable gap-down open on the second day, followed by a large bearish candle closing near its low, with a marginal increase in volume. This pattern is highly likely to indicate a continuation of selling pressure. Similarly, UGA saw a significant bearish candle extending well below the previous day’s low, coupled with a substantial increase in volume, reinforcing the bearish outlook as probable. In stark contrast, UNG (Natural Gas) displayed strong bullish momentum. The second day opened higher than the previous close, formed a large bullish candle, and closed near its high, with an accompanying increase in volume. This technical configuration makes further upward movement likely for natural gas.
Broader commodity indicators and agricultural assets present a more nuanced picture. DBC (Invesco DB Commodity Index Tracking Fund) showed a bearish candle on the second day, closing lower than the previous day’s low, but notably on significantly decreased volume. While the price action itself is bearish, the declining volume could suggest that selling pressure is beginning to wane, making a period of consolidation or a minor bounce a roughly even chance rather than a continued steep decline. CORN, meanwhile, exhibited extremely tight trading ranges and low volumes across both days. The second day saw a slightly higher close than the first, but the overall pattern suggests significant indecision. A continuation of range-bound trading is likely, with any substantial directional move being improbable in the immediate term based solely on this limited data.
Considering the diverse technical signals, the market appears to be in a phase where specific commodity sub-sectors are decoupling. The strength in precious metals and industrial metals (copper) is evident, pointing towards sustained upward pressure. However, the distinct bearishness in crude oil and gasoline, alongside the bullish turn in natural gas, indicates isolated forces driving these energy markets. Retail traders should be mindful that while strong directional moves are apparent in many assets, declining volume in some bearish scenarios (like DBC) or tight consolidation (CORN) introduces an element of uncertainty regarding the durability of immediate trends or hints at potential reversals if confirmed by subsequent price action and volume.
As a Chartered Market Technician with over 15 years of experience, I’ve analyzed the provided 90-day technical data for SLV, focusing strictly on price action, volume, the 14-day Relative Strength Index (RSI), and the 13-21-day Percentage Price Oscillator (PPO).
SLV’s price action over the last 90 days depicts a robust and accelerating uptrend. Starting near in late May, the asset experienced significant upward surges, first in early June to approximately .865, and then a more pronounced rally from mid-August, propelling prices from around .00 to a new 90-day high of .75 on September 29. These advancements were consistently underpinned by notably higher trading volumes, particularly on breakout days such as July 11 (57.9M shares) and September 26 (44.4M shares), affirming strong buying conviction. Intermediate consolidation periods, observed from late June to early July and late July to mid-August, generally corresponded with lower trading volumes, characteristic of healthy uptrends where strong demand drives prices higher, and selling pressure wanes during temporary pauses.
The 14-day Relative Strength Index (RSI) provides crucial insights into momentum and potential overextension. While earlier rallies saw the RSI enter overbought territory (above 70) and subsequently retreat, the latest leg of the rally, commencing in late August, has driven the RSI to exceptionally high levels. As of September 29, the RSI stands at 81.50. Such an extreme reading suggests that the current rally is likely overextended in the short term, increasing the probability of a near-term deceleration or a shallow price pullback. Despite the prevailing bullish sentiment, this elevated RSI indicates increasing risk for fresh long positions and potentially signals an impending, albeit temporary, relief in upward pressure.
In contrast to the RSI’s short-term cautionary signal, the Percentage Price Oscillator (PPO) with 13 and 21-day settings strongly validates the intermediate-term trend’s strength. The PPO established itself firmly in positive territory in early June and has maintained its bullish posture. More importantly, during the most recent advance from mid-August, the PPO has exhibited a powerful, sustained ascent, reaching a value of 2.42 on September 29. This consistent upward trajectory, without any observable bearish divergence from the price action, confirms robust and accelerating bullish momentum. The PPO’s overall pattern suggests that the underlying upward trend remains well-supported and is likely to persist, indicating strong buying conviction on a sustained basis.
Combining these technical observations, the intermediate-term outlook for SLV is primarily bullish, with the expanding PPO and consistent high-volume price advances firmly supporting the ongoing uptrend. The establishment of new 90-day highs further strengthens this positive assessment. However, the extremely high 14-day RSI at 81.50 signals that the market is likely in an overextended condition on a short-term basis. This implies a roughly even chance of a temporary price consolidation or a minor pullback to alleviate this overbought state before the broader uptrend likely resumes. A significant reversal of the established bullish trend is unlikely without more substantial technical degradation, such as a bearish PPO crossover or a decisive break in key support levels. Prudent traders may wish to consider risk management in light of the short-term overextension.
Technical Analysis of GLD (90-day view)
GLD has displayed a robust bullish trend throughout the 90-day observation period, moving from approximately .55 in late May to .46 by late September. The price action evolved from an initial consolidation phase between May and mid-August, largely within the - range, to an accelerated upward trajectory from late August onwards, consistently achieving new highs. This aggressive rally has been accompanied by generally rising volumes during upward price movements, notably during key breakout periods in early June, mid-June, and throughout the late August-September surge. The increasing volume on these advances typically confirms the strength of the underlying buying pressure in the prevailing uptrend.
Both the 14-day Relative Strength Index (RSI) and the 13-21 day Price Percentage Oscillator (PPO) confirm the strong bullish momentum. During the initial consolidation, RSI fluctuated around the 50-level, briefly touching the low 40s before recovering. Concurrently, the PPO navigated around its zero line, occasionally dipping slightly negative before re-establishing positive territory. From late August, as the price surge began, both indicators moved decisively upwards. The RSI entered and largely remained in the overbought zone (above 70), peaking at 79.21 and concluding at 78.07. Similarly, the PPO saw a significant and sustained ascent above its zero line, reaching a period high of 1.45 at the latest data point. These readings collectively underscore persistent and powerful buying interest.
The sustained overbought readings in the 14-day RSI, combined with the rapid and continuous ascent in price over the past month, suggest that GLD is currently in an extended position. While the PPO continues to confirm this strong momentum, without exhibiting bearish divergence, the probability of an immediate trend reversal is not high. However, the extended overbought condition in RSI implies that a short-term pullback or a period of consolidation is likely. Such a retracement would be a healthy development within an established uptrend, allowing the market to re-balance. Potential support levels for a pullback could be observed around the - region, which represented a previous consolidation range, or possibly deeper towards the - area where prior significant breakouts occurred.
An alternative scenario involves GLD continuing its sharp upward trajectory despite the current overbought signals. This outcome is less likely without at least a brief pause, but if it occurs, it would indicate an exceptionally powerful trend possibly leading to a ‘blow-off top’ in the longer term, though evidence for such a pattern is not definitively established in this 90-day window. Conversely, a sharp reversal characterized by the RSI breaking below 70 and the PPO crossing below its signal line, particularly if accompanied by significantly increased selling volume, would increase the probability of a more substantial correction below the aforementioned support levels. Traders are advised to monitor these momentum shifts for further directional cues.
Bonds
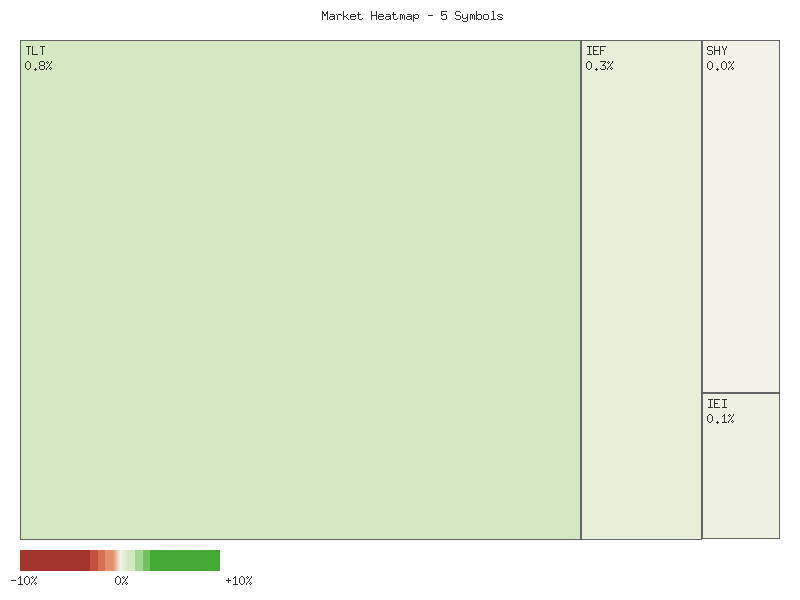
The provided market data for the fixed-income Exchange Traded Funds (ETFs) over two trading days (2025-09-26 and 2025-09-29) reveals a broadly positive technical posture. The net daily percent change for each symbol, representing the cumulative change over the two-day period, is presented in descending order in the following matrix:
| Symbol | Daily Percent Change |
|---|---|
| TLT | 0.731% |
| UTHY | 0.678% |
| IEF | 0.239% |
| IEI | 0.142% |
| SHY | 0.097% |
The analysis of these net changes indicates an overall higher trend across the observed fixed-income spectrum. Summing the individual net daily percent changes across all five symbols yields a total aggregate increase of 1.888%. This collective positive movement across various bond durations, from long-term (TLT, UTHY) to short-term (SHY), suggests a prevailing upward bias in the market for these assets during the specified period. It is highly likely that market participants are exhibiting increased demand for fixed-income instruments.
Examining the market breadth for the most recent trading day, 2025-09-29, all five symbols (TLT, UTHY, IEF, IEI, SHY) registered positive daily percent changes. Specifically, there were five advancing symbols and zero declining symbols. This represents exceptionally strong breadth, indicating that the buying interest on this day was widespread across the various duration segments. Such unanimous upward movement strongly suggests a high degree of positive market sentiment for fixed income, with virtually no signs of selling pressure among these instruments on the last recorded day.
Further technical observation of the individual daily movements reveals a pattern of initial weakness followed by a strong recovery for longer and intermediate duration assets. TLT, UTHY, and IEF all experienced declines on 2025-09-26, subsequently reversing with significantly larger positive moves on 2025-09-29. This suggests a potential capitulation or dip-buying scenario before the strong rally. In contrast, the shorter-duration instruments, IEI and SHY, exhibited positive daily changes on both observed days, albeit with smaller magnitudes, indicative of more consistent, lower-volatility upward drift. The strong magnitude of the advances on 2025-09-29, particularly for TLT (0.821%) and UTHY (0.779%), implies significant technical momentum.
Based solely on this data, the overall market for these fixed-income instruments is likely trending higher. The strong breadth and the magnitude of the advances on the most recent day suggest that positive sentiment is pervasive. While the preceding decline for longer-duration assets could be interpreted as a potential volatility spike, the subsequent rally to net positive changes implies strong underlying demand. It is unlikely that this broad-based positive movement is merely an isolated event, given its uniform nature across diverse duration profiles. However, the limited two-day data window means that assessing long-term trend sustainability is outside the scope of this analysis. Should these patterns continue, further positive technical developments for fixed income assets would be a likely outcome.
As a Chartered Market Technician with over 15 years of experience, I will provide a technical analysis of the provided market data for TLT, UTHY, IEF, IEI, and SHY, focusing exclusively on the two days of price and volume information.
The aggregated data for all observed fixed-income instruments—TLT, UTHY, IEF, IEI, and SHY—exhibits a consistent short-term bullish posture over the two-day period. Each instrument registered a higher high, a higher low, and a higher close on the most recent day compared to the preceding day. While the first day for most instruments showed relatively small-bodied candles, suggesting a period of market indecision, the subsequent day saw clear bullish candlesticks, indicating a prevailing upward momentum across this sector within the observed timeframe.
A more granular analysis reveals distinct patterns when considering volume. For TLT (long-term Treasury ETF) and SHY (short-term Treasury ETF), the significant upward price movement on the most recent day was accompanied by a notable increase in trading volume. TLT saw its volume rise from approximately 30.9 million to 32.1 million shares, while SHY’s volume surged from 2.2 million to 3.8 million shares. This confluence of bullish price action with increasing volume likely suggests a strengthening of buying interest and lends conviction to the recent ascent for these specific instruments. Based on this technical confirmation, the probability of a continued short-term upward trend for TLT and SHY is assessed as higher.
Conversely, UTHY, IEF, and IEI, despite also closing bullishly on the second day with higher highs and higher lows, displayed a different volume profile. For these instruments, the price increase occurred on decreasing trading volume. UTHY experienced a volume drop from 10,604 to 3,544, IEF from 7.2 million to 6.3 million, and IEI from 1.5 million to 0.9 million. While a price increase on its own is bullish, the lack of reinforcing volume could indicate a waning of buying conviction or a potential exhaustion of the current upward impetus. This divergence in volume behavior raises questions about the sustainability of the upward move for these particular instruments.
In conclusion, the overall short-term technical landscape for the observed fixed-income instruments points predominantly upward. For TLT and SHY, the technical posture, characterized by robust bullish candles supported by increasing volume, likely indicates further short-term strength. However, for UTHY, IEF, and IEI, the bullish price action on declining volume suggests a more cautious outlook. There is a roughly even chance that these instruments could either continue their upward trajectory, albeit potentially at a slower pace due to less conviction, or enter a period of consolidation or minor pullback in the very immediate term as momentum potentially wanes. Despite these nuanced volume signals, the consistent pattern of higher closes across all five instruments establishes a prevailing bullish bias within this narrow two-day observation window.
Crypto
The analysis of the provided daily percent change data for IBIT and ETHA indicates an overall higher directional bias across both symbols for the two-day observation period. ETHA demonstrates a more significant cumulative positive movement, outpacing IBIT’s total gain. The aggregated percentage changes for each symbol are presented in the following matrix, sorted in descending order:
| Symbol | Overall Percent Change |
|---|---|
| ETHA | 7.11% |
| IBIT | 4.63% |
IBIT’s price action initially experienced a modest decline of -0.26% on the first day, followed by a substantial positive reversal of 4.89% on the second day. This sequence suggests that an initial period of weakness was succeeded by robust buying pressure. Such a pattern is likely indicative of resilient buying interest emerging after a minor pullback, potentially leading to a short-term rebound. However, without additional data, it remains a roughly even chance that this strong single-day performance could be an isolated event rather than the inception of a sustained uptrend, warranting cautious interpretation. The strong positive close on the second day largely mitigates the initial dip, signaling a positive shift in short-term sentiment.
In contrast, ETHA demonstrated consistent positive momentum throughout the two-day period, recording gains of 2.97% and 4.14% respectively. The acceleration in positive momentum on the second day, where the gain exceeded that of the first, highly likely suggests increasing conviction among buyers. This consistent upward trajectory, without any intermediate negative closes, often implies a more stable and potentially enduring bullish sentiment over the observed timeframe. The absence of negative price action during this period further reinforces the perception of underlying strength.
Comparing the two symbols, ETHA exhibits a more robust and less volatile short-term upward trajectory compared to IBIT. While both symbols concluded the period with net gains, ETHA’s sustained positive progression, without an initial dip, suggests a more established bullish trend over this brief observation window. IBIT’s performance, though also net positive, involved a recovery from an initial drawdown, which introduces a slightly higher degree of intra-period volatility. Based solely on the provided data, ETHA is likely to maintain its relative strength in the immediate future, assuming the observed momentum persists. However, it is crucial to recognize that these conclusions are drawn from a limited dataset spanning only two days, and projecting long-term trends would be highly unlikely without further historical context.
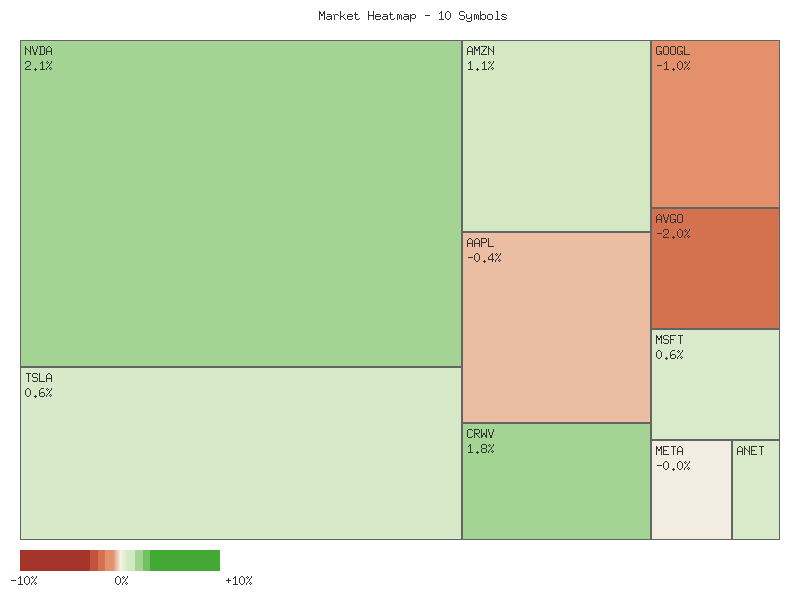
Magnificent 7 & Friends
Analysis of the provided daily percentage change data across ten distinct symbols reveals a market exhibiting mixed technical signals over the two-day period. Market breadth, as measured by the number of advancing versus declining symbols, is precisely even, with five symbols concluding the period with a net positive change and five symbols with a net negative change. This even distribution suggests a lack of broad directional conviction among this specific peer group, with capital flows appearing to be rotational rather than uniformly bullish or bearish.
Aggregating the two-day percentage changes across all ten symbols indicates a composite movement that is roughly flat, registering a slight positive bias of approximately 0.29%. This marginal positive aggregate masks significant dispersion in individual symbol performance. The range spans from a robust +4.656% for TSLA to a notable -3.178% for CRWV, illustrating pronounced divergence within the observed universe. Such varied performance typically implies that sector-specific or idiosyncratic influences are dominating price action rather than broad market momentum.
TSLA demonstrated considerable relative strength, advancing by 4.656% over the two-day interval, positioning it as the leading performer. NVDA and AMZN also exhibited strong upward momentum, with gains of 2.335% and 1.835% respectively, indicative of concentrated buying interest in these specific names. Conversely, CRWV showed significant weakness, declining by 3.178%, suggesting substantial selling pressure. AVGO also faced notable downward pressure, registering a 2.449% decrease, indicating potential technical breakdown or profit-taking within that specific issue.
The intermediate performers, such as MSFT with a gain of 1.488% and ANET with a modest 0.219% increase, maintained positive territory but with less pronounced conviction than the leading advancers. On the declining side, GOOGL, META, and AAPL each experienced modest pullbacks, ranging from -0.705% to -0.952%. Given the even market breadth and the near-flat aggregate performance, a continued period of consolidation or rotational trading within this cohort is a plausible scenario. A sustained shift in the advancer/decliner ratio in future periods would be a key technical indicator to monitor for potential directional bias for the overall group.
| Symbol | Daily Percent Change |
|---|---|
| TSLA | 4.656% |
| NVDA | 2.335% |
| AMZN | 1.835% |
| MSFT | 1.488% |
| ANET | 0.219% |
| GOOGL | -0.705% |
| META | -0.736% |
| AAPL | -0.952% |
| AVGO | -2.449% |
| CRWV | -3.178% |
As a Chartered Market Technician with extensive experience, my analysis focuses strictly on the supplied two-day candlestick data for the specified symbols, adhering to rigorous technical principles and estimative language guidelines.
Several equities are exhibiting pronounced bullish momentum over the past two trading sessions. Microsoft (MSFT) has demonstrated a robust upward trend with consecutive bullish candles, characterized by higher closes, higher highs, and notable increasing volume on the second day. Amazon (AMZN) mirrors this strength, also displaying two strong bullish candles with increasing volume and advancing price levels. NVIDIA (NVDA) similarly showcases strong buying conviction; while day one was moderately bullish, day two produced a powerful bullish candle, closing higher with a significant surge in trading volume. For MSFT, AMZN, and NVDA, a continuation of their respective upward price movements is highly likely based on these patterns of price progression and volume confirmation.
Conversely, a distinct bearish trend is evident in other symbols. Broadcom (AVGO) recorded two successive bearish candles, with the second day closing at the two-day low on increased volume, signaling intensifying selling pressure. Alphabet (GOOGL) presents a similar profile, showing two strong bearish candles. Day two, in particular, closed at a new two-day low with a substantial increase in selling volume, confirming downward momentum. Meta Platforms (META) also observed two bearish candles; however, day two formed an inside bar relative to day one’s range with slightly reduced volume. While the immediate bias for AVGO and GOOGL suggests that a continuation of their downtrends is highly likely, for META, a period of consolidation or a deceleration in the downtrend is likely following the inside bar and volume pattern.
Other symbols display mixed or consolidating signals, indicating potential shifts or indecision. Apple (AAPL), after a bullish first day, saw its price close lower on the second day, forming a bearish candle with decreased volume. This pattern suggests potential profit-taking or diminishing buying interest, making a period of sideways consolidation or a minor pullback likely. Tesla (TSLA) initially showed strong bullish momentum on day one, but day two, while still closing higher, did so with significantly decreased volume and a smaller candle body, implying weakening buying conviction. For TSLA, consolidation or a near-term pullback has a roughly even chance as momentum appears to be slowing. Crown Castle (CRWV) experienced a sharp sell-off on day one. Day two saw a bullish recovery candle, but on decreased volume. This suggests a retracement rather than a robust reversal, and a continuation of the prior downward momentum has a roughly even chance, with potential for further consolidation at current levels. Arista Networks (ANET) recorded a bearish first day, followed by a strong open on day two that resulted in a high, but the candle closed well off that high, leaving a significant upper shadow despite closing higher than day one. The increased volume signifies interest, but the rejection from the high implies resistance. For ANET, consolidation or a pullback from the day two high is likely.
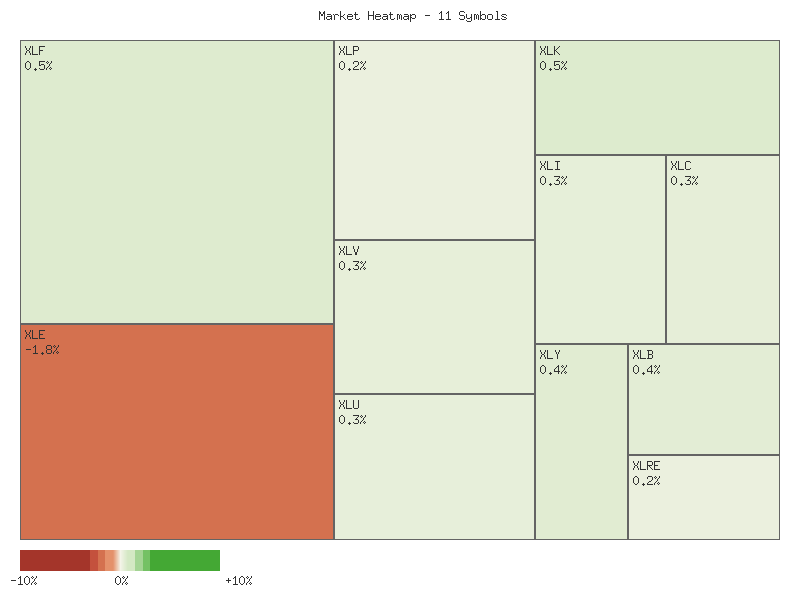
S&P 500 Sector Breadth
The aggregate two-day performance of the eleven S&P 500 sector ETFs suggests an overall upward bias within the market. Summing the daily percentage changes for each symbol across the two provided timestamps reveals a combined positive return of approximately 11.96% for the group. This broad positive movement indicates that the observed period was largely characterized by upward price action across diverse market segments.
From a market breadth perspective, the data suggests a highly favorable environment. Ten out of the eleven analyzed sector ETFs recorded a positive aggregate daily percent change over the two-day period, indicating broad participation in the upward movement. Only one sector, Energy (XLE), registered a decline. This overwhelming majority of advancing symbols signals robust market breadth, which is typically considered a constructive technical indicator for short-term market strength.
The sector-specific analysis indicates a mixed, yet predominantly positive, environment for both offensive and defensive sectors. Among the six offensive sectors (XLK, XLY, XLF, XLI, XLB, XLE), five displayed positive aggregate performance, with XLY (Consumer Discretionary) leading this group. Conversely, XLE (Energy) was the sole declining sector. All four defensive sectors (XLU, XLP, XLV, XLRE) advanced, with XLU (Utilities) showing strong performance, almost mirroring XLY. The strong performance across both offensive and defensive categories makes a clear indication of market rotation into one type of sector less likely. Instead, the data might suggest a broad-based rally where most sectors, regardless of their risk profile, experienced appreciation, with the notable exception of Energy.
Considering the overall market sentiment, the prevalent advancement across both offensive and defensive sectors suggests a broadly optimistic outlook among market participants for this two-day period. While offensive sectors largely participated in the gains, the simultaneous strong showing of all defensive sectors, particularly XLU and XLV, might indicate that some degree of prudence or allocation to lower-volatility assets remains present. It is highly likely that the dominant sentiment is bullish, though perhaps underpinned by a balanced approach rather than an outright aggressive “risk-on” posture. The significant underperformance of the Energy sector, even amidst broad market strength, could imply sector-specific headwinds, but this observation alone is unlikely to negate the overwhelmingly positive breadth.
| Symbol | Daily Percent Change |
|---|---|
| XLY | 1.9155% |
| XLU | 1.9152% |
| XLB | 1.5442% |
| XLV | 1.3166% |
| XLC | 1.2957% |
| XLF | 1.2307% |
| XLI | 1.2074% |
| XLRE | 1.1797% |
| XLK | 0.8365% |
| XLP | 0.4367% |
| XLE | -0.9156% |
Market Commentary: Sector Performance Snapshot (26-29 September 2025)
The provided two-day market data suggests a predominantly positive, albeit somewhat nuanced, short-term technical landscape across the major S&P 500 sectors. A significant majority of sectors, including XLP (Consumer Staples), XLU (Utilities), XLV (Healthcare), XLY (Consumer Discretionary), XLF (Financials), and XLRE (Real Estate), exhibited strong bullish momentum. These sectors consistently posted higher highs and higher lows, with the second day’s closing price often near the day’s high or the previous day’s close, signaling underlying strength. For instance, XLU closed robustly higher on both days with increasing volume on the second day, making a continuation of its upward trend likely in the immediate future. Similarly, XLY displayed sequential higher highs and higher lows, closing above its open on the second day, reinforced by increased volume, which typically validates the price move.
However, the bullish sentiment was not uniformly distributed, with several sectors displaying more ambiguous technical patterns. XLK (Technology), XLI (Industrials), XLB (Materials), and XLC (Communication Services) all experienced initial bullish momentum on the second trading day, marked by higher opens or significant upward gaps. Yet, each of these sectors subsequently saw price rejection from their daily highs, closing below their opening price for the day. While still above the prior day’s close, this rejection candle, particularly when coupled with declining or mixed volume as seen in XLK, XLB, and XLC, suggests a roughly even chance of either a continuation of the upward trend after a period of consolidation, or a potential short-term pullback to digest the recent gains. Traders might interpret this as profit-taking in the near term or a sign of diminishing conviction at higher price levels.
A notable outlier to the prevailing bullish sentiment was XLE (Energy). After a modest gain on the first day, XLE opened near its previous day’s open on the second day but subsequently experienced a significant decline, printing a lower low and closing decisively lower. This pattern, characterized by a substantial bearish candlestick, suggests that a short-term downtrend for XLE is probable. The inability to hold previous levels and the strong bearish close indicate a shift in immediate sentiment for this sector, making further downside exploration likely in the very short term unless a clear reversal pattern emerges from subsequent data.
In summary, the aggregated technical evidence from these two trading days paints a picture of a market largely advancing, with robust, sustained upward momentum observed across defensive and cyclically sensitive sectors such as Utilities, Consumer Discretionary, and Financials. Nevertheless, the mixed signals from Technology, Industrials, Materials, and Communication Services, coupled with the distinct weakness in Energy, indicate some underlying divergences within the broader market structure. While overall market strength appears to be the dominant theme, the observed price rejections in key growth sectors and the outright bearish movement in Energy suggest that continued upward progress might encounter pockets of resistance or lead to increased sector rotation, rather than a broad-based, unhindered rally, making careful sector-specific monitoring essential.
Equity Breadth
The S&P 500’s 20-day Exponential Moving Average (EMA_20_DAY) has demonstrated a consistent upward trajectory across the seven-day observation period, moving from approximately 6536.65 on 2025-09-19 to 6586.94 on 2025-09-29. This persistent advance in a key short-to-intermediate term trend indicator suggests robust underlying positive momentum for the index itself. This pattern establishes an unambiguous short-term uptrend for the S&P 500.
An examination of the percentage of S&P 500 members trading above their 200-day moving average (SPXA200R) reveals a generally improving long-term breadth condition over the review period. Despite a temporary dip from 61.28% to 58.08% on 2025-09-25, which coincided with weakness in the 50-day breadth, the indicator advanced from 59.88% to 62.48%, concluding at its highest point in the provided dataset. This upward progression in long-term participation strongly indicates an expanding cohort of constituents contributing to the broader market’s long-term advance. It is highly likely that this expanding long-term breadth provides confirmatory evidence for a sustainable underlying bullish sentiment from a long-term perspective.
The percentage of S&P 500 members trading above their 50-day moving average (SPXA50R) exhibited greater volatility during the period. Starting at 56.69%, it saw an initial dip, then recovered, only to experience a significant decline to 48.50% on 2025-09-25. This move below the 50% threshold implies that, at that specific point, a majority of index members had fallen below their intermediate-term trend line, indicating a temporary but notable weakening of intermediate-term market health. However, the indicator subsequently rebounded sharply to 57.49% and then to 58.08%, closing the period near its initial levels and well above the critical 50% mark. This rapid recovery suggests that the intermediate-term weakness was potentially transitory, possibly reflecting rotational activity or a brief period of profit-taking, rather than a sustained breakdown.
Considering the observed trends, the sustained upward movement of the S&P 500’s 20-day EMA is strongly supported by the improving long-term market breadth. The SPXA200R’s ascent to new highs within the period reinforces the notion of fundamental strength underpinning the market’s trajectory. While the SPXA50R’s significant decline and subsequent recovery introduced a degree of intermediate-term uncertainty, its prompt return above 50% mitigates the immediate bearish implications. Therefore, it is highly likely that the S&P 500’s current trend, as defined by its 20-day EMA, will continue to advance. There is a low likelihood that the brief intermediate-term weakness observed in SPXA50R will derail the established short-term bullish momentum of the index itself, particularly given the strengthening long-term breadth. An alternative scenario suggests that a failure of SPXA50R to sustain above 50% in subsequent periods could introduce renewed intermediate-term downside risk, potentially challenging the bullish momentum, though this remains a low probability given the observed robust recovery.
SPX Daily
The SPX has maintained a discernible uptrend over the observed 90-day period, characterized by price action consistently trading above both the rising 50-day and 200-day Exponential Moving Averages (EMAs). The 50-day EMA (6461.62) remains well above the 200-day EMA (6069.39), which constitutes a bullish “golden cross” formation, reinforcing the long-term upward trajectory.
Focusing on the immediate past, the last trading day (2025-09-29) closed at 6661.21, slightly below its open, forming a small red candle with a high of 6677.31 and a low of 6644.49. This suggests a session of minor consolidation or indecision. The Relative Strength Index (RSI) for this day registered 64.48, indicating strong momentum without entering overbought territory, thereby allowing for potential further upside. Over the past seven trading days, the SPX experienced a rally to an all-time high of 6693.75 on 2025-09-22, where the RSI reached an extended level of 74.75, signaling overbought conditions. This was followed by a modest pullback to 6604.72 on 2025-09-25, allowing the RSI to cool down to 58.74. The most recent two trading sessions (2025-09-26 and 2025-09-29) show a renewed bullish impulse, with prices recovering to 6661.21, suggesting that dip-buyers emerged following the brief correction.
Immediate overhead resistance is likely situated at the 2025-09-22 high of 6693.75, and marginally above that, the 2025-09-23 high of 6699.52. A decisive break above these levels would signal a continuation of the prevailing uptrend. Conversely, immediate support appears to be at the recent pullback low of 6604.72 (2025-09-25), with the psychological level of 6600 likely offering additional defense. Should this level fail, the rising 50-day EMA, currently positioned around 6460, would represent the next significant dynamic support zone.
Looking forward, several scenarios appear plausible. A bullish case suggests a moderate to high probability of the SPX re-challenging and potentially surpassing the 6700 resistance level. The recent RSI reset from overbought conditions, combined with the bounce from the pullback low, provides scope for renewed upward momentum. A sustained close above 6700 would likely set new all-time highs, with subsequent resistance points needing to be extrapolated. In a bearish case, if the SPX fails to convincingly break above the 6690-6700 resistance zone and shows rejection, a retest of the 6600 support is a roughly even chance. A break below 6600 could increase the probability of a deeper correction towards the 50-day EMA near 6460. A breach of the 50-day EMA would be a notable technical deterioration, suggesting a shift from the short-term bullish trend. A neutral case entails consolidation, with the index trading sideways within the established range of approximately 6600 to 6700. This could occur if market participants exhibit indecision or await further catalysts, with a moderate probability of such price action unfolding in the near term.
Sentiment drivers appear primarily constructive. The resilience observed following the minor pullback, coupled with the consistently rising EMAs, indicates a strong underlying bullish bias among market participants. The willingness to buy dips, especially as the RSI retreated from overbought readings, suggests that investors perceive pullbacks as opportunities rather than significant trend reversals. This pattern implies that the general appetite for risk remains robust, and the market is likely to interpret positive developments as affirmation of the existing uptrend, while negative news might be absorbed, leading to temporary consolidations rather than widespread selling.
As a CMT with extensive experience, I will provide a rigorous technical analysis of the SPX based solely on the provided 90-day candlestick data, 14-day Relative Strength Index (RSI), and 13/21-day Percentage Price Oscillator (PPO).
The S&P 500 (SPX) has exhibited a robust and persistent uptrend over the past 90 trading days, marked by a clear sequence of higher highs and higher lows. From late May, when the index traded around 5844, it has ascended consistently to reach levels near 6661 by late September. This long-term price action indicates a dominant bullish sentiment within the observed period. However, analyzing the internal dynamics through momentum oscillators like RSI and PPO reveals nuanced shifts in buying pressure and potential exhaustion points that warrant careful consideration.
During periods of strong bullish impetus, such as the late June to early July rally, the 14-day RSI consistently surged into overbought territory, exceeding the 70 threshold and peaking at approximately 75.57 on July 3rd. Concurrently, the 13/21-day PPO registered significant positive momentum, reaching a peak around 0.94. These readings typically signal an extended buying spree, often preceding a consolidation or minor pullback as momentum normalizes. Indeed, subsequent to these extended overbought conditions, the SPX experienced minor corrections, allowing the RSI to cool down from elevated levels. A more noticeable, albeit brief, price correction occurred in early August following another RSI peak above 76 in late July. During this early August decline, the RSI receded significantly to 47.80, and the PPO dropped from 0.76 to 0.38, indicating a temporary but substantial loss of upward momentum. These periods of price weakness appear to have been absorbed by the underlying demand, allowing the uptrend to resume.
More recently, the SPX pushed to fresh all-time highs in mid-September, with price reaching 6698.88 on September 22nd. This price action again propelled the 14-day RSI into overbought territory, registering 74.75. However, a notable technical observation emerges from the PPO: while the SPX posted a higher high on September 22nd, the PPO peaked at 0.635, which is substantially lower than its previous peak of 0.7647 observed on July 28th, even though the price level on July 28th was significantly lower (6401.07). This discernible negative divergence between price and the PPO suggests that the underlying bullish momentum is likely weakening, even as the index makes nominal new highs. Following this, the SPX experienced a mild pullback, with RSI receding from overbought levels to 64.47 and PPO declining to 0.52 by September 29th.
Given the current technical landscape, there is a roughly even chance of the SPX maintaining its immediate upward bias in the short term, supported by the overarching bullish trend and RSI having retreated from extreme overbought conditions. However, the identified negative divergence in the PPO increases the likelihood of a more significant price consolidation or corrective phase emerging in the near future. Should the SPX fail to achieve significantly higher price levels or if the PPO continues to trend lower as price attempts new highs, the probability of a deeper correction would increase to likely. Conversely, a sustained breakout to new all-time highs accompanied by a renewed, strong upward thrust in both RSI and PPO would likely negate the bearish implications of the current PPO divergence, signaling a potential continuation of robust bullish momentum. A breach of recent support levels, particularly around the 6400 area observed during early September’s consolidation, would confirm a short-term bearish shift and would suggest a higher probability of further downside.