Daily Market Technical Analysis
Market Overview
The market exhibits a predominantly bullish short-term outlook, with key U.S. indices closing higher and the VIX declining significantly, signaling reduced market fear. While the S&P 500’s (SPX) long-term uptrend is highly likely to persist, short-term deceleration in momentum makes a minor pullback or consolidation a roughly even chance. Technology (QQQ) is likely to continue outperforming SPY, albeit with weak momentum, while small-caps (IWM) face a likely short-term correction due to waning momentum. Commodities present mixed signals: silver is highly likely to continue its rally, but gold faces likely consolidation due to overbought conditions. Bond markets show divergent trends, with short-duration likely strong and longer-duration probably weak. Overall, broad market breadth indicates underlying resilience, suggesting the upward trend will likely persist despite sector-specific weaknesses. Traders should monitor for consolidation in overextended areas and confirmation of relative strength in leading segments.
Market Indices
As a Chartered Market Technician with over 15 years of experience, I have analyzed the provided market data for key U.S. indices and the VIX. The analysis focuses exclusively on the supplied technical indicators and adheres strictly to ICD-203 estimative language guidelines.
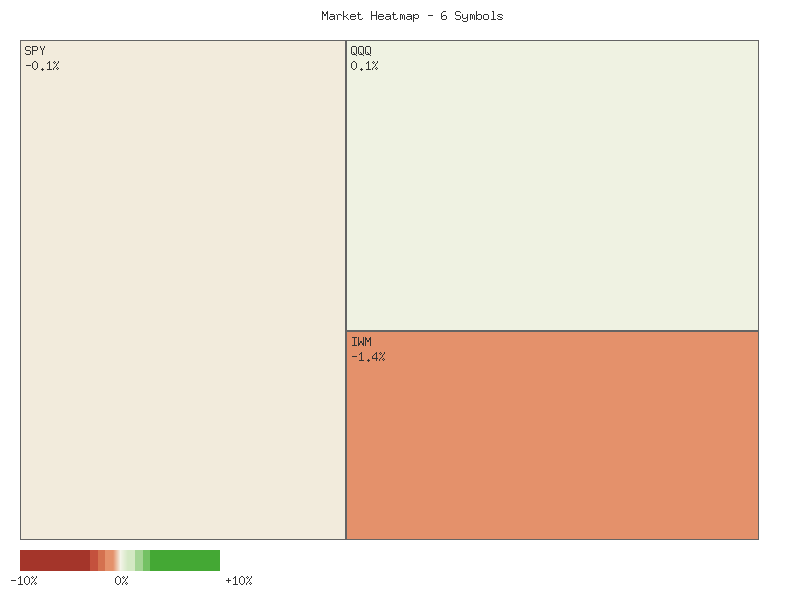
The market data for 2025-09-26 indicates a broadly positive trading session across key U.S. indices and ETFs. The following matrix illustrates the daily percent changes for the specified symbols, sorted in descending order:
| Symbol | Daily Percent Change (2025-09-26) |
|---|---|
| MDY | 1.0106% |
| IJR | 0.9888% |
| IWM | 0.8567% |
| SPX | 0.5902% |
| OEF | 0.4370% |
| QQQ | 0.4111% |
All six reviewed symbols—MDY (Mid-Cap), IJR (Small-Cap Growth), IWM (Small-Cap Russell 2000), SPX (S&P 500), OEF (S&P 100), and QQQ (Nasdaq 100)—registered gains on 2025-09-26. The mid-cap (MDY) and small-cap (IJR, IWM) segments demonstrated particularly robust performance. The aggregate sum of these daily percent changes for the session is approximately 4.29%, suggesting an overall higher trend for these representative market segments. This widespread advancement across various market capitalizations signals strong, positive market breadth, with all six symbols closing higher and no decliners among this specific group for the day.
In conjunction with the broad market rally, the CBOE Volatility Index (VIX) experienced a notable decline on 2025-09-26, registering a daily percent change of -8.66%. This significant single-day retreat in the VIX is consistent with an environment of decreasing market fear and increasing investor confidence, which commonly accompanies upward movements in equity indices. The inverse correlation between the VIX and equity performance is a well-established technical observation, and the current data aligns with this pattern. A decline of this magnitude in the VIX is likely to reinforce positive sentiment in the immediate term.
Examining the VIX candle data over the past seven trading days reveals a period of fluctuating volatility that concluded with a sharp downturn. After probing higher resistance levels and recording an intraday high of 17.74 and a closing high of 16.74 on 2025-09-25, the VIX experienced a considerable gap-down on 2025-09-26, closing at 15.29. This closing price is notably at the lower end of the observed 7-day range, matching the lowest closing price within this period (15.29 on 2025-09-19). The sustained move lower, particularly after repeated attempts to establish higher values around the 17.00 level failed, suggests that immediate-term concerns may be diminishing. The VIX appears to have rejected attempts to sustain levels indicative of elevated market anxiety.
Based on the provided technical data, it is likely that market sentiment, as represented by these key indices, is currently bullish following a notably strong session on 2025-09-26. The widespread gains across market capitalization segments, coupled with the significant VIX decline, suggests a reduction in perceived short-term risk. However, it is a roughly even chance that this VIX decline could be interpreted in two ways: either as a robust confirmation of bullish equity momentum or as a sign of increasing complacency that could precede future volatility. Should the VIX sustain levels below the 15.50 mark, it would likely signal continued stability or potential further upside for equities in the immediate term. Conversely, a reversal in VIX, moving back towards the 16.50-17.00 range, would suggest that the recent dip in volatility was temporary and that underlying market anxiety persists, making a sustained equity rally less probable. At present, the technical indicators point to a period where risk aversion is receding.
As a Chartered Market Technician with over 15 years of experience, my analysis of the provided two-day market data for SPY, QQQ, IWM, IJR, MDY, and OEF indicates a broad-based, short-term bullish trend across various market capitalization segments. All six exchange-traded funds (ETFs) registered higher closing prices on the second trading day (September 26) compared to the first (September 25). This widespread upward movement, characterized by consecutive higher closes for the majority of these instruments, establishes a clear short-term upward momentum and suggests sustained buying interest following initial trading sessions.
Upon closer examination of individual ETF performance, several instruments exhibited particularly strong technical patterns. MDY, representing mid-capitalization stocks, demonstrated robust bullish continuation with two significant green candles. Crucially, this upward price action was supported by an increase in trading volume on the second day, which significantly reinforces the strength and conviction behind MDY’s upward trajectory. Consequently, a continuation of its immediate ascent is highly likely. Similarly, IJR, focused on small-cap stocks, presented a strong bullish engulfing pattern on the second day, where its price action completely overshadowed the prior day’s minor retracement (a small red candle). This pattern typically signals a forceful shift in sentiment, making immediate bullish follow-through likely for IJR. SPY, QQQ, IWM, and OEF also sustained upward movements, recording higher highs and higher lows, indicative of ongoing short-term bullish trends.
Despite the overall bullish picture, specific nuances within the data warrant consideration for alternative scenarios. For SPY, QQQ, IWM, and IJR, the upward price movement on the second day was accompanied by a noticeable decrease in trading volume. This divergence between price and volume could indicate a waning conviction among market participants or suggest that the current rally is being driven by fewer buyers. Such a pattern raises questions about the sustainability of the immediate upward trend for these particular ETFs. While a direct reversal is unlikely given the strong price action, a period of consolidation or a minor pullback becomes a credible, though not likely, alternative scenario for these instruments, particularly if volume continues to decline in subsequent sessions. For MDY and OEF, where volume either increased or remained stable, the probability of an immediate pullback is considerably lower.
Based on the preponderance of the provided technical evidence, the immediate short-term outlook for the broad market, as represented by these ETFs, is likely to remain bullish. The consistent higher closes across multiple indices underscore positive momentum. However, traders should note the mixed signals from volume, specifically the declining volume in SPY, QQQ, IWM, and IJR, which implies that while bullish continuation is probable, the pace might moderate, or a consolidation could ensue. For MDY, the technical posture appears strongest due to its confirming volume, suggesting a highly likely continuation of its upward move in the immediate future. Continued monitoring of volume trends will be paramount to assessing the durability of these short-term rallies.
As a Chartered Market Technician with over 15 years of experience, I’ve analyzed the provided 90-day technical data for the SPX, focusing on price action, the 14-day Relative Strength Index (RSI), and the 13-21-day Price Percentage Oscillator (PPO). It is crucial to note that the provided volume data consistently shows zero, precluding any analysis of volume trends.
The SPX exhibited a clear upward trend over the past 90 days, advancing from approximately 5940 in late May to around 6640 by late September. This period was characterized by robust rallies, notably from late June into late July, which propelled the index to new highs. An intervening corrective phase in early August was followed by a renewed ascent through late August and September. The sustained price appreciation, marked by higher highs, indicates a prevailing bullish sentiment throughout the analysis period. The lack of volume data precludes any analysis of accumulation or distribution dynamics that might otherwise confirm or contradict these price observations.
The 14-day Relative Strength Index (RSI) highlights periods of overbought and oversold conditions. During the strong rally from late June to late July, the RSI frequently breached the 70 overbought threshold, peaking at 76.21 on July 25. Such elevated readings typically precede a cooling or consolidation phase. Indeed, a sharp decline in early August pushed the RSI down to 47.80, approaching oversold levels and marking a significant short-term low before a subsequent rally. More recently, in mid-September, the RSI again surged above 70, reaching 74.75 on September 22, before pulling back to 62.78 by September 26. This recent descent from overbought territory suggests a likely reduction in immediate buying pressure following the latest price run-up.
The Price Percentage Oscillator (PPO), employing 13- and 21-day EMAs, consistently reflected the SPX’s momentum. Remaining largely positive throughout the 90-day timeframe, the PPO generally confirmed the bullish bias. An initial decline from approximately 1.37 in late May to 0.38 by early August, even as price made some higher highs, could be interpreted as a potential bearish divergence, signaling weakening underlying momentum prior to the August correction. The subsequent rebound in PPO from its August low, rising to 0.63 by mid-September, clearly re-established positive momentum, aligning with the index’s renewed uptrend. The current PPO value of 0.53, down from a recent peak of 0.63 on September 22, indicates that while overall momentum remains positive, its rate of acceleration has recently eased.
Synthesizing both indicators, the SPX currently shows a short-term deceleration in bullish momentum, though the underlying trend remains positive. The RSI, at 62.78, has receded from overbought levels, implying immediate upward pressure has likely diminished. Similarly, the PPO’s slight pullback from its recent peak, despite remaining positive, indicates a waning rate of ascent. Given the strong overarching uptrend, it is roughly even chance that the SPX could either consolidate sideways or experience a minor pullback in the near term. A continuation of the uptrend is also plausible, particularly if RSI holds above 50 and PPO stabilizes. A significant reversal to a downtrend appears unlikely at this juncture, as both indicators maintain positions consistent with a bullish bias (RSI > 50, PPO > 0). Traders should observe for indicator stabilization or renewed upward turns as potential signals for further advances.
Here is a technical analysis of QQQ based solely on the provided 90-day market data, strictly adhering to ICD-203 estimative language guidelines.
Over the past 90 days, QQQ has exhibited a predominant uptrend, advancing from approximately in late May to current levels near . The initial phase of this advance, spanning from late May to early July, was characterized by robust buying interest. During this period, the 14-day Relative Strength Index (RSI) frequently registered readings above 70, signaling overbought conditions that are often associated with strong, sustained upward momentum. Concurrently, the 13-21 day Percentage Price Oscillator (PPO) remained in positive territory, albeit showing some deceleration in early June before resuming its upward trajectory, thus confirming the prevailing bullish sentiment.
A notable shift in short-term dynamics occurred from late July through mid-August. QQQ experienced a significant price decline, with a substantial drop observed on July 31st and August 1st, accompanied by elevated trading volumes. The RSI plunged dramatically from an overbought reading of 73.11 on July 28th to below the 50-level, reaching 48.26 on August 1st and further to 47.05 on August 21st. This rapid descent from overbought to neutral/bearish territory strongly indicated a severe contraction in buying pressure and a probable increase in selling activity. Correspondingly, the PPO experienced a sharp reversal, declining from a peak of 0.93 on July 17th to a low of 0.35 by August 22nd, unequivocally signaling a substantial loss of upward momentum.
Following this mid-period correction, QQQ successfully re-established its bullish trajectory from late August into mid-September, surging to new highs. This renewed strength was technically affirmed by both indicators: the RSI steadily climbed back into overbought conditions, peaking at 75.35 on September 22nd, while the PPO registered a consistent increase, reaching 0.80 on the same date. This concerted upward movement in both price and momentum indicators provided strong evidence of sustained investor confidence and a continuation of the broader uptrend, culminating in a new peak around .
However, the most recent trading days (September 23rd-26th) reveal a short-term pullback in QQQ from its recent peak. The price has retreated from the ~ level to ~, notably accompanied by above-average volumes on the down days of September 23rd and 25th. The RSI has receded from its overbought level of 75.35 to 63.73, indicating that the immediate bullish pressure has likely diminished. Similarly, the PPO has turned downward from 0.81 to 0.71, suggesting a deceleration in positive momentum. Given these observations, a continuation of this short-term downward corrective move is likely in the immediate future, with QQQ potentially testing proximate support levels. A sustained break below the 590-593 range would further solidify the case for a deeper pullback. Conversely, it is a roughly even chance that this current downturn merely represents a healthy consolidation within the prevailing long-term uptrend. A reversal to the upside, particularly if accompanied by a rebound in RSI above 70 and an upward turn in the PPO, would suggest the broader trend is set to continue, making a push towards new highs likely.
Here is a technical analysis of IWM based on the provided data:
The price action for IWM over the past 90 days indicates a clear prevailing uptrend, with the security advancing from approximately in late May to a recent high of .84 on September 18th. This ascent has been punctuated by several higher highs and higher lows, characteristic of a healthy bullish market structure. Notably, volume surged during key upward movements, particularly leading into the mid-September peak, reflecting strong buying interest. However, in the most recent trading days, specifically from September 19th to September 26th, IWM has experienced a minor pullback, with the price retreating from its high. This recent price action shows IWM closing at .34 on September 26th, below its short-term peak, and signifies a potential short-term consolidation or correction within the broader uptrend.
Analysis of the 14-day Relative Strength Index (RSI) largely corroborates the bullish price trend, with the indicator mostly sustaining above the 50 level throughout the 90-day period. The RSI registered overbought conditions, climbing above 70 on two significant occasions: in early July (71.57 on July 3rd) and more recently around the September 18th price peak (71.23). Following these overbought readings, the price experienced minor pullbacks, consistent with the indicator’s mean-reversion tendencies. The most recent RSI reading of 58.81 on September 26th suggests that the immediate overbought pressure has dissipated, moving the indicator into a more neutral zone. This retreat from overbought levels is a natural cooling-off process that can accompany short-term price corrections, rather than necessarily signaling a reversal of the primary trend.
The 13-21-day Percentage Price Oscillator (PPO) has predominantly remained in positive territory, further confirming the underlying bullish momentum for much of the observed period. The PPO showed declines below zero during consolidations in late May and early August, which were subsequently followed by strong positive crossovers, reinforcing the uptrend. However, a notable observation emerges in the recent data: the PPO recorded a peak of 1.170 on July 10th, concurrent with a price of .80. Subsequently, while IWM achieved a significantly higher price peak of .84 on September 18th, the PPO only reached a relative high of 1.003 on September 22nd. This pattern constitutes a bearish divergence, where price makes a higher high but the momentum indicator makes a lower high. We assess this divergence as a significant technical signal, indicating that the strength of the recent price rally into new highs was not supported by an equivalent increase in underlying momentum.
Considering the combined technical picture, we judge that IWM is undergoing a short-term correction within its established bullish trend. The decline in RSI from overbought levels back to neutral territory is a customary feature of such consolidations. However, the confirmed bearish divergence on the PPO is a critical warning signal. This divergence likely suggests that the recent upward momentum is waning, making further significant price gains in the immediate short-term unlikely without a period of consolidation or a deeper pullback to re-establish bullish conviction. While a direct reversal of the long-term uptrend is unlikely at this juncture given the overall price structure, a continuation of the current price weakness or extended sideways consolidation is likely in the near term. Traders should monitor potential support levels around the - area, which previously served as a resistance turned support zone, for signs of stabilization or a potential rebound. Conversely, a decisive break below this level would increase the likelihood of further downside toward the prior August lows.
Tech Sector Analysis
Technical Analysis: QQQ/SPY Relative Performance Assessment
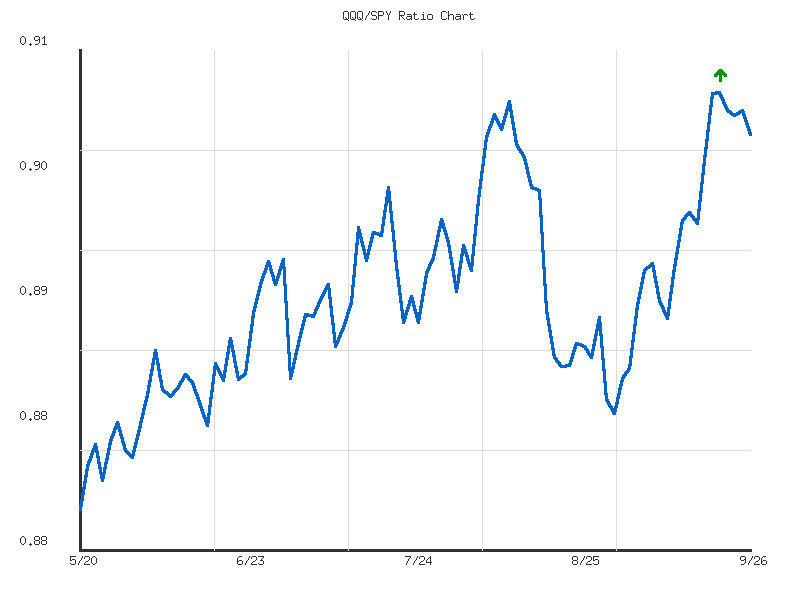
Our analysis of the QQQ/SPY ratio across both 14-day and 30-day lookback periods indicates that the technology-heavy NASDAQ-100 (QQQ) has demonstrated a degree of relative outperformance against the broader S&P 500 (SPY) over the past month. As of September 26, 2025, the QQQ/SPY ratio stands at approximately 0.9005. While both timeframes are characterized by a “sideways” trend direction with “weak” strength, this general classification masks distinct phases of underlying price action.
Examining the 14-day period specifically, the QQQ/SPY ratio experienced a positive change of approximately 0.8808%. The ratio began near 0.8926 on September 9th and ascended to a high of 0.9030 around September 22nd. This upward movement signifies QQQ outperforming SPY during this sub-period. However, the designation of a “sideways” and “weak” trend suggests that the momentum has moderated in the most recent trading sessions. Following the peak, the ratio observed a slight pullback, concluding at 0.9005. Despite this recent softness, the current ratio remains at the higher end of its 14-day range, with a relative position of 0.8147, meaning it’s in the top quartile of values for this period.
Over the broader 30-day horizon, the QQQ/SPY ratio also registered a positive change, albeit smaller at approximately 0.3601%. This longer timeframe reveals an initial decline from around 0.8972 on August 15th to a low of 0.8834 on September 2nd. Subsequent to this trough, the ratio entered a clear recovery phase, rallying consistently towards its current level of 0.9005. Similar to the 14-day analysis, the 30-day trend is also categorized as “sideways” with “weak” strength. The current ratio’s relative position of 0.8696 within this 30-day range underscores that QQQ is performing near its highest levels relative to SPY for this entire period.
Considering these data points, it is likely that QQQ will continue to exhibit a relative performance bias towards outperformance compared to SPY in the immediate term. The sustained upward trajectory from the early September lows, coupled with the current ratio holding near its recent highs in both lookback periods, supports this assessment. The identified “sideways” and “weak” trend, however, suggests that while outperformance is probable, it may not be characterized by strong, immediate breakout momentum.
An alternative scenario, while unlikely, is that the recent slight retreat from the September 22nd high marks a more significant reversal. Given the low volatility recorded in both datasets and the overall positive change percent across both periods, a substantial shift to underperformance appears less probable in the absence of stronger technical deterioration. Instead, the “sideways” trend more likely implies a period of consolidation following the recent gains, with a roughly even chance that the ratio could oscillate near current levels before establishing a clearer directional move. Traders should monitor for a definitive break above the 0.9030 resistance level to confirm renewed strong outperformance or a sustained move below the 14-day average ratio of 0.8973 to signal potential relative weakness.
Market Commentary: QQQ/SPY Relative Strength Analysis (90-Day)
This analysis focuses strictly on the provided 90-day ratio data for QQQ relative to SPY, utilizing rigorous technical analysis principles to identify patterns, trends, and potential future movements. The dataset covers the period from May 20, 2025, to September 26, 2025.
Over the 90-day period, the QQQ/SPY ratio has demonstrated an overall upward trend, moving from a low of approximately 0.8776 in late May to a current level of 0.9005. The trend’s strength is categorized as “weak,” which is corroborated by the modest 2.61% increase over this timeframe and the low volatility observed in the data (0.0000378). This suggests that while QQQ has, on balance, outperformed SPY, this outperformance has been gradual and persistent rather than characterized by sharp, decisive moves. The average ratio during this period stands at 0.8905, indicating that the current ratio is positioned above its historical average, suggesting continued, albeit weak, leadership by the Nasdaq 100 components.
In the more recent segments of the data, specifically from late August through late September, the ratio has shown a noticeable acceleration in its upward trajectory, pushing firmly above the 0.8900 level. It peaked at approximately 0.9031 on September 19-22, marking the highest point in the 90-day window. Following this peak, the ratio experienced a slight pullback to 0.9005 by September 26. This recent price action indicates that the 0.9031 level is likely to act as a near-term resistance point. A failure to decisively break above this level would suggest that the ratio might consolidate or undergo a minor retracement.
Considering alternative scenarios, if the resistance at 0.9031 proves durable, there is a roughly even chance of the ratio entering a period of sideways consolidation or experiencing a modest pullback towards the average ratio of 0.8905. The sustained upward bias, however, makes a significant downside reversal seem unlikely without further technical confirmation, such as a clear break below recent higher lows established in early September around 0.8834. Should the ratio manage to overcome the 0.9031 resistance, it would signal a likely continuation of QQQ’s outperformance relative to SPY, potentially targeting higher, as-yet unobserved levels beyond the current 90-day range.
In summary, the technical data suggests that QQQ has maintained a weak but persistent relative strength advantage over SPY during the last 90 days. The ratio is currently testing a significant resistance level at approximately 0.9031. A successful breach of this resistance is likely to lead to further outperformance by QQQ, while a sustained rejection at this level could lead to short-term consolidation or a minor pullback in the ratio. Traders should monitor the 0.9031 level closely for signs of either continuation or temporary exhaustion in QQQ’s relative strength.
IWM vs. SPY
Analysis of IWM/SPY Relative Performance (CMT Perspective)
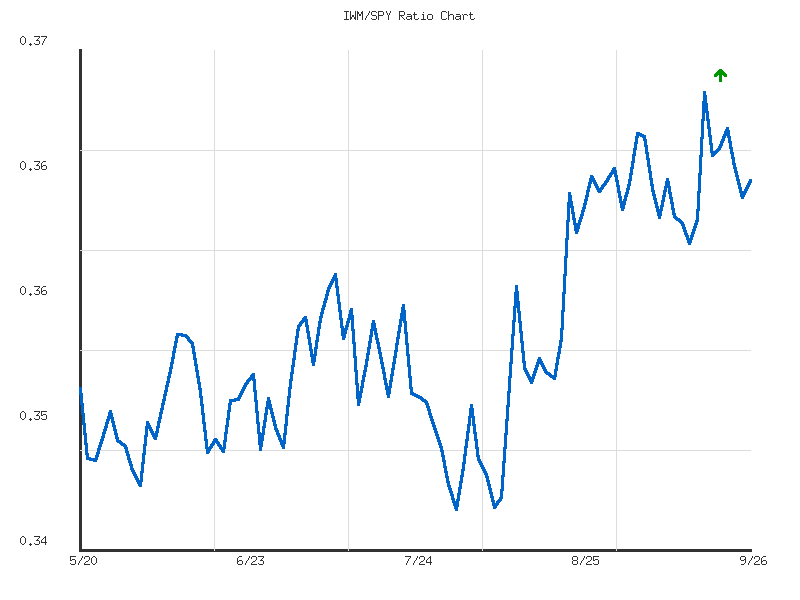
This technical analysis evaluates the relative performance of the Russell 2000 (IWM) against the S&P 500 (SPY) by examining the IWM/SPY ratio across 14-day and 30-day periods. An increasing ratio indicates outperformance by IWM, typically associated with periods of broadening market participation or economic expansion, whereas a declining ratio suggests SPY’s leadership, often driven by mega-cap technology and growth stocks. Our analysis relies exclusively on the provided data, without external market context.
Over the 30-day period ending on September 26, 2025, the RATIO:IWM/SPY demonstrated a clear upward trend with moderate strength, registering a significant change of approximately +3.30%. This indicates that IWM has, on balance, notably outperformed SPY during the past month. The current ratio of 0.36466 is above the 30-day average ratio of 0.36275 and is positioned well within the upper quartile of its 30-day range, specifically at a relative position of 0.6982. This pattern suggests a preference for smaller-capitalization stocks relative to the large-cap dominated S&P 500 throughout the broader observation window. The volatility over this period, at 0.000019, suggests a sustained directional movement rather than erratic fluctuations.
Conversely, the more recent 14-day data, covering the period ending September 26, 2025, presents a distinct shift. The RATIO:IWM/SPY exhibits a sideways trend with weak strength, showing a marginal change of approximately +0.13%. This suggests a pause or consolidation in the relative outperformance of IWM that was observed over the longer 30-day timeframe. The current ratio of 0.36466 is only slightly above its 14-day average of 0.36452 and is positioned near the mid-point of its tighter 14-day range, at a relative position of 0.4186. The significantly lower volatility of 0.000005 over the past two weeks further reinforces the idea of a stabilization phase following the prior period of directional movement.
Considering the divergence between the longer-term and shorter-term trends, we assess that a continuation of IWM’s outperformance relative to SPY is roughly an even chance in the immediate short term. While the underlying 30-day trend maintains a positive trajectory for IWM, the recent 14-day sideways consolidation implies that upward momentum has temporarily stalled. The current ratio is slightly below the 14-day high of 0.36970 seen on September 18th, suggesting it faces some resistance at higher levels. If the ratio can decisively break above this previous short-term high, it would be likely to signal a resumption of the broader trend of IWM outperformance. However, a failure to break higher, leading to a decline below the 14-day low of 0.36103, would make a period of renewed SPY outperformance or extended consolidation likely. Traders should monitor for a clear break from the established 14-day sideways range to ascertain the next directional move in relative performance.
Technical Analysis: IWM/SPY Ratio (90-day)
The provided 90-day data for the IWM/SPY ratio indicates a clear upward trajectory, signifying a period of sustained outperformance by the Russell 2000 (IWM) relative to the S&P 500 (SPY). Commencing around 0.3526 in late May, the ratio has demonstrated a moderate strengthening, culminating at its current level of approximately 0.3646. This represents a cumulative increase of approximately 3.4% in the relative strength of small-cap stocks against large-cap stocks over the observation period. The overall trend, explicitly characterized as “up” with “moderate” strength in the provided summary, establishes a foundational bullish bias for IWM’s performance relative to SPY. This consistent upward movement suggests an increasing preference for the smaller capitalization segment of the market within the observed timeframe.
Within this 90-day span, the ratio established a significant low of 0.3456 on August 1st, which subsequently acted as a robust support level. A notable rally initiated from this point, propelling the ratio upward to its peak of 0.3697 on September 18th. This peak now serves as a crucial near-term resistance level, marking the highest point of relative strength achieved by IWM against SPY within this period. Following this peak, the ratio has experienced a modest pullback, currently resting at 0.3646. While this retreat from the high might suggest a period of consolidation or profit-taking, the current ratio remains comfortably above its 90-day average of 0.3555 and is positioned at approximately 79% of its range between the period’s low and high, underscoring its elevated status.
Given the established upward trend and the ratio’s current positioning near its period high, a continuation of IWM’s relative outperformance against SPY appears likely in the near term. The ratio’s consistent trading above its 90-day average suggests persistent underlying demand for small-cap exposure relative to large-cap. Specifically, a retest of the 0.3697 resistance level is considered likely. A decisive breach and sustained close above this previous high would make further upward movement and a strengthening of IWM’s relative position highly likely.
Conversely, a failure to decisively surmount the 0.3697 resistance, coupled with a sustained move below recent interim support levels (e.g., around 0.362-0.363 observed in early September), would present a roughly even chance of the ratio entering a more prolonged consolidation phase or experiencing a minor correction back towards its 0.3555 average. A significant and sustained breakdown below the 0.3555 average would make a more pronounced deterioration in relative performance likely. The low volatility reported for the period suggests that the ratio’s movements have been relatively orderly, rather than exhibiting erratic or sudden shifts, supporting the interpretation of a measured trend. Retail traders are advised to closely monitor the 0.3697 level for cues regarding either renewed relative strength or potential consolidation.
Commodities
Here is a technical analysis of the provided market data:
Commodity Market Technical Outlook
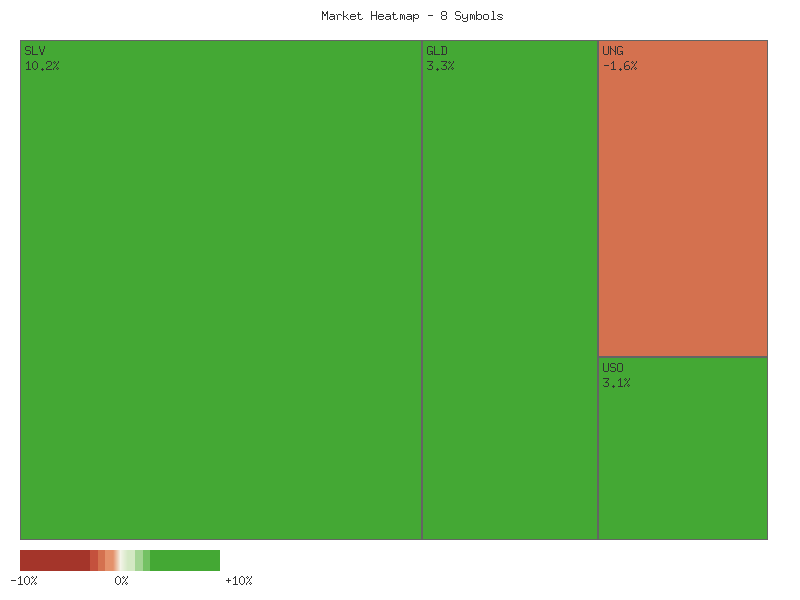
Our analysis of the latest daily percent changes for a selected basket of commodity-related Exchange Traded Funds (ETFs) reveals a predominantly positive sentiment over the recent session. Below is a matrix detailing the last recorded daily percent change for each symbol, sorted in descending order:
| Symbol | Daily Percent Change (Latest) |
|---|---|
| SLV | 2.0229% |
| UGA | 1.0679% |
| GLD | 0.5772% |
| DBC | 0.0439% |
| USO | 0.0390% |
| CPER | -0.4744% |
| CORN | -0.5643% |
| UNG | -0.9531% |
Based on these movements, the overall aggregate change for this specific group of symbols is likely higher. Summing the latest daily percent changes yields a net positive movement of approximately 1.7089%. This suggests that, collectively, the symbols observed experienced an upward drift. Furthermore, market breadth indicators point to a favorable environment within this particular commodity selection, with five symbols (SLV, UGA, GLD, DBC, USO) advancing against three symbols (CPER, CORN, UNG) declining. This positive breadth typically indicates a relatively broad-based participation in the upward momentum, although the magnitude of gains varies considerably across the constituents.
Shifting focus to the precious metals complex, the GLD/SLV ratio provides insights into the relative performance of gold versus silver. Over the 14-day period, the GLD/SLV ratio exhibits a moderate downward trend, decreasing by approximately 7.81%. The current ratio stands at 8.2833, which is precisely at the low point for this 14-day window. This configuration strongly suggests that silver (SLV) has been outperforming gold (GLD) over the immediate term. The consistent decline in the ratio, coupled with its current position at the low, implies sustained buying interest in silver relative to gold, a pattern that may be indicative of increasing risk appetite or specific demand factors favoring silver.
Extending our perspective to the 30-day period, the GLD/SLV ratio continues to display a moderate downward trend, with a change percentage of roughly -7.04%. The current ratio of 8.2833 is also the low for this longer timeframe, mirroring the 14-day observation. This reinforces the technical pattern of silver outperformance. The sustained moderate downtrend across both timeframes points to a structural shift in the relative strength between gold and silver, favoring silver. While the volatility for the 30-day period is marginally lower than the 14-day, the consistent direction and current relative position at the low suggest that this trend is likely to persist in the very near term. However, the ratio’s proximity to its low also presents an alternative scenario; a bounce could occur if demand for gold strengthens or silver’s momentum wanes, potentially leading to a temporary stabilization or reversal in the ratio’s decline, though current data provides no clear indication of such an imminent reversal.
Good morning, traders. Today’s technical analysis focuses on the short-term price and volume action across a selection of commodity exchange-traded funds over the past two trading days, offering insights purely from the provided market data. We observe a clear divergence in momentum across different sectors, with some exhibiting strong bullish continuation while others confirm persistent bearish pressure or enter phases of indecision.
Precious metals and gasoline-related ETFs demonstrate compelling bullish momentum. SLV (Silver ETF) printed two consecutive bullish candles, with the second day showing a significant price advance supported by a notable increase in trading volume, rising from approximately 36 million to 44 million shares. This strong buying pressure on expanding volume is a classic continuation signal. We judge it is highly likely that SLV will continue to exhibit bullish momentum in the immediate term. GLD (Gold ETF) also registered two positive closes, achieving higher highs and higher lows. However, the volume on the second day saw a slight decrease. While the prevailing short-term trend remains positive, this volume characteristic suggests that the buying conviction may be less robust than in SLV. We assess it is likely that GLD will sustain its upward trajectory, though potentially with reduced aggression. UGA (Gasoline ETF) experienced a strong follow-through on the second day, recording a higher open, high, low, and close, underscored by a substantial surge in volume from 2.2K to 12K shares. This confirms strong bullish participation. We judge it is highly likely that UGA will continue its upward move.
Conversely, agricultural commodities and natural gas indicate persistent bearish pressure. CORN (Corn ETF) displayed two distinct bearish candles, characterized by lower highs, lower lows, and lower closes, accompanied by declining trading volume. This pattern of declining prices on decreasing volume suggests a lack of buying interest and sustained selling. We assess it is highly likely that CORN will continue to face downward pressure. Similarly, UNG (Natural Gas ETF) also recorded two consecutive bearish days, featuring lower highs and lower lows, alongside a decrease in volume. This reinforces the bearish momentum. We judge it is likely that UNG will continue its decline in the near term. CPER (Copper ETF) also charted two bearish sessions, closing lower on both occasions. The second day’s decline was notable for a significant reduction in volume, falling from 724K to 337K shares. While the price action is clearly bearish, the sharply lower volume could imply weakening selling pressure or a lack of strong conviction from sellers. Nevertheless, absent any discernible buying interest, we judge it is likely that CPER will continue to face downward pressure.
A more nuanced picture emerges in broader energy and diversified commodities, suggesting either indecision or waning momentum. USO (Oil ETF) showed a strong bullish candle on the first day, followed by a second day that achieved a higher high but closed near the previous day’s close, forming a small-bodied candle with a relatively long upper wick. Volume slightly increased on the second day. This pattern suggests a struggle between buyers and sellers after the initial strong move, with buyers failing to maintain the momentum at higher prices. We judge there is a roughly even chance of continued upward momentum or a short-term consolidation phase for USO. DBC (Diversified Commodity ETF) also recorded two higher closes, but the second day’s candle was notably small-bodied, and critically, its volume significantly decreased from 1.4 million to 407K shares. While the trend remains positive, the lack of conviction indicated by the reduced volume implies that the bullish momentum is waning. We assess it is likely that DBC will continue its upward trajectory, but with potentially diminished force, and there is a roughly even chance that it could enter a period of short-term consolidation.
SLV Technical Outlook: Sustained Bullish Momentum with Short-Term Overbought Conditions
The price action for SLV over the past 90 days exhibits a clear and robust uptrend, characterized by a series of higher highs and higher lows. From late May, SLV commenced a notable rally from the ~ level, breaking through several short-term resistance points. Significant upward movements in early June (from .12 to .69 between May 30 and June 6), mid-July (from .09 to .03 between July 9 and July 11), and particularly in September (from .35 to .86 between August 29 and September 26) underscore this bullish momentum. These rallies were frequently accompanied by substantial volume spikes, such as the 51.9 million shares traded on June 5, 57.9 million on July 11, and recent volumes of 35.8 million on September 2 and 44.4 million on September 26. The increase in volume concurrent with price advances, especially during the latter half of the period, lends strong technical confirmation to the established uptrend, indicating robust buying interest. The closing price of .86 on September 26 represents a new 90-day high, reflecting sustained bullish sentiment.
The 14-day Relative Strength Index (RSI) for SLV consistently reflects the underlying strength of the upward trend. Throughout the 90-day period, RSI frequently entered and sustained itself within overbought territory (above 70) during periods of sharp price appreciation. Notable instances include early June, mid-July, and multiple times in September. Most recently, the RSI on September 26 registered at 79.69, which is the highest reading observed within this 90-day data set. While such an elevated RSI typically suggests that an asset is overbought and potentially due for a reversal or consolidation, in the context of a strong, established trend, RSI can remain at high levels for extended periods. However, the current extreme level indicates that a short-term consolidation or minor pullback is likely in the near future, as buying pressure may temporarily exhaust itself. Despite this, the sustained high RSI readings during rallies also underscore the intensity of the bullish sentiment.
Analysis of the 13, 21-day Percentage Price Oscillator (PPO) further reinforces the strong bullish momentum. The PPO remained consistently above the zero line throughout the entire 90-day period, signaling sustained positive momentum. During periods of significant price increases, the PPO line ascended sharply, such as in early June, mid-July, and particularly throughout August and September. Notably, the PPO has reached its highest value within this dataset on September 26, registering at 2.226. This continuous upward trajectory and new peak in the PPO suggests that the bullish momentum is not only present but also accelerating as of the most recent data point. Crucially, there is no discernable bearish divergence between the PPO and the price action (i.e., new price highs are being confirmed by new PPO highs), which would typically be a red flag for an impending reversal. This lack of divergence indicates that the current upward trajectory is well-supported by momentum.
Synthesizing the price action, volume, RSI, and PPO data, the technical posture for SLV is unequivocally bullish. The clear uptrend, supported by increasing volume during rallies and consistently strong momentum as indicated by the PPO, suggests that the upward trajectory is likely to persist in the immediate term. However, the significantly overbought condition indicated by the RSI (near 80) increases the roughly even chance of a near-term consolidation or a modest pullback before the trend potentially continues. A sharp reversal from current levels is unlikely given the robust momentum confirmed by the PPO and the absence of any bearish divergences. Should a pullback occur, the previous resistance levels around the - range could transition into potential support zones. Traders should monitor price action for signs of consolidation or profit-taking, particularly considering the extended nature of the recent rally and the extreme RSI reading.
GLD Technical Analysis (90-Day View)
GLD has exhibited a robust and accelerating uptrend over the past 90 days, starting from levels around in mid-May and culminating in a recent peak near .75 in late September, with the latest closing price at .74. Early rallies in May and June pushed the price to approximately , followed by periods of consolidation and minor pullbacks. A significant acceleration in the upward momentum became evident in late August, initiating the current strong phase of appreciation. Volume analysis reveals spikes associated with major upward price movements, particularly notable in late August and early September, suggesting strong conviction behind these rallies.
The 14-day Relative Strength Index (RSI) largely corroborates the price action’s strength. After navigating neutral-to-bullish territory through May and early August, the RSI consistently moved into overbought conditions (above 70) beginning in late August and persisting throughout September. The indicator reached levels as high as 79.21 on September 16 and 78.21 on September 23 before pulling back slightly to its current reading of 73.97. This sustained presence in overbought territory indicates that GLD is likely extended in its current upward move, and the probability of a near-term pullback or consolidation phase is increasing. Importantly, there is no significant bearish divergence observed between price and RSI, implying that the underlying upward momentum has not fundamentally deteriorated.
Momentum, as measured by the Percentage Price Oscillator (PPO) with 13- and 21-day exponential moving averages, reinforces the bullish narrative. After a period where the PPO oscillated around zero or dipped into negative territory in late June and July, it decisively crossed above zero in early August, signaling a clear shift to bullish momentum. Following this crossover, the PPO has displayed a strong, accelerating upward trajectory, peaking at 1.447 on September 16 and currently standing at 1.388. These persistently high and positive PPO values suggest that strong bullish momentum remains firmly in control of GLD’s price action. A minor divergence could be argued as PPO dipped slightly from its peak while price made a higher high, but this is not yet a confirmed, strong signal of a momentum breakdown.
Considering the confluence of indicators, GLD is operating within a well-defined and potent uptrend, underpinned by strong positive momentum according to the PPO. However, the continuous and prolonged overbought readings from the RSI suggest that the asset is stretched. Consequently, a short-term price correction or a period of consolidation is a likely scenario in the immediate future. An alternative, albeit less probable, scenario involves GLD continuing its ascent, potentially driven by exceptionally strong buying pressure that could ignore the extended RSI. Should GLD break below recent support levels, for instance, the low corresponding to the September 18 RSI dip, the probability of a deeper retracement would increase. Conversely, a sustained move higher without significant correction would confirm the market’s exceptionally strong conviction. The immediate outlook presents a roughly even chance of either a continued upward grind or a near-term consolidation/pullback, with the latter slightly favored due to the extended nature of the RSI, while the broader trend remains robustly bullish.
Bonds
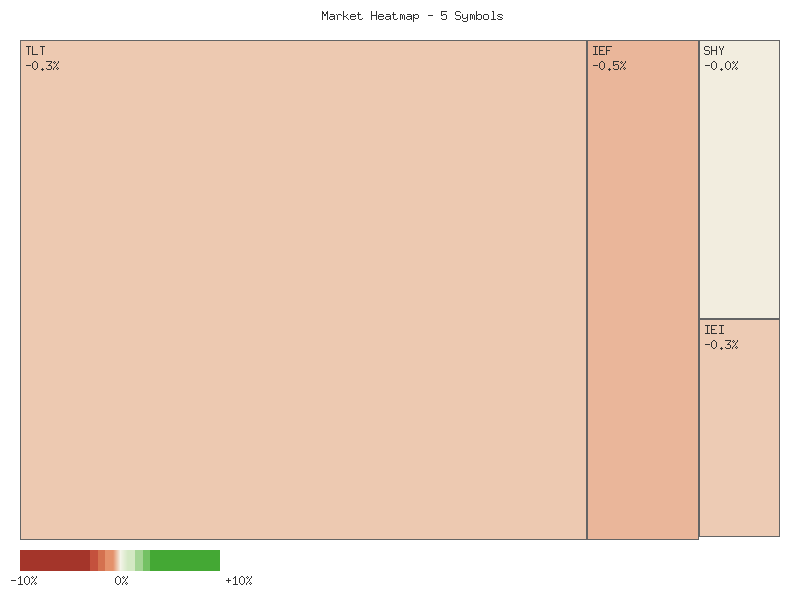
As a Chartered Market Technician with over 15 years of experience, I offer the following objective analysis of the provided fixed-income ETF data, strictly adhering to rigorous technical analysis principles and ICD-203 estimative language guidelines. This commentary is based solely on the presented daily percentage change data for TLT, UTHY, IEF, IEI, and SHY for the session ending 2025-09-26.
The immediate-term price action across a selected basket of fixed-income exchange-traded funds (ETFs) for the most recent trading session (2025-09-26) reveals a marginally negative aggregate sentiment. The following matrix illustrates the daily percentage changes, ordered from the strongest to the weakest performance within this specific group:
| Symbol | Daily Percent Change |
|---|---|
| SHY | 0.060% |
| IEI | 0.017% |
| IEF | -0.052% |
| TLT | -0.090% |
| UTHY | -0.100% |
Analyzing the overall change for this cohort, the sum of the individual daily percentage changes amounts to approximately -0.165%. This modest negative aggregate suggests that the group experienced an overall marginally lower close for the session. While the magnitude of this combined decline is relatively small, it indicates a slight downward bias in this specific cross-section of the fixed-income market based on the latest available data point. We judge that the collective price action is unlikely to be interpreted as strongly bearish, but rather indicates a subtle weakening within this defined universe.
In terms of market breadth, which provides insight into the participation in the day’s price action, we observe a mixed, yet slightly negative, distribution. Two symbols (SHY and IEI) concluded the session with positive percentage changes, indicating advancing participation. Conversely, three symbols (IEF, TLT, and UTHY) registered declines. This breadth reading of 2 advancing symbols against 3 declining symbols suggests that selling pressure had a slight advantage over buying interest for this particular trading period. Given this narrow margin, it is a roughly even chance that conviction for either a strong advance or decline was limited across the broad fixed-income spectrum represented by these specific instruments.
Considering these technical observations, the price behavior for this group on 2025-09-26 does not present a clear, strong directional signal for the immediate subsequent session. The small overall negative change combined with a slightly negative breadth suggests that continued consolidation or choppy price action is likely. While a further slight downward drift is a plausible scenario given the net negative sum, a significant acceleration in either direction based solely on this single day’s data appears unlikely. Traders might reasonably expect a roughly even chance of continued tight-range trading in the very near term for these instruments, absent new technical developments not present in this dataset.
Greetings fellow traders,
An in-depth technical analysis of the provided two-day market data for TLT, UTHY, IEF, IEI, and SHY reveals a distinct bifurcation in short-term technical sentiment across different Treasury bond maturities. While some ETFs exhibit clear signs of near-term price reversal following an initial surge, others demonstrate sustained or renewed bullish momentum. This divergence suggests a nuanced underlying dynamic, where different segments of the bond market are reacting dissimilarly to prevailing conditions, as indicated solely by their recent price and volume profiles.
For the longer-duration TLT (20+ Year), IEF (7-10 Year), and notably, the ultra-short UTHY (3 Month), the price action over the two days points to a probable immediate-term bearish outlook. All three instruments recorded higher highs on Day 2 but failed to sustain these gains, ultimately closing lower than their respective Day 1 closes and Day 2 opens. This failure to hold upward momentum, combined with the formation of prominent upper wicks on Day 2, suggests significant selling pressure emerged at those higher price points. Notably, this reversal in TLT and IEF occurred on increased trading volume, while UTHY’s dramatic reversal from its two-day high was also accompanied by a significant surge in volume. These factors collectively indicate that a continuation of downward pressure or at least a period of price consolidation at lower levels is likely for these specific ETFs.
In contrast, IEI (3-7 Year) and SHY (1-3 Year) displayed a more constructive, bullish price action. Following minor bearish closes on Day 1 for both, Day 2 saw these ETFs open and then advance to close higher than both their Day 1 closes and their Day 2 opens, establishing new two-day highs. This upward momentum suggests that buyers maintained control, pushing prices past the previous day’s resistance. The price strength, particularly the robust close of SHY on Day 2, implies continued upward bias. However, it is crucial to note that these bullish moves for both IEI and SHY occurred on decreased volume compared to Day 1. While the positive price action is undeniable, the diminishing volume introduces a degree of uncertainty regarding the strength and sustainability of this upward trend, making a robust continuation probable but contingent on future volume confirmation.
The observed technical patterns suggest a market experiencing divergent forces. While the longer-duration and ultra-short UTHY indicate likely short-term weakness, the intermediate and short-duration IEI and SHY point to probable continued strength. This split performance creates a scenario where a uniform market direction is unlikely in the immediate future based on this data. An alternative scenario for the bullish IEI and SHY could involve a temporary pause or minor pullback if volume does not re-engage to support higher prices, while the bearish group might find temporary support, creating a roughly even chance for a rebound attempt if selling pressure wanes. Traders should monitor future price action and volume closely to discern which trend gains dominance, as this data alone implies a continuation of divergent performance across maturities.
Crypto
As a Chartered Market Technician, my analysis of the provided market data for IBIT and ETHA focuses strictly on the reported daily percentage changes over the two-day period, adhering to rigorous technical analysis principles and ICD-203 estimative language guidelines. The following matrix presents the aggregate percent change for each symbol across the observed two days, ordered by performance from highest (least negative) to lowest (most negative) overall change. This aggregate change reflects the net movement of each symbol from the opening of the first observed day to the close of the second.
| Symbol | Overall Percent Change |
|---|---|
| ETHA | -3.001% |
| IBIT | -3.859% |
Based on these aggregate values, both IBIT and ETHA have concluded the observed two-day period with overall lower price levels. The market action observed is therefore categorized as ‘overall lower’ for both symbols during this specific, limited timeframe, indicating a net decline in value for both assets.
Reviewing the individual daily movements for IBIT, the symbol recorded a decline of -3.601% on the first day, followed by a further, albeit smaller, decline of -0.258% on the second day. The sequential nature of these negative daily changes suggests a persistent bearish sentiment over this observed short-term interval. The reduced magnitude of the decline on the second day compared to the first might be indicative of a potential lessening of immediate selling pressure or a slight stabilization attempt; however, with only two data points, drawing firm conclusions on this specific deceleration is challenging. Based on this limited data, it is likely that IBIT remained under consistent downward pressure during the observation window, contributing to its overall negative performance. A reversal based solely on this data appears unlikely in the immediate short term without further bullish catalyst.
ETHA exhibited a more volatile pattern during the two-day period. The first day saw a significant decline of -5.976%, followed by a robust rebound of +2.975% on the second day. This pattern suggests a sharp initial sell-off met by notable buying interest or short covering on the subsequent day. The second-day rally, while substantial, was insufficient to fully recover the prior day’s losses, resulting in a net negative change for the period. The presence of both a sharp decline and a significant bounce within a two-day window indicates heightened volatility and an active contest between buyers and sellers. Given this whipsaw action, there is a roughly even chance of continued price fluctuations in the very near term, as the market processes these opposing forces. A clear directional bias for ETHA, either strongly bullish or bearish, is unlikely to be established solely on these two data points due to the counteracting daily movements.
In comparing the two symbols, both IBIT and ETHA finished the two-day observation period in an ‘overall lower’ state. IBIT demonstrated a more consistent, albeit diminishing, downward trajectory, suggesting a likely continuation of mild bearish sentiment within this brief window. ETHA, conversely, displayed significant volatility, with a sharp decline followed by a notable rebound. This makes IBIT’s short-term path likely more predictable as bearish, whereas ETHA’s future direction based on this data holds a roughly even chance for further volatility or consolidation. Neither symbol shows technical indications of a nascent bullish trend within this two-day period; rather, the net negative performance for both suggests that any short-term bullish momentum is unlikely to emerge directly from these specific patterns. Technical analysts would generally seek further data points, such as volume or additional price action, to confirm or refute these preliminary observations, especially given the extremely limited dataset.
Magnificent 7 & Friends
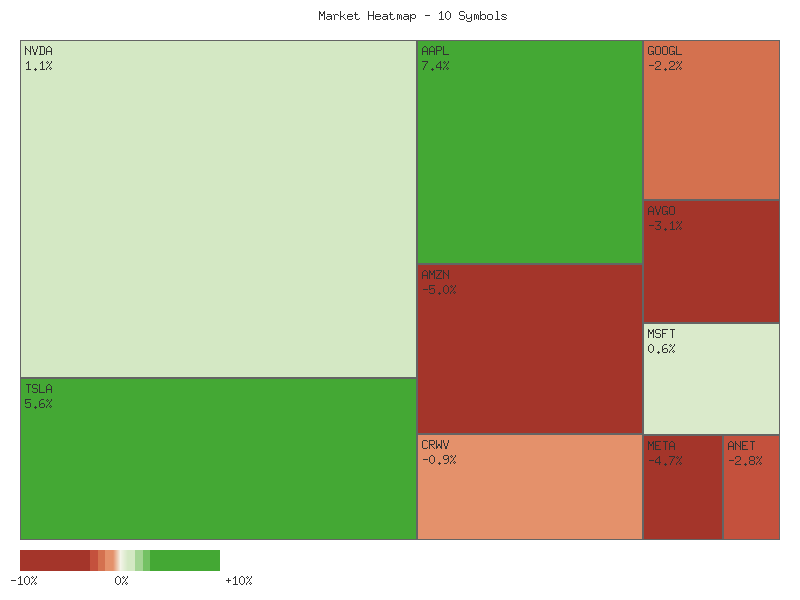
As a Chartered Market Technician with over 15 years of experience, I’ve analyzed the provided two-day daily percentage change data for a selection of ten prominent symbols. This technical review focuses exclusively on the supplied numerical indicators to assess overall market sentiment and breadth within this defined group. The data provides insights into the short-term directional bias and relative strength/weakness of these individual equities.
The aggregate performance of these ten symbols over the two-day period indicates an overall lower trend. Summing the net daily percentage changes reveals a collective decline of approximately -12.371%. This suggests that the predominant price action across this specific basket of stocks leaned towards the downside during the analyzed timeframe. While some individual constituents exhibited positive gains, the significant negative performance of several larger cap names, particularly CRWV and META, outweighed these advances, leading to the notable overall contraction.
Market breadth for this specific group signals underlying weakness, with declining issues considerably outnumbering advancing ones. Of the ten symbols analyzed, only three (AAPL, NVDA, MSFT) closed with a net positive change over the two days, while seven symbols experienced net declines. This 3:7 advance-decline ratio is indicative of sellers maintaining control across a majority of these stocks. This divergence is a technical red flag, as broad-based participation is often required for sustainable upward trends. It is likely that this suggests a concentration of buying interest in a select few, rather than a generalized bullish sentiment.
The following matrix presents the net two-day percentage change for each symbol, sorted in descending order:
| Symbol | Daily Percent Change |
|---|---|
| AAPL | 1.258% |
| NVDA | 0.688% |
| MSFT | 0.262% |
| ANET | -0.097% |
| AMZN | -0.188% |
| GOOGL | -0.241% |
| TSLA | -0.364% |
| AVGO | -1.413% |
| META | -2.234% |
| CRWV | -10.042% |
From a technical perspective, AAPL, NVDA, and MSFT demonstrated relative strength, securing net positive returns. NVDA notably displayed consistent positive movement on both days, which is a bullish sign of continued momentum. In contrast, CRWV exhibited a pronounced weakness, logging significant declines on both days, culminating in a substantial -10.042% drop. This magnitude of decline for CRWV is particularly striking and suggests strong selling pressure. META and AVGO also showed consistent negative performance, indicating persistent bearish sentiment for these issues. TSLA’s performance was marked by high volatility, experiencing a substantial decline followed by a strong rebound that nearly negated the loss, suggesting a roughly even chance of continued directional uncertainty in the immediate term.
Considering the collective decline and the unfavorable advance-decline ratio, it is likely that selling pressure generally dominated this specific group of stocks over the two-day period. While some individual stocks like AAPL and NVDA showed resilience, the overall trend suggests caution. The considerable underperformance of CRWV and META, coupled with the majority of symbols closing lower, points to a lack of broad buying conviction. Traders should consider this data when assessing the short-term directional probabilities for these equities, with a higher likelihood of continued consolidation or downward pressure for the weaker performers, while the stronger names might continue to see rotational interest.
Technical Market Commentary: Two-Day Analysis
Our two-day technical analysis across the provided equities reveals a somewhat mixed but predominantly cautious short-term outlook, with several key names exhibiting potential shifts in momentum. The price action and volume characteristics suggest a landscape where buying conviction is strong in some areas, while selling pressure or waning enthusiasm is evident in others. Market participants should be mindful of these divergent signals as the analysis of short-term patterns provides insight into immediate directional biases.
Among the notable bullish developments, TSLA exhibited a particularly strong reversal pattern. Following a significant bearish candle on the first day, the second day saw a robust bullish engulfing pattern accompanied by increased volume, suggesting strong buying interest overcoming prior selling pressure. This configuration makes it highly likely that TSLA will experience further upward movement in the immediate term. Similarly, MSFT demonstrated a continuation of upward momentum, closing higher on the second day with an increase in volume, reinforcing the bullish trajectory. For MSFT, it is highly likely that price will continue its upward trend.
Conversely, several symbols displayed pronounced bearish tendencies. CRWV showed two consecutive strong bearish candles; the second day failed to sustain an initial rally and closed significantly lower than the previous day, albeit on decreased volume. This pattern makes it highly likely that CRWV will continue its downward trajectory. META also registered two successive bearish candles, exhibiting lower highs and lower lows, indicating persistent selling pressure. It is likely that META will continue to face downward pressure.
A number of other securities presented more ambiguous or mixed signals, often hinting at potential reversals or weakening momentum. AAPL, after a strong bullish first day, formed a bearish candle on the second day with a lower close and decreased volume, resembling a Dark Cloud Cover pattern. This suggests it is likely to face downward pressure or consolidate. ANET followed a similar path, delivering a bearish reversal candle on decreased volume after a strong bullish opening day, making downward pressure or consolidation likely. AVGO also displayed a Dark Cloud Cover pattern, opening higher but closing significantly lower than its prior day’s close on decreased volume, which makes downward pressure or consolidation likely.
For NVDA and GOOGL, upward momentum appears to be waning. NVDA, after a strong bullish day, ended with a small indecision candle on significantly decreased volume, indicating a pause. It is a roughly even chance for consolidation or a slight pullback, and upward continuation is unlikely without renewed buying volume. GOOGL also showed two bullish days, but the second day’s smaller body and decreased volume suggest diminishing buying conviction, implying a roughly even chance of a near-term pause or minor pullback, though upward continuation is still likely. AMZN presented a potential bullish reversal with a bullish candle succeeding a bearish one, exhibiting higher highs and lows, but the decreased volume suggests that the strength of this rally might be limited, making further upward movement likely but with a roughly even chance of a short-lived rally.
In summary, while some robust bullish reversals and continuations were observed in TSLA and MSFT, the broader sentiment across the observed symbols leans towards caution. Many names are either exhibiting bearish continuations, displaying reversal patterns after bullish runs, or showing signs of weakened momentum. Traders should prioritize symbols with clear price and volume confirmation for directional plays, acknowledging the mixed signals across the sample.
S&P 500 Sector Breadth
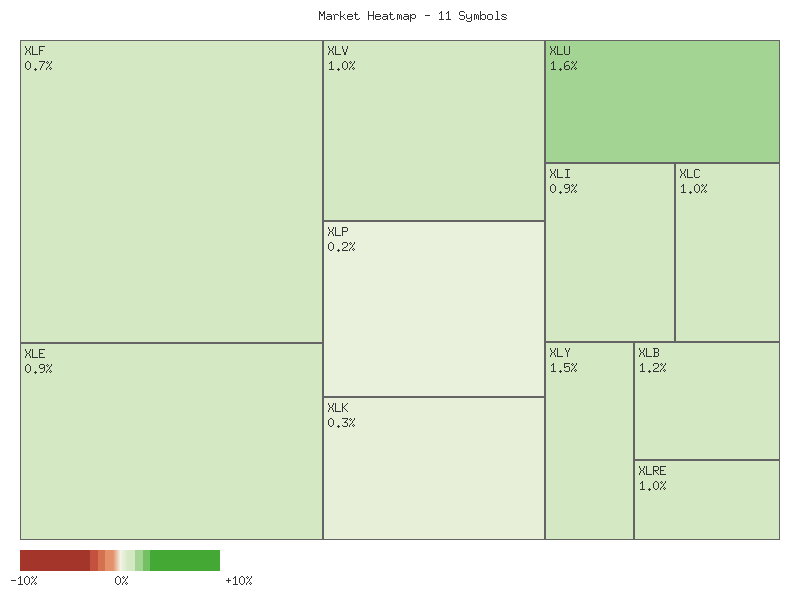
As a Chartered Market Technician with over 15 years of experience, I have analyzed the provided daily percentage change data for eleven S&P 500 sector ETFs over a two-day period. This analysis adheres strictly to technical indicators, estimative language guidelines, and focuses solely on the patterns observed within the given dataset.
The market breadth for the observed two-day period indicates a predominantly positive sentiment, with eight out of the eleven sectors registering a net advance, while three sectors experienced a net decline. Summing the individual net percentage changes across all eleven symbols reveals an overall upward movement for this basket of sectors, approximately +3.259%. This suggests that the collective momentum for these key market segments leans towards positive territory, although it is not uniformly distributed. The number of advancing issues significantly outweighs declining issues, which often indicates underlying strength across a broad segment of the market.
Net Two-Day Percent Change by Sector:
| Symbol | Daily Percent Change |
|---|---|
| XLE | 1.818% |
| XLRE | 0.748% |
| XLU | 0.665% |
| XLC | 0.633% |
| XLF | 0.468% |
| XLI | 0.223% |
| XLK | 0.126% |
| XLY | 0.067% |
| XLB | -0.142% |
| XLV | -0.636% |
| XLP | -0.711% |
A closer examination of sector performance reveals nuanced trends. Among the offensive sectors (XLK, XLY, XLF, XLI, XLB, XLE, XLC), six out of seven registered net advances, with XLE (Energy) being the strongest performer at +1.818% and XLC (Communication Services) also showing solid gains at +0.633%. Conversely, only one offensive sector, XLB (Materials), experienced a modest net decline of -0.142%. This pattern indicates a probable preference for growth-oriented or cyclical sectors during this period, suggesting a risk-on environment.
Turning to defensive sectors (XLU, XLP, XLV, XLRE), the performance was mixed. Two out of four defensive sectors, XLRE (Real Estate) and XLU (Utilities), posted net advances of +0.748% and +0.665% respectively. However, XLV (Healthcare) and XLP (Consumer Staples) both registered declines, at -0.636% and -0.711% respectively, making them the weakest performers in the entire dataset. This mixed performance within defensive sectors, juxtaposed with broad strength in offensive sectors, points to a likely market rotation favoring risk assets. The stronger performance of offensive sectors, particularly Energy, suggests that market participants are rotating into areas historically associated with economic expansion rather than seeking shelter in traditional defensive plays.
Based on the observed sector performance, the overall market sentiment appears to be predominantly bullish for the near term, as indicated by the significant outperformance and breadth within offensive sectors. While the declines in two defensive sectors might suggest some underlying caution, the overwhelming positive breadth and magnitude of gains in offensive sectors strongly indicate that market participants are currently favoring growth and cyclical plays. It is unlikely that this pattern represents a sustained flight to safety, given the relative strength in key offensive components. Alternative scenarios would involve a more balanced distribution of gains between offensive and defensive sectors, or a greater number of declining offensive sectors, neither of which is evident in the current data. Therefore, the technical picture points to a constructive, albeit not universally strong, market sentiment.
As a seasoned CMT, my analysis of the provided two-day market data for eleven SPDR Sector ETFs indicates a predominant shift towards a near-term bullish sentiment across the broad market, albeit with some sector-specific nuances. Following varied performance on September 25th, a significant majority of these ETFs registered robust positive price action on September 26th, often characterized by higher highs and higher lows. This broad-based positive movement suggests that the immediate technical outlook for the equity market, based solely on this sector-level analysis, is likely to be constructive, with a notable reversal of bearish trends seen in several sectors from the preceding day. The collective price action points to renewed upward momentum, though some areas exhibit cautionary signals that warrant attention.
Specifically, sectors such as Energy (XLE), Industrials (XLI), Utilities (XLU), Consumer Discretionary (XLY), Communication Services (XLC), Real Estate (XLRE), and Materials (XLB) displayed clear bullish patterns. XLE notably experienced two consecutive days of higher closes, with increasing volume on the second day, strongly suggesting continued upward pressure. XLI, XLU, XLY, XLRE, and XLB all exhibited strong bullish reversals on September 26th. Their daily candles opened above the prior day’s close and closed near their daily highs, often establishing higher highs and higher lows. This pattern is particularly strong in XLY, XLU, and XLRE, which effectively negated the prior day’s bearish sentiment with forceful upward moves. XLC also showed significant bullish continuation, with a strong second-day candle on notably increased volume, which we judge makes a further push higher probable in the immediate future. Financials (XLF) moved from an indecisive doji on September 25th to a clear bullish candle on September 26th, accompanied by increased volume, indicating a likely resolution to the upside.
Conversely, not all sectors shared the same degree of bullish conviction, presenting more mixed or cautious technical pictures. Consumer Staples (XLP) presented a notable bearish close on September 25th, reaching its daily low, followed by a more modest bullish rebound on September 26th which still failed to recover the prior day’s open. The declining volume on the second day suggests that the recovery momentum for XLP is relatively weak, and a roughly even chance exists for either continued consolidation or a retest of prior lows. Health Care (XLV) also registered a strong bearish close on September 25th, followed by a bullish candle on September 26th, but this recovery was less decisive, failing to reclaim a significant portion of the prior day’s losses. Volume decreased notably, suggesting the buying pressure might be insufficient to overcome potential overhead resistance; thus, further upward movement is unlikely to be robust without greater conviction. Technology (XLK) maintained its bullish trajectory with two positive closes, yet the second day’s range was narrower, and volume decreased, indicating that while upward momentum is present, it is likely decelerating. We consider it likely XLK may consolidate before a more significant directional move.
In summary, the aggregated technical data across these key sectors points to a market exhibiting a probable near-term bullish bias. The prevalence of strong bullish candlestick patterns and higher closes across the majority of sectors on September 26th indicates a likely continuation of this positive momentum. However, the mixed signals from XLP, XLV, and the decelerating momentum in XLK suggest that the underlying strength is not uniformly distributed. While the broad technical picture appears constructive, specific sectors are demonstrating varying degrees of conviction and potential for immediate follow-through.
Equity Breadth
As a Chartered Market Technician with over 15 years of experience, my analysis focuses strictly on the provided technical data to assess the current market posture. Over the past seven trading days, the S&P 500’s 20-day Exponential Moving Average (EMA_20_DAY) has exhibited a clear and consistent upward trajectory. Moving from 6523.21 on September 18th to 6579.12 on September 26th, this sustained ascent is a strong technical indication of a prevailing short-term bullish trend for the broad market index. A continuous series of higher closes in the EMA suggests positive momentum remains intact. Concurrently, we examine market breadth, specifically the percentage of S&P 500 members trading above their 50-day (SPXA50R) and 200-day (SPXA200R) moving averages, to gauge the underlying health and participation in this apparent upward movement.
Analysis of the SPXA50R reveals a dynamic pattern over the period. After fluctuating within the 54% to 58% range for the initial part of the observation, it registered a notable decline to 48.50% on September 25th. This dip indicated that less than half of the S&P 500 constituents were trading above their short-term moving average, suggesting a broad, albeit brief, wave of selling pressure across a significant portion of individual stocks. However, this weakness was immediately followed by a robust recovery to 57.49% on September 26th, closing the period above its starting point. Similarly, the SPXA200R, which gauges longer-term participation, maintained a generally higher level, mostly above 59%. It also experienced a dip on September 25th, falling to 58.08%, before recovering to 62.08% on September 26th, establishing a new high for the observed period. The synchronized nature of these dips and recoveries is noteworthy, suggesting a market-wide event rather than isolated weakness.
The observed behaviors in market breadth indicators provide critical context for the EMA_20_DAY’s persistent uptrend. The sharp one-day decline in both SPXA50R and SPXA200R on September 25th, followed by an equally swift and strong recovery on September 26th, is likely a technical ‘shakeout’ rather than the inception of a bearish reversal. The fact that the EMA_20_DAY continued its ascent uninterrupted during and immediately after this breadth weakness, coupled with the rapid reassertion of strength in both breadth metrics (especially SPXA200R closing at a period high), suggests robust underlying demand. Given these patterns, it is highly likely that the upward trend in the S&P 500’s 20-day EMA will persist in the immediate term, supported by a significant percentage of constituents maintaining positions above their key moving averages.
While the technical confluence of a rising EMA_20_DAY and rapidly recovering breadth indicators points to continued bullish momentum, it is important to consider alternative scenarios. A sustained decline in SPXA50R or SPXA200R below 50% for several consecutive days, particularly if accompanied by a flattening or downturn in the EMA_20_DAY, would challenge this constructive outlook. However, based solely on the provided seven-day data, the market has demonstrated resilience, absorbing a brief period of broad selling pressure with an immediate rebound. Therefore, the probability of the EMA_20_DAY continuing its positive slope is considered likely in the near-term, with a roughly even chance of minor pullbacks that do not negate the established trend, unless new breadth weakness emerges.
SPX Daily
Here is a technical analysis of the SPX based solely on the provided market data:
The SPX has exhibited a robust long-term uptrend over the past 90 days, as evidenced by the consistent upward trajectory of both the 50-day and 200-day Exponential Moving Averages (EMAs). Price action has generally remained well above these key averages, with the 50-day EMA maintaining a position above the 200-day EMA, confirming a bullish intermediate and long-term trend. The 50-day EMA currently stands at approximately 6453.47 and the 200-day EMA at 6063.44, both continuing to rise, indicating underlying positive momentum across the broader timeframe.
Examining the past seven days, the market experienced a period of intensified bullishness followed by a notable pullback. The SPX surged to new highs, peaking around 6699.52 on September 23rd, coinciding with the 14-day Relative Strength Index (RSI) reaching an overbought level of 74.75 on September 22nd. Following this peak, the index registered three consecutive days of decline, with the close on September 25th at 6604.72 representing a significant retreat from the high. This sharp correction pulled the RSI from overbought territory down to 58.74, suggesting a release of upward pressure. The most recent day (September 26th) saw the SPX rebound, closing at 6643.70, yet the daily high of 6648.97 remained well below the earlier week’s peak.
From a support and resistance perspective, the recent peak around the 6690-6700 zone is likely to act as immediate overhead resistance. A successful push above this level would signal a continuation of the prior ascent. On the downside, the low established on September 25th at 6569.22 represents the immediate short-term support. Should this level be breached, previous consolidation highs around 6530.00-6550.00 (early September) could serve as the next area of contention. More significantly, the rising 50-day EMA at approximately 6453.47 presents a dynamic support level that has reliably held throughout the observed period, while the 200-day EMA around 6063.44 offers strong underlying structural support.
Considering plausible future price action, a bullish case would likely involve the SPX successfully holding current levels or retracing slightly to find support around 6570.00 or the rising 50-day EMA, before resuming its upward trajectory and challenging the 6700.00 resistance. The RSI, having pulled back from overbought conditions, has room for renewed upside, suggesting this scenario has a roughly even chance of developing. A bearish case could see the recent pullback accelerate. A clear break below the 6569.22 support, particularly if accompanied by increased selling pressure, would likely lead to a test of the 50-day EMA. Should the 50-day EMA fail to hold, a deeper correction towards the 6400-6450 zone and potentially the 200-day EMA is probable, but this appears unlikely given the robust long-term trend. A neutral case would entail the market consolidating within a range, perhaps bounded by the 6700 resistance and dynamic support provided by the 50-day EMA, allowing time for equilibrium to be established after the recent volatility.
Sentiment drivers, based strictly on the provided technical data, indicate that the recent overbought RSI triggered a period of profit-taking or short-term distribution. The subsequent bounce on the last day suggests some absorption of selling pressure, implying that underlying bullish sentiment remains relatively strong, at least enough to prevent a significant immediate collapse. However, the failure to revisit prior highs immediately suggests that conviction for further aggressive upward movement might be temporarily diminished, giving rise to uncertainty in the very short term.
As a Chartered Market Technician with over 15 years of experience, I’ve analyzed the provided 90-day technical data for the SPX, focusing on price action, the 14-day Relative Strength Index (RSI), and the 13-21-day Price Percentage Oscillator (PPO). It is crucial to note that the provided volume data consistently shows zero, precluding any analysis of volume trends.
The SPX exhibited a clear upward trend over the past 90 days, advancing from approximately 5940 in late May to around 6640 by late September. This period was characterized by robust rallies, notably from late June into late July, which propelled the index to new highs. An intervening corrective phase in early August was followed by a renewed ascent through late August and September. The sustained price appreciation, marked by higher highs, indicates a prevailing bullish sentiment throughout the analysis period. The lack of volume data precludes any analysis of accumulation or distribution dynamics that might otherwise confirm or contradict these price observations.
The 14-day Relative Strength Index (RSI) highlights periods of overbought and oversold conditions. During the strong rally from late June to late July, the RSI frequently breached the 70 overbought threshold, peaking at 76.21 on July 25. Such elevated readings typically precede a cooling or consolidation phase. Indeed, a sharp decline in early August pushed the RSI down to 47.80, approaching oversold levels and marking a significant short-term low before a subsequent rally. More recently, in mid-September, the RSI again surged above 70, reaching 74.75 on September 22, before pulling back to 62.78 by September 26. This recent descent from overbought territory suggests a likely reduction in immediate buying pressure following the latest price run-up.
The Price Percentage Oscillator (PPO), employing 13- and 21-day EMAs, consistently reflected the SPX’s momentum. Remaining largely positive throughout the 90-day timeframe, the PPO generally confirmed the bullish bias. An initial decline from approximately 1.37 in late May to 0.38 by early August, even as price made some higher highs, could be interpreted as a potential bearish divergence, signaling weakening underlying momentum prior to the August correction. The subsequent rebound in PPO from its August low, rising to 0.63 by mid-September, clearly re-established positive momentum, aligning with the index’s renewed uptrend. The current PPO value of 0.53, down from a recent peak of 0.63 on September 22, indicates that while overall momentum remains positive, its rate of acceleration has recently eased.
Synthesizing both indicators, the SPX currently shows a short-term deceleration in bullish momentum, though the underlying trend remains positive. The RSI, at 62.78, has receded from overbought levels, implying immediate upward pressure has likely diminished. Similarly, the PPO’s slight pullback from its recent peak, despite remaining positive, indicates a waning rate of ascent. Given the strong overarching uptrend, it is roughly even chance that the SPX could either consolidate sideways or experience a minor pullback in the near term. A continuation of the uptrend is also plausible, particularly if RSI holds above 50 and PPO stabilizes. A significant reversal to a downtrend appears unlikely at this juncture, as both indicators maintain positions consistent with a bullish bias (RSI > 50, PPO > 0). Traders should observe for indicator stabilization or renewed upward turns as potential signals for further advances.