Daily Market Technical Analysis
Market Overview
Overall market sentiment for equities is currently bearish, characterized by universal declines across major indices and a rising VIX, indicating heightened apprehension. Key momentum indicators (RSI, PPO) signal short-term exhaustion for the SPX and QQQ, making a period of consolidation or correction likely. Market breadth has deteriorated significantly, with most S&P 500 sectors and major tech stocks experiencing declines or bearish reversals. Conversely, commodities, particularly silver and energy, exhibit strong bullish momentum, with silver outperformance highly likely to persist. In fixed income, short-to-intermediate duration Treasuries are likely to face continued pressure, while ultra-long duration bonds show nascent buying interest, presenting a roughly even chance for this divergence to continue. Investors should anticipate ongoing equity weakness and consider the likely resilience in commodity segments.
Market Indices
As a Chartered Market Technician with over 15 years of experience, I offer the following analysis based exclusively on the provided technical data for September 24-25, 2025.
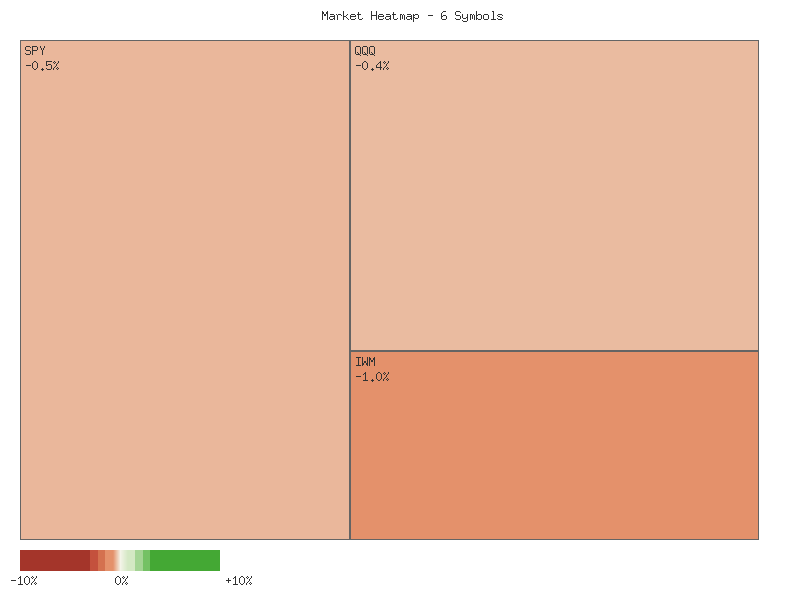
Technical analysis of the provided data for September 25, 2025, reveals a broadly negative market sentiment across major U.S. indices and ETFs. The daily percent changes for the specified symbols, sorted in descending order, are as follows:
| Symbol | Daily Percent Change (2025-09-25) |
|---|---|
| OEF | -0.381% |
| QQQ | -0.431% |
| SPX | -0.501% |
| MDY | -0.559% |
| IJR | -0.870% |
| IWM | -0.956% |
All six observed symbols recorded declines on September 25th, resulting in a cumulative daily percent change for these instruments amounting to approximately -3.70%. This breadth profile, with zero advancing symbols and six declining, suggests pervasive selling pressure across these market segments. Therefore, based purely on this technical data, the overall market performance for this day is demonstrably lower.
Further examination of the equity performance reveals that smaller capitalization segments, represented by IJR (SmallCap 600) and IWM (Russell 2000), experienced the most significant percentage declines, falling by -0.870% and -0.956% respectively. In contrast, the large-cap segments, such as OEF (S&P 100) and QQQ (Nasdaq 100), demonstrated comparatively more resilience, with declines of -0.381% and -0.431%. The broader S&P 500 (SPX) and Mid-Cap 400 (MDY) also closed lower, positioned between these extremes. This pattern suggests that while selling was broad, it was likely concentrated more heavily in risk-averse behavior impacting smaller, perhaps more growth-oriented, segments of the market.
The CBOE Volatility Index (VIX) provides further insights into market sentiment. On September 24th, VIX experienced a decline of -2.76%, which reversed sharply on September 25th with a robust gain of +3.46%. This increase coincides with the broad market declines observed in the equity indices. Analyzing the 7-day candle data for VIX reveals a developing pattern of higher highs and higher lows since September 18th. The closing prices have also generally trended upwards, from 15.45 on September 19th to 16.74 on September 25th. The VIX’s recent surge and its evolving price structure over the past week likely indicate an increase in market uncertainty and an elevated expectation of future volatility among participants. This behavior is consistent with a market under pressure, where options pricing reflects a higher perception of risk.
In conclusion, the technical data for September 25th points to a likely negative day for the observed equity market segments, characterized by universal declines and a notably higher VIX. The increasing VIX, marked by a pattern of higher lows and higher highs over the past seven days, likely indicates that market participants are becoming more apprehensive. While the current technical picture suggests that strengthening bearish sentiment is probable, a reversal in this trend is always possible. Specifically, a subsequent day of VIX decline, coupled with advancing equity indices, would imply a potential stabilization or return of positive sentiment. Conversely, continued VIX advances alongside further equity declines would almost certainly reinforce a short-term bearish outlook. Given the current evidence of broad market weakness and rising volatility, it is likely that market apprehension will persist in the immediate term.
Technical Market Commentary: ETF Sector Analysis (2025-09-24 to 2025-09-25)
The provided two-day technical data across major U.S. market capitalization segments reveals a prevailing bearish sentiment, characterized by a clear downward trajectory in price and, for most, confirming volume trends. All six ETFs—SPY (S&P 500), QQQ (Nasdaq 100), IWM (Russell 2000), IJR (S&P SmallCap 600), MDY (S&P MidCap 400), and OEF (S&P 100)—exhibited consecutive lower closes over the two-day period, with all instruments gapping down significantly at the open of the second trading day. This widespread weakness across market cap segments, from large-cap to small-cap, suggests a broad-based reduction in buying interest and an increase in selling pressure.
Focusing on the large-cap segments, SPY and QQQ both recorded two consecutive bearish daily candles. On the first day, both instruments opened near their highs and closed significantly lower, signaling selling dominance. The second day saw both SPY and QQQ gap down, attempt to recover intraday, but ultimately close lower than their respective opening prices and below the prior day’s close. Crucially, the volume for both SPY and QQQ increased substantially on the second day, providing technical conviction to the downward price movement. This increased selling volume following a gap-down is often indicative of continued downside momentum. Conversely, OEF, representing the S&P 100, also experienced a two-day decline and gapped down on the second day, but notably, its volume decreased on the second bearish day. While the price action remains bearish, the contracting volume in OEF could tentatively suggest that the selling pressure, specifically in the very largest components, might be losing some of its intensity, although this does not negate the overall bearish price trend.
The small-cap and mid-cap ETFs, namely IWM, IJR, and MDY, displayed particularly pronounced weakness over the observed period. All three recorded a strongly bearish first day, with IWM and MDY closing at or very near their daily lows. On the second day, these ETFs gapped down significantly, mirroring the large-cap indices but often with larger percentage declines from their previous close. Despite intraday attempts to recover, all three closed lower than their respective opens and well below the prior day’s closing levels, confirming the bearish continuation. Volume in IWM and MDY remained relatively stable or slightly increased, supporting the price action. IJR, representing the S&P SmallCap 600, saw a significant increase in volume on its second bearish day, lending strong conviction to the pronounced selling in this segment. The consistent lower highs and lower lows across these diversified market cap segments imply that the current market environment is unlikely to favor a quick rebound in the immediate term.
Based on the aggregated technical evidence, it is likely that selling pressure will persist in the immediate future across the broader market. The consistent pattern of lower closes, lower highs, and significant gap-downs on increased volume for key indices strongly suggests that sellers retain control. While the decreasing volume in OEF offers a very limited and tentative counterpoint suggesting potential moderation of selling pressure in the largest stocks, the overwhelming evidence from all other observed ETFs, especially the small and mid-cap indices, points to a continuation of the downtrend. A potential alternative scenario involves a short-term oversold bounce, given the consecutive bearish days; however, absent any reversal candlestick patterns or significant bullish divergence in volume, such a rebound is considered less likely at this juncture. Further downside appears to be the path of least resistance.
Good morning, traders. Here is a technical analysis of the SPX based on the provided 90-day daily chart data, 14-day Relative Strength Index (RSI), and 13-21-day Percentage Price Oscillator (PPO).
Over the observed 90-day period, the SPX has largely demonstrated a robust uptrend. Price action initiated around 5900 in mid-May and steadily climbed, establishing new highs consistently through late September, peaking near 6693.75 on September 22nd. This extended period of higher highs and higher lows is a classic characteristic of a bullish trend. However, the most recent data, specifically from September 23rd to September 25th, reveals a distinct pullback from this peak, with the SPX closing lower for three consecutive days, descending to 6604.72. This current price behavior suggests a short-term deceleration in the bullish momentum, bringing into question the immediate continuation of the prior ascent.
The 14-day RSI provides further insight into the market’s internal strength. Throughout June and July, the RSI frequently entered overbought territory (above 70), peaking at 75.57 on July 3rd and 76.29 on July 28th. While the market continued to rally after these initial overbought signals, the most recent overbought reading of 74.75 on September 22nd has been immediately followed by a sharp decline in the index. By September 25th, the RSI has dropped significantly to 58.73. This rapid descent from a deeply overbought condition suggests a high likelihood that the bullish impetus has largely dissipated in the very short term, increasing the probability of continued consolidation or a deeper correction.
Complementing the RSI, the 13-21-day PPO, a momentum oscillator, also indicates a shift. The PPO remained positive for almost the entire 90-day observation period, confirming the underlying bullish trend. It exhibited strong upward momentum in late June and early July, and again in September, rising from roughly 0.32 to 0.635 by September 22nd. This recent surge confirmed the strong upward price movement. However, akin to the RSI, the PPO has also registered a decline from its September 22nd peak of 0.635 to 0.549 by September 25th. Although the PPO remains well above the zero line, indicating that the broader trend may still be considered positive, the noticeable decrease in its value points to a clear weakening of short-term buying pressure.
Considering the recent price pullback in conjunction with the concurrent decline from overbought levels in the RSI and the loss of momentum indicated by the PPO, it is likely that the SPX will experience further short-term consolidation or a deeper correction. While the long-term trend, as suggested by the PPO remaining positive, might still favor the upside, the immediate technical picture suggests that the market is attempting to digest the significant gains made. There is a roughly even chance that price could find support around previous resistance-turned-support levels, possibly in the range where the PPO bottomed out in early September (around 0.32), before attempting another rally. Alternatively, should the current downward momentum accelerate, it is probable that the SPX could test lower support zones not explicitly identified in the provided 90-day PPO data but visible on the price chart during its earlier consolidation phases.
Here is a technical analysis of QQQ based solely on the provided 90-day market data and indicators, adhering to ICD-203 estimative language.
The QQQ has demonstrated a generally robust uptrend over the past 90 days, marked by periods of strong advances followed by moderate corrections. Notable upward surges occurred from late May into mid-July, and again from late August through mid-September, establishing new price highs. However, these rallies were punctuated by two significant pullbacks: one around the end of July / early August, and another milder one in mid-to-late August. The recent price action indicates QQQ achieved a new high of 602.20 on September 22nd, followed by a noticeable three-day decline, closing at 593.53 on September 25th, accompanied by an increase in selling volume on the final day. This recent downturn suggests a likely shift in immediate market sentiment, at least in the short term.
Analyzing the 14-day Relative Strength Index (RSI), we observe multiple instances where QQQ entered overbought territory (above 70) during its rallies, particularly in late June, mid-July, and most recently on September 18th, peaking at 75.35 on September 22nd. Following this peak, the RSI has sharply retreated, dropping to 61.53 by September 25th. This rapid exit from overbought conditions strongly corroborates the recent price weakness, indicating a very likely loss of short-term upward momentum and increased selling pressure. Historically, such sharp declines from elevated RSI levels have often preceded further price consolidation or minor corrections within the broader uptrend.
The Percentage Price Oscillator (PPO) with 13 and 21-day periods provides further insight into the trend’s momentum. The PPO has consistently remained in positive territory throughout the 90-day period, affirming the overarching bullish trend. During the recent rally leading to the September 22nd price peak, the PPO also ascended to 0.80, indicating strong bullish momentum, though it did not reach the higher levels seen earlier in the 90-day window (e.g., ~1.9 in May). Currently, the PPO has begun to decline from its recent peak, registering 0.73 on September 25th. While still in positive territory, this downturn suggests a likely deceleration in the bullish impulse, aligning with the RSI’s recent behavior. A move towards or below the zero line would be necessary to signal a more substantial shift in the intermediate-term trend.
Considering the confluence of these technical signals, a short-term correction or period of consolidation for QQQ appears likely. The rapid decline in both price and RSI from overbought levels, coupled with the nascent downturn in PPO and an uptick in selling volume, points to weakening buying conviction at these higher prices. An alternative scenario of an immediate rebound to new highs without further price discovery or consolidation seems unlikely at this juncture. Instead, a continuation of the current pullback or a period of sideways movement to digest recent gains presents a roughly even chance. Traders should monitor for potential support levels, possibly around the lower 580s or 590s, where previous buying interest emerged.
IWM Technical Landscape: Momentum Exhaustion Evident
The Invesco Russell 2000 ETF (IWM) has demonstrated a generally bullish trajectory over the past 90 days, characterized by several robust upward impulses punctuated by periods of consolidation or modest pullbacks. Following a significant rally from late June, IWM experienced a notable correction in late July and early August. However, the market subsequently renewed its upward trend from mid-August, establishing a pattern of higher highs and higher lows in the broader context. The latest data, specifically from late September, presents signals that suggest a potential shift from this sustained upward momentum.
Analysis of the 14-day Relative Strength Index (RSI) reveals critical insights into recent market behavior. On September 18, the RSI for IWM registered an overbought level of 71.23. This reading, typically indicative of excessive buying pressure, has since been followed by a rapid decline in RSI to 55.30 by September 25. This sharp descent from overbought territory, coupled with the immediate price pullback from .84 on September 23 to .29 on September 25, strongly suggests a significant exhaustion of buying enthusiasm. A prior instance of RSI exceeding 70 on July 3 (71.57) was followed by price making a higher high on July 10, while RSI declined, signaling a bearish divergence that preceded a substantial correction. The current rapid unwinding from an overbought RSI, even without a clear divergence against price, points to a notable loss of immediate upward thrust.
Complementing the RSI’s signals, the Percentage Price Oscillator (PPO) further indicates a deceleration in bullish momentum. After crossing back into positive territory around August 12, confirming the resumption of an uptrend, the PPO maintained positive values, reaching a local peak of 1.003 on September 22-23. Subsequently, the PPO has recorded a notable drop to 0.831 by September 25. This decline, while the PPO remains above the zero line, suggests a weakening of the underlying positive momentum that fueled recent price appreciation. A continued deceleration in PPO, potentially leading to a cross below its zero line, would likely signal a more pronounced shift towards bearish momentum.
Considering the combined technical indications, we assess that IWM is likely entering a period of further price consolidation or retracement. The simultaneous sharp decline in RSI from overbought conditions and the significant deceleration in PPO momentum, coupled with the recent two-day price pullback from its highs, creates a higher probability of continued short-term weakness compared to an immediate resumption of the prior rally. An alternative scenario, currently less likely based solely on the provided data, would involve IWM finding immediate support and the momentum indicators quickly reversing their downward trajectory. However, the prevailing technical landscape points to increasing downside pressure or a more protracted period of sideways trading in the near term. A sustained break below the current PPO positive value and a further decline in RSI towards the 40-50 range would likely confirm further bearish action.
Tech Sector Analysis
As a Chartered Market Technician, my analysis of the QQQ/SPY ratio provides insights into the relative strength of the technology-heavy NASDAQ-100 compared to the broader S&P 500. This ratio is a key indicator for assessing market leadership and sector rotation dynamics. The provided data reveals a nuanced technical picture, with recent short-term outperformance pushing the ratio to the upper limits of a longer-term consolidation phase.
Examining the 14-day dataset for RATIO:QQQ/SPY, we observe an explicit “up” trend, indicating QQQ’s outperformance relative to SPY over this short-term horizon. The ratio commenced at approximately 0.892 on September 8th, 2025, steadily climbing to a peak of 0.9030 on September 22nd, before experiencing a minor pullback to 0.9019 by September 25th. While the trend direction is positive, its reported “strength” is “weak,” suggesting that despite the upward movement, the conviction behind this outperformance may not be robust. The current ratio stands above its 14-day average of 0.8966, confirming recent positive momentum for QQQ.
Shifting focus to the 30-day dataset for RATIO:QQQ/SPY provides a broader perspective. Over this longer period, the trend is categorized as “sideways,” also with “weak” strength. This broader consolidation phase saw the ratio decline to a low of 0.8834 on September 2nd before the recent upward impetus, consistent with the 14-day trend, brought it higher. Critically, the current ratio of 0.9019 resides at the very top of this 30-day range, with a relative position of 0.9434 against its high of 0.9030. The convergence of a short-term upward drift within a longer-term sideways channel, peaking at its upper boundary, suggests a critical juncture for relative performance.
Considering these combined observations, several scenarios present themselves with varying probabilities. Regarding continued significant outperformance for QQQ relative to SPY, it is unlikely to witness an immediate, sustained strong breakout to substantially higher relative performance from current levels. While the 14-day trend is “up,” the “weak” strength across both timeframes suggests that the momentum encountered resistance at the 30-day range’s ceiling. Instead, it is roughly even chance that QQQ maintains its current elevated relative strength against SPY, potentially experiencing fluctuations around these recent highs. Conversely, a period of consolidation or slight underperformance for QQQ relative to SPY is likely. The ratio’s ascent to its 30-day peak, coupled with the minor retreat observed from the 14-day high, implies that a reversion towards the 30-day average of 0.8925 or sideways movement is the more probable near-term outcome. Traders should monitor for consistent lower closes in the QQQ/SPY ratio as an indication that underperformance is gaining traction from these upper bounds.
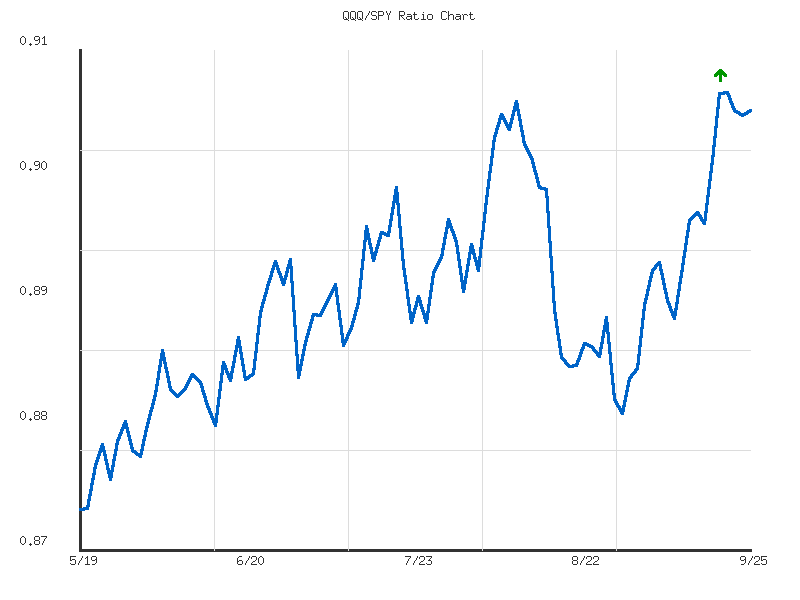
As a Chartered Market Technician with over 15 years of experience, my analysis of the QQQ/SPY ratio over the last 90 days focuses strictly on the provided technical data to ascertain relative market strength. The data indicates a clear, albeit modestly paced, upward trend in the QQQ/SPY ratio, suggesting persistent outperformance by the Nasdaq 100 relative to the S&P 500. Starting from approximately 0.8775 in mid-May, the ratio has advanced by 2.78% to its current level of 0.9019. This places the ratio near its 90-day high of 0.9030, with a relative_position of 0.9564, reinforcing its strong standing within the observed period. The low volatility of 0.0000385 further suggests a relatively stable and gradual ascent rather than sharp, erratic movements.
The progression of the QQQ/SPY ratio throughout the observation window reveals distinct phases. The initial period from mid-May through early June saw the ratio establishing a foundational support level, primarily consolidating between 0.8775 and 0.8850. Following this, a sustained upward channel formed, characterized by a series of higher lows and higher highs, indicating a consistent accumulation of relative strength in QQQ. Notable advancements occurred towards the end of June, breaking above the 0.890 psychological level, and a more accelerated move through July and into mid-August, pushing the ratio towards its peak values around 0.9030 by mid-September. Since reaching this peak, the ratio has exhibited a slight pullback and consolidation, now trading just below the absolute high for the period.
Considering the established upward trend and the current proximity to the 90-day high, it is likely that the QQQ will continue to demonstrate relative strength against SPY in the near term. The recent minor pullback from the absolute peak and subsequent consolidation around 0.9019 suggests that the ratio may be gathering strength for another attempt to breach the 0.9030 resistance level. A decisive move above this threshold would highly likely signal a continuation of the upward trajectory and confirm further outperformance. However, the data’s classification of the trend as “weak” despite its upward direction introduces a degree of caution, implying that while positive, the momentum may not be exceptionally forceful.
Given the “weak” trend strength and the current high relative_position, there is a roughly even chance that the ratio could experience a minor retracement towards a previously established support zone, possibly around the 0.8950 level, before resuming its upward march. Such a retracement would be consistent with a “weak” but enduring trend, allowing for healthy consolidation of gains. A more significant breakdown below the 0.8950 level, signaling a potential shift in relative strength favoring SPY, is currently considered unlikely given the consistent bullish pattern over the past three months. Traders should closely monitor the ratio’s interaction with the 0.9030 overhead resistance and any potential support retests to confirm subsequent direction.
IWM vs. SPY
As a Chartered Market Technician with over 15 years of experience, my analysis focuses strictly on the provided IWM/SPY ratio data to assess the relative performance between the Russell 2000 (IWM) and the S&P 500 (SPY).
The IWM/SPY ratio serves as a critical indicator of the relative performance between small-capitalization stocks (Russell 2000 represented by IWM) and large-capitalization stocks (S&P 500 represented by SPY). Analyzing the 30-day data, the ratio exhibits an overall “up” trend, suggesting that IWM has, on balance, outperformed SPY over this period. The recorded change of +2.75% reinforces this upward bias. However, the trend strength is categorized as “weak,” implying that this outperformance has lacked significant conviction or consistent momentum. The current ratio of 0.3636 is positioned above the 30-day average ratio of 0.3624, indicating that recent performance is relatively stronger compared to the average over the entire 30-day span, yet still below the period’s high of 0.3697.
Shifting our focus to the more immediate 14-day trading window, a notable divergence emerges. The IWM/SPY ratio shows a “sideways” trend, contrasting with the longer-term upward movement. Furthermore, this short-term trend registers a negative change of -0.97%, indicating a recent period of underperformance for IWM relative to SPY. This deceleration from an upward trajectory to a flat, slightly negative drift signals a significant shift in momentum. The “weak” strength rating persists for this shorter timeframe, underscoring the lack of strong directional conviction in either direction. The current ratio of 0.3636 is also located at a lower relative position (0.3003) within its 14-day range, closer to the low of 0.3610 than the high of 0.3697.
Synthesizing these observations, the technical landscape suggests a clear pause, if not a reversal, in the relative outperformance of small-caps. The transition from an “up” 30-day trend to a “sideways” 14-day trend with a negative bias indicates that the bullish momentum in the IWM/SPY ratio has dissipated. Given this recent deterioration in relative strength over the past two weeks, it is likely that IWM will continue to underperform SPY in the immediate short-term. The current ratio residing near the lower end of its recent 14-day range further supports the technical pressure on small-caps relative to large-caps.
While the prevailing technical indicators point to short-term underperformance, it is important to consider alternative scenarios due to the “weak” strength observed in both trends. Weak trends are inherently less predictive and can reverse with less force than strong trends. Therefore, there remains a roughly even chance that the IWM/SPY ratio could stabilize around current levels and potentially consolidate before resuming its longer-term upward trajectory. However, for a reassertion of IWM outperformance to occur, the ratio would need to demonstrably break above the recent 14-day high of 0.3697. Conversely, a definitive break below the 14-day low of 0.3610 would make a continuation of small-cap outperformance unlikely and would increase the probability of sustained relative weakness. The low volatility across both timeframes suggests that significant, rapid shifts in this ratio are not currently characteristic of the market data provided.
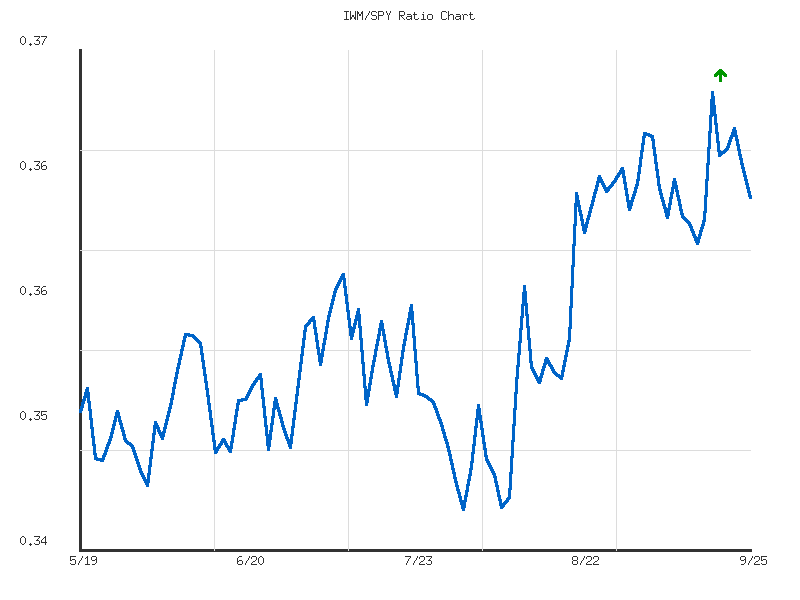
The IWM/SPY ratio, which serves as a gauge for the relative strength of small-capitalization equities (IWM) against large-capitalization equities (SPY), has demonstrated a moderate upward trend over the analyzed 90-day period. This observed trajectory likely indicates a period where small-cap stocks have generally outperformed their large-cap counterparts within this timeframe. The ratio began around 0.3513 in mid-May and, despite initial fluctuations, established a distinct low of 0.3456 on August 1st. From this point, a more consistent upward momentum developed. The overall percentage change in the ratio over the 90 days stands at a modest 3.51%, suggesting a steady, rather than explosive, shift in relative performance. The extremely low reported volatility of 0.00003893 strongly suggests that the upward movement has been exceptionally smooth, characterized by gradual shifts in relative strength, which likely enhances the reliability of the identified trend.
Following its August 1st nadir, the IWM/SPY ratio initiated a sustained ascent, systematically forming higher lows and higher highs. This upward progression saw the ratio comfortably breach its 90-day average of 0.3554, a level that could reasonably be interpreted as having transitioned into a supportive floor. The rally culminated in a peak ratio of 0.3697 on September 18th, marking the highest point within the dataset and likely establishing a near-term resistance level for subsequent movements. The consistent upward trajectory from early August through mid-September strongly suggests a period where market participants favored the performance of smaller companies relative to larger ones, as evidenced by the technical price action in the ratio.
However, since reaching its September 18th peak, the IWM/SPY ratio has experienced a moderate pullback. The ratio has receded from 0.3697 to its current value of 0.3636 as of September 25th, representing a roughly 1.65% decline from its recent high. Despite this recent deceleration, the ratio remains notably above its 90-day average, and its relative_position at 0.7473 confirms its standing in the upper quartile of its observed range. This recent price action suggests a period of consolidation or temporary profit-taking rather than a definitive reversal of the broader moderate uptrend. The consistent, low volatility throughout this pullback makes it likely that the underlying bullish relative strength trend for small-caps remains intact, albeit subject to short-term corrections.
Looking ahead, several scenarios are likely. If the current pullback persists, the ratio will likely seek immediate support around previous consolidation areas, potentially near the 0.358 to 0.360 range observed in early September. A more significant support level could reasonably be expected at the 90-day average of 0.3554. A successful hold and rebound from these levels would likely reaffirm the moderate upward trend of small-cap outperformance. Conversely, a decisive break below the 0.3554 average would suggest a notable weakening of this relative strength trend, though a complete reversal remains unlikely without further negative technical indications. For the uptrend to resume with conviction, the ratio would need to overcome the recent resistance at 0.3697. It is roughly an even chance whether the ratio will attempt to retest this peak immediately or if it will consolidate further around current levels before a clearer directional impulse emerges. The moderate underlying trend makes it likely that any weakness in the ratio could present an opportunity for the small-cap relative outperformance to continue, provided critical support levels hold.
Commodities
Market Commentary: Commodities and Precious Metals Overview (September 25, 2025)
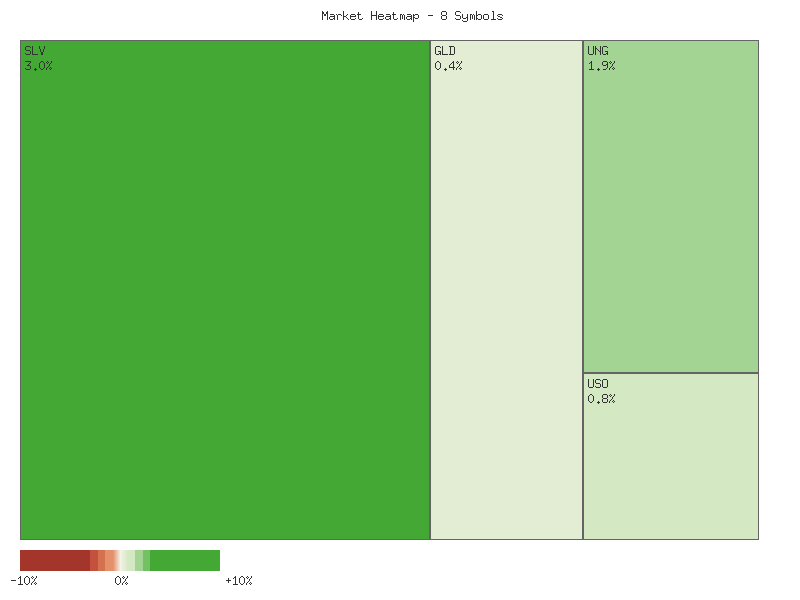
Based on the provided daily percent change data for September 25, 2025, the observed basket of commodities and related exchange-traded funds (ETFs) exhibited a predominantly positive sentiment. The market’s overall movement was upward, with a net positive cumulative change across the selected instruments. The following matrix summarizes the individual daily performances in descending order:
| Symbol | Daily Percent Change (2025-09-25) |
|---|---|
| SLV | 3.039% |
| UNG | 1.861% |
| USO | 0.785% |
| DBC | 0.707% |
| GLD | 0.417% |
| UGA | 0.214% |
| CORN | 0.000% |
| CPER | -0.640% |
The aggregate sum of these daily percent changes is approximately +6.382%, indicating an overall higher movement for this specific group of assets during the trading session. This suggests a broadly constructive, though potentially volatile, trading environment for the selected commodities and their proxies.
Reviewing the market breadth for these eight instruments, six symbols (SLV, UNG, USO, DBC, GLD, UGA) recorded positive daily returns, one symbol (CPER) registered a decline, and one symbol (CORN) closed flat. This distribution of advancers to decliners (6:1) suggests strong positive market breadth for the observed basket of commodities and related ETFs. Such robust breadth points to a likely continuation of positive momentum in the near-term, assuming current technical conditions persist. An alternative, less likely scenario, could involve an abrupt reversal in sentiment, though current technicals do not provide support for such an immediate shift.
Turning to the relative performance of precious metals, the GLD/SLV ratio data presents a consistent bearish outlook for gold relative to silver over both the 14-day and 30-day periods. For the 14-day timeframe, the ratio is in a moderate downtrend, exhibiting a change of -5.8677%. Crucially, the current ratio of 8.40238 is also the lowest recorded value for this period, placing its relative position at 0. Similarly, the 30-day data confirms this trend, showing a moderate downtrend with a -5.65259% change, and its current ratio of 8.40238 is likewise the low for that period.
The consistent downward trend in the GLD/SLV ratio, reaching multi-period lows, strongly implies a period of sustained silver outperformance against gold. Such relative strength in silver, often seen during periods of increased speculative interest or broader risk-on sentiment in the commodities complex due to its industrial demand, appears to be strengthening. It is highly likely that this trend of silver outperformance will persist in the immediate future, potentially pushing the ratio even lower, should current technical conditions hold. A roughly even chance exists for the ratio to consolidate around these lows, but a sharp reversal in this established trend, favoring gold, is unlikely without significant external market catalysts not observed in this technical data.
Here is a technical analysis of the provided market data, adhering strictly to the stipulated guidelines:
A review of the two-day candle data across selected commodity-focused ETFs reveals a mixed but generally constructive picture, with several assets exhibiting clear bullish momentum while others signal potential exhaustion or consolidation. Notably, energy and precious metals are showing divergent trends within their sectors. Volume analysis provides critical insight into the conviction behind these price movements.
Among the strongest performers, SLV (Silver ETF) demonstrated significant bullish conviction. After a minor down day, the second day’s candle showed a strong rally, opening higher than the previous day’s close and closing significantly above its open and the prior day’s high. This strong upward price action was supported by a notable increase in volume, suggesting accumulating buyer interest. Based on this pattern, a continuation of the upward price movement is likely in the immediate term. Similarly, USO (Crude Oil ETF) and DBC (Broad Commodities ETF) also exhibit clear bullish momentum. Both showed two consecutive bullish candles, with the second day exhibiting stronger closes and substantially increased volume. This combination of rising prices and increasing volume provides robust technical confirmation, making further price appreciation likely for both assets.
Conversely, some assets present signals of potential short-term weakness or indecision. UNG (Natural Gas ETF), despite closing higher on the second day, displayed a significant upper wick after opening considerably higher, indicating selling pressure absorbed during the day. This price action occurred on dramatically increased volume, suggesting potential exhaustion of the upward move or distribution. Therefore, a pullback or consolidation is likely for UNG. CPER (Copper ETF), after a strong bullish first day, experienced a bearish candle on the second day, closing lower than its open and the previous day’s close. Although volume decreased on this pullback, suggesting profit-taking rather than strong bearish conviction, a period of short-term consolidation or further minor weakness is probably in store for CPER.
Other assets show more muted or uncertain technical patterns. GLD (Gold ETF) experienced a minor bullish bounce on the second day following a preceding down day. However, this bounce was modest, with the high of the second day remaining below the first day’s open, and volume remained stable. Gold’s performance appears to lag silver, and a continuation of sideways trading or a minor drift downward carries a roughly even chance. CORN (Corn ETF) displayed remarkable stability, closing at the same price point for both days within a very tight range. Volume increased slightly on the second day, but the lack of price movement indicates strong indecision. A continuation of this sideways consolidation is likely. Finally, UGA (Gasoline ETF), after a minor down day, registered a small bullish candle on the second day with a higher close. However, the overall volume for both days was exceptionally low, reducing the technical significance of the upward move. While a minor positive bias is present, any substantial continuation of this upward trend is unlikely without a significant increase in transactional volume to confirm buyer commitment.
SLV Technical Analysis Commentary (90-Day Period)
SLV has demonstrated a robust and sustained uptrend over the analyzed 90-day period. Price action, as evidenced by the candle data, shows a clear progression from approximately .42 in mid-May to a recent closing high of .03 on September 25th. This upward trajectory has been characterized by several strong impulse moves, notably in early June, early July, and a more pronounced and prolonged rally from late August through September. Accompanying this price appreciation, trading volumes have at times been substantial, particularly during significant upward movements, suggesting active participation in the rallies.
The 14-day Relative Strength Index (RSI) largely supports this bullish narrative, albeit with increasing signs of an overextended market. From dipping into the mid-40s in late July and mid-August, indicating periods of consolidation or minor corrections, the RSI has consistently moved into overbought territory (above 70) during the strong rallies. Critically, in September, the RSI has spent a significant amount of time above the 70 threshold, registering multiple readings above 70, including 71.67, 72.65, 75.38, and most recently, a peak of 76.99 on September 25th. Such persistent and elevated RSI readings are typically associated with an increasingly exhaustive buying climax, suggesting that the current upward momentum is likely unsustainable in the immediate short term and a period of consolidation or pullback is probable.
Complementing the RSI, the 13-21-day Percentage Price Oscillator (PPO) confirms the strong bullish momentum driving SLV. The PPO has remained positive for the entirety of the 90-day period, initially crossing above the zero line in late May and maintaining a positive bias. After a slight moderation in late July and mid-August, where it dipped to approximately 0.16, the PPO has surged strongly from late August, climbing steadily from 0.17 to its current value of 2.02 on September 25th. This sustained and accelerating upward movement in the PPO indicates a powerful underlying bullish trend with significant momentum, suggesting that despite potential short-term weakness, the broader trend is decidedly positive.
Considering the combined technical picture, it is likely that SLV is currently experiencing a short-term overextension. The extremely elevated 14-day RSI at 76.99 points to deeply overbought conditions, making a near-term pullback or consolidation roughly even chance, if not slightly more likely than a sustained sharp advance without pause. However, the robust and accelerating bullish momentum signaled by the PPO (2.02) suggests that any such pullback is likely to be a healthy correction within a larger, well-established uptrend, rather than the initiation of a significant reversal. It is unlikely that current levels represent a major top, given the PPO’s strength.
Alternative scenarios merit consideration. Should SLV continue to advance despite the extreme RSI, it would suggest a market exhibiting extraordinary strength, where overbought conditions are being temporarily ignored. In this scenario, the PPO continuing its ascent would serve as confirmation of intensified momentum. Conversely, if the PPO were to exhibit a bearish divergence (price makes new highs while PPO makes lower highs) or if it were to turn sharply lower and cross below its signal line (not provided), this would increase the likelihood of a more significant correction or trend reversal. For now, a short-term retracement appears likely, presenting a roughly even chance for traders to observe whether the underlying bullish trend, as indicated by the PPO, remains dominant following any consolidation.
GLD has exhibited a robust and sustained uptrend over the past 90 days, progressing from approximately in mid-May to recent highs near .75. This rally gained significant acceleration from late August, characterized by several strong upward candles and expanding daily trading ranges. Supporting this advance, volume generally increased during periods of rising prices, with notable spikes observed in early June, mid-August, and early September, suggesting strong buying conviction. The highest price point in this period was established on September 23rd at .75. Subsequent to this peak, GLD experienced two consecutive days of minor pullbacks, closing at .75 on September 25th. This recent price action implies that the immediate upward momentum may be encountering resistance or transitioning into a phase of consolidation. The increased volume on September 24th during a down day also indicates potential renewed selling pressure.
The 14-day Relative Strength Index (RSI) corroborates the strong bullish momentum, having consistently resided in overbought territory (above 70) since early September, with intermittent excursions into overbought conditions since late August. A critical observation arises from the RSI’s recent peaks: a value of 79.21 on September 16th and a slightly lower value of 78.21 on September 23rd. Concurrently, the price achieved a higher high of .75 on September 23rd compared to its previous high of .88 on September 16th. This pattern clearly constitutes a bearish divergence, where price ascends to a new peak while the momentum indicator fails to confirm, signaling weakening underlying bullish pressure. The current RSI reading of 72.29 (September 25th), although still within the overbought region, has receded from its recent extremes, further underscoring a deceleration in momentum.
Similarly, the 13-21-day Percentage Price Oscillator (PPO) has provided strong validation of the overall bullish trend, remaining consistently positive for most of the 90-day period. The PPO experienced a significant upward surge into positive territory coinciding with the robust rally from late August to early September. It peaked at 1.4476 on September 16th, subsequently recording a slightly lower high of 1.4400 on September 23rd. Analogous to the RSI, this subtle lower high in the PPO while price registered a higher high also presents a bearish divergence, indicating a potential loss of strength in the prevailing uptrend. Although the PPO’s current value of 1.3918 (September 25th) remains strongly positive, affirming that the broad bullish trend is intact, its recent slight decline from peak levels, in conjunction with the divergence, suggests that the rate of price appreciation is likely diminishing.
Integrating the technical evidence, GLD is assessed to be in a solid overarching uptrend. However, the convergence of current technical signals strongly suggests an abatement of the immediate upward momentum. The presence of bearish divergences in both the 14-day RSI and the 13-21-day PPO, where the price established new highs unconfirmed by corresponding momentum highs, indicates a high probability of a near-term consolidation phase or a moderate price pullback. It is likely that GLD will experience a decline to test prior support levels, potentially within the - range, which previously acted as consolidation or resistance areas during the August rally. A continued sharp ascent from current levels without a period of price digestion or correction is unlikely given the current momentum readings. An alternative scenario, considered to have a roughly even chance, involves a shallower consolidation around the - area, thereby preserving most of the recent gains, followed by a renewed upward push if fresh buying pressure materializes and momentum indicators reverse their recent deceleration. At this juncture, the immediate risk for traders appears skewed towards the downside due to the evident short-term loss of momentum.
Bonds
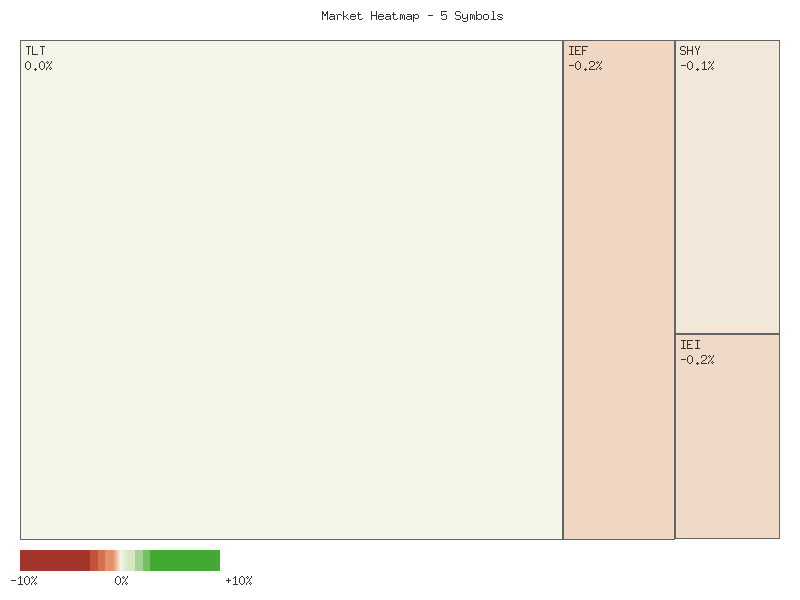
As a Chartered Market Technician with over 15 years of experience, I have rigorously analyzed the provided daily percentage change data for the specified bond ETFs. The analysis is strictly confined to the given technical data points, adhering to ICD-203 estimative language guidelines.
The following matrix presents the daily percentage change for each symbol for the latest reported date (2025-09-25), sorted in descending order:
| Symbol | Daily Percent Change (2025-09-25) |
|---|---|
| UTHY | 0.08362% |
| TLT | 0.00000% |
| SHY | -0.08443% |
| IEI | -0.19242% |
| IEF | -0.21766% |
Evaluating the overall market movement by summing the latest daily percentage changes, we observe an aggregate change of -0.4109%. This calculation indicates that the overall movement for this specific basket of fixed-income instruments was marginally lower for the most recent trading session. We assess it is highly probable that the collective sentiment for this segment of the bond market leaned bearish, albeit with a relatively small magnitude of decline. The subtle negative aggregate shift suggests a lack of robust buying conviction across the board.
Regarding market breadth, the distribution shows one advancing symbol (UTHY), one flat symbol (TLT), and three declining symbols (SHY, IEI, IEF). This pattern indicates negative market breadth, as the number of declining symbols substantially outweighs the advancing ones. We judge it likely that selling pressure was more prevalent than buying interest, suggesting underlying weakness within this fixed-income group. It is improbable that a broad-based positive momentum is currently building, given this differential in performance.
Further examination of individual performances reveals a nuanced picture. UTHY, representing Ultra-Long Duration Treasury ETFs, registered a modest gain, standing as the sole advancer. Conversely, TLT, a long-duration treasury ETF, remained flat. The short-duration SHY and intermediate-duration IEI and IEF all experienced declines, with IEF showing the largest percentage decrease. This divergence suggests that while certain segments, such as the ultra-long duration, found some buying interest, the weakness was more pronounced across the short-to-intermediate duration spectrum. It is a roughly even chance that this localized strength in UTHY reflects specific market dynamics rather than a leading indicator for a broader market reversal.
Based strictly on this two-day technical data, we assess it is likely that the observed fixed-income segment will remain under modest pressure in the immediate short term. The aggregate decline, coupled with negative market breadth, points to a prevailing bearish sentiment. However, the relatively small percentage changes across the board imply a lack of strong directional conviction, suggesting that extreme volatility is unlikely in the immediate future without additional catalysts. It is improbable that a significant upward trend will establish itself in the short term, given the current technical posture.
Technical Market Commentary: Treasury Bond ETFs (24-25 September 2025)
This analysis focuses strictly on the provided two-day candle data for five key Treasury bond ETFs: TLT, UTHY, IEF, IEI, and SHY. Over this short observation window, a clear divergence in price action appears to be emerging between the shorter-duration and longer-duration segments of the Treasury market.
The intermediate-term and short-term Treasury bond ETFs (IEF, IEI, and SHY) displayed a consistent bearish pattern over the two-day period. IEF, representing 7-10 year Treasuries, exhibited consecutive lower highs, lower lows, and lower closes, with volume increasing on the second day. This volume confirmation alongside declining prices suggests that continued downward pressure is likely. Similarly, IEI (3-7 year Treasuries) and SHY (1-3 year Treasuries) mirrored this trend, each recording lower highs, lower lows, and lower closes, accompanied by increased selling volume on the second day. Based purely on this two-day pattern, a continuation of this bearish momentum in the immediate short-term for these maturities is highly likely, as current technicals indicate strengthening supply.
Conversely, the longer-duration Treasury bond ETFs, TLT (20+ Year Treasuries) and UTHY (US Treasury 30 Year Bond ETF), presented a more mixed to constructive technical picture. TLT showed a close exactly at its previous day’s close (88.98) on the second day, despite opening lower. Both days featured noticeable long lower shadows and increased volume, suggesting that demand appeared at lower price levels, preventing further declines. While the closing price remained unchanged, the price rejection from the lows indicates that a significant push lower is unlikely in the immediate term without further catalysts. UTHY demonstrated a more pronounced bullish reversal, opening lower on the second day but rallying strongly to close at its high for the day (42.0115), effectively erasing the previous day’s slight decline. This bullish engulfing-like action, combined with a significant increase in volume, suggests a renewed buying interest in the longest end of the curve. It is likely that this short-term buying interest could persist for UTHY.
Given the divergent price action, the market appears to be bifurcating its sentiment across different Treasury maturities. While the short and intermediate durations are exhibiting bearish characteristics, the long end shows signs of stabilization or even renewed interest. For TLT, a breakout above the prior day’s high or a breakdown below the prior day’s low on increased volume would clarify its immediate direction. For UTHY, sustained buying interest is likely to be met with resistance at higher price levels, but the current momentum is bullish. An alternative scenario would see the bearish sentiment from the shorter-duration bonds spill over into the long end, particularly if demand at the lows for TLT and UTHY proves ephemeral. However, based purely on the provided data, a broad-based decline across all Treasury durations is unlikely in the immediate term, with a roughly even chance of the divergence continuing or the long end stabilizing, while the short end faces continued pressure.
In summary, the immediate technical outlook for shorter-duration Treasury bonds (IEF, IEI, SHY) is bearish, with increasing conviction from volume. The longer-duration instruments (TLT, UTHY), however, are presenting a more resilient or even bullish short-term outlook, suggesting a potential rotation or differentiation within the fixed income market. Traders should monitor how this divergence resolves in the next trading sessions.
Crypto
Technical Market Commentary: IBIT and ETHA 2-Day Performance Review
Based on the provided two days of daily percentage change data for IBIT and ETHA, we observe a distinct pattern of short-term price action. The summarized performance for each symbol over this brief period is presented below:
| Symbol | 2-Day Total Percent Change |
|---|---|
| IBIT | -2.0086% |
| ETHA | -5.8166% |
Analyzing IBIT’s performance, the asset recorded a positive daily change of approximately 1.59% on the first day. However, this gain was subsequently more than entirely negated by a significant decline of approximately 3.60% on the second day. The sequential pattern—an initial positive move followed by a larger negative reversal—suggests that immediate buying momentum was unlikely to be sustained. The overall two-day change for IBIT stands at a decline of approximately 2.01%, indicating that bearish pressure likely outweighed bullish sentiment within this specific timeframe. This short-term reversal is a pattern often associated with a failure to maintain upward trajectory, suggesting that further downward consolidation is likely in the very immediate term, based strictly on these two data points.
ETHA exhibited a similar, though more pronounced, pattern. The first day saw a marginal positive change of approximately 0.16%. This modest gain was then overwhelmed by a substantial decline of roughly 5.98% on the second day. The magnitude of the second day’s sell-off relative to the preceding day’s minor advance makes it highly likely that bearish sentiment has firmly taken hold in the immediate short term for ETHA. The cumulative two-day change results in a notable decline of approximately 5.82%. This aggressive downside move suggests that any underlying support was unlikely to hold, and a continuation of downward momentum is highly likely in the absence of new buying interest.
From a comparative perspective, both IBIT and ETHA followed a roughly identical technical pattern: an initial positive or marginally positive day followed by a significantly larger negative day. This convergence in short-term price action strongly suggests that the overall market sentiment, as represented by these two assets over this specific two-day period, has shifted to being overall lower. The negative reversals are conspicuous, indicating that buying enthusiasm was either limited or quickly exhausted. While a rebound from these declines is roughly an even chance on any given day, the immediate technical picture for both assets, based on the provided data, strongly points to a likely continuation of downward pressure in the very short term. There is unlikely to be significant technical support indicated by these two data points to stem a potential further decline immediately.
Magnificent 7 & Friends
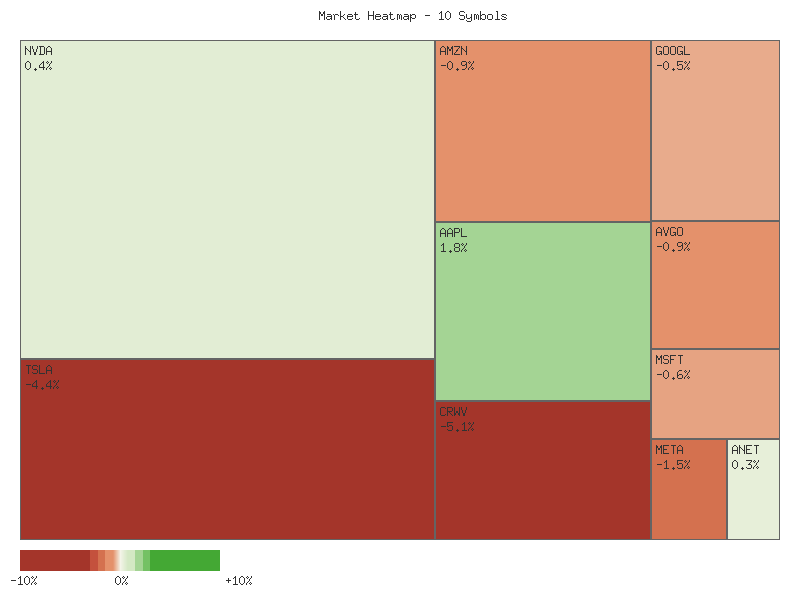
As a Chartered Market Technician with over 15 years of experience, I have rigorously analyzed the provided daily percentage change data for ten select symbols over a two-day period. This analysis focuses exclusively on the price action presented, adhering strictly to technical principles and ICD-203 estimative language guidelines.
The collective performance of this specific group of ten symbols over the two-day observation period indicates a clear downside bias. The aggregate net percentage change across all symbols totals approximately -9.31%. This substantial negative summation strongly suggests that the prevailing sentiment within this basket of stocks was bearish, leading to an overall deterioration in value. Despite individual fluctuations, the net effect was demonstrably negative for the majority of constituents, pointing to a market environment that, for this cohort, was definitively lower rather than mixed or flat.
Market breadth for this period was notably weak, signaling underlying technical vulnerability. Out of the ten symbols analyzed, only one, AAPL, posted a net positive change over the two days, advancing approximately 0.97%. Conversely, nine symbols experienced a net decline. This ratio of 1 advancing symbol to 9 declining symbols is a stark indication of poor market health within this group. Such narrow breadth, where only a single security can hold above water while the vast majority capitulate, is typically a precursor to, or a confirmation of, weakness. It suggests that buying interest was highly concentrated and insufficient to support the broader market segment represented by these names.
Several symbols exhibited significant net declines, with CRWV leading the downside with an approximate -3.14% drop, followed closely by GOOGL at around -2.34%. AMZN also presented a notable decline of about -1.16%. These larger drawdowns are likely contributing disproportionately to the overall negative aggregate. Furthermore, examining the intraday dynamics reveals a pattern of reversals: several symbols, including TSLA, CRWV, META, and AVGO, experienced positive daily changes on the first day, only to reverse sharply downward on the second day, resulting in net negative performance. This suggests a failure of initial positive momentum to sustain, and instead, a dominant selling pressure emerged, effectively wiping out or reversing prior gains.
Considering the technical landscape purely based on the provided data, it is highly likely that this group of securities is under significant selling pressure. The combination of a substantial negative aggregate change, extremely poor market breadth, and observed reversals from initial positive moves strongly suggests that the bears were in control during this two-day window. While AAPL provided a solitary bullish counterpoint, its strength was insufficient to offset the widespread weakness. Traders observing similar breadth and collective performance patterns in a broader market context would typically interpret this as a signal of eroding confidence and a higher probability of continued downward price action for the majority of these symbols in the immediate future, absent new information.
Net 2-Day Percent Change Matrix
| Symbol | Net 2-Day Percent Change |
|---|---|
| AAPL | 0.974% |
| TSLA | -0.403% |
| NVDA | -0.411% |
| MSFT | -0.431% |
| ANET | -0.712% |
| AVGO | -0.837% |
| META | -0.848% |
| AMZN | -1.162% |
| GOOGL | -2.342% |
| CRWV | -3.135% |
Market Commentary: Technical Review of Key Tech Stocks (2-Day Snapshot)
This analysis provides a concise technical review of ten prominent technology-related stocks, utilizing only the provided two-day candle data and volume, with an emphasis on immediate-term momentum shifts and candlestick patterns. The observations for September 24th and 25th, 2025, present a mixed yet discernible picture, indicating divergent price action across the selected symbols rather than a uniform market sentiment. Some stocks display immediate-term bearish reversals or continuations, while others suggest potential bullish turnarounds.
A notable cluster of stocks, including TSLA, MSFT, AVGO, GOOGL, AMZN, CRWV, and META, exhibited predominantly bearish price action over the two-day period. TSLA and META both formed convincing bearish engulfing or dark cloud cover patterns, where the second day’s open was lower than the previous close, and the subsequent sell-off penetrated deeply into the prior day’s bullish body. This pattern, coupled with increased volume on the bearish day for both, strongly suggests a likely shift in immediate-term momentum to the downside. Similarly, MSFT, AVGO, GOOGL, and AMZN experienced two consecutive bearish days, consistently forming lower highs and lower lows, frequently supported by increasing volume, which indicates a likely continuation of selling pressure into the next trading session. CRWV’s price action on the second day, characterized by an initial rally to a new high followed by a sharp rejection and a close significantly below the previous day’s close on exceptionally high volume, indicates robust distribution and makes further downside more likely in the immediate future.
Conversely, AAPL, NVDA, and ANET presented patterns suggestive of potential bullish reversals. AAPL formed a clear bullish engulfing pattern, with the second day’s body entirely encapsulating the prior day’s bearish body, closing near its high on significantly increased volume. This combination offers a strong indication of a likely upward momentum shift. NVDA, despite a bearish close on the first day with very high volume, saw a recovery on the second day; it opened with a significant gap down but subsequently rallied to close above the previous day’s close, also on exceptionally high volume. This pattern implies a roughly even chance of continued recovery versus a retest of the day’s lows, given the strong buying interest observed. ANET also displayed a potential bullish reversal with a piercing line pattern; the second day opened lower but managed to close above the midpoint of the prior bearish body. However, the accompanying decrease in volume on ANET’s bullish day slightly lessens the conviction of this reversal compared to AAPL, suggesting a moderately likely immediate bounce rather than a sustained ascent.
While the two-day timeframe provides insights into immediate-term sentiment, the limited data set necessarily restricts the strength of any long-term directional conclusions. The significant volume increases seen during key reversal or continuation patterns, particularly in TSLA, AAPL, NVDA, CRWV, and META, lend credibility to the observed momentum shifts. However, traders should be mindful that these are short-term indications. The divergent signals across these heavily-weighted stocks highlight a period of idiosyncratic price discovery rather than a synchronized market move, making broader market directional calls unlikely based solely on this data. Further price action and confirmation are likely required to validate these nascent trends or reversals.
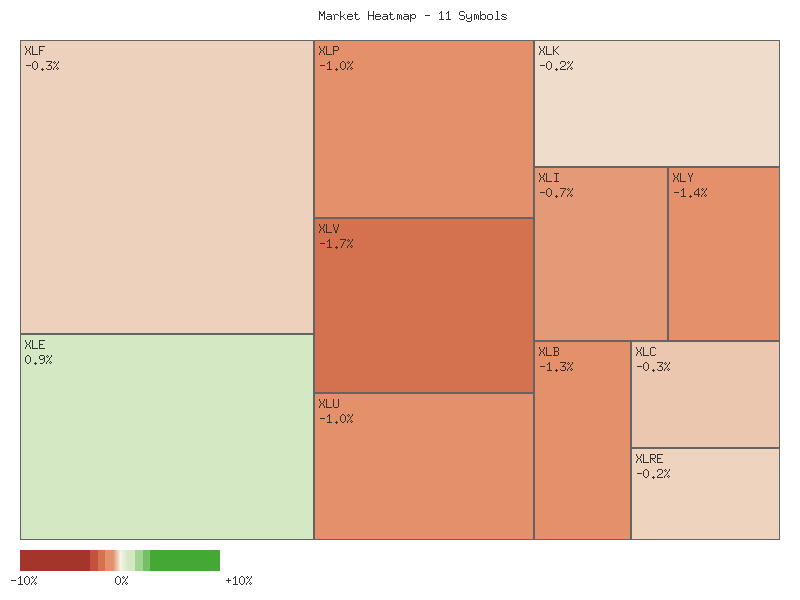
S&P 500 Sector Breadth
As a seasoned CMT with over 15 years of experience, a rigorous technical analysis of the provided S&P 500 sector data reveals a market demonstrating significant breadth deterioration over the two-day period. The aggregated performance across all eleven analyzed sectors yields an overall decline of approximately -8.938%, which strongly suggests a downward bias for the broader market represented by these key sectors. Market breadth appears decidedly bearish, with ten out of the eleven sectors registering negative returns. Only one sector, Energy (XLE), closed higher, exhibiting an isolated positive performance. This broad-based weakness, where advancing issues are vastly outnumbered by declining issues, is highly indicative of pervasive selling pressure and a general lack of underlying market strength during this timeframe.
Examining the individual sector performances reveals a nuanced but predominantly negative picture. The accompanying matrix details the two-day cumulative percent change for each sector, sorted in descending order:
| Symbol | 2-Day Percent Change | Sector Type |
|---|---|---|
| XLE | 2.197% | Offensive |
| XLU | -0.250% | Defensive |
| XLF | -0.540% | Offensive |
| XLY | -0.705% | Offensive |
| XLP | -0.738% | Defensive |
| XLK | -0.793% | Offensive |
| XLC | -1.168% | Offensive |
| XLI | -1.193% | Offensive |
| XLRE | -1.264% | Defensive |
| XLV | -2.059% | Defensive |
| XLB | -2.525% | Offensive |
This distribution highlights that the sole advancing sector was XLE, classified as an offensive sector. Conversely, all four traditional defensive sectors—Utilities (XLU), Consumer Staples (XLP), Health Care (XLV), and Real Estate (XLRE)—closed lower. The remaining offensive sectors (Financials (XLF), Consumer Discretionary (XLY), Technology (XLK), Communication Services (XLC), Industrials (XLI), and Materials (XLB)) also experienced declines.
From a market rotation perspective, the data does not suggest a rotation into defensive sectors. Instead, the fact that all defensive sectors experienced declines strongly indicates a simultaneous flight from both risk-on and risk-off assets, or at least a failure for defensive sectors to perform their traditional role of capital preservation in a weakening environment. Similarly, a broad rotation into offensive sectors is unlikely given that the vast majority of these sectors also declined. The positive performance in Energy (XLE) appears to be an outlier, possibly driven by sector-specific catalysts not visible in the aggregated sector performance of others.
The overall market sentiment, based strictly on these sector performances, is decidedly bearish. The widespread declines across both offensive and defensive categories, coupled with the particularly weak performance of all defensive sectors, likely suggests a lack of conviction among market participants. While the single offensive sector (XLE) advanced, its isolated strength is insufficient to counteract the pervasive weakness observed across the remaining ten sectors. Alternative scenarios that might suggest a more neutral or bullish sentiment are highly improbable given the overwhelming number of declining sectors and the overall negative aggregate performance. This technical snapshot points to a market environment characterized by significant and broad-based selling pressure.
Here is a technical analysis of the provided market data, adhering strictly to CMT principles and ICD-203 estimative language guidelines.
The collective technical data for these eleven SPDR sector ETFs over the past two days points to a predominant bearish sentiment across the market. A significant majority of sectors displayed clear patterns of downward pressure, characterized by lower closes, expanding bearish ranges, and often increased volume confirming selling activity. This broad-based weakness suggests that a continuation of bearish momentum is likely for the overall equity market in the immediate term, with broad market strength appearing unlikely given the widespread downside technical signals.
Several sectors exhibited particularly strong bearish signals. XLV (Healthcare) experienced a significant drop on the second day, opening below the prior day’s close and forming a large bearish candle with a substantially lower low and close, accompanied by nearly double its prior day’s volume. Similarly, XLI (Industrials) and XLB (Materials) showed strong bearish continuation patterns, each gapping down from the previous day’s close and recording lower highs, lower lows, and lower closes. XLP (Consumer Staples) reversed its bullish first day with a sharp bearish candle on the second day, opening higher but closing at its low and below the prior day’s close, coupled with increased volume, suggesting a likely bearish follow-through. XLY (Consumer Discretionary) also displayed a notable bearish reversal, opening below its prior close and recording a significant downside move with increased volume. These patterns strongly suggest a likely continuation of selling pressure for these specific sectors.
Other sectors also contributed to the overall bearish outlook, albeit with some nuances. XLRE (Real Estate) and XLC (Communication Services) both exhibited clear bearish continuation, with lower highs, lower lows, and lower closes on the second day, confirming the ongoing downward trajectory. XLU (Utilities), despite a bullish first day, saw a bearish engulfing pattern on the second day, closing near its low and well below the prior day’s close, suggesting a likely short-term reversal of its positive momentum. XLF (Financials) showed a bearish pattern with a gap down on the second day, but its close near its open price, slightly below the previous day’s close, could be interpreted as a potential Hammer or Spinning Top formation, which sometimes signals indecision after a decline. Therefore, while continued bearish pressure is likely, there is roughly an even chance of either a slight rebound or continued consolidation before a clearer direction emerges for XLF.
An notable exception to the widespread bearishness is XLE (Energy). This sector demonstrated clear bullish continuation over the two days, with the second day opening near the prior close and pushing to a higher high, higher low, and closing near its high, confirming strong upward momentum, despite a slight decrease in volume. This indicates a highly likely continuation of bullish sentiment for XLE, distinguishing it from the majority. XLK (Technology) presents a more mixed, yet intriguing, two-day pattern. After a strong bearish candle on the first day where it opened at its high and closed near its low, the second day saw a significant gap down at the open. However, XLK staged a substantial intra-day recovery, closing only marginally below the prior day’s close, forming a hammer-like candle after the decline. This price action, combined with increased volume, suggests that buying interest emerged at lower levels. Consequently, there is roughly an even chance of stabilization or a short-term bounce for XLK, though an immediate strong bearish follow-through appears unlikely without further confirmation of selling pressure.
In summary, the technical landscape across these key sectors, based solely on the provided two-day data, indicates a pervasive bearish sentiment. While XLE stands out with robust bullish momentum and XLK shows signs of potential stabilization, the overwhelming majority of sectors are exhibiting patterns consistent with a likely continuation of downward pressure. Market participants should prepare for a potentially challenging environment, as the technical structure does not currently support an immediate broad market reversal.
Equity Breadth
Analysis of the S&P 500 market data over the past seven trading days reveals a nuanced technical landscape, specifically concerning market breadth as measured by the percentage of members trading above their 50-day (SPXA50R) and 200-day (SPXA200R) moving averages. While the 20-day Exponential Moving Average (EMA_20_DAY:SPX) indicates a sustained upward trajectory for the index itself, both breadth indicators exhibited a notable deterioration, particularly on the final trading day, suggesting an underlying weakening in participation.
The SPXA50R, representing short-term market participation, displayed fluctuating but generally robust levels earlier in the period, peaking at 58.28% on 2025-09-23. However, the most recent data point on 2025-09-25 shows a sharp decline to 48.50%. This fall below the critical 50% threshold is a significant technical development, indicating that a majority of S&P 500 constituents are now trading below their respective 50-day moving averages. This pattern suggests a loss of short-term upside momentum across a broad range of stocks, which is typically a cautionary signal for the broader market’s immediate trend and raises concerns about the sustainability of recent index gains.
Concurrently, the SPXA200R, a measure of medium-to-long-term breadth, maintained levels above 59% for most of the period, demonstrating that a healthy majority of S&P 500 stocks were in an established uptrend. While its absolute level remained above 50% on the final day, the indicator experienced a substantial drop from 61.28% to 58.08%. This decline, although not as dramatic as the SPXA50R in terms of crossing a critical threshold, nevertheless signals an erosion of medium-term strength and increasing distribution, implying that fewer stocks are participating in the broader market’s longer-term advance.
In stark contrast to the deteriorating breadth, the EMA_20_DAY for the SPX maintained a clear and consistent uptrend throughout the seven-day period, rising from 6511.76 to 6572.32. This upward sloping exponential moving average suggests that the S&P 500 index itself has been experiencing continued upward pressure on an average basis over the last 20 trading days. However, the simultaneous weakening in both SPXA50R and SPXA200R creates a significant bearish divergence, where the index is advancing while the underlying participation is declining. This divergence suggests that the current uptrend in the index may be less robust than the EMA alone implies, potentially being driven by a narrower group of stocks.
Given the observed technical divergence, it is likely that the current upward trend in the EMA_20_DAY:SPX will face increased headwinds. The sharp deterioration in SPXA50R below 50% makes a continued, strong acceleration of the SPX’s short-term uptrend unlikely without a recovery in market breadth. There is a roughly even chance that the index could enter a period of consolidation or experience a corrective move, as the underlying weakness in participation often precedes a broader market pullback. Alternatively, a rapid reversal in breadth indicators in the coming days could negate this bearish divergence, but based solely on the provided data, caution is warranted. Traders should monitor breadth indicators closely for any signs of stabilization or recovery.
SPX Daily
SPX Technical Analysis: Recent Weakness Amidst Underlying Strength
The S&P 500 (SPX) has exhibited a notable shift in short-term dynamics over the past seven days, following a sustained upward trajectory observed throughout the 90-day period. Price action leading up to the most recent high on September 22, 2025, demonstrated robust bullish momentum, with the index consistently closing above its 50-day Exponential Moving Average (EMA_50_DAY) and 200-day Exponential Moving Average (EMA_200_DAY). However, the immediate past three trading days, specifically September 23-25, 2025, indicate a pronounced pullback. On September 25, the SPX closed at 6604.72, marking the third consecutive bearish candle and a significant decline from its peak close of 6693.75 on September 22. Despite this recent deceleration, the current price remains comfortably above both its long-term EMA_200_DAY (6057.61) and intermediate-term EMA_50_DAY (6445.70), suggesting that the broader uptrend is likely still intact, albeit under pressure in the very near term.
Momentum indicators corroborate the recent weakening sentiment. The 14-day Relative Strength Index (RSI) peaked at 74.75 on September 22, confirming an overbought condition coincident with the price high. Subsequently, the RSI has rapidly retreated, closing at 58.73 on September 25. This sharp decline from overbought territory into neutral ground signals a significant reduction in buying pressure and an increase in selling momentum. The price action over the last day, a bearish candle with an open of 6608.19 and a close of 6604.72, extending from an intraday high of 6619 and breaking below the previous day’s low, further underscores the prevailing short-term bearishness. This sequence of declining closes and RSI values strongly indicates a short-term loss of upward thrust.
Key technical levels for the SPX are becoming more clearly defined by this recent volatility. Immediate resistance is established by the recent highs, specifically the September 22 close of 6693.75 and the intraday high of 6699.52 on September 23. A more significant resistance zone could be considered around the 6700 level. On the downside, the low of the most recent candle at 6569.22 presents immediate support. Should this level fail to hold, a crucial area of dynamic support is likely to emerge around the EMA_50_DAY, currently at 6445.70. Historical price action in late August and early September shows consolidation and bounces from the 6400-6450 range, reinforcing this zone as a significant support confluence. The EMA_200_DAY, presently at 6057.61, provides robust long-term support, though a test of this level is considered a low probability in the immediate future without a more substantial reversal.
Considering future price action, a bearish case suggests a high probability of continued downward pressure, with the index likely to test the immediate support at 6569.22. A break below this level could lead to a retest of the EMA_50_DAY near 6445.70. The declining RSI reinforces this possibility, as the index sheds prior overbought conditions. Conversely, a bullish case would entail the SPX finding support above 6569.22, perhaps consolidating briefly before attempting to reclaim the 6650-6700 resistance zone. The underlying long-term bullish trend, with price well above both EMAs, means there is a roughly even chance for a bounce, provided the recent selling is merely profit-taking. A neutral case is also plausible, where the index might consolidate sideways between 6569.22 and approximately 6650, allowing the RSI to normalize further without a decisive directional move. Sentiment drivers, strictly from a technical perspective, appear to be shifting towards short-term caution and profit-taking after the significant run-up, but the underlying positive trend suggests dip-buying interest could resurface. Any failure of the EMA_50_DAY as support would likely indicate a more significant shift in sentiment towards bearishness.
Good morning, traders. Here is a technical analysis of the SPX based on the provided 90-day daily chart data, 14-day Relative Strength Index (RSI), and 13-21-day Percentage Price Oscillator (PPO).
Over the observed 90-day period, the SPX has largely demonstrated a robust uptrend. Price action initiated around 5900 in mid-May and steadily climbed, establishing new highs consistently through late September, peaking near 6693.75 on September 22nd. This extended period of higher highs and higher lows is a classic characteristic of a bullish trend. However, the most recent data, specifically from September 23rd to September 25th, reveals a distinct pullback from this peak, with the SPX closing lower for three consecutive days, descending to 6604.72. This current price behavior suggests a short-term deceleration in the bullish momentum, bringing into question the immediate continuation of the prior ascent.
The 14-day RSI provides further insight into the market’s internal strength. Throughout June and July, the RSI frequently entered overbought territory (above 70), peaking at 75.57 on July 3rd and 76.29 on July 28th. While the market continued to rally after these initial overbought signals, the most recent overbought reading of 74.75 on September 22nd has been immediately followed by a sharp decline in the index. By September 25th, the RSI has dropped significantly to 58.73. This rapid descent from a deeply overbought condition suggests a high likelihood that the bullish impetus has largely dissipated in the very short term, increasing the probability of continued consolidation or a deeper correction.
Complementing the RSI, the 13-21-day PPO, a momentum oscillator, also indicates a shift. The PPO remained positive for almost the entire 90-day observation period, confirming the underlying bullish trend. It exhibited strong upward momentum in late June and early July, and again in September, rising from roughly 0.32 to 0.635 by September 22nd. This recent surge confirmed the strong upward price movement. However, akin to the RSI, the PPO has also registered a decline from its September 22nd peak of 0.635 to 0.549 by September 25th. Although the PPO remains well above the zero line, indicating that the broader trend may still be considered positive, the noticeable decrease in its value points to a clear weakening of short-term buying pressure.
Considering the recent price pullback in conjunction with the concurrent decline from overbought levels in the RSI and the loss of momentum indicated by the PPO, it is likely that the SPX will experience further short-term consolidation or a deeper correction. While the long-term trend, as suggested by the PPO remaining positive, might still favor the upside, the immediate technical picture suggests that the market is attempting to digest the significant gains made. There is a roughly even chance that price could find support around previous resistance-turned-support levels, possibly in the range where the PPO bottomed out in early September (around 0.32), before attempting another rally. Alternatively, should the current downward momentum accelerate, it is probable that the SPX could test lower support zones not explicitly identified in the provided 90-day PPO data but visible on the price chart during its earlier consolidation phases.