Daily Market Technical Analysis
Market Overview
Market indices experienced a decisively negative session on September 24th, led by small-cap underperformance, though the VIX’s contraction offers a roughly even chance of temporary market anxiety easing. Key indices like SPX, QQQ, and IWM are likely entering short-term consolidations or minor corrections from recent highs, with a sustained immediate ascent unlikely as RSI retreats from overbought levels. Broad market breadth indicates a likely risk-off sentiment and defensive sector rotation into areas like Energy and Utilities. Commodities present a mixed outlook, with silver’s outperformance likely to persist, while bonds face likely continued downward pressure following widespread bearish reversals. Overall, while the S&P 500’s short-term uptrend is likely, the Magnificent 7 cohort shows a likely downward trend, suggesting a selective market with heightened short-term volatility.
Market Indices
As a Chartered Market Technician with over 15 years of experience, I’ve analyzed the provided market data using rigorous technical analysis principles. My assessment focuses exclusively on the supplied daily percentage changes for key indices and VIX candlestick patterns, adhering strictly to ICD-203 estimative language guidelines.
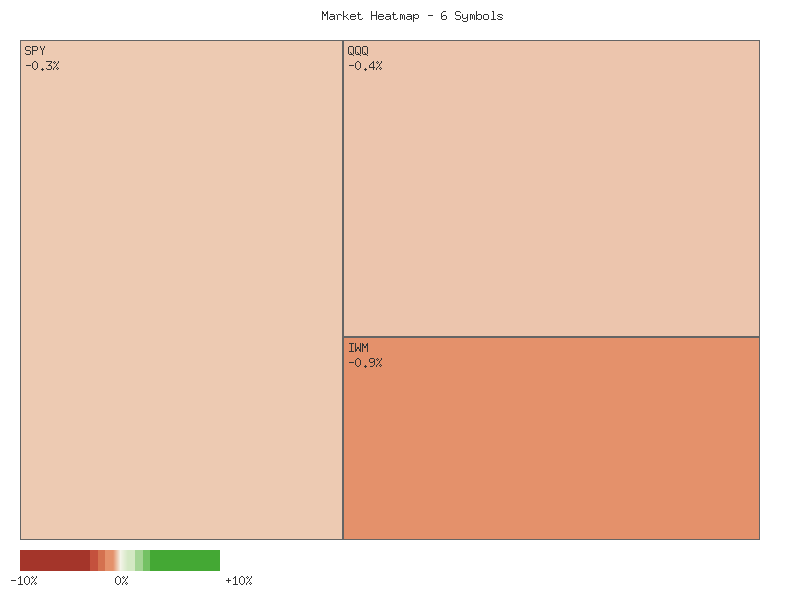
On September 24, 2025, a comprehensive review of the sampled market indices—IJR, IWM, MDY, SPX, OEF, and QQQ—reveals a decisively negative session. Every symbol recorded a decline in its daily percentage change, indicating a unanimous downward movement. The aggregate sum of these daily percentage changes for September 24 is approximately -3.40%, signifying an overall lower performance for this representative group of equities. Market breadth, as measured by the ratio of advancing to declining symbols within this specific dataset, was notably poor; all six symbols experienced declines, resulting in zero advancing and six declining entities. This pattern strongly suggests a broad-based selling pressure across these segments, rather than isolated weakness.
| Symbol | Daily Percent Change (2025-09-24) |
|---|---|
| OEF | -0.2533% |
| SPX | -0.2847% |
| QQQ | -0.3511% |
| MDY | -0.7668% |
| IJR | -0.8296% |
| IWM | -0.9186% |
Further examination of the magnitude of these declines on September 24 indicates differential performance across market capitalization segments. The small-cap proxies, IWM (Russell 2000) and IJR (S&P SmallCap 600), experienced the most significant losses, falling by approximately -0.92% and -0.83%, respectively. This pattern signals a relative underperformance by smaller capitalization companies. In contrast, the S&P 500 (SPX) and the S&P 100 (OEF), which represent larger capitalization equities, showed comparatively more modest declines of approximately -0.28% and -0.25%. The Nasdaq 100 (QQQ) settled in the middle, down approximately -0.35%. This divergence suggests that while selling pressure was widespread, large-cap equities exhibited greater relative resilience compared to their smaller counterparts.
The CBOE Volatility Index (VIX) has demonstrated fluctuating activity over the past seven trading days, without establishing a clear, sustained directional trend. After an initial decline from September 16 to September 19, the VIX recovered over September 22 and 23, closing at 16.64 on the latter day. However, on September 24, despite opening higher, the VIX ultimately closed lower at 16.18, forming a bearish candlestick for the session. Intraday on September 24, the VIX reached a high of 17.21, the highest point within this seven-day period, before retreating. This reversal from the intraday high and the bearish close for the day suggests a temporary reduction in immediate market anxiety.
Analyzing the daily percentage change for VIX alongside the equity indices reveals a nuanced market sentiment. On September 23, all tracked equity indices exhibited declines, and correspondingly, the VIX advanced by approximately +3.35%. This observation aligns with the typical inverse relationship where rising implied volatility accompanies falling equity prices. However, on September 24, despite the continued broad declines across the equity indices, the VIX experienced a notable decrease of approximately -2.76%. This divergence, where equity markets are declining but implied volatility is contracting, suggests that the perceived level of panic or uncertainty may have temporarily receded, or that the selling pressure on equities was viewed as less chaotic. It is roughly an even chance that this VIX contraction represents a momentary easing of intense fear or that it is merely a short-term technical retracement before a potential re-escalation, especially considering the persistent weakness in the equity market indices. Further observation of both VIX and equity market price action is likely warranted to confirm the sustainability of this VIX decline.
As a seasoned technical analyst with over 15 years of experience, a rigorous review of the provided 2-day market data across key ETFs (SPY, QQQ, IWM, IJR, MDY, OEF) reveals a consistent pattern of short-term bearish price action. All six instruments exhibited two consecutive days of lower closes, lower highs, and lower lows. This broadly indicates a prevailing negative sentiment across large-cap, mid-cap, and small-cap segments of the market during this brief observation window. The consistency across varied market capitalization categories suggests that the observed weakness is not isolated to a particular segment but is rather a broader market dynamic.
Analyzing the large-cap indices, SPY, QQQ, and OEF, the technical picture is generally weak. SPY registered a lower close from .21 to .10, accompanied by a decrease in trading volume from 81 million to 67 million shares. QQQ showed a similar trend, closing lower from .20 to .10, also on diminishing volume from 63 million to 49 million shares. OEF, while also closing lower from .63 to .79 with lower highs and lows, saw a slight increase in volume from 419,843 to 529,912 shares. This slight uptick in volume on a down day for OEF, contrasted with decreasing volume in SPY and QQQ, suggests that while selling pressure remains dominant, the conviction behind the selling varies slightly across the large-cap spectrum. However, the overall price action across all three is unequivocally bearish.
The small and mid-cap segments, represented by IWM, IJR, and MDY, largely mirrored the bearish price behavior of their large-cap counterparts. IWM closed lower from .84 to .60, with volume declining from 41 million to 35 million shares. IJR followed suit, closing down from .33 to .34, also on decreased volume from 3.5 million to 3.4 million shares. MDY similarly registered a lower close from .62 to .03, with its volume also dropping from 530,894 to 515,974 shares. The synchronized lower closes, lower highs, and lower lows across these segments, all on decreasing volume, indicates a lack of buying interest that allowed prices to drift lower rather than being driven by aggressive selling.
The consistent observation of decreasing volume accompanying price declines across SPY, QQQ, IWM, IJR, and MDY is a noteworthy technical detail. While lower volume on a down move can sometimes suggest a lack of strong conviction from sellers, implying that a potential bounce could be forthcoming, the pervasive nature of the downtrend across all indices for two consecutive days makes such a bounce highly uncertain in the immediate term. It is likely that the current short-term bearish momentum will persist into the next trading period. However, given the limited 2-day data, a scenario where support is found and prices stabilize, perhaps even leading to a minor consolidation or bounce, cannot be entirely dismissed, particularly if volumes were to dry up further or reverse on an upward price move.
Based on the available technical data, the overwhelming evidence points to a continued bearish bias in the very short term. All six ETFs are exhibiting textbook lower closes, lower highs, and lower lows. Therefore, it is highly likely that prices will experience further downside pressure or at least struggle to gain upward traction in the immediate future. A reversal of this short-term trend is currently an unlikely development given the uniformity of the observed price action.
Technical Analysis of SPX: A 90-Day Perspective (May 16 - Sep 24, 2025)
The SPX has demonstrated a significant bullish trend over the past 90 days, beginning in mid-May near 5900 and steadily climbing to recent highs above 6600 by late September. This period was characterized by strong upward price movements interspersed with minor consolidations rather than deep corrections, reflecting robust underlying strength. Notably, June and July saw a sustained rally into the low 6000s, reaching levels near 6380 before a modest pullback into early August. This retracement found support around the 6200-6240 range, subsequently initiating the latest leg higher that has propelled the index to its current levels. The overall price action suggests a market that has been consistently favoring buyers, with dips being relatively short-lived.
In the immediate term, the SPX recorded its highest close within this 90-day window on September 22nd at 6693.75. However, the subsequent two trading days have seen the index pull back, closing at 6656.92 and 6637.97, respectively. This recent price action forms a minor two-day decline from a new high, suggesting a possible short-term exhaustion of buying pressure. Supporting this observation, the 14-day Relative Strength Index (RSI) reached an overbought level of 74.75 on September 22nd. Following the recent price dips, the RSI has retreated to 64.28 as of September 24th. While no longer in extreme overbought territory, this still indicates a strong, albeit moderated, bullish bias. The cooling of the RSI from its peak suggests that the immediate upward momentum has waned, making a continued immediate ascent unlikely without a period of consolidation or further retracement.
The Percentage Price Oscillator (PPO) with 13 and 21-day parameters consistently remained in positive territory throughout the observed 90 days, reinforcing the overall bullish bias. The PPO saw a significant increase in momentum during late June and early July, peaking around 0.94, concurrent with the price rally. A subsequent dip in early August, falling to roughly 0.38, accurately reflected the price correction during that period. Following this, the PPO resumed its upward trajectory, peaking at 0.635 on September 22nd, aligning with the recent price high. The PPO has now marginally declined to 0.604. While this indicates a slight deceleration of positive momentum, the PPO remains firmly above zero, suggesting that the underlying bullish trend is likely to persist. No bearish divergence between price and PPO is evident at the most recent peak, which would typically foreshadow a more significant reversal.
Synthesizing the indicators, it is likely that the SPX is currently undergoing a short-term consolidation or minor correction after reaching new highs. The recent pullback in price, coupled with the RSI easing from overbought conditions and a slight moderation in PPO momentum, supports this outlook. Key levels to watch on the downside include the approximately 6600 mark, which may serve as initial support, followed by the more significant support zone around 6400-6450, corresponding to a prior consolidation area. A rebound from these levels would be consistent with the prevailing uptrend. An alternative scenario, considered a roughly even chance at this juncture, would involve the index resuming its upward trajectory quickly, potentially retesting the 6693 resistance if buying pressure re-emerges and the RSI reverses its recent downtick. However, sustained bearish momentum that pushes the PPO towards the zero line, while unlikely in the immediate short term based on current data, would signal a more significant shift in the broader trend.
Here is a technical analysis of QQQ based solely on the provided 90-day RSI, PPO, and candlestick data:
Analysis of QQQ’s 90-day technical data reveals a predominantly upward trend, albeit with notable periods of consolidation and correction. From mid-May through July, QQQ exhibited robust bullish momentum, with the 14-day Relative Strength Index (RSI) frequently in the overbought region (above 70) and peaking around 73.11 on July 28th. Concurrently, the 13-21-day Percentage Price Oscillator (PPO) remained positive, largely supporting the upward price action. A significant shift occurred in late July and early August, with a sharp decline in price confirmed by the RSI’s rapid descent from overbought levels to 48.26 by August 1st. This momentum breakdown was corroborated by the PPO crossing below zero on August 1st, marking a decisive bearish crossover. This collective evidence indicates it was likely a significant, albeit temporary, reversal of the prior uptrend during that period, accompanied by heavy selling volume exceeding 64 million shares on both July 31st and August 1st.
Following the early August correction, QQQ initiated a powerful recovery throughout September. The price action demonstrated a strong rebound, driving the 14-day RSI back into deeply overbought territory, reaching a peak of 75.35 on September 22nd. The PPO also mirrored this renewed bullish conviction, accelerating significantly from lows near zero in early September to 0.80 by September 22nd, consistently staying above its implied signal line and reinforcing the strength of the uptrend. This synchronized behavior across price and momentum indicators suggested that a new phase of strong bullish sentiment was likely dominant in the market, pushing QQQ to fresh multi-month highs. The strong upward trajectory with both indicators confirming momentum pointed to a high probability of continued price appreciation leading up to the recent peak.
However, the most recent data, specifically from September 22nd to 24th, presents an observable shift in momentum dynamics. QQQ experienced a notable price pullback from its peak of 602.2 on September 22nd to 596.1 on September 24th, accompanied by a significant cooling of the 14-day RSI, which dropped sharply from 75.35 to 65.40. This rapid decline from extreme overbought levels suggests an exhaustion of immediate buying pressure. Furthermore, the PPO, after peaking at 0.81 on September 23rd, registered a downturn to 0.78 on September 24th, signaling a potential loss of upward impetus in the intermediate trend. While the PPO remains in positive territory, its recent decline from a local high, alongside the RSI’s sharp reversal, suggests it is likely that QQQ is entering a period of consolidation or correction in the immediate term. The elevated volume accompanying the Sep 23rd price drop (63.9 million shares) also supports the notion of increased selling interest.
Considering these recent technical signals, two primary near-term scenarios emerge. It is slightly favored that the current pullback represents the initiation of a deeper correction, given the rapid decline in RSI from extreme overbought levels and the nascent downturn in PPO, supported by recent higher volume on down days. Traders should monitor for sustained PPO decline or further weakness in price action. Alternatively, there is a roughly even chance that this current price weakness is merely a healthy, albeit sharp, consolidation within the broader bullish trend that prevailed in September. A swift and convincing rebound in price, coupled with a renewed upward turn in both RSI and PPO, would negate the bearish implications of the recent indicator movements and would suggest that the underlying strength remains intact.
As a Chartered Market Technician with over 15 years of experience, my analysis of IWM’s price action, Relative Strength Index (RSI_14_DAY), and Percentage Price Oscillator (PPO_13_21_DAY) over the past 90 days indicates a prevailing bullish trend with recent signs of momentum cooling.
Over the observed 90-day period, IWM has largely demonstrated a robust uptrend. Beginning from mid-May around the - range, the asset generally sustained a pattern of higher highs and higher lows. Notable accelerations were observed in June, pushing prices towards , followed by a more significant rally into July, surpassing the mark. This upward trajectory continued into August and September, with IWM establishing a new price peak in the - range by mid-September. The consistent upward movement across multiple months indicates a sustained bullish sentiment within this timeframe.
The Relative Strength Index (RSI_14_DAY) and Percentage Price Oscillator (PPO_13_21_DAY) largely corroborated this positive price development. During periods of strong upward price movement, such as in early July, the RSI ascended well into overbought territory, reaching 71.57, which is a strong indication of significant buying pressure. Similarly, the PPO consistently maintained positive values, escalating from around 0.7 in early June to a peak of 1.17 in mid-July, signifying strengthening bullish momentum. While there were intermittent pullbacks, such as in late July to early August where RSI dipped to 41.36 and PPO neared the zero line (0.08), the price subsequently found support, and both indicators quickly rebounded, confirming the underlying bullish trend. This pattern suggests that periods of overextension were met with healthy consolidation before momentum re-engaged.
However, recent data points from mid-September exhibit a potential shift in short-term momentum. Following the price peak in the - area around September 18-23, IWM has experienced a notable pullback, declining to .60 by September 24. Concurrently, the RSI, which peaked around 71.23 on September 18, has since fallen sharply to 60.72. This rapid descent from overbought conditions suggests a likely exhaustion of immediate buying pressure and a cooling off of bullish momentum. The PPO, while still positive, has also registered a decline from its recent high of 1.01 on September 8 to 0.94 on September 24. This recent trend in PPO, failing to make a significant new high with the September price peak, indicates a probable weakening in the strength of the uptrend. The higher volume observed during some of the recent declines, such as on September 19 and 22, might be an additional factor supporting the notion of increased selling interest or profit-taking.
Considering these technical signals, it is plausible that IWM may experience further near-term consolidation or a moderate correction. The sharp drop in RSI from overbought conditions is a significant caution signal, suggesting that a continued immediate upward trajectory is unlikely. While the PPO remains positive, indicating that the broader bullish bias is not yet entirely negated, its declining trend warrants close attention. A roughly even chance exists for IWM to consolidate in the current price range, potentially seeking support around previous resistance levels now turned support (e.g., the - area). Alternatively, should the price break decisively below key immediate support levels, such as the ~ mark, and the RSI continue its descent, a more pronounced pullback would become likely. Conversely, a swift rebound in price, coupled with a renewed upward acceleration in both RSI and PPO from current levels, would indicate a re-establishment of the prior strong bullish momentum, though this appears less likely in the immediate context of the most recent data.
Tech Sector Analysis
As a Chartered Market Technician, I have analyzed the provided market data for the RATIO:QQQ/SPY over the 14-day and 30-day periods to assess the relative performance of the NASDAQ-100 (QQQ) against the S&P 500 (SPY). This analysis relies strictly on the provided technical data, utilizing estimative language in accordance with ICD-203 guidelines.
Over the recent 14-day period, the RATIO:QQQ/SPY exhibits an “up” trend, indicating that QQQ has outperformed SPY during this timeframe. The ratio increased by approximately 1.309%, moving from 0.8900 to 0.9016. However, we assess the strength of this upward trend as “weak.” The current ratio (0.901679) is above its 14-day average (0.895822) and near its high point of 0.903065, as indicated by a relative position of 0.8998 within its recent range. A closer examination of the latest data points reveals a minor retreat from the peak, with the ratio slightly declining from 0.903065 to 0.901679 in the last two observations. This suggests some near-term resistance or consolidation may be developing.
Extending our view to the 30-day period, the RATIO:QQQ/SPY registers a “sideways” trend, also described as “weak” in strength. Despite a small positive change of approximately 0.197% over this longer duration, the overarching pattern suggests a lack of sustained directional momentum. The current ratio (0.901679) is considerably above the 30-day average (0.892500) and positioned very near its 30-day high of 0.903065, reflecting a relative position of 0.9294. This implies that while the long-term trend is neutral, QQQ is currently performing at the upper end of its relative performance range against SPY for the past month.
Synthesizing both timeframes, we observe short-term QQQ outperformance within a broader, largely neutral relative performance environment. Given the “weak” strength attributed to both the 14-day “up” trend and the 30-day “sideways” trend, coupled with the ratio’s proximity to its recent highs and the slight decline in the latest data points, we assess that a short-term consolidation or minor pullback in the QQQ/SPY ratio is likely. This would imply a period where QQQ’s outperformance pauses or slightly reverses against SPY.
Considering alternative scenarios, a continuation of the weak upward momentum, overcoming the recent minor retreat, is a roughly even chance. However, a sustained, strong continuation of QQQ outperformance that breaks significantly higher is unlikely without a clear and measurable increase in trend strength. Conversely, a sharp reversal into significant QQQ underperformance, pushing the ratio into a distinct downward trend, is also unlikely in the immediate term, as the prevailing trends (weak up and weak sideways) do not yet support such a decisive shift. Therefore, should the current weak upward pressure dissipate, the ratio reverting to and maintaining the “sideways” trajectory observed over the 30-day period, indicating QQQ performing broadly in line with SPY, is likely.
Technical Analysis of QQQ/SPY Ratio (90-Day Horizon)
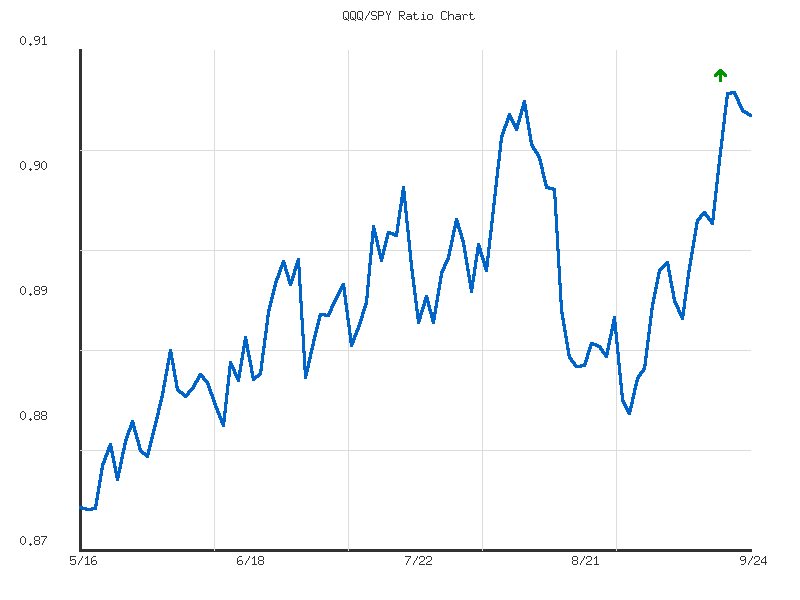
This analysis focuses exclusively on the provided 90-day dataset for the QQQ/SPY ratio, which serves as a technical gauge of the Nasdaq 100’s relative performance against the S&P 500. Over the past 90 days, the ratio has exhibited a discernible upward trend, moving from a low of approximately 0.8775 in mid-May to a current level of 0.9016. The data indicates an overall positive change of 2.73% during this period, suggesting QQQ has generally outperformed SPY. However, the accompanying trend strength classification describes this upward movement as “weak,” implying that while the direction is positive, the momentum behind this relative outperformance has not been exceptionally robust or consistently accelerating.
Upon closer inspection of the recent data, the QQQ/SPY ratio reached its 90-day peak of 0.9030 on September 22, 2025. Following this high, the ratio experienced a minor retracement over the subsequent two trading days, settling at 0.9016 by September 24, 2025. This current level remains very close to the period’s high, with a relative position of 0.9456, indicating it is near the top of its historical range for this 90-day window. This minor pullback from the peak, after an extended upward movement, is a pattern often observed in trending instruments, suggesting a potential for consolidation or a temporary pause. The average ratio for the period is 0.8899, placing the current ratio well above this mean, which generally supports the continuation of the positive relative strength.
Considering the recent price action, there is a roughly even chance that the QQQ/SPY ratio may undergo a period of short-term consolidation or a minor pullback in the immediate future, given its proximity to the 90-day high and the slight decline observed in the last two data points. Such consolidation would be consistent with the “weak” trend strength noted in the summary, suggesting that aggressive upward continuation may require renewed impetus. Alternatively, given the overall upward trend, there is a likely scenario where the ratio resumes its climb, potentially attempting to breach the 0.9030 peak and establish new highs within this dataset’s context.
A more significant and sustained reversal of the upward trend, which would imply QQQ beginning to consistently underperform SPY, appears unlikely in the immediate term without additional technical signals of trend breakdown. Such signals are not evident in the provided numerical data, which predominantly illustrates an upward bias despite the “weak” strength. The minimal volatility noted in the trend summary also suggests that dramatic, rapid shifts in the ratio are not characteristic of this 90-day period. Traders should monitor future data points for definitive breaks below prior minor lows or sustained movement below the average ratio, which would lend more credence to a bearish relative performance scenario.
IWM vs. SPY
As a Chartered Market Technician, my analysis of the IWM/SPY ratio, which measures the relative performance of the iShares Russell 2000 ETF (IWM) against the SPDR S&P 500 ETF Trust (SPY), is based exclusively on the provided technical data points for the 14-day and 30-day periods.
Over the past 30 days, the RATIO:IWM/SPY has demonstrated a weak upward trend, registering a change of +1.927%. This upward trajectory suggests a period during which the Russell 2000 has shown a modest degree of outperformance relative to the S&P 500. The current ratio of 0.36545 is notably positioned in the upper quartile of its 30-day range, with a relative position of 0.7455, indicating that IWM is generally stronger relative to SPY compared to its average over the past month. The 30-day average ratio stands at 0.36222, reinforcing the notion of a higher current valuation within this timeframe.
However, examining the more immediate 14-day period reveals a shift in momentum. The RATIO:IWM/SPY over this shorter timeframe exhibits a weak, sideways trend, accompanied by a slight decline of -0.519%. This suggests that the relative outperformance observed over the longer 30-day period has stalled or experienced a minor retreat in recent sessions. The current ratio of 0.36545 aligns closely with its 14-day average of 0.36496, placing it approximately in the middle of its recent range (relative position 0.5097). Volatility during this 14-day period is notably lower (0.0000062) compared to the 30-day period (0.0000219), reinforcing the consolidating, range-bound behavior.
Considering both datasets, it is roughly an even chance that the RATIO:IWM/SPY will continue its sideways consolidation in the immediate short-term, given the weak and directionless trend observed over the past 14 days. There is a slightly less than even chance of a definitive resumption of IWM outperformance against SPY in the very near term, as the momentum has clearly attenuated. A sustained break above the 14-day high of 0.36970 would be required to shift this assessment towards a likely continuation of outperformance.
Looking at the broader technical picture, it is likely that the IWM/SPY ratio will ultimately attempt to reassert the weak upward trend observed over the 30-day period, provided the current consolidation holds above key support levels, particularly the 30-day average of 0.36222. An alternative scenario, though considered unlikely without further technical deterioration, would involve a decisive move below this 30-day average. Such a move would suggest a more significant shift in relative performance, potentially leading to SPY re-establishing dominance and IWM underperforming. Conversely, a clear and sustained breach above the 30-day high of 0.36970 would provide stronger evidence for a more robust and continued outperformance by IWM.
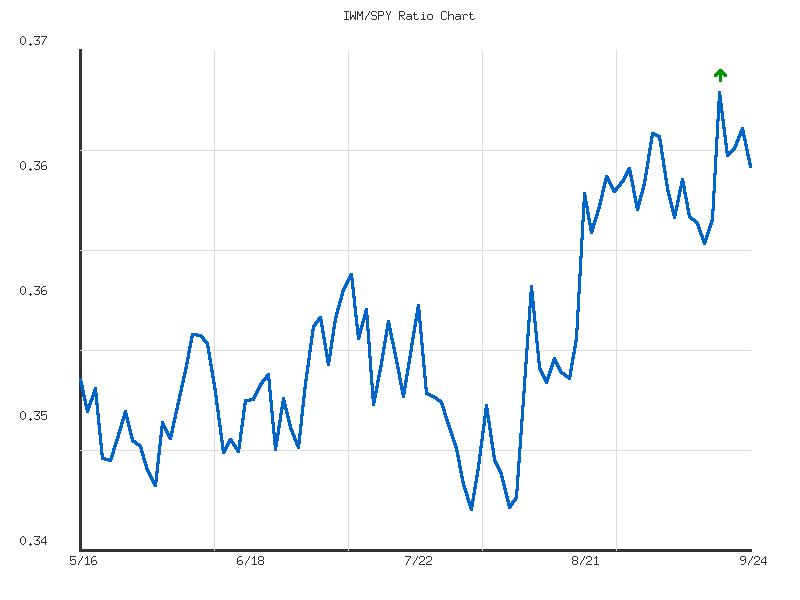
As a Chartered Market Technician, my analysis of the provided IWM/SPY ratio data for the 90-day period ending September 24, 2025, reveals a clear, albeit moderate, upward trend. The ratio has increased by approximately 3.48% over these 90 days, indicating a period where the Russell 2000 (IWM) has moderately outperformed the S&P 500 (SPY). The overall low volatility, as indicated by a figure of 0.000038, suggests that this ascent has been relatively smooth and gradual, without significant erratic price movements. The current ratio of 0.36545 is positioned near the upper end of its observed 90-day range, residing at 82.3% of the distance between its 90-day low of 0.34569 and its 90-day high of 0.36970.
A closer examination of recent price action shows that the IWM/SPY ratio established its 90-day high of 0.3697 on September 18, 2025. Following this peak, the ratio experienced a noticeable pullback, closing at 0.3655 on September 24, 2025. This retreat from the high suggests that the 0.3697 level is likely to serve as immediate technical resistance. The market’s inability to sustain prices above this level points to a potential short-term loss of upward momentum, or a natural retracement after reaching a significant peak within the established trend.
From a support perspective, the data indicates a prior area of consolidation around the 0.3640-0.3655 range, which was evident in late August and early September. This zone is likely to act as immediate support for the ratio. Should the ratio breach this initial support, the 90-day average ratio of 0.3553 represents a more significant support level that is likely to attract buying interest, potentially halting a deeper retracement. A failure to hold above the average would suggest a more substantial shift in short-term sentiment.
Considering the established moderate upward trend and the recent retracement from the 90-day high, a period of near-term consolidation around current levels or a further pullback is roughly even chance. It is likely that the ratio will attempt to retest the 0.3697 resistance level if it successfully holds above the immediate 0.3640-0.3655 support zone. However, a sustained break below this immediate support would make it likely that the ratio retests the 0.3553 average. A complete reversal of the 90-day positive trend appears unlikely in the immediate term, given the moderate strength observed in the underlying trend and the current distance from the 90-day low.
Commodities
Technical Market Commentary
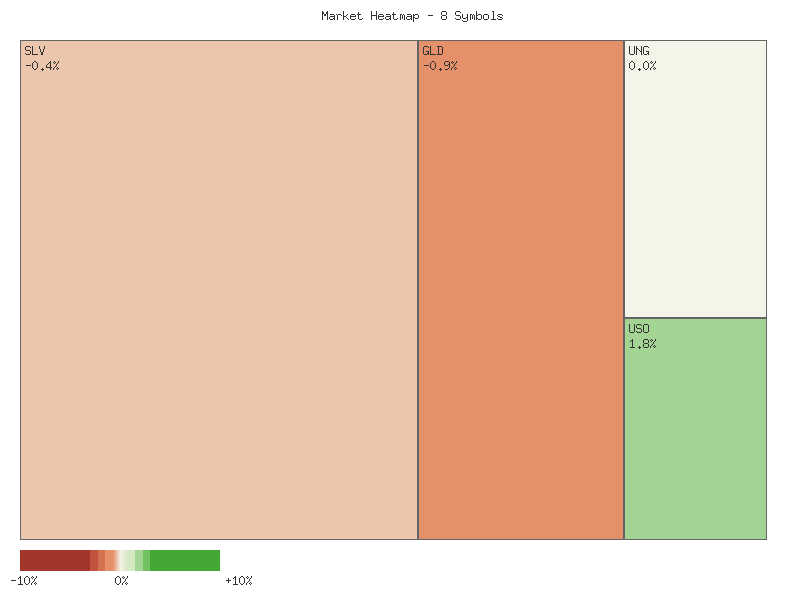
Our latest technical analysis of selected commodity ETFs for the most recent trading day, September 24th, 2025, reveals a mixed yet slightly positive market sentiment across the observed symbols. The daily percent changes, summarized and sorted in descending order, are as follows:
| Symbol | Daily Percent Change |
|---|---|
| CPER | 3.774% |
| USO | 1.785% |
| DBC | 0.667% |
| UGA | 0.385% |
| UNG | 0.000% |
| CORN | -0.169% |
| SLV | -0.350% |
| GLD | -0.906% |
Considering the overall market action for these eight symbols, the sum of their daily percent changes amounts to approximately +5.585%. This indicates an overall higher movement, suggesting a net positive directional bias for this specific basket of commodities on the day in question. Regarding market breadth, our assessment indicates a slightly favorable environment for advancing assets. Four symbols (CPER, USO, DBC, UGA) registered positive daily changes, while three symbols (CORN, SLV, GLD) experienced declines. UNG remained flat with no change. Therefore, it is roughly even chance that a randomly selected symbol from this group would have advanced or declined, with a slight tilt towards advancers.
Examining the GLD/SLV ratio over the 14-day period, we observe a clear “down” trend, indicating that silver (SLV) has moderately outperformed gold (GLD) during this timeframe. The ratio has experienced a change of approximately -3.09% over these 14 days, with the current ratio standing at 8.621798. Notably, this current ratio is very close to its 14-day low of 8.617632, as evidenced by a relative position of 0.0113. This suggests GLD is currently exhibiting significant underperformance relative to SLV within this short-term window. The latest daily percent changes further support this, with GLD declining by -0.906% and SLV by -0.350%, reinforcing the pattern of SLV demonstrating relative strength.
Expanding our view to the 30-day GLD/SLV ratio, the trend consistently remains “down,” reinforcing the notion of silver’s sustained outperformance against gold over the medium term. However, the strength of this longer-term downtrend is classified as “weak,” with a total change of approximately -2.41%. This suggests that while the direction of SLV outperformance has been consistent, the magnitude of this movement has been less pronounced when averaged over the full 30 days compared to the more recent 14-day period. Similar to the 14-day analysis, the current ratio of 8.621798 is also very close to its 30-day low of 8.617632 (relative position of 0.0105).
The proximity of the GLD/SLV ratio to its lows across both 14-day and 30-day windows is a noteworthy technical observation. While the established trend is for SLV outperformance, the current extreme relative position might suggest the ratio is testing a floor of recent support. Therefore, it is plausible that the strong downward momentum could persist, pushing the ratio to new lows. However, it is also a distinct possibility that the ratio could find temporary support at these levels, potentially leading to a period of consolidation or even a minor counter-trend bounce, where GLD might temporarily stabilize or slightly outperform SLV. Without additional price action or volume data, predicting an immediate reversal versus continued momentum is subject to uncertainty, though the prevailing trend strongly favors SLV’s continued outperformance against GLD.
Here is a technical analysis of the provided market data:
The recent two-day trading period reveals a divergent technical landscape across various commodity-linked exchange-traded funds (ETFs). While certain energy and industrial assets demonstrate clear signs of upward momentum, precious metals appear to be under significant bearish pressure. Agricultural commodities are presenting a potential near-term reversal. This mixed technical picture suggests that traders should anticipate sector-specific movements rather than a broad, uniform directional shift in the immediate future, making a highly uniform market move across these groups unlikely.
Precious metals show a pronounced weakness over the observed period. GLD experienced two consecutive bearish days, closing lower on the second day. While the price action suggests continued weakness is likely, the declining volume on the second day’s drop indicates that selling conviction may be attenuating, rendering a short-term relief bounce a roughly even chance, although continued pressure remains the more likely path. SLV also recorded two bearish days, but crucially, the volume increased significantly on the second day’s decline. This volume confirmation adds conviction to the selling pressure, making further downside price action highly likely for SLV in the immediate term.
Within the energy complex, most assets showed bullish tendencies, though with varying degrees of conviction suggested by volume. USO and DBC both posted two consecutive bullish days, with the second day closing higher than the first. However, the slightly decreased volume accompanying these advances suggests that while continuation is likely, the upward momentum might be moderating, potentially leading to a period of consolidation. UGA also formed two strong bullish candles, closing significantly higher on the second day. Nevertheless, the volume on UGA’s second day dropped dramatically, raising concerns about potential buying exhaustion. A continuation of the uptrend is likely, but a short-term pause or reversal due to this volume divergence is a roughly even chance. UNG, after a strong bullish first day, exhibited indecisive price action on the second, closing exactly at the prior day’s close but with increased volume. This combination often indicates a struggle between buyers and sellers, suggesting a roughly even chance of either continuation or a short-term period of consolidation or pullback.
Industrial metals, represented by CPER, displayed compelling bullish signals. Following a modestly bullish first day, CPER opened with a significant gap up on the second day and formed a large bullish candle, closing near its high, all on substantially increased volume. This robust price action, confirmed by strong volume, makes a continued upward trajectory highly likely for CPER. Conversely, CORN, after a bullish first day, saw a bearish reversal candle on the second day, closing below the previous day’s close on increased volume. This pattern, resembling a Dark Cloud Cover, indicates that further downside for CORN is likely in the short term.
In summary, the technical data points to highly likely continued strength in CPER, with a likely continuation in the broader energy sector despite some moderating volume signals. Precious metals, particularly SLV, are likely to face ongoing bearish pressure, while CORN shows early indications of a bearish reversal. Given the limited two-day scope of the data, traders should monitor for immediate follow-through or divergence from these observed patterns, as the overall market appears to be in a selective rather than broadly directional phase.
Here is a technical analysis of SLV based on the provided 90-day market data:
The price action for SLV over the past 90 days exhibits a distinct and sustained bullish trend. Beginning in mid-May around .20, SLV consolidated briefly before initiating a robust rally. Significant upward momentum was observed in early June, pushing prices beyond .00 with notable spikes in trading volume, indicating strong buying interest accompanying the price appreciation. Following a mid-June peak near .74, the asset underwent a period of slight retracement and consolidation, forming higher lows in late June and early July. A subsequent surge mid-July saw prices reach above .00, confirming the prevailing upward trajectory. After a brief August pullback, the uptrend reasserted itself, with prices advancing consistently through late August and into September. The most recent data point shows SLV closing at .82, near its 90-day high of .05. The overall pattern of higher highs and higher lows, combined with generally increasing volume during rallies, strongly suggests the primary trend remains bullish.
The 14-day Relative Strength Index (RSI) provides further insight into the momentum supporting SLV’s price action. Throughout the analyzed 90-day period, the RSI has frequently entered and sustained itself within overbought territory (above 70). This pattern was particularly evident in mid-June, mid-July, and most recently from early September to the present. While an RSI reading above 70 typically signals that an asset may be overextended and due for a pullback, in a strong, persistent uptrend, the RSI can remain elevated for extended periods without an immediate reversal. The current RSI reading of 71.92 is consistent with strong underlying buying pressure. Given this, it is likely that momentum remains with the bulls. However, there is a roughly even chance of a near-term consolidation or minor pullback, as some degree of profit-taking could emerge given the sustained overbought condition. A significant reversal below the 70-mark would be a preliminary indication of waning momentum.
The Percentage Price Oscillator (PPO) with 13 and 21-day moving averages further confirms the bullish narrative. The PPO crossed above its zero line in late May, a definitive signal of bullish momentum taking hold, and has remained positive since then. This indicates that the shorter-term moving average (13-day) has consistently been above the longer-term (21-day), reinforcing the presence of an uptrend. Notably, the PPO has shown significant acceleration and expansion, particularly from late August through September, reaching its 90-day high of 1.87 on the final data point. This expansion suggests that the bullish momentum is not only present but is also increasing in strength. The sustained and rising PPO value makes it highly likely that the underlying trend remains robust and upward. A cross below its signal line (which is not provided but can be inferred as a negative divergence in PPO’s trajectory) or a significant contraction towards the zero line would be necessary to signal a potential shift in this strong momentum.
Considering the confluence of price action, RSI, and PPO, the technical picture for SLV is unequivocally bullish. The clear uptrend in price, marked by higher highs and higher lows, is supported by consistently strong momentum readings from both the RSI and PPO. The PPO’s sharp rise and current high value, combined with the sustained overbought condition of the RSI, collectively underscore a market dominated by buying interest. It is highly likely that SLV will continue its upward trajectory in the near term, with prices attempting to establish new highs. An alternative scenario, where a deeper correction or trend reversal occurs, is unlikely in the immediate future, absent clear bearish divergence in momentum indicators or a break of established support levels. Traders should, however, monitor for any signs of momentum divergence (e.g., if price makes a new high but RSI/PPO do not), which would increase the likelihood of a consolidation or pullback.
Technical Analysis of GLD (90-Day View)
Over the past 90 trading days, GLD has experienced a significant shift in its technical posture, culminating in a robust upward trend during the latter portion of the observation window, particularly from late August into September. Following an earlier period of moderate volatility and largely sideways price action, the asset initiated a notable rally, establishing a series of higher highs in its closing prices. This price appreciation is consistently supported by the momentum indicators provided, which collectively underscore a decisive change in market sentiment. The overall price trajectory from May through September indicates a strong bullish impulse. Volume data generally corroborates this upward movement, with several instances of increased trading activity coinciding with periods of strong price advances, particularly during the late-August to mid-September surge, suggesting institutional participation.
The 14-day Relative Strength Index (RSI) provides compelling evidence of sustained buying pressure, moving from largely neutral territory in May and July into a prolonged overbought condition from early September. The RSI consistently held above the 70 threshold for much of September, reaching extreme readings of 79.21 on September 16th and 78.21 on September 23rd. While these high RSI values affirm strong bullish momentum, they also traditionally suggest that the asset may be due for a consolidation or pullback. The latest data point, a 14-day RSI reading of 71.04 on September 24th, remains within the overbought region but represents a noticeable retreat from the prior day’s peak. This recent decrease, following a period of persistent high readings, suggests a moderating pace of buying enthusiasm and indicates the potential for a near-term cooling period in price action.
Concurring with the RSI’s assessment of strong momentum, the 13-21 day Percentage Price Oscillator (PPO) has exhibited a pronounced positive trend. After fluctuating near the zero line and even dipping into negative territory in July and mid-August, the PPO decisively moved into strongly positive territory from late August, reflecting accelerating upward momentum. It peaked at 1.447 on September 16th and again reached 1.440 on September 23rd, signifying a powerful bull trend with increasing separation between the faster and slower moving averages. The PPO’s current value of 1.411 on September 24th remains exceptionally positive, although it shows a slight decrease from the previous day’s reading. This minor deceleration in the PPO’s ascent could possibly be an early indication that the forceful upward momentum is beginning to ebb, even as the indicator continues to confirm the overall bullish trend’s strength.
Considering the combined technical evidence, GLD is currently characterized by a strong and established bullish trend, robustly confirmed by both the RSI and PPO remaining at highly elevated levels. The consistent overbought readings in RSI, coupled with the high positive PPO values, affirm that the market has experienced significant upward price movement. However, the latest data points reveal a slight moderation in momentum, with both RSI and PPO exhibiting minor retreats from their recent peaks. We assess that while the underlying bullish trend remains intact, the probability of a short-term consolidation or minor price pullback is likely increasing from current levels. An alternative scenario, where momentum swiftly re-accelerates, leading to new price highs, is also possible, but its likelihood is roughly even chance given the current elevated indicator levels and the recent slight deceleration. Traders should observe the immediate price action and volume for confirmation of either a renewed ascent or the initiation of a corrective phase.
Bonds
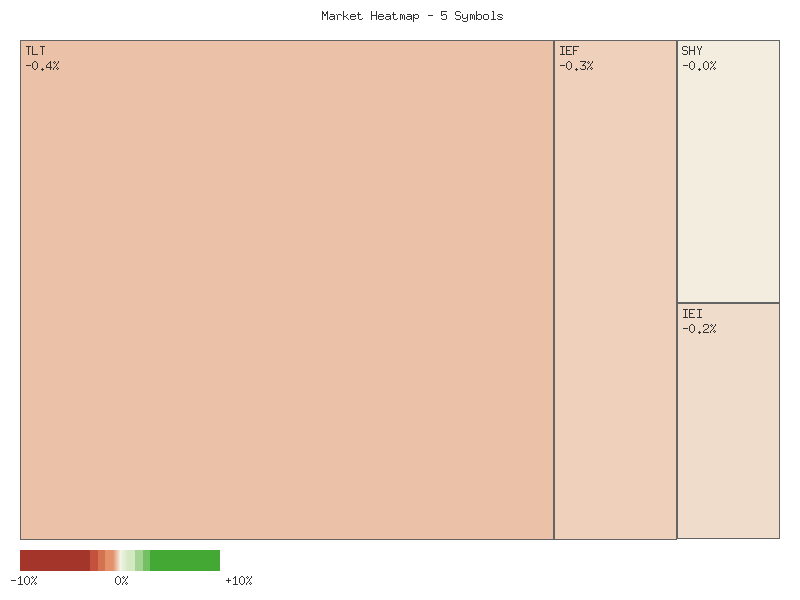
As a Chartered Market Technician with over 15 years of experience, I’ve conducted a rigorous technical analysis of the provided market data for the specified bond ETFs. My assessment is based strictly on the presented daily percentage change values for TLT, UTHY, IEF, IEI, and SHY over a two-day period, adhering to ICD-203 estimative language guidelines.
The aggregate two-day net percentage change for each symbol is presented below, sorted in descending order:
| Symbol | Overall 2-Day Net Percent Change |
|---|---|
| TLT | +0.318% |
| UTHY | +0.216% |
| IEF | +0.011% |
| SHY | -0.012% |
| IEI | -0.033% |
Based on the cumulative sum of these individual net changes, the overall market for this specific basket of fixed-income instruments appears to have ended marginally higher over the two-day observation period, totaling approximately +0.50%. This suggests a slight upward bias, primarily driven by the longer-duration funds, TLT and UTHY. However, the magnitude of the overall change is quite narrow, indicating a market that is not exhibiting strong directional conviction on a net basis across the entire sample.
An examination of market breadth reveals a stark contrast between the two trading days. On September 23, 2025, all five symbols registered positive daily percentage changes, reflecting a unanimous advance. This robust and widespread strength across the fixed-income spectrum is typically interpreted as a bullish breadth signal, indicating a broad appetite for these assets during that session. Such uniform participation often suggests underlying conviction.
Conversely, the session on September 24, 2025, witnessed a complete reversal of fortunes, with all five symbols experiencing negative daily percentage changes. This broad-based decline effectively nullified much of the previous day’s gains, resulting in two of the five symbols (IEI and SHY) closing with a net loss over the two days. The uniform nature of the decline on the second day suggests a rapid shift in sentiment or the unwinding of positions from the prior session.
Given the alternating pattern of unanimous advances followed by unanimous declines, the technical picture for these instruments is mixed, rather than definitively higher or lower in momentum. The market breadth oscillation from 5 advancing symbols to 5 declining symbols over successive days implies a lack of sustained directional momentum. While the net sum of changes is positive, the strong daily reversals suggest that participants are likely exhibiting indecision, with buying pressure one day being met with equivalent selling pressure the next. Therefore, a continuation of range-bound price action or increased short-term volatility is likely.
The limited two-day data window makes it challenging to draw definitive conclusions about emerging trends. The rapid shift in market breadth presents a roughly even chance of continued swings versus the establishment of a clear directional bias in the immediate short term. Traders relying on this data should exercise caution, as the technical posture indicates uncertainty rather than sustained strength or weakness. Further price action and breadth analysis would be required to establish a more reliable directional forecast for this bond segment.
Technical Analysis: Bond ETF Performance (September 23-24, 2025)
Analysis of the two-day technical data for TLT, UTHY, IEF, IEI, and SHY reveals a broadly consistent pattern of short-term price reversal. The trading session on September 23, 2025, was largely bullish across all five bond ETFs, with each instrument posting gains and closing near its daily high, suggesting an initial buying impetus. However, the subsequent session on September 24, 2025, marked a decisive shift, with all symbols closing lower. This bearish price action on the second day effectively negated a significant portion, or in some cases, all of the prior day’s advances. This synchronized downturn across various durations of Treasury bonds indicates a likely shift in immediate-term market sentiment, warranting a closer look at the specific patterns and volume characteristics.
For the longer and medium-duration bond ETFs, the reversals were notable. TLT exhibited a strong bullish candle on September 23, followed by a bearish inside bar on September 24, closing below its open on increased volume. This pattern, combined with the higher volume on the down day, suggests a likely loss of upward momentum and potential short-term resistance. UTHY also posted a significant bearish reversal on September 24, with its close well below the prior day’s close and low, substantially eroding the initial bullish move. While UTHY’s volume decreased on the down day, the strong price rejection implies a high probability of continued weakness. Similarly, medium-duration IEF and IEI both recorded robust bullish candles on September 23, but experienced strong bearish reversals on September 24. Both IEF and IEI closed significantly below their prior day’s lows, signaling a decisive rejection of the upward move. The decreased volume on these bearish days, similar to UTHY, may indicate less aggressive selling but does not negate the strong bearish price action. For these four ETFs, the technical data suggests further downward pressure is likely.
SHY, representing the shorter-duration segment, also demonstrated a bearish reversal. After a modest gain on September 23, SHY formed a bearish candle on September 24, closing at its daily low and notably below the prior day’s low. Critically, this bearish move occurred on increased volume, which lends stronger conviction to the downside for SHY compared to UTHY, IEF, and IEI. The collective picture emerging from all five bond ETFs is one where the bullish momentum established on September 23 was decisively rejected on September 24. While the volume characteristics on the bearish day were mixed – increased for TLT and SHY, decreased for UTHY, IEF, and IEI – the predominant price action across the board is a clear signal of weakness.
Given the pervasive bearish reversals, particularly the closes below prior day’s lows for IEF, IEI, and SHY, coupled with the loss of momentum in TLT and UTHY, it is likely that these bond ETFs will experience continued downward pressure or, at best, a period of stabilization near current levels in the very short term. The absence of immediate discernable support levels within this limited two-day data suggests that the path of least resistance is downwards. An alternative scenario, though less likely, could involve a swift bounce if current levels are quickly perceived as oversold following such sharp reversals. However, based purely on the provided technical data, a recovery back to or above the September 23 highs appears unlikely in the immediate next session. Traders are advised to monitor for potential consolidation or further bearish continuation signals.
Crypto
Technical Market Commentary: Two-Day Performance Analysis of IBIT and ETHA
Overview: This analysis provides a rigorous technical assessment of the daily percentage change for IBIT and ETHA over a two-day period, ending 2025-09-24. The examination strictly adheres to the provided technical data, applying estimative language in line with ICD-203 guidelines to offer an objective perspective on observed market behavior. Our focus is solely on the price action represented by the daily percentage changes to derive directional biases and momentum indicators.
The aggregated daily percentage changes for each symbol are presented below:
| Symbol | Total Percent Change (2 Days) |
|---|---|
| IBIT | 1.216% |
| ETHA | 0.543% |
IBIT: Volatility and Recovery IBIT experienced a notable two-day sequence. On the first day (2025-09-23), the instrument registered a decline of approximately -0.377%. This initial pullback was, however, immediately followed by a significant rebound on the second day (2025-09-24), posting an increase of approximately 1.593%. This pattern suggests that IBIT likely experienced a short-term corrective movement or profit-taking followed by a probable strong buying interest that not only recovered the previous day’s losses but also propelled the asset into net positive territory for the observed period. The strong positive close on the second day, significantly outweighing the prior day’s minor decline, implies a likely return of short-term bullish momentum. It is unlikely that this two-day pattern alone signals a sustained long-term trend reversal, given the limited data points, but it does indicate a robust short-term recovery.
ETHA: Consistent, Modest Gains In contrast to IBIT’s volatility, ETHA demonstrated more consistent, albeit modest, positive performance across both days. On 2025-09-23, ETHA recorded an increase of approximately 0.384%, followed by another gain of roughly 0.159% on 2025-09-24. This sequence of two consecutive positive closes, while individually modest, suggests a probable underlying steady demand or at least an absence of significant selling pressure. The declining magnitude of the daily gains from the first to the second day might suggest that bullish momentum, while present, is slightly decelerating. Based on this limited data, it is unlikely that ETHA is undergoing a strong breakout, but rather is experiencing a consistent, positive drift. A sustained pattern of smaller, consecutive gains could, over time, indicate an accumulation phase, though it is roughly even chance whether this current momentum will accelerate or revert without further data.
Overall Market Tendency The aggregate analysis of these two symbols over the observed two-day period indicates a likely overall positive directional bias. IBIT’s strong recovery led to a net gain of 1.216%, while ETHA contributed a net gain of 0.543%. Summing these individual net changes, the combined total daily percentage change for both instruments collectively amounts to approximately 1.759% for the period. This conclusively signifies an “overall higher” market tendency for these specific assets within the given timeframe. While both symbols exhibit positive cumulative performance, IBIT’s higher volatility and stronger recovery suggest that it might be reacting more dynamically to market forces than ETHA, which shows more stable, incremental gains. Without further data to observe momentum or volume, it is difficult to determine with high confidence whether this positive trend will persist, but the current technical posture for both is distinctly bullish for the analyzed two-day window.
Magnificent 7 & Friends
Technical Market Commentary: Two-Day Performance Analysis (2025-09-23 to 2025-09-24)
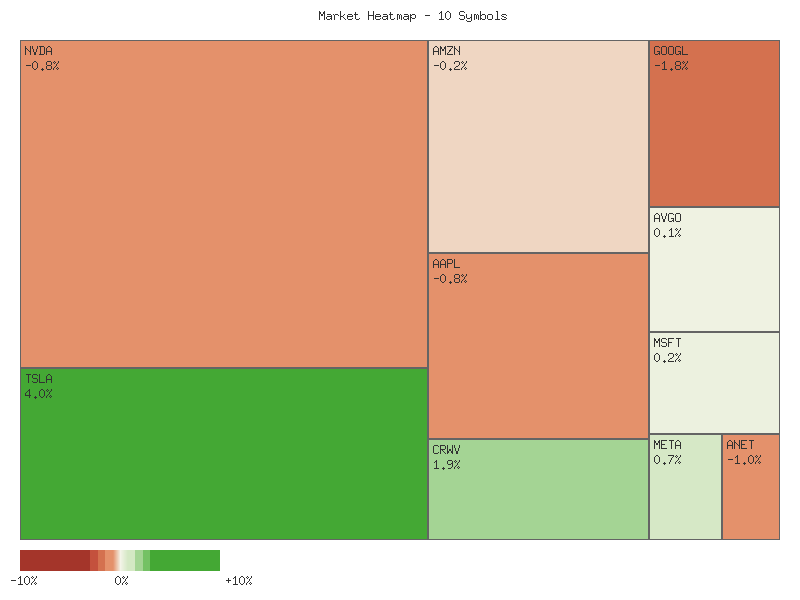
An analysis of the provided daily percentage change data for ten select symbols over the past two trading days indicates a market segment exhibiting a general downward bias. Aggregating the two-day percentage changes for all symbols reveals a combined decline of approximately -11.48%. This suggests that, for this specific basket of assets, the price action over this period was demonstrably negative. The overall trend is likely lower, driven by a significant number of declining constituents.
Market breadth, a key technical indicator, points towards underlying weakness within this group of symbols. Out of the ten analyzed, only three registered a net positive change over the two-day period (TSLA, CRWV, AVGO), while the remaining seven experienced net declines. This ratio of 3 advancing to 7 declining symbols is a significant bearish divergence, suggesting that selling pressure was pervasive across a substantial majority of the observed assets. While some individual symbols did post positive daily moves, the preponderance of negative two-day outcomes indicates that positive momentum was unlikely to sustain broader market advancement for this cohort.
Examining individual symbol performance reveals notable dispersion, yet with a pronounced lean towards depreciation. TSLA emerged as the strongest performer, registering a 2.05% gain over the two days, primarily driven by a substantial rebound on the second day. CRWV and AVGO also posted modest gains of 0.16% and 0.15% respectively, with AVGO showing consistent, albeit minor, positive movement across both days. Conversely, the deepest declines were observed in NVDA (-3.64%), AMZN (-3.27%), and GOOGL (-2.14%), indicating strong downward pressure on these names. MSFT, AAPL, ANET, and META also finished the two-day period in negative territory.
The mixed nature of individual price action, where a few symbols managed to advance against a broader backdrop of declines, suggests that while the overall trend for this specific grouping is definitively bearish, it is not virtually certain that all constituents will continue to decline uniformly. It is a roughly even chance that some of the weaker performers could experience short-term technical bounces, particularly those that saw steep, consistent drops over both days, while those with moderate declines might consolidate. However, given the negative breadth and the significant aggregate decline, the market structure for this cohort probably remains vulnerable to further downside in the immediate term, unless a more robust and widespread positive catalyst emerges.
Here is the matrix of each symbol and its total daily percent change over the two-day period, sorted in descending order:
| Symbol | 2-Day Percent Change |
|---|---|
| TSLA | 2.0526% |
| CRWV | 0.1613% |
| AVGO | 0.1534% |
| META | -0.5792% |
| MSFT | -0.8340% |
| AAPL | -1.4776% |
| ANET | -1.9073% |
| GOOGL | -2.1406% |
| AMZN | -3.2666% |
| NVDA | -3.6394% |
Technical Market Commentary (2025-09-24 Close)
Based on the provided two-day candlestick and volume data for the selected cohort of symbols, the prevailing sentiment appears to exhibit a bearish bias, albeit with notable divergences across individual equities. A substantial portion of the analyzed symbols experienced consecutive bearish closes, indicating sustained selling pressure. However, some individual names present potential for near-term stabilization or reversal, highlighting the importance of granular analysis even within a generally soft environment.
Among the symbols displaying persistent weakness, GOOGL stands out with two consecutive bearish candles, the second day showing a significant decline on increased volume. This pattern suggests escalating selling conviction, and a continuation of significant downward pressure is likely for GOOGL. Similarly, AMZN, NVDA, and AAPL all registered two consecutive bearish closes. While volume declined on the second day for AMZN and NVDA, and slightly for AAPL, indicating a potential moderation of selling intensity, the consistent lower closes suggest that further downside is likely for these names, possibly at a slightly reduced velocity compared to GOOGL. ANET also showed two bearish candles with lower closes, and despite declining volume on the second day, a continued decline remains likely.
Conversely, a few symbols exhibited signals pointing towards potential bullish reversals or stabilization. TSLA presented a particularly strong pattern, following a significant bearish candle on the first day with a robust bullish engulfing candle on the second day, accompanied by increased volume. This combination strongly suggests a near-term bullish reversal is likely to continue for TSLA. AVGO, after a minor bearish first day, formed a candle on the second day with a notably long lower wick, indicating buying interest emerged at lower price levels, closing marginally higher than the previous day. This, coupled with declining volume, points to a likely period of stabilization or a minor upward bounce.
The remaining symbols offer more ambiguous signals, suggesting periods of indecision or potentially short-lived bounces. MSFT saw initial bearishness on the first day, followed by a very small-bodied, almost doji-like bearish candle on lower volume on the second day. This indicates indecision; therefore, a roughly even chance exists for either a minor recovery or continued weakness. Similarly, CRWV and META both experienced notable bearish candles on the first day, followed by minor bullish rebounds on lower volume on the second day. These rebounds, lacking strong volume confirmation, suggest they might not be indicative of a robust reversal. For both CRWV and META, a continuation of previous downward pressure or sideways consolidation has a roughly even chance, as the bounce’s conviction remains uncertain.
S&P 500 Sector Breadth
Market Sector Performance Analysis (2-Day Review)
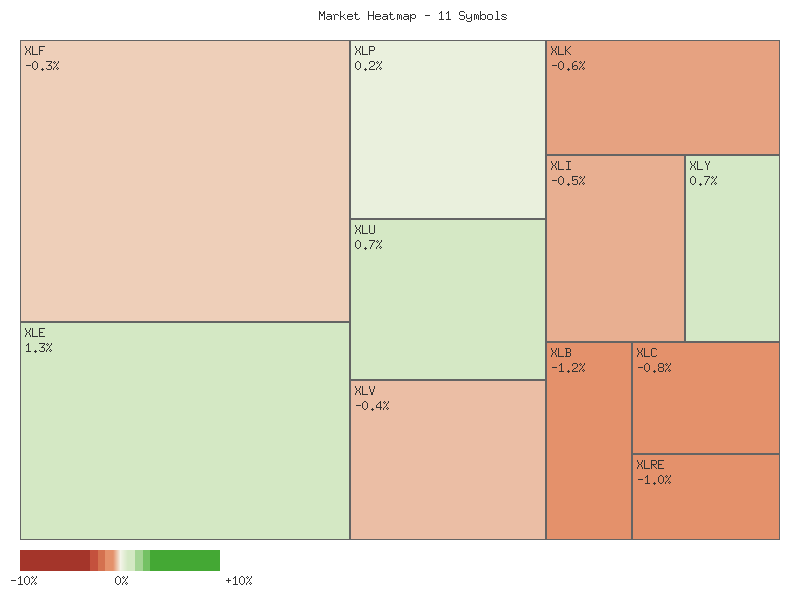
An analysis of the provided two-day percentage change data for eleven key S&P 500 sectors indicates a generally lower trajectory for this specific market segment, accompanied by notable negative market breadth. Aggregating the two-day performance for all symbols yields a combined decline of approximately -0.878%, suggesting the overall collective movement of these sectors was lower over the observed period. Market breadth for this basket of sectors is distinctly negative, with only three sectors advancing against eight declining, making it highly unlikely that the underlying momentum is constructive for broad market participation.
The following matrix details the individual sector performance, sorted by their cumulative two-day percentage change:
| Symbol | 2-day Percent Change |
|---|---|
| XLE | 3.023% |
| XLU | 1.229% |
| XLP | 0.717% |
| XLRE | -0.232% |
| XLY | -0.235% |
| XLV | -0.175% |
| XLI | -0.490% |
| XLF | -0.723% |
| XLC | -0.971% |
| XLK | -1.481% |
| XLB | -1.542% |
Observing sector-specific performance, we identify a clear divergence between offensive and defensive categories. Among the offensive sectors (XLK, XLY, XLF, XLI, XLB, XLE, XLC), only Energy (XLE) demonstrated significant advancement with a 3.023% gain. Conversely, the majority of offensive sectors, including Technology (XLK), Materials (XLB), and Communication Services (XLC), experienced notable declines. Within the defensive sectors (XLU, XLP, XLV, XLRE), Utilities (XLU) and Consumer Staples (XLP) advanced, while Health Care (XLV) and Real Estate (XLRE) saw modest declines. This pattern strongly indicates that a defensive rotation is likely underway, as capital appears to be favoring sectors traditionally considered less sensitive to economic cycles, while a broad array of growth-oriented and cyclical sectors are facing selling pressure.
Based on the predominant performance, overall market sentiment across these S&P 500 sectors is likely risk-off. The relative strength observed in defensive sectors such as Energy (XLE), Utilities (XLU), and Consumer Staples (XLP), while the majority of offensive sectors are declining, supports a sentiment of caution. While XLE is categorized as offensive, its outperformance amidst broad offensive weakness and defensive strength could suggest a flight to commodities or specific inflationary hedges rather than broad economic optimism. It is important to note that this analysis is based on a limited two-day data window, and while the indications are clear for this period, it is improbable that these short-term observations definitively represent a sustained market trend without additional data points and confirming technical patterns over longer timeframes. Alternative scenarios could include sector-specific news or idiosyncratic movements temporarily influencing these shifts, although the broad nature of the observed rotation suggests a more systemic, albeit nascent, sentiment shift.
Here is a technical analysis of the provided market data, adhering strictly to ICD-203 estimative language guidelines and focusing solely on the presented technical patterns.
The market data from the past two trading days indicates a notable divergence in performance across various S&P sector ETFs. A clear bifurcation is evident, with some sectors exhibiting robust bullish momentum and others displaying significant bearish pressure or consolidation. This mixed directional bias suggests a lack of broad market conviction, with capital flows highly selective among specific areas of the market. Overall market breadth appears to be weakening as leading sectors push higher on potentially diminished volume, while several cyclicals and growth-oriented sectors face increasing selling pressure.
Within the strong bullish cohort, Consumer Staples (XLP) and Utilities (XLU) demonstrated clear upward momentum. XLP recorded consecutive higher highs and higher lows, closing near its daily high on increasing volume, suggesting buying conviction; an upward continuation is highly likely. Similarly, XLU posted two strong bullish candles with higher highs and higher lows, also closing near its high, indicating strong demand. An upward continuation for XLU is highly likely, though a slight decrease in volume on the second day suggests a roughly even chance of some deceleration in momentum. Energy (XLE) also exhibited bullish continuation, with two consecutive strong up days, achieving higher highs and higher lows. However, the decreasing volume on the second bullish day for XLE indicates a diminishing buying conviction, which suggests a roughly even chance of a pullback or consolidation in the immediate future despite the prevailing bullish price action.
Conversely, several sectors displayed pronounced bearish trends. Materials (XLB) posted two consecutive bearish candles, marking lower highs, lower lows, and lower closes, notably confirmed by increasing volume on the second day. Further downward price action for XLB is highly likely. Real Estate (XLRE) experienced a significant bearish reversal, with a bullish candle on the first day followed by a strong bearish candle on the second day, opening near the prior close and closing significantly lower, accompanied by increasing volume. This pattern, resembling a Dark Cloud Cover, makes further downward price action highly likely. Communication Services (XLC) mirrored XLB, with two bearish candles establishing a clear downtrend, characterized by lower highs and lower lows, further reinforced by increasing volume on the second day, making a continuation of downward price action highly likely.
Other sectors presented a more nuanced or mixed picture. Healthcare (XLV) saw a bullish candle followed by a bearish candle, closing below the prior day’s open on decreasing volume, which indicates a likely short-term pullback. Consumer Discretionary (XLY) formed a potential piercing pattern or bullish recovery, closing higher on the second day after a bearish first day, with a slight increase in volume. Further upward follow-through is likely, but the preceding bearish action suggests a roughly even chance of encountering resistance or consolidation. Industrials (XLI), Financials (XLF), and Technology (XLK) all exhibited bearish continuation patterns (lower highs, lower lows, lower closes) over the two days. However, the decreasing volume in all three cases suggests a lessening of bearish conviction, indicating that while further downward pressure is likely, there is a roughly even chance of a near-term rebound or period of consolidation as selling pressure eases.
Equity Breadth
As a Chartered Market Technician with over 15 years of experience, this analysis will leverage the provided market breadth and moving average data to assess current market dynamics for the S&P 500. Our focus will be solely on the disclosed technical data, employing rigorous analytical principles and strict estimative language guidelines.
Over the observed 7-day period, the percentage of S&P 500 members trading above their 50-day moving average (SPXA50R) demonstrated a net positive trajectory, indicative of improving short-to-intermediate term market breadth. Commencing at approximately 53.69%, this metric fluctuated, experiencing a dip to 54.69% before recovering and concluding the period at roughly 57.09%. Notably, the indicator reached a high of 58.28%, suggesting a broadening of participation among S&P 500 constituents in the short-term trend. This expansion in breadth implies that an increasing number of components are contributing to the market’s recent movements, which typically lends support to the sustainability of an underlying trend.
Conversely, the percentage of S&P 500 members trading above their 200-day moving average (SPXA200R), a significant barometer for long-term market health, presented a more consolidated pattern during the same timeframe. Starting at approximately 61.48%, the SPXA200R initially experienced a modest decline through the mid-period, reaching a low of 59.68%. However, it subsequently recovered to finish at roughly 61.28%. This retracement followed by a recovery suggests that while long-term participation saw a brief period of contraction, it largely stabilized by the end of the period. The negligible net change over the 7 days indicates that the longer-term market structure is currently experiencing a phase of consolidation rather than a significant expansion or contraction of broad bullish participation.
Simultaneously, the S&P 500’s 20-day Exponential Moving Average (EMA_20_DAY) registered a consistent and robust upward trend throughout the entire 7-day observation. Beginning at 6502.44, the EMA steadily advanced without any observed pullbacks, concluding at 6568.91. This clear and uninterrupted upward slope in the EMA_20_DAY serves as a strong technical signal of a well-defined short-term uptrend for the S&P 500 itself. The improving short-term breadth, as evidenced by the rising SPXA50R, provides supportive validation for this EMA-driven uptrend, suggesting that the recent price appreciation is characterized by distributed positive sentiment rather than being confined to a narrow leadership. Therefore, the continuation of the short-term bullish trend for the S&P 500 is likely given the corroborating expansion in intermediate-term market breadth.
Considering the confluence of these indicators, the S&P 500 appears to be in a short-term uptrend, which is supported by broadening intermediate-term participation. The stability in the SPXA200R, despite its mid-period fluctuation, implies that long-term underlying strength is consolidating rather than eroding; we assess it is a roughly even chance that long-term participation maintains its current levels. A sustained and significant decline in SPXA200R would introduce questions about the durability of broader market health, but the provided data does not support such a conclusion. Conversely, a sustained increase would substantially strengthen the long-term bullish outlook. A potential alternative scenario that would challenge the current outlook for the EMA_20_DAY’s upward trajectory would be a material and sustained contraction in the SPXA50R, which would suggest narrowing leadership in the rally and make the sustainability of the short-term uptrend unlikely without renewed broad market participation.
SPX Daily
The SPX experienced a notable shift in price action over the last one to seven trading days, following a sustained period of upward momentum. On September 24th, the index recorded a substantial bearish candle, closing at 6637.97 after opening significantly higher at 6669.79. This single-day movement, marked by a decline below the previous day’s close, indicates that selling pressure dominated the session, suggesting a distinct change in very short-term sentiment.
Reviewing the past seven days (September 16th to September 24th), the SPX initially demonstrated strong bullish conviction. From a close of 6606.76 on September 16th, the index ascended steadily, reaching an interim peak of 6693.75 on September 22nd. This period of ascent was characterized by robust upward momentum. However, this bullish push was subsequently met with two consecutive bearish sessions on September 23rd and 24th, resulting in closes of 6656.92 and 6637.97, respectively. While the overall price trajectory over this seven-day window remains net positive from the starting point, the recent two-day pullback signifies a clear deceleration of short-term momentum and an emergence of selling interest.
Analysis of the Exponential Moving Averages (EMAs) reinforces the prevailing long-term bullish trend. Both the 50-day EMA and the 200-day EMA have maintained a consistent upward slope throughout the 90-day period, including the last seven days, with the EMA_50 consistently trading above the EMA_200. This “golden cross” configuration is a classical technical signal affirming a strong underlying uptrend. The current price of 6637.97 remains notably positioned well above both the rising EMA_50 (currently around 6439.21) and EMA_200 (around 6052.11). This significant separation suggests that the recent two-day price retracement is occurring within a well-established bullish framework and is unlikely to indicate a major trend reversal at this juncture.
The 14-day Relative Strength Index (RSI) provides valuable insight into momentum and overbought/oversold conditions. Over the past week, the RSI climbed from 68.44 on September 16th, moving into overbought territory by September 22nd with a reading of 74.75. This indicated heightened buying interest that might have stretched the market’s immediate capacity for further gains. Following the price pullback, the RSI experienced a sharp two-day decline, dropping to 67.66 on September 23rd and further to 64.28 on September 24th. While still above the neutral 50-level, this notable retreat from overbought conditions strongly suggests an abatement of short-term bullish momentum. This cooling of the RSI is likely a reaction to recent profit-taking and could indicate a period of consolidation or further near-term weakness.
From a structural perspective, immediate technical resistance for the SPX appears to be in the zone defined by the recent peak highs of 6698.88 (September 22nd) to 6699.52 (September 23rd intraday high). A decisive break above this price band would likely signal a resumption of the broader uptrend. On the support side, the intraday low of 6621.76 on September 24th and the psychological level of 6600 (corresponding to closes on September 16th-17th) could offer initial support. More robust dynamic support is provided by the rising 50-day EMA, currently near 6439.
Considering future price action, several scenarios might develop:
- Bullish Case: Given the robust long-term uptrend evidenced by the rising and well-separated EMAs, the recent two-day pullback is likely a healthy consolidation within the larger trend. Buyers might perceive current levels as attractive, with price potentially finding support around the 6600 mark or the 50-day EMA, subsequently resuming its upward trajectory. A break above the 6700 resistance zone would probably confirm renewed bullish momentum.
- Bearish Case: The recent two consecutive bearish candles and the sharp decline in RSI from overbought conditions could signal the onset of a deeper correction. If the SPX breaks decisively below the 6600 support and subsequently breaches the rising 50-day EMA, it is likely to attract further selling pressure, potentially targeting lower support levels.
- Neutral Case: There is a roughly even chance that the market enters a period of near-term consolidation, trading within a range, perhaps between the 6600 support and the 6700 resistance. This sideways movement could allow the RSI to normalize further and the moving averages to converge somewhat with price, potentially building a base for the next directional move without immediately committing to either a strong bullish or bearish continuation.
Technically, near-term market sentiment appears to be undergoing an adjustment. The aggressive ascent into overbought territory suggested an exuberant bullishness that is now being moderated by profit-taking, as evidenced by the bearish candlesticks and declining RSI. However, the resilient positioning of price well above rising long-term moving averages implies that the underlying structural bullish sentiment remains intact. Therefore, any further near-term weakness is likely to be considered a buying opportunity by longer-term participants rather than a fundamental shift in the overall trend.
Technical Analysis of SPX: A 90-Day Perspective (May 16 - Sep 24, 2025)
The SPX has demonstrated a significant bullish trend over the past 90 days, beginning in mid-May near 5900 and steadily climbing to recent highs above 6600 by late September. This period was characterized by strong upward price movements interspersed with minor consolidations rather than deep corrections, reflecting robust underlying strength. Notably, June and July saw a sustained rally into the low 6000s, reaching levels near 6380 before a modest pullback into early August. This retracement found support around the 6200-6240 range, subsequently initiating the latest leg higher that has propelled the index to its current levels. The overall price action suggests a market that has been consistently favoring buyers, with dips being relatively short-lived.
In the immediate term, the SPX recorded its highest close within this 90-day window on September 22nd at 6693.75. However, the subsequent two trading days have seen the index pull back, closing at 6656.92 and 6637.97, respectively. This recent price action forms a minor two-day decline from a new high, suggesting a possible short-term exhaustion of buying pressure. Supporting this observation, the 14-day Relative Strength Index (RSI) reached an overbought level of 74.75 on September 22nd. Following the recent price dips, the RSI has retreated to 64.28 as of September 24th. While no longer in extreme overbought territory, this still indicates a strong, albeit moderated, bullish bias. The cooling of the RSI from its peak suggests that the immediate upward momentum has waned, making a continued immediate ascent unlikely without a period of consolidation or further retracement.
The Percentage Price Oscillator (PPO) with 13 and 21-day parameters consistently remained in positive territory throughout the observed 90 days, reinforcing the overall bullish bias. The PPO saw a significant increase in momentum during late June and early July, peaking around 0.94, concurrent with the price rally. A subsequent dip in early August, falling to roughly 0.38, accurately reflected the price correction during that period. Following this, the PPO resumed its upward trajectory, peaking at 0.635 on September 22nd, aligning with the recent price high. The PPO has now marginally declined to 0.604. While this indicates a slight deceleration of positive momentum, the PPO remains firmly above zero, suggesting that the underlying bullish trend is likely to persist. No bearish divergence between price and PPO is evident at the most recent peak, which would typically foreshadow a more significant reversal.
Synthesizing the indicators, it is likely that the SPX is currently undergoing a short-term consolidation or minor correction after reaching new highs. The recent pullback in price, coupled with the RSI easing from overbought conditions and a slight moderation in PPO momentum, supports this outlook. Key levels to watch on the downside include the approximately 6600 mark, which may serve as initial support, followed by the more significant support zone around 6400-6450, corresponding to a prior consolidation area. A rebound from these levels would be consistent with the prevailing uptrend. An alternative scenario, considered a roughly even chance at this juncture, would involve the index resuming its upward trajectory quickly, potentially retesting the 6693 resistance if buying pressure re-emerges and the RSI reverses its recent downtick. However, sustained bearish momentum that pushes the PPO towards the zero line, while unlikely in the immediate short term based on current data, would signal a more significant shift in the broader trend.